Article

MPPT of Permanent Magnet Synchronous Generator in Tidal Energy Systems Using Support Vector Regression

by
Ahmed G. Abo-Khalil
1,2,* and
Ali S. Alghamdi
1
1
Department of Electrical Engineering, College of Engineering, Majmaah University, Almajmaah 11952, Saudi Arabia
2
Department of Electrical Engineering, College of Engineering, Assuit University, Assuit 71515, Egypt
*
Author to whom correspondence should be addressed.
Sustainability 2021, 13(4), 2223; https://doi.org/10.3390/su13042223
Submission received: 10 December 2020 / Revised: 14 January 2021 / Accepted: 2 February 2021 / Published: 19 February 2021

Abstract

:
In this paper, an improved Maximum Power Point Tracking (MPPT) algorithm for a tidal power generation system using a Support Vector Regression (SVR) is proposed. To perform this MPPT, a tidal current speed sensor is needed to track the maximum power. The use of these sensors has a lack of reliability, requires maintenance, and has a disadvantage in terms of price. Therefore, there is a need for a sensorless MPPT control algorithm that does not require information on tidal current speed and rotation speed that improves these shortcomings. Sensorless MPPT control methods, such as SVR, enables the maximum power to be output by comparing the relationship between the output power and the rotational speed of the generator. The performance of the SVR is influenced by the selection of its parameters which is optimized during the offline training stage. SVR has a strength and better response than the neural network since it ensures the global minimum and avoids being stuck at local minima. This paper proposes a high-efficiency grid-connected tidal current generation system with a permanent magnet synchronous generator back-to-back converter. The proposed algorithm is verified experimentally and the results confirm the excellent control characteristics of the proposed algorithm.

1. Introduction

Tidal power generation has recently been spotlighted as an alternative energy that can solve the problem of energy depletion while minimizing environmental deterioration. Tidal power generation is characterized by predictable power generation and high reliability, different from other renewable energy sources. It is a method of producing electricity by converting the flow energy of the tide into the rotational energy of the turbine. Due to these advantages, research on horizontal axis tidal turbines has been actively conducted. For tidal power, strong tidal current is essential, and a tidal current generator can be installed in an area where a flow rate of 1.0 m/s or higher occurs. The study of 106 potential locations all over the world for the use of currents calculates that around 50 TWh/year could be extracted from marine currents [1].
Tidal power generation has numerous advantages, some of these advantages are explained below [2]:
  • It is a predictable resource as it depends on the tides.
  • It has a slight environmental impact, but much less than other electricity generation systems, both renewable and conventional.
  • A tidal turbine with a current speed of between 2 and 3 m/s can obtain about four times more annual power than an equivalent wind turbine. So the increase in cost of both installation and maintenance of the tidal power system is more than offset by the increase in production.
However, the marine environment is considerably harsher than on land where wind turbines are located. In addition, the problem of corrosion due to being in a marine environment, seawater is a saline solution that corrodes any metal surface if it is not sufficiently protected add another challenge to the use of tidal energy [3,4,5]. Both the nacelle, the tower and the blades must be painted, galvanized and even made of non-metallic materials resistant to corrosion. Metal structures could be built with a thickness greater than necessary to avoid corrosion breakage and should perform such continuous maintenance. Rotors can also be damaged by debris in the sea, hitting the blades and deteriorating them. Another drawback is the marine life that can adhere to the turbines, causing their effectiveness to decrease over time, this could be solved with paints with antifouling effects similar to those used on ship hulls [5,6,7,8].
Most tidal power generators that use permanent magnet synchronous generators (PMSG) capable of generating power in various speed ranges. In order to obtain a fast change and high efficiency for tidal energy systems, electrical control is preferred over mechanical control. The power converter using the power switching device has the advantage of being able to obtain fast response and high efficiency [3], controlled the power converter for tidal power generation through d-axis and q-axis current control in a rotating reference frame, and space vector pulse width modulation (SVPWM) is used as shown in Figure 1.
Despite the positive aspects related to tidal energy systems, it is worth noting that the available power is variable due to the stochastic nature of the tide. This creates the need to control variables associated with energy processing [4]. The maximum mechanical power delivered by the tidal turbine is achieved when there is an optimum relationship between the speed at the tip of the blade and the wind speed, this relationship being known as tip speed ratio [5]. As this relationship also depends on the rotation of the rotor, it would be necessary to establish a rotational speed according to the tidal current speed for a certain optimum value, which can be performed with the control of power at the PMSG output [6]. In most conventional systems only an AC–DC converter is used to control the power provided by the generator. In this control, maximum power point tracking (MPPT) tracking techniques are used. These techniques generally employ sensors to perform speed measurements which guarantee, greatly increasing the cost of the system [7,8].
Several techniques from which are used in wind power generation systems can be used to track the maximum power of tidal energy conversion systems (TECS) [9]. Generally, TECS with PMSG can implement MPPT process with instantaneous torque or speed control reference for different tidal speed conditions, with measuring the instantaneous rotational speed of the PMSG.
In several studies the main maximum-power tracking systems are classified into three basic types [3,4,10,11,12,13,14,15,16]: tip speed ratio (TSR) method, power signal feedback (PSF) method, and perturbation and observation method (P&O).
A control scheme for the MPPT of a TECS is investigated in [14]. The P&O algorithm can be widely used because it does not require the use of a tidal current speed sensor. Although it has a lower cost, the search efficiency of the maximum power point of this type of algorithm has some disadvantages. Among the most critical problems faced in the development of P&O-type MPPT, dimensioning the size of the disturbance step is complex. The determination of this variable is done taking into account the mechanical dynamics of the system, in addition to the precision with which it is desired to find the point of maximum power. Defining the step size is complex as a very large step quickly reaches the point of maximum power, however, it will keep oscillating with great amplitude around it. To reduce this oscillatory error around the maximum point, it is necessary to reduce the step size, which in turn leads to a greater number of iterations in order to reach the maximum point.
In this approach of speed, the perfect control was in aiming the MPPT in the optimum operation region, which is in between the cut in wind speed and the rated value. The controller seeks to obtain the optimal value of the angular rotational speed of the blades for each value of the tidal current speed. The optimal angular velocity, which maximizes the power, is the root of the electric power derivative which is a function of the angular speed of the blades. The PSF control method regulates the power of the tidal turbine to keep it at an optimum value, so that the power coefficient is always at its maximum value.
In TSR method, this controller regulates the speed of the turbine in order to keep it at TSR in its optimum value. This system requires a tidal current speed sensor, contributing to the increase in system complexity and rising costs [3,15,16].
In this paper, A maximum power point tracker using support vector regression algorithm is proposed. The sampling data are used in the offline process to map a relationship between the given turbine power and the rotational speed at different tidal current speed. The obtained relationship is then used online to estimate the maximum power point without measuring the tide speed.

2. Mathematical Model of Tidal Energy System

There are two types of power conversion devices for tidal power generation used recently. The power conversion device using a diode device has the advantage of being inexpensive and simple to configure, but the control range is narrow and the control is limited according to the capacity of the wave power generator. As shown in Figure 1, a back-to-back power converter using an insulated gate bipolar transistor (IGBT) switches is used. The back-to-back power converter consists of a generator-side converter that converts AC power output from a generator into DC power, and a grid-side inverter that converts rectified DC power into AC power to send it to the grid. The power produced by the generator is not a constant voltage or a constant frequency, due to the random nature of the tidal current. That is, since it is difficult to directly send the output of the generator to the system, a power conversion device is used to send a constant voltage and a certain frequency to the system. Each role of the back-to-back converter can be separated. The generator-side converter uses maximum power point tracking (MPPT) control to produce the maximum amount of incoming power, and the grid-side inverter performs power control to reliably send the power produced by the converter to the grid. In other words, among the back-to-back converters, the generator-side converter needs a control method capable of quickly following the reference current value in order to control the variable input energy.
In this section, a tidal turbine modeling based on a continuous vary tidal speed is presented, by simulating both the static and dynamic characteristics as a function of the turbine parameters and continuously varying tidal current speed as follows.

2.1. The Mathematical Model of Tidal Turbine

The horizontal axis tidal current turbine is similar to the wind turbine, and the mechanical output is expressed as follows [17,18,19]:
P b l a d e = 1 2 ρ π R b l a d e 2 υ t i d e 3 C p ( β , λ )
where, ρ is the density of the fluid, Rblade is the radius of the blade, β is the pitch angle, and λ is the tip speed ratio, which is the ratio of the tidal current speed of the blade tip to the rotation speed of the turbine, v t i d e is the tidal current speed, and Cp is the power coefficient.
The general Cp function is the same as Equations (2) and (3) [20]:
C p ( β , λ ) = C 1 ( C 2 λ 1 C 3 β C 4 ) e C 5 λ 1 + C 6 λ
1 λ 1 = 1 λ 0.08 β 0.035 β 3 + 1
C 1 = 0.5176 , C 2 = 116 , C 3 = 0.4 , C 4 = 5 , C 5 = 21 , C 6 = 0.0068
The tip speed ratio is defined as the Equation (4) as the ratio of the blade end velocity to the flow velocity [21]:
λ = ω r     R b l a d e υ t i d e
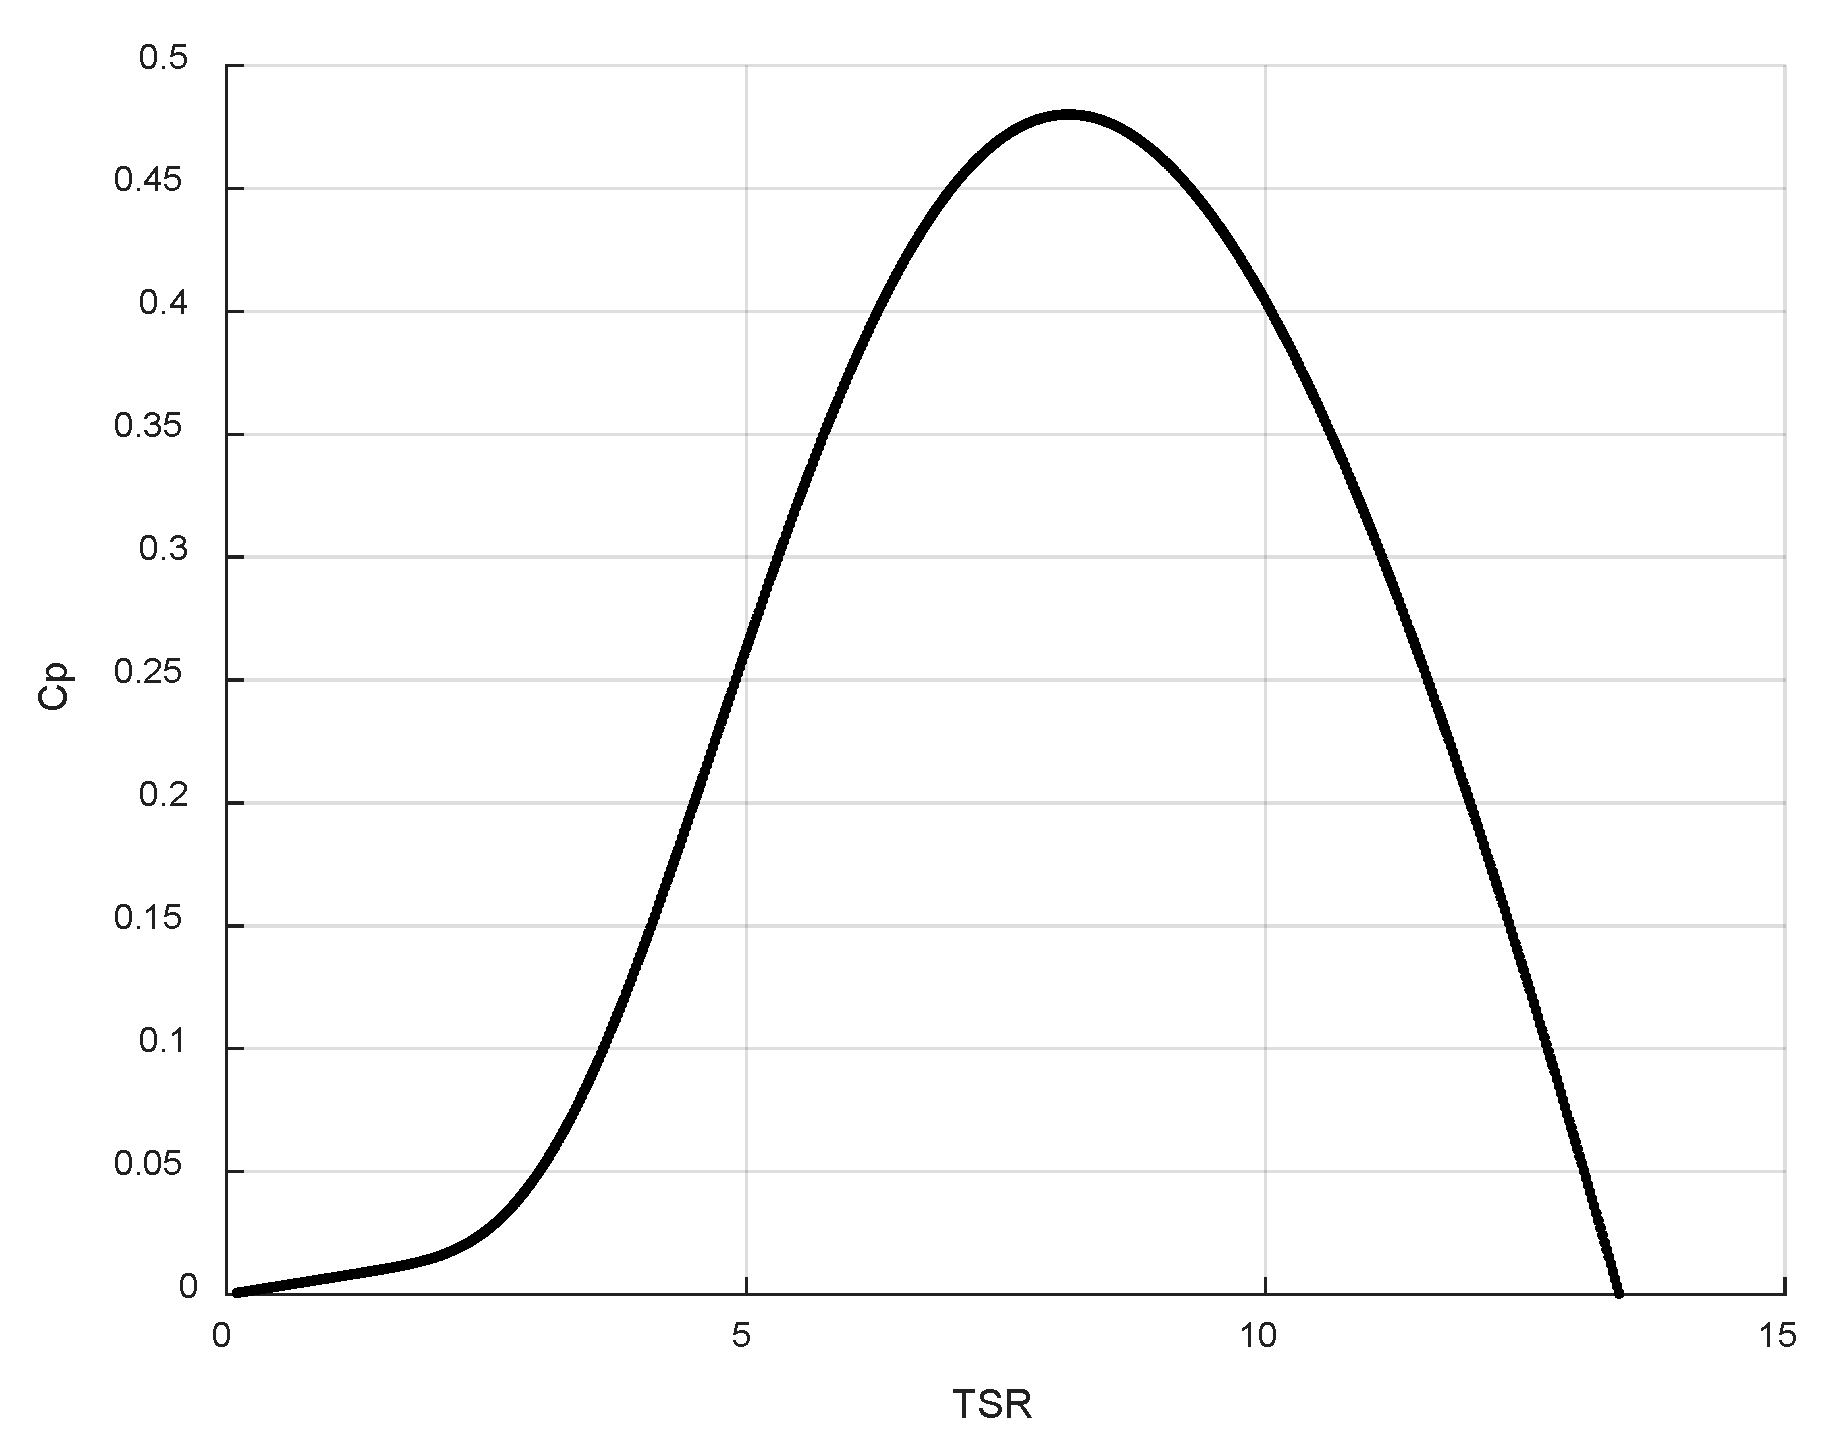
where ω r is the blade rotational speed in rad/s. Since pitch angle control is not considered here so β is set to zero. Figure 2 represents the change of the output coefficient according to the main speed ratio. As can be seen from Figure 2, the output coefficient of the tidal current turbine is determined by the main speed ratio of the optimum value. Using this characteristic, it can be expressed as shown in Equation (5) to generate the maximum output of the tidal current turbine [22,23,24]:
P m a x = 1 2 ρ π R b l a d e 2 υ t i d e 3 C p m a x
As mentioned earlier, the output coefficient of the tidal current turbine is determined by the optimal Tip-Speed Ratio (TSR). In order to generate the maximum power depending on the flow rate, it is necessary to operate at the optimum rotating speed. Figure 3 shows the tidal turbine characteristics at different tidal current speed. In high tidal speed, the turbine power increases and become maximum at certain operating rotational speed.

2.2. PMSG Modeling

The characteristics of permanent magnet type synchronous generator are high efficiency since there is no need for an excitation winding for generating the magnetic flux of the rotor, and a high output density compared to the volume of the generator. The modeling of the PMSG in the synchronous coordinate system can be expressed by Equation (6) [25]:
[ v d s r v q s r ] = [ R s + p L s ω r L s ω r L s R s + p L s ] [ i d s r i q s r ] + [ Ψ f 0 ]  
where Rs, Ls, ω r , and Ψ f mean stator winding resistance, stator: inductance, electric angular velocity, and rotor magnetic flux, p = d/dt, respectively.
The electric torque of the permanent magnet synchronous generator is expressed as Equation (7) [26].
T e = 3 2 n p Ψ f i q s r  
where, n p is the number of poles, and Ψ f is the magnitude of the magnetic flux linking the stator windings.
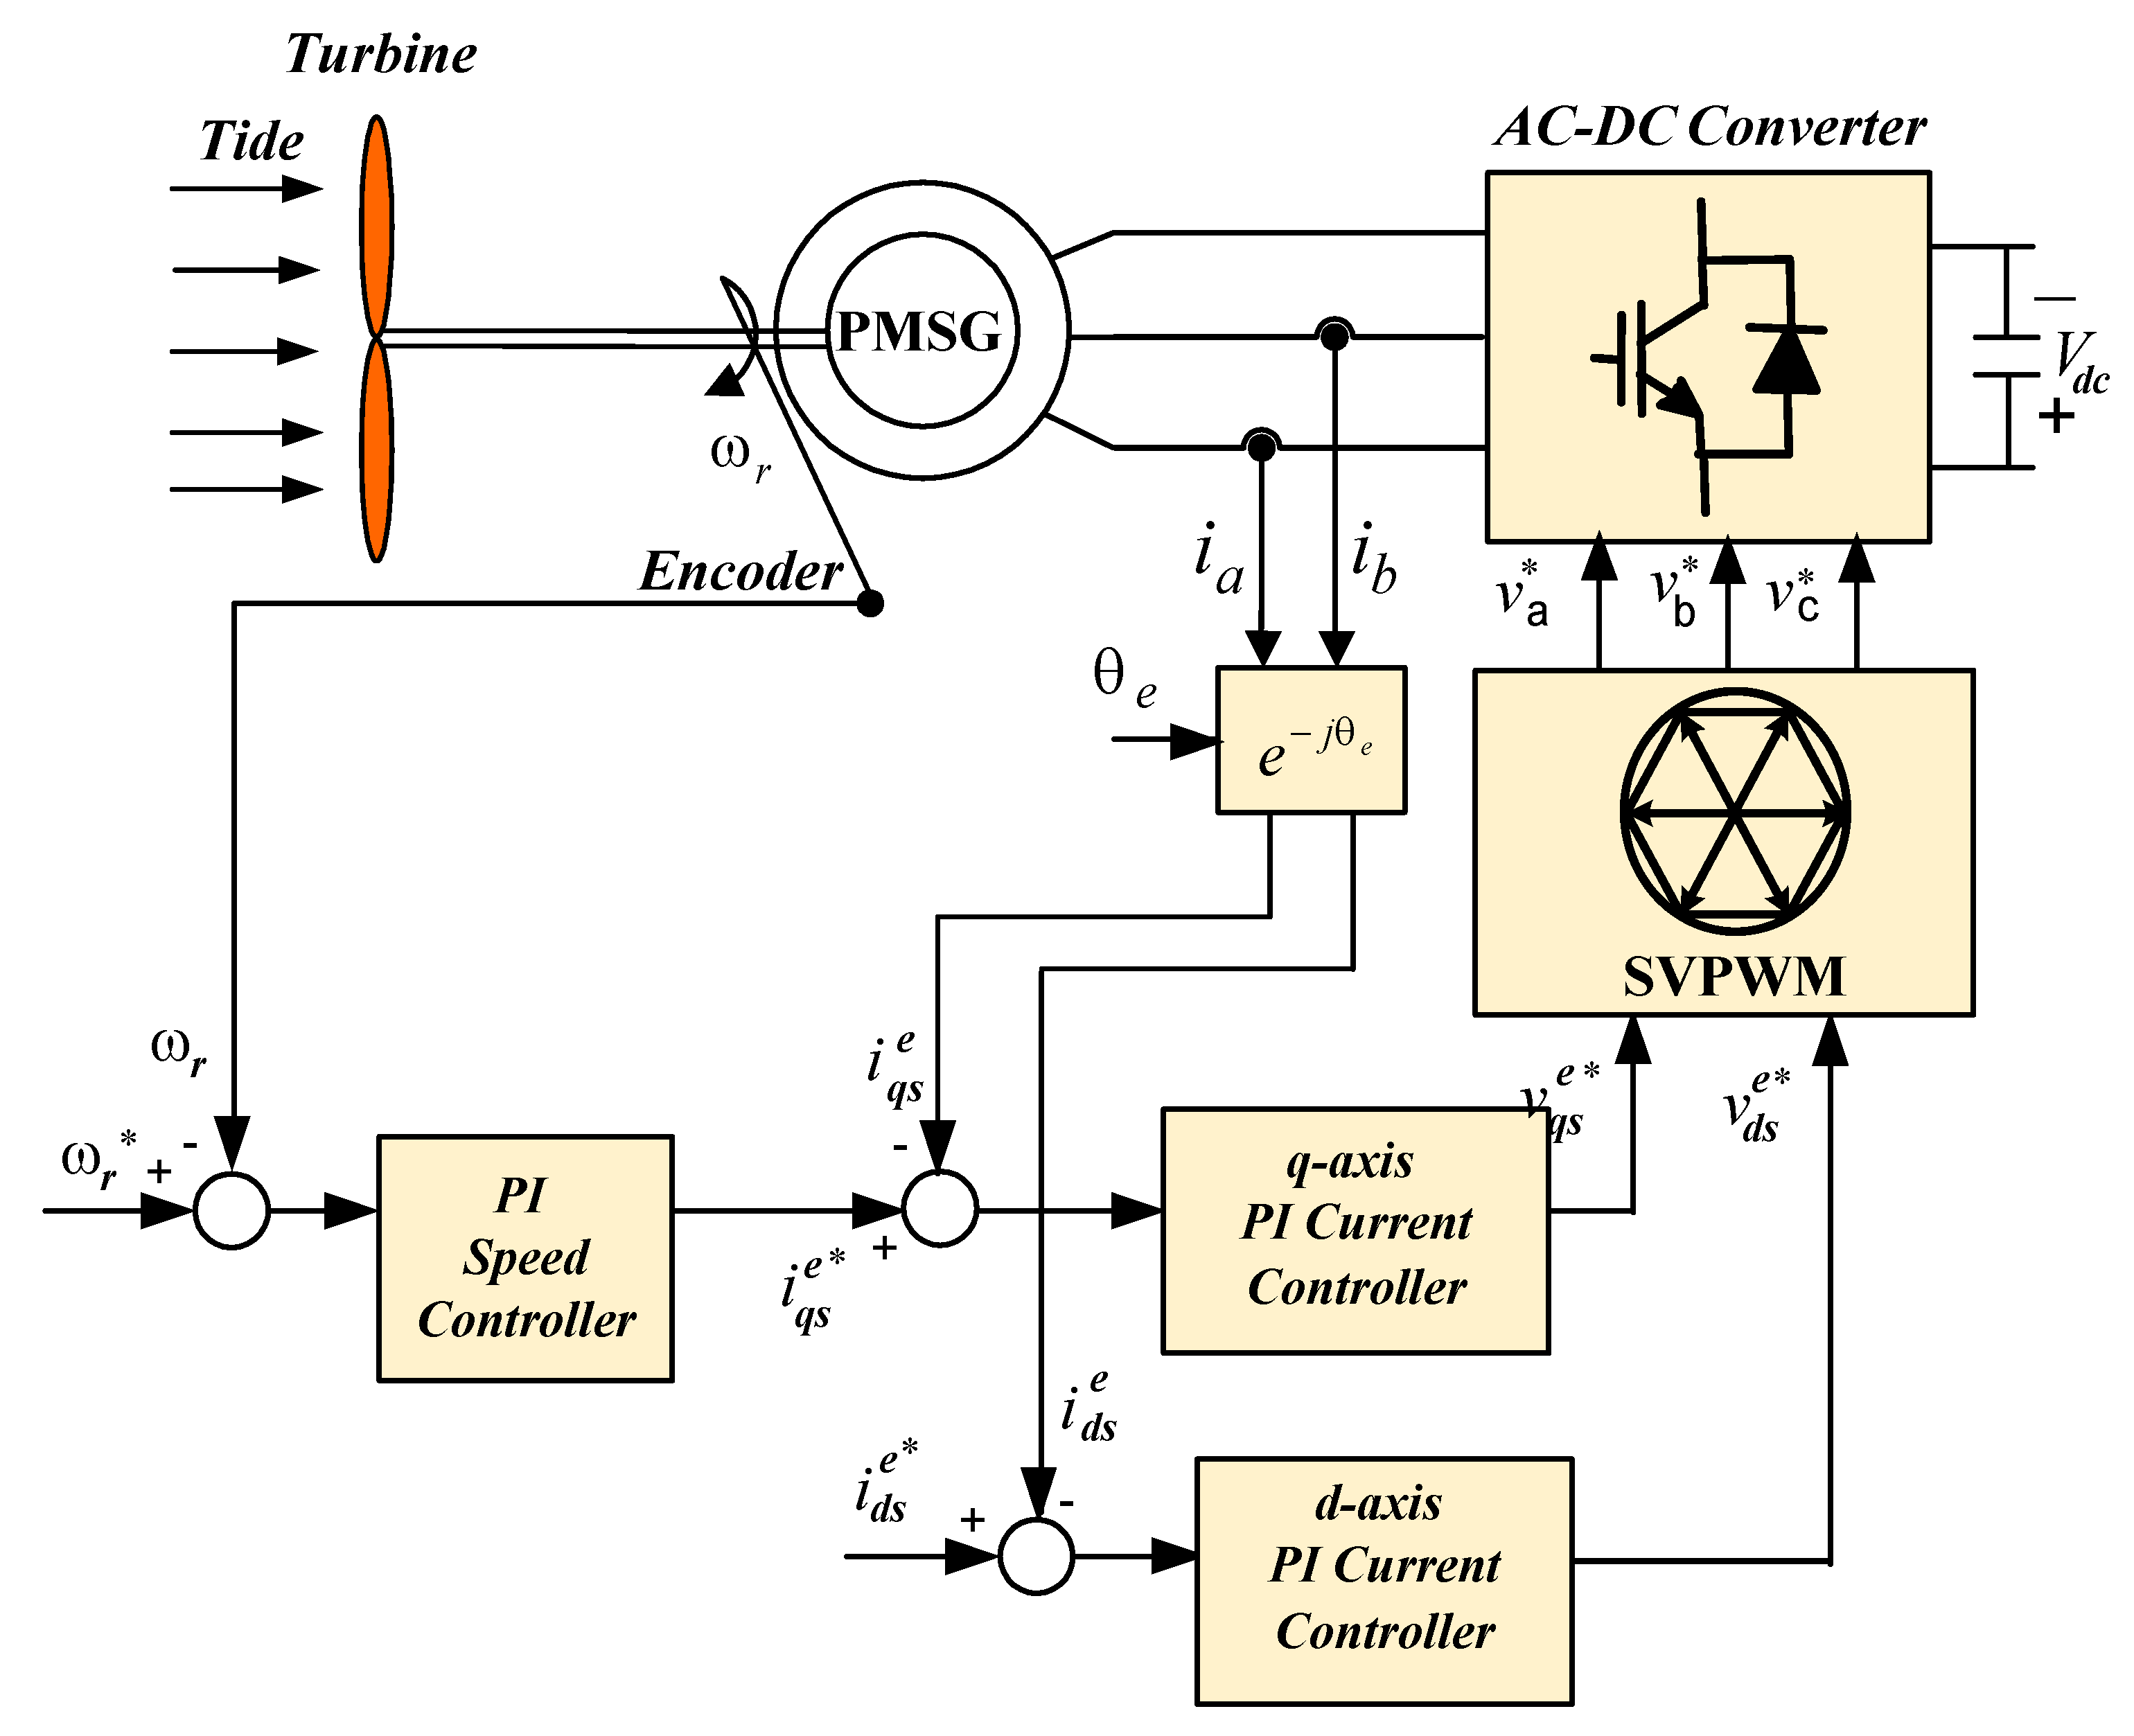
MPPT control using the optimal circumferential speed ratio creates a speed command value that gives the maximum output, and to control the torque of the generator, the speed controller produces a command value of the q-axis current. In addition, the d-axis current is controlled to maintain the generator flux constant. Figure 4 is showing the control block diagram of the PMSG in a tidal energy conversion system. In Figure 4, The reference voltage and currents, V d c ,   i g d , and i g q are used to control DC−link voltage and grid power factor.

2.3. Grid-Side Control

The voltage equation on the grid-side is expressed in Equation (8) when expressed on the synchronous coordinate system using the three-phase voltage and the control voltage of the converter [27,28]:
[ V d g e V q g e ] = [ R g + p L g ω e L g ω e L g R g + p L g ] [ i d g i q g ] + [ v d g v q g ]  
where the subscripts ‘d’ and ‘q’ refer to the measured quantities that have been transformed for the synchronous reference frame d and q axes.   I d g ,   I q g are the grid side converter dq current components, V d g ,   V q g are the grid side converter dq voltage components, respectively, Rg, Lg are the resistance and inductance of the grid side converter, v d g e and v q g e are the dq-axis grid voltage components, respectively.
From the above equation, it can be seen that the q-axis is related to the active power, and the d-axis is independent of the active power and only dependent on the reactive power [29,30]
P g r i d = 3 2 ( v d g e i d g e + v q g e i q g e )
Q g r i d = 3 2 ( v d g e i d g e + v q g e i q g e )
From Equations (8)–(10), the grid side active and reactive power are controlled by regulating the grid-side converter currents I d g   and   I q g . Accordingly, the grid-side converter controller maintain the DC-link voltage constant and the output current in phase with the grid voltage by regulating the grid q-axis current and d-axis current, respectively. The d-q axis current control loop of the GSC is shown in Figure 4 [31].

3. Support Vector Regression (SVR)

3.1. SVR Algorithm

Support Vector Machines (SVM) is a machine learning technique, based on the principles of Structural Risk Minimization (SRM). This technique seeks to minimize the error in relation to the training set (empirical risk), together with the error in relation to the test set. The motivation for this principle arose from the need to develop theoretical limits to the ability to generalize learning systems. Greater generalization usually implies a greater number of correct answers in the test phase. The more the decision surface is adjusted to the training set data, that is, the more complex the decision hyperplane of these functions in the data entry space, the greater the structural risk [32]. The objective of SVM is to achieve a balance between both errors, minimizing excess adjustments (overfitting) and improving the ability to generalize.
SVR extended from SVM to regression is a learning technique proposed by Cortes, Vapnik (1995). SVR not only can be applied to nonlinear problems, but also has the advantage of showing excellent learning performance [33].
If the given training data is (x1, y1), ……, (xn, yn), xi is the input variable space of the sample and yi means the target variable value corresponding to i = 1, ……, N. As the first objective, the regression function f (x) can be estimated, which describes the target variable yi well, f (x) [34].
f ( x ) = w , x + b
where w is the slope, b is the intercept, and <x, w > is the dot product of w and x.
Second, find w that makes the slope of the estimated regression function f (x) flat. This minimizes the norm ( w ) with w as small as possible.
Minimize   1 2 w 2 Subject   to   y i w , x i b ε w , x i + b y i ε
Equation (12) considers the optimization problem when all the data have errors below ε . To allow the case where the ε has a phase error, the optimization problem can be reconstructed by Equation (13) using the slack variables ξ i , ξ i .
1 2 w 2 + C i = 1 N ( ξ i + ξ i )
which is subjected to
y i w , x i b ε + ξ i w , x i + b y i ε   + ξ i ξ i , ξ i 0
In Equation (13) C (C > 0) is a constant and means the penalty of estimated error. The constant C determines the complexity of the model by determining the trade-off between the flatness of the function f (x) and the tolerance for errors greater than ε [35]. Equation (16) does not calculate the error value if the error is within the range of ± ε according to the ε -loss function, and has a value that is linearly proportional to the error value for data with an error outside the range of ± ε . Equation (14) shows the ε -loss function:
L ϵ ( y , f ( x ) ) = ( | y f ( x ) | ϵ ) =   0 ,   if   | y f ( x ) | ϵ =   | y f ( x ) | ϵ ,     if   | y f ( x ) | > ϵ
The optimization problem can be expressed by the Lagrangian function as shown in Equation (15) by introducing the Lagrangian multipliers α i , α i [36]:
    L p = 1 2 w 2 + C i = 1 N ( ξ i + ξ i ) + C i = 1 N ( γ i ξ i + γ i ξ i ) i = 1 N   α i ( ε + ξ i y i + w , x i + b   ) i = 1 N   α i ( ε + ξ i + y i + w , x i b   )
Through Lagrange’s theory, the condition of the solution to the original optimization problem is as follows Equation (16).
L p w = w + i = 1 N ( α i α i ) x i = 0 L b = i = 1 N ( α i α i ) = 0   L ξ i = C α i γ i = 0 L ξ i = C α i γ i = 0
We can solve the optimization problem by converting to a dual problem using Equation (16) [37]:
Maximize   1 2 i = 1 N j = 1 N ( α i α i ) ( α j α j ) x i ,   x j + i = 1 N y i ( α i α i ) ϵ i = 1 N ( α i α i ) ,
Subject   to   i = 1 N ( α i α i ) = 0   and   α i ,   α i [ 0 ,   C ]
It is expressed as w = i = 1 N ( α i α i ) x i through Equation (17), through which the final estimation function f (x) of the SVR model can be obtained as shown in the following:
w = i = 1 N ( α i α i ) x i   thus   f ( x ) = w , x + b = i = 1 N ( α i α i ) x i   , x + b ,
b = y i i = 1 N ( α i α i ) x i   , x i + ε
In general, since the actual data is closer to the nonlinear model than the linear model, the linear SVR model is extended to the nonlinear SVR model. The radial basis function is used as a kernel function to extend the non-linear SVR model as [38]:
K ( x i , x ) = exp { | x i , x | 2 σ 2 }
where σ is the Gaussian width.
By using the nonlinear mapping function Φ , the x of the input space can be mapped to a high-dimensional characteristic space and extended to the nonlinear SVR model. Φ means the transform function of x that projects from the input space to the characteristic space. It means converting the nonlinear problem to a linear model. The conversion function Φ can be expressed by the following Equation (19). By expressing it with the kernel function K, it has the advantage of knowing Φ through internal calculation without complicated calculation [39].
K ( x i , x j ) = < Φ ( x i ) . Φ ( x j )   >  
In the same way as in the linear SVR, w = i = 1 N ( α i α i ) Φ ( x i ) is used, and Equation (20) is the estimation function equation for the nonlinear SVR.
  f ( x ) = w , Φ ( x i ) + b = i = 1 N ( α i α i ) K x i , x + b .

3.2. MPPT Using SVR

The PMSG speed controller obtains the reference rotational speed from the SVR estimator which calculate the optimum speed as follows:
  • By collecting a sufficient number of testing or training samples of pre-specified turbine power, rotor rotational speed and the tidal current speed, the preparation step is achieved.
  • The training samples are then used in an offline step that is called training process for SVR to assess each particle fitness value in the regression.
  • The on-line estimation model is then obtained by retrain the SVR optimal parameters.
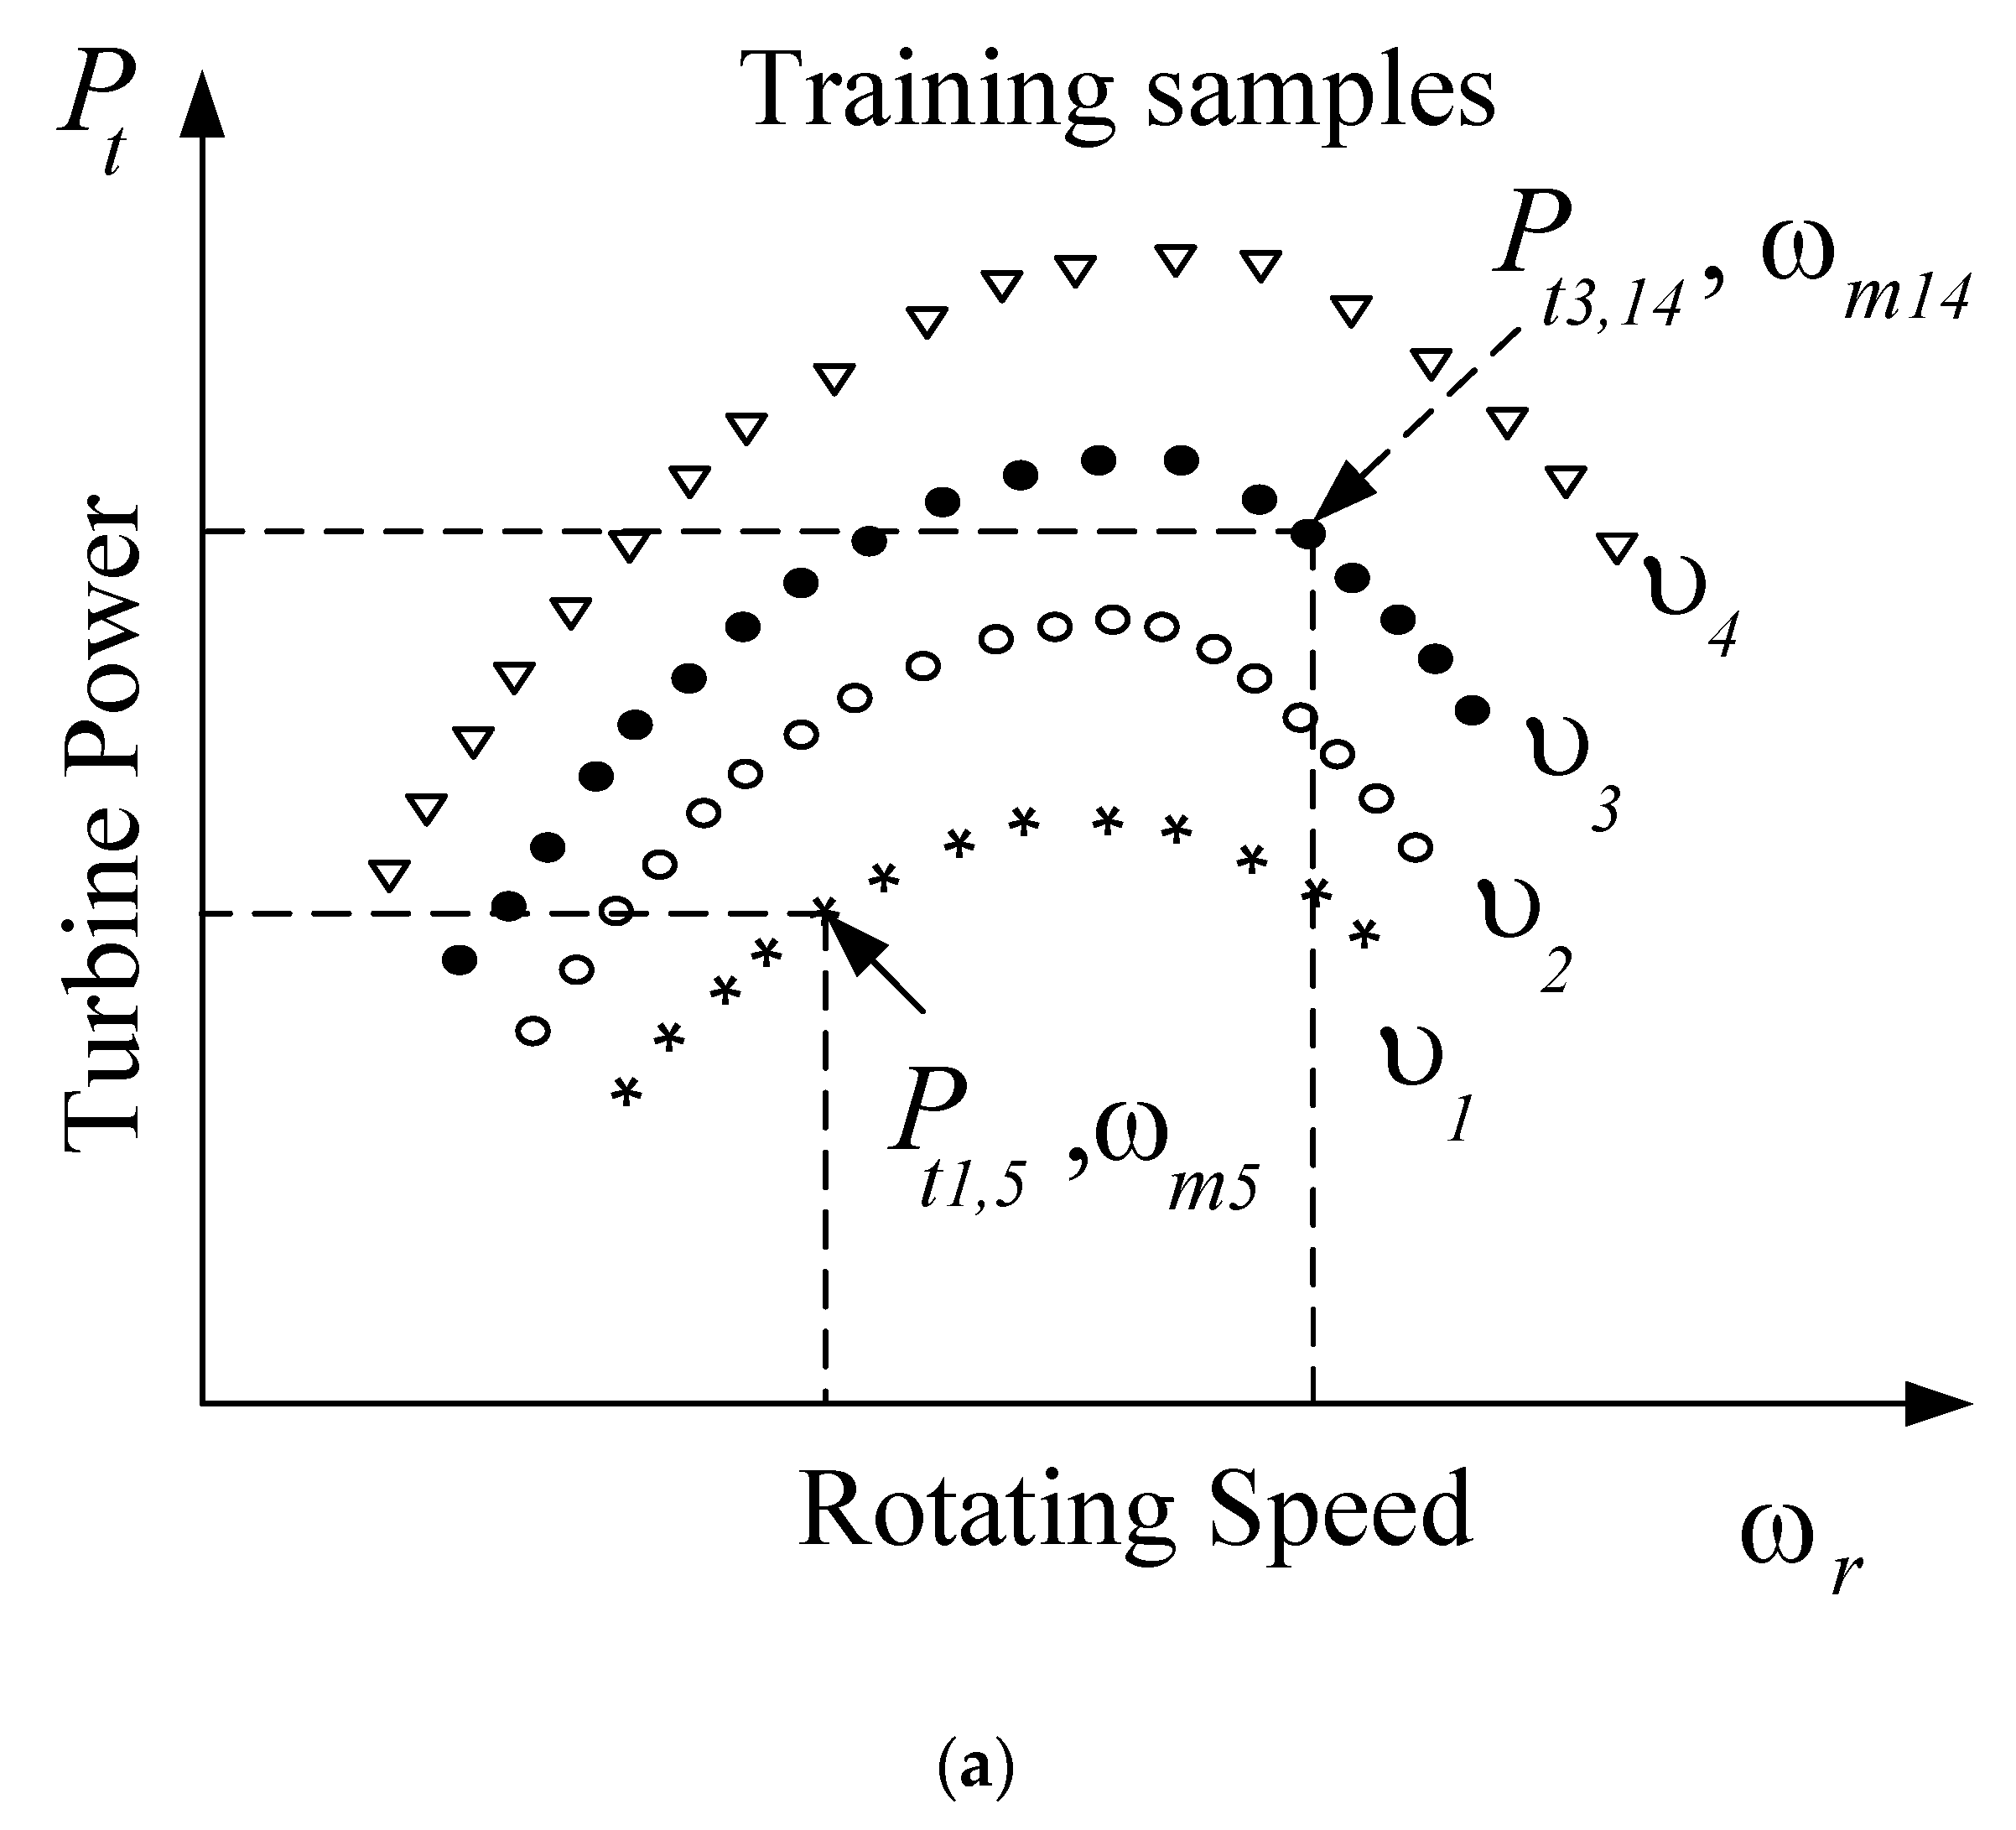
The collected samples of the measured and calculated quantities are mapped as shown in Figure 5a. The tidal turbine power samples are by using the following equation:
P t = J ω r d ω r d t + P g
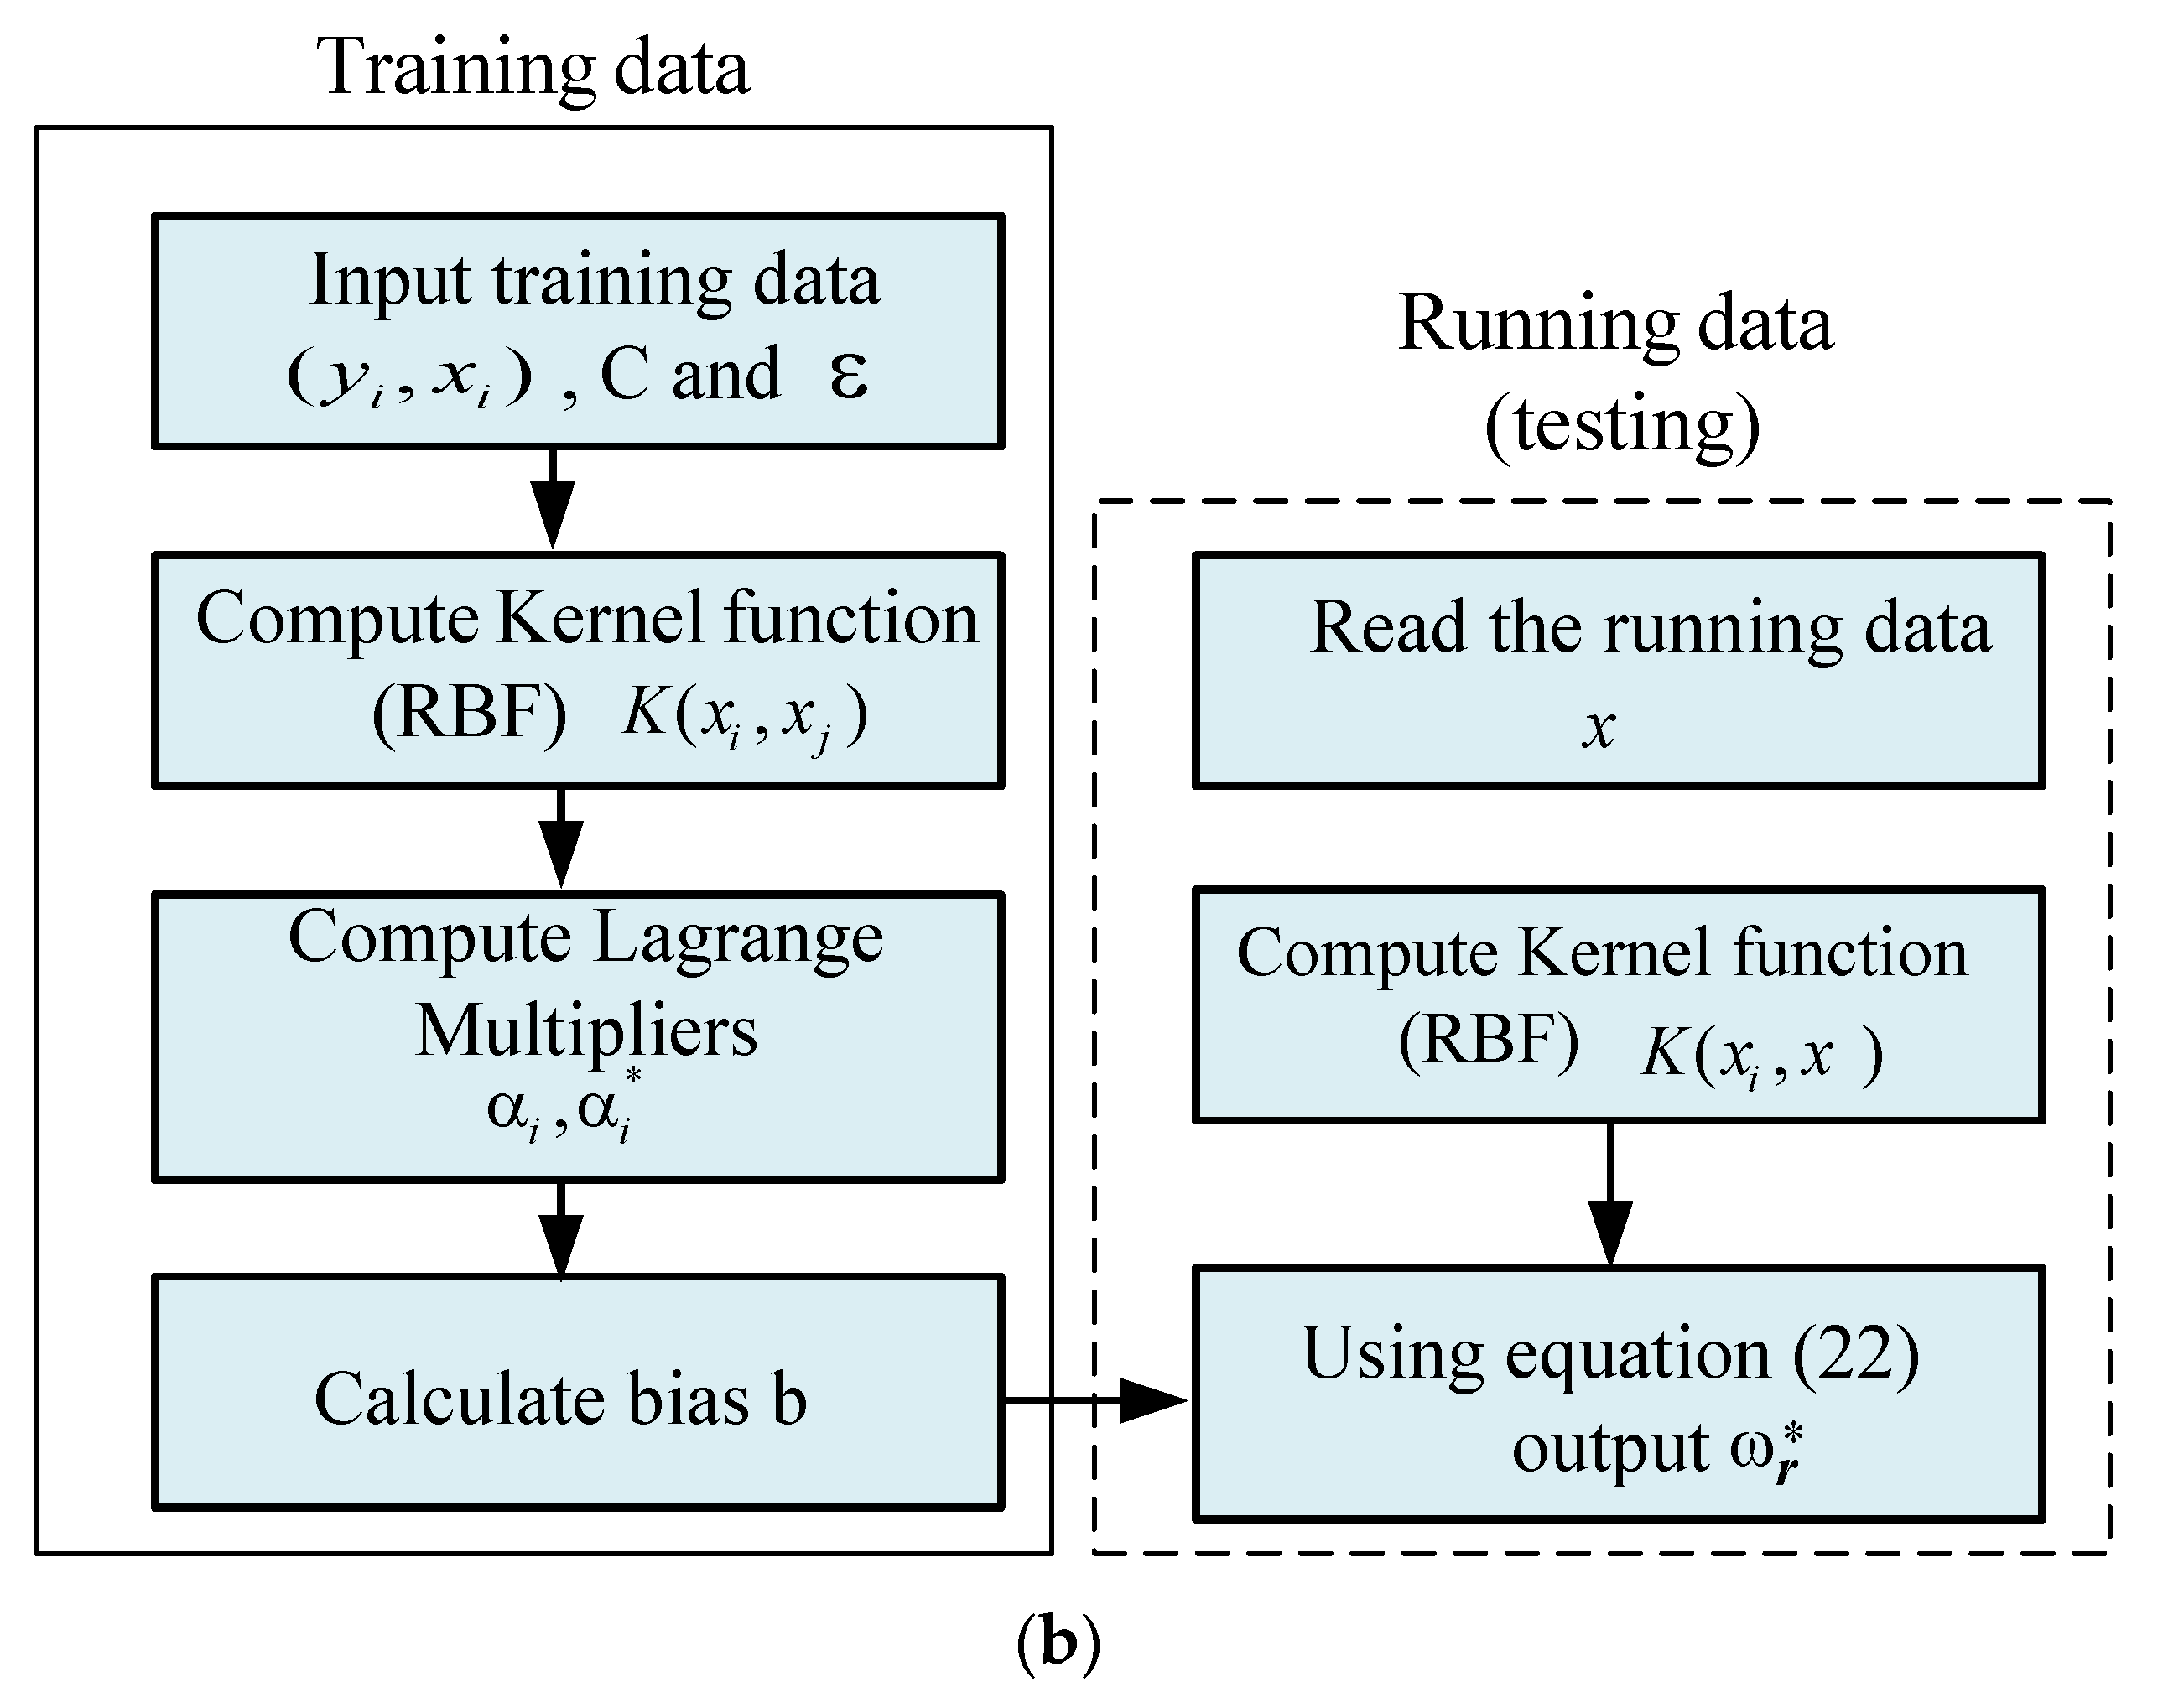
The first step of the MPPT using SVR is the to define and adjust the parameters ϵ and C through the training step. After adjusting the regression parameters, the SVR model is then used on-line to generate the output variable which is normally used as a reference signal, such as tidal current speed, rotational speed, duty cycle for the AC–DC converter, etc. The flowchart of the off-line and on-line process of the SVR MPPT method is shown in Figure 5b.
Figure 6 shows the control block diagram of the generator side. The outer speed controller uses the reference rotating speed ω r to control the generator speed to the maximum value by controlling the q-axis current. The d-axis current reference is used in the other control loop to regulate the generator flux.

4. Experimental Results

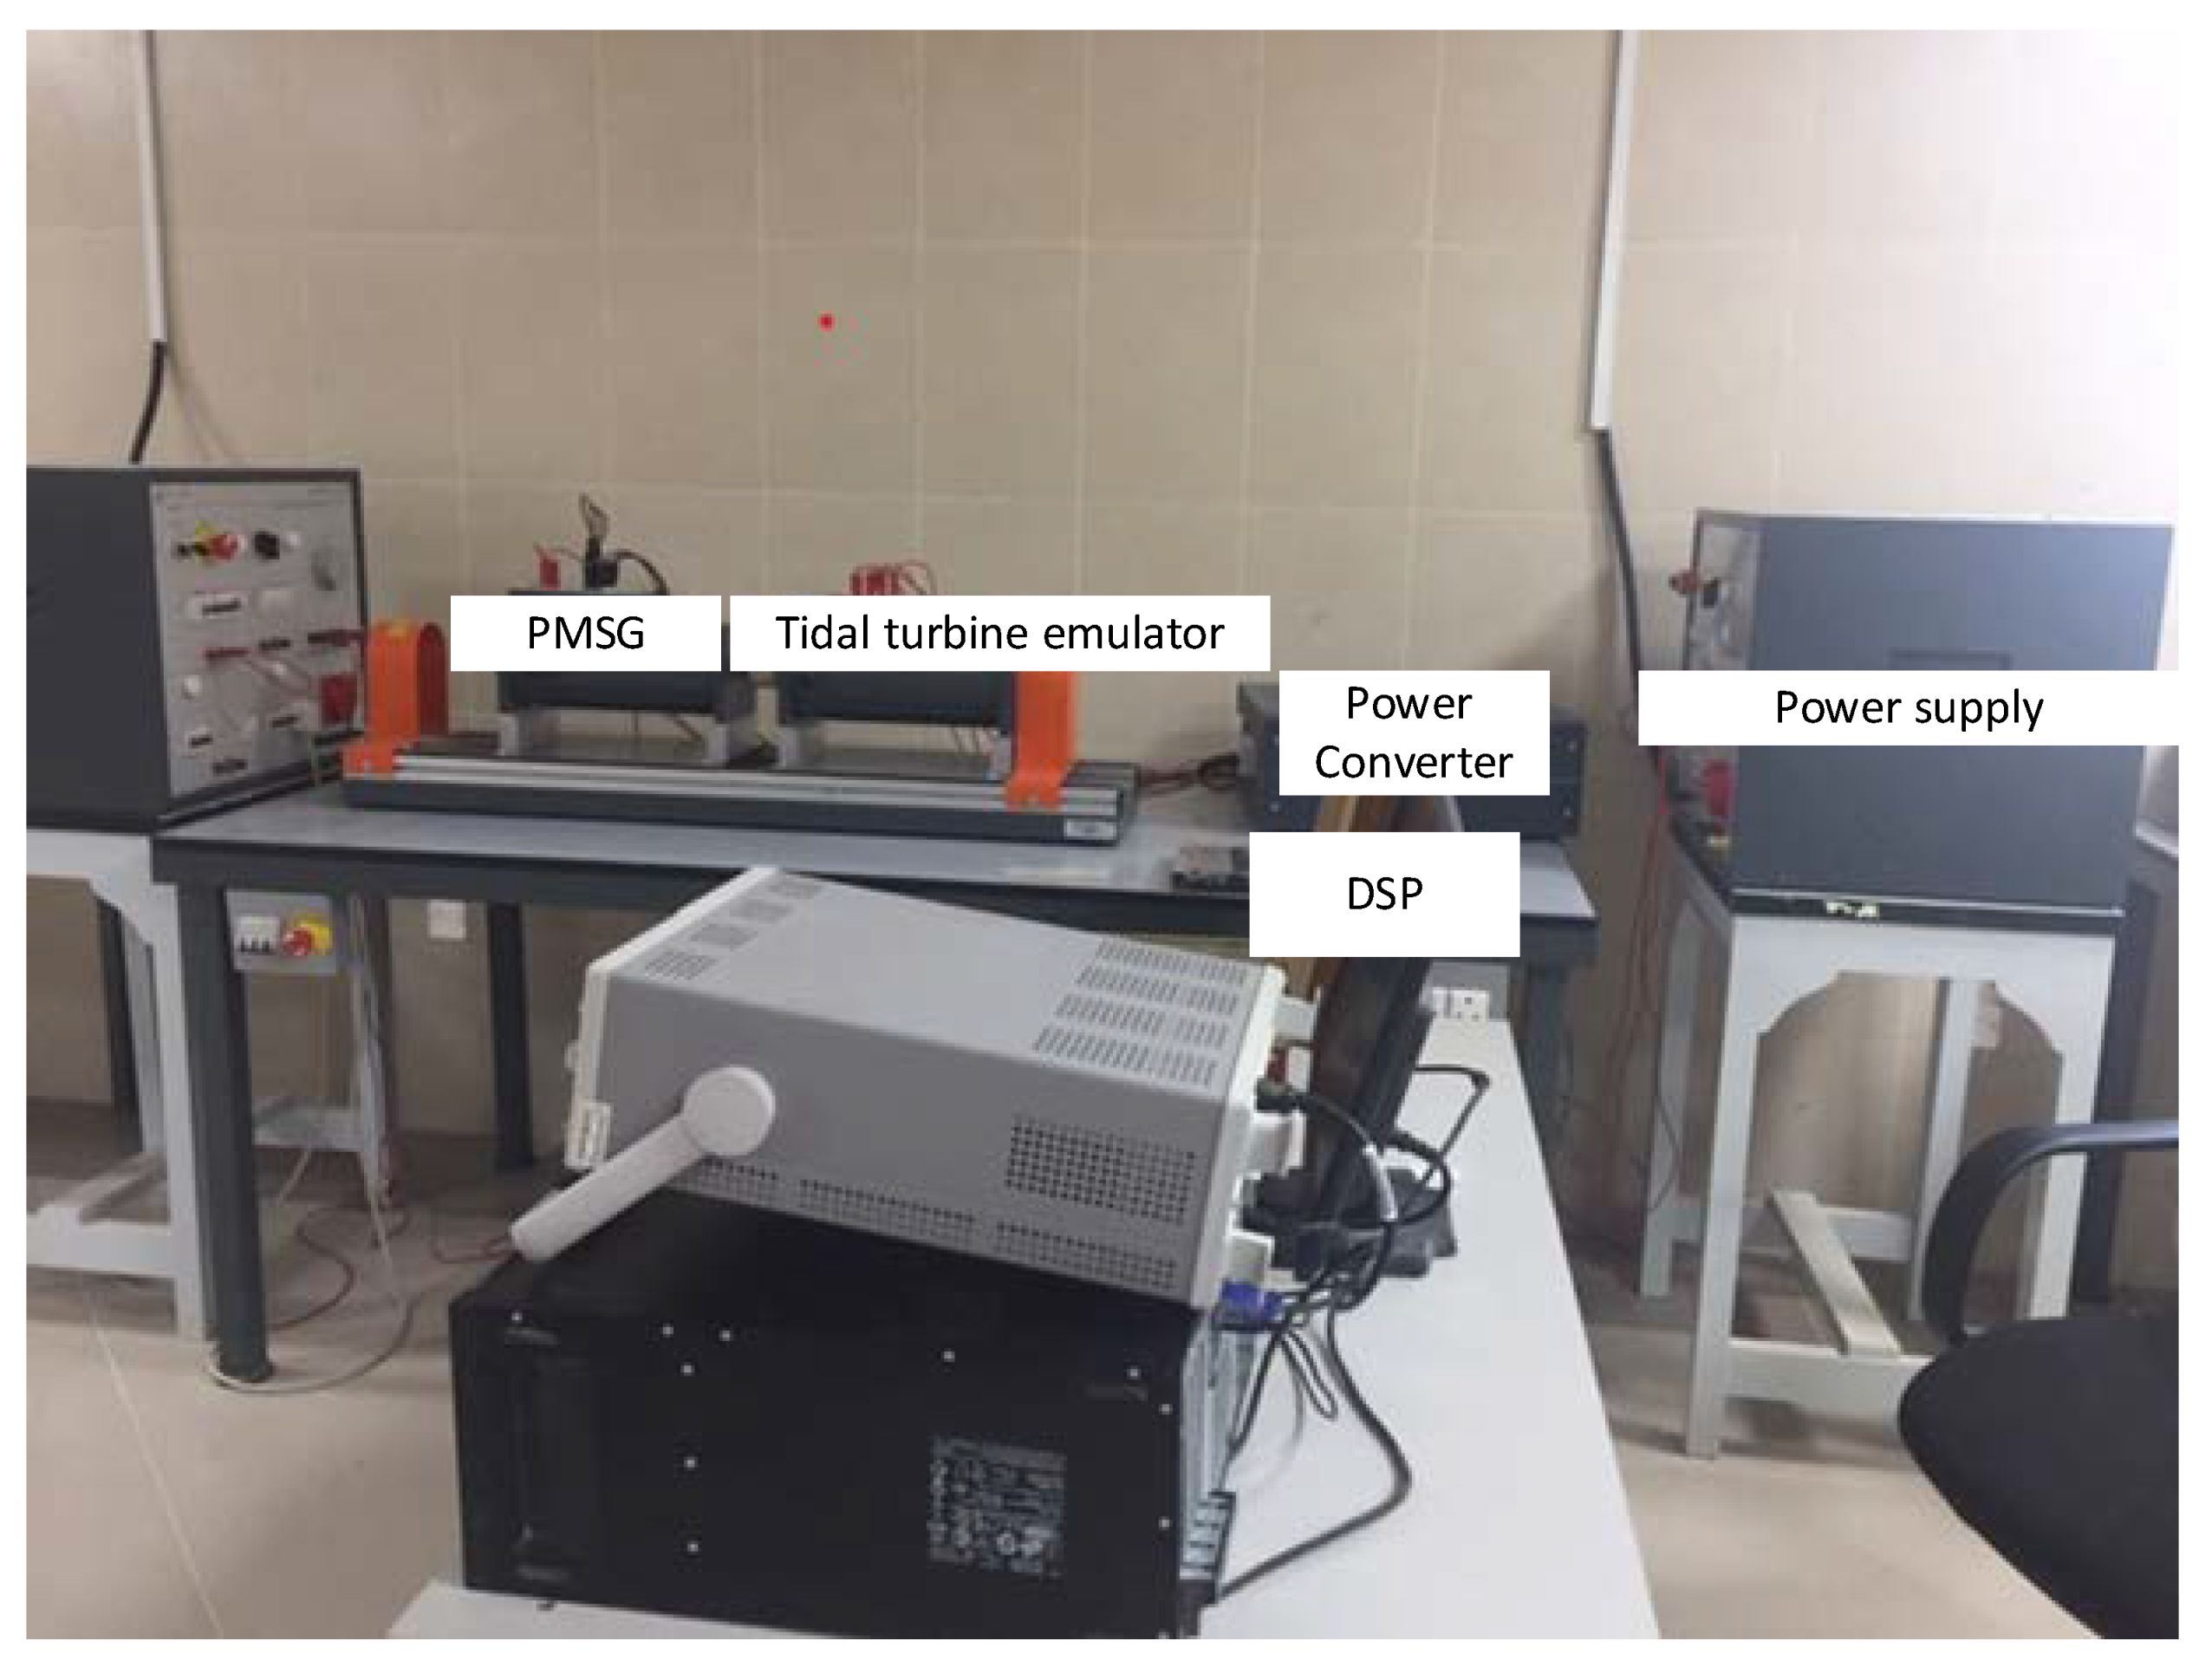
An experimental setup for the tidal energy conversion system was implemented (Figure 7), comprising: a squirrel-cage induction motor as a tidal characteristics emulator that controlled by a back-to back converter, and a 2.7 kW PMSG system that is controlled by an electronic power converter (back-to-back), and inductive filters, protection devices. The central control board has a digital signal processor (TMS320VC33), the signal conditioning and protection circuits, the isolation circuits between the power converters and the control circuits. The central board presents the communication circuits between the digital signal processor (DSP) and the peripherals of the system: incremental encoder, digital analog converter (DAC) that allows to obtain data on the oscilloscope interface for communication with a computer. The DSP processor includes the phase-locked loop (PLL) algorithms, DC-link voltage controller, and AC–DC and DC–AC current (PI) controllers. IGBT modules (SK40GB 123, SEMIKRON), with their respective drivers, make up the complete bridge inverter connected to the network. The switching frequencies of the inverter, as well as the converter and inverter were fixed at 10 kHz. In addition, current (LA 100-P) and voltage (LV 25-P) transducers were used to measure the current and voltage quantities. The specifications of the PMSG are shown in Table 1.
The tide current speed pattern was selected to increase and decrease in steps from 2.2 m/s to 1.4 m/s, and then back to 2.2 m/s as shown in Figure 8a. The rotational speed follows the tidal current speed pattern as shown in Figure 8b and the SVR algorithm adjust the rotational speed to extract the generator maximum power which is shown in Figure 8c. The stator q-axis current follows the tide current as shown in Figure 8d.
Figure 9 shows the controller performance is investigated during a small variation in the tidal speed. The tidal speed is stepped-up from 1.4 m/s to a short step of 1.6 [m/s] as shown in Figure 9a.
In the speed optimization strategy, the MPPT algorithm adjusts the generator speed continuously to the optimum rotational speed reference signal provided by the maximum power out of the tide as shown in Figure 9b,c. The stator q-axis current is given in Figure 9d to show the performance of the current controller.
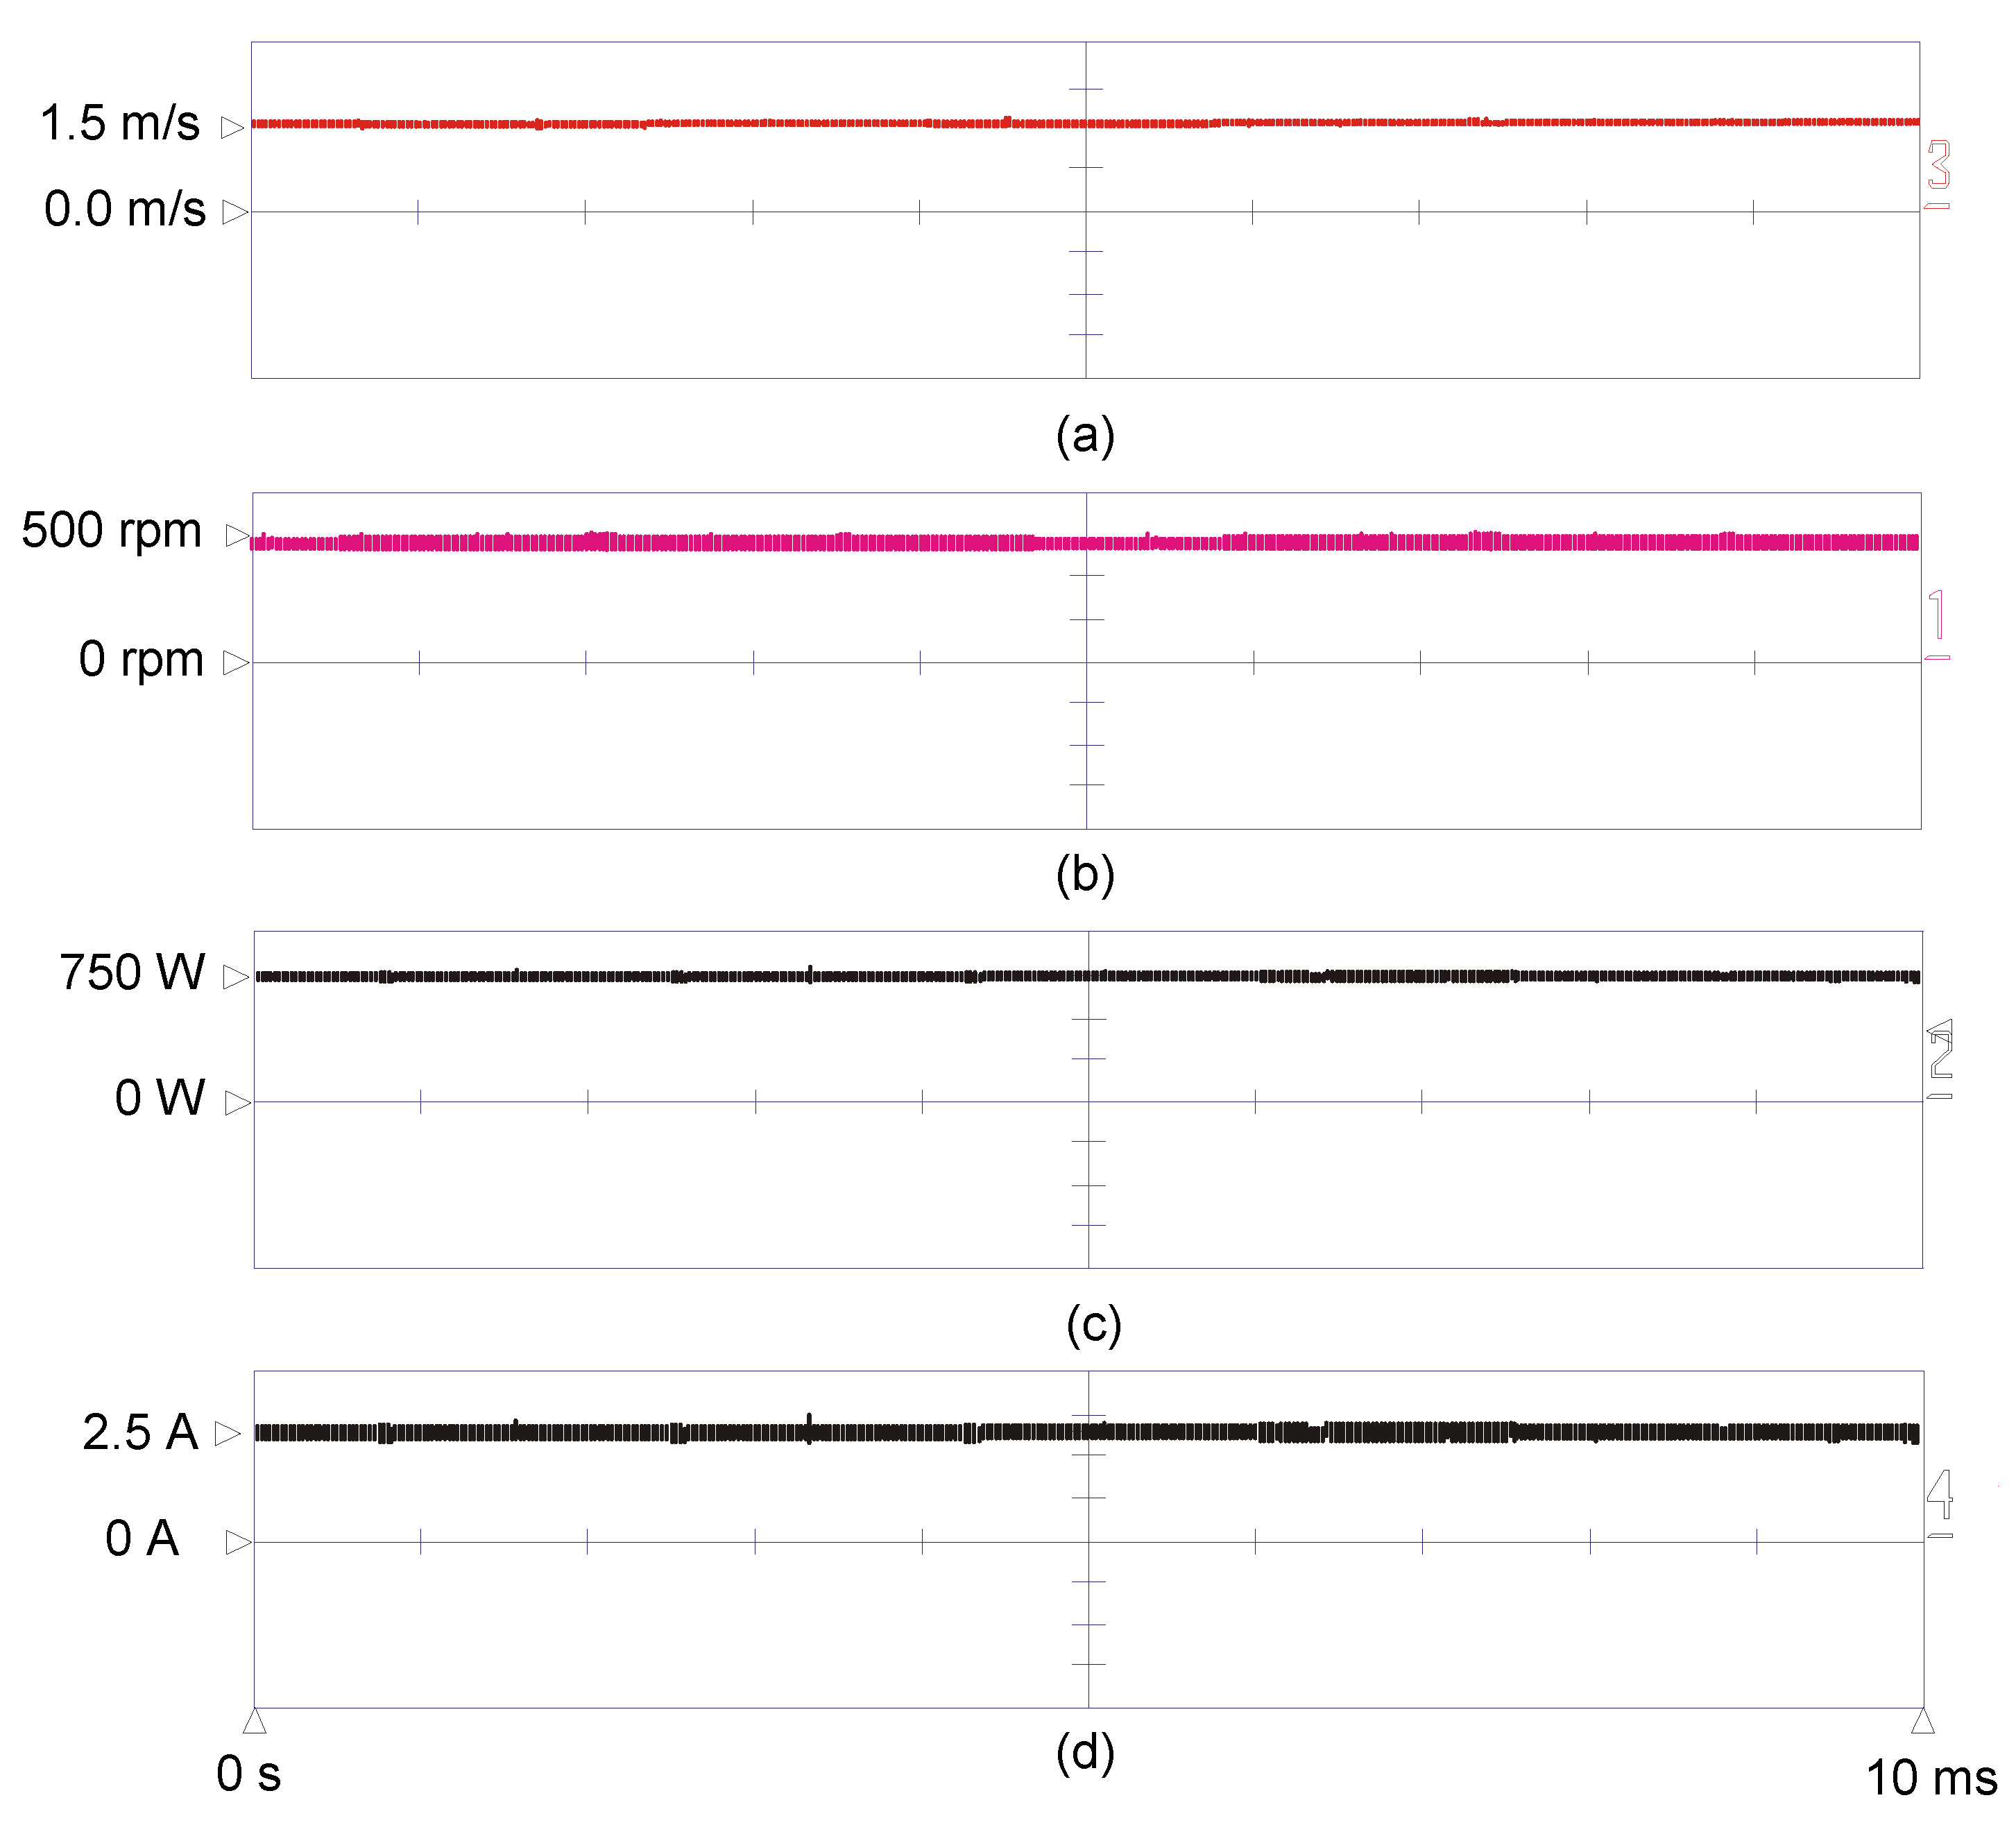
The performance of the PMSG in a constant tidal current is shown in Figure 10. When the tidal speed is 1.5 m/s the optimum generator rotational speed is adjusted to about 500 rpm. This speed is corresponding to the maximum power which is 500 W. The q-axis current is controlled accurately without excessive oscillation as sown in Figure 10d.
The characteristics of the tide system have been simulated by a turbine simulator which is implemented by a squirrel cage induction motor. In this simulator, the q-axis current of the induction machine is used to calculate the blade torque by formulating the actual blade characteristics. It can be considered that it operates like a real turbine model. In addition, this system performs MPPT control without tidal current speed information and operates at the optimum operating point, so it is an optimum design in terms of cost and efficiency.
In the future, as new and renewable power generation system facilities are rapidly increasing in scale, the proportion of the tidal energy conversion systems in the power system is expected to gradually increase. In order to operate the power system efficiently and stably, power system operators are demanding that the distributed generation systems exhibit the same of the conventional power systems. In research and implementing of an efficient PMSG tidal energy conversion system, it is considered essential to guarantee more efficient and reliable system in present and in the future.

5. Conclusions

In this paper, a sensorless method is applied to extract the maximum power point from a PMSG tidal power generation system. In addition, since this system controls MPPT without measuring the tidal speed which is advantage in terms of cost or efficiency. To prove the superior performance and efficiency of the proposed system, SVR MPPT control algorithm was analyzed through experiment. For different tidal speeds, a large number of generator-speed characteristics samples were collected and trained by SVR in the offline stage, to map a relation between the generator power and its speed. The obtained relationship is then used in the online stage to predict the maximum power point at any tide speed by measuring the instantaneous generator power and rotational speed. Due to the structure and control characteristics of the system, it can be said to be very suitable for small tidal power generation systems. The main advantages of estimating the tide speed by SVR method are the high estimation accuracy and the fast-transient response.

Author Contributions

Conceptualization, A.S.A.; Data curation, A.G.A.-K.; Formal analysis, A.G.A.-K.; Funding acquisition, A.S.A.; Project administration, A.S.A.; Software, A.S.A.; Validation, A.S.A.; Writing–review and editing, A.G.A.-K. All authors have read and agreed to the published version of the manuscript.

Funding

This research received no external funding.

Institutional Review Board Statement

Not applicable.

Informed Consent Statement

Not applicable

Data Availability Statement

The used or generated data and the result of this study are available upon request from the corresponding author.

Acknowledgments

The author would like to thank Deanship of Scientific Research at Majmaah University for supporting this work under Project Number No. (RG. 2019-19).

Conflicts of Interest

The authors declare no conflict of interest.

References

  1. Sabzehgar, R. A Review of Ocean Wave Energy Conversion Systems. In Proceedings of the IEEE Electrical Power & Energy Conference, Montreal, QC, Canada, 22–23 October 2009. [Google Scholar]
  2. Segura, E.; Morales, R.; Somolinos, J.A.; Lopez, A.A. Techno-economic challenges of tidal energy conversion systems: Current status and trends. Renew. Sustain. Energy Rev. 2017, 77, 536–550. [Google Scholar] [CrossRef]
  3. Uihlein, A.; Magagna, D. Wave and tidal current energy—A review of the current state of research beyond technology. Renew. Sustain. Energy Rev. 2016, 58, 1070–1081. [Google Scholar] [CrossRef]
  4. El Tawil, T.; Charpentier, J.F.; Benbouzid, M. Tidal energy site characterization for marine turbine optimal installation: Case of the Ouessant Island in France. Int. J. Mar. Energy 2017, 18, 57–64. [Google Scholar] [CrossRef]
  5. Winter, A.I. Differences in fundamental design drivers for wind and tidal turbines. In Proceedings of the 2011 IEEE-Spain OCEANS, Santander, Spain, 6–9 June 2011; pp. 1–10. [Google Scholar]
  6. Sousounis, M.C.; Shek, J.K.H.; Mueller, M.A. Modelling and control of tidal energy conversion systems with long distance converters. In Proceedings of the 7th IET International Conference on Power Electronics, Machines and Drives (PEMD 2014), Manchester, UK, 8–10 April 2014; pp. 1–6. [Google Scholar]
  7. Benelghali, S.; Benbouzid, M.E.H.; Charpentier, J.F.; Ahmed-Ali, T.; Munteanu, I. Experimental Validation of a Marine Current Turbine Simulator: Application to a Permanent Magnet Synchronous Generator-Based System Second-Order Sliding Mode Control. IEEE Trans. Ind. Electron. 2011, 58, 118–126. [Google Scholar] [CrossRef] [Green Version]
  8. Abo-Khalil, A.G.; Lee, D.C. Optimal Efficiency Control of Wind Generation System Using Fuzzy Logic Control. J. Power Electron. 2005, 8, 345–353. [Google Scholar]
  9. Zhang, H.-B.; Fletcher, J.; Greeves, N.; Finney, S.J.; Williams, B.W. One-power-point operation for variable speed wind/tidal stream turbines with synchronous generators. IET Renew. Power Gener. 2011, 5, 99–108. [Google Scholar] [CrossRef]
  10. Kumar, A.; Shankar, G. Load frequency control assessment of tidal power plant and capacitive energy storage systems supported microgrid. IET Gener. Transm. Distrib. 2020, 14, 1279–1291. [Google Scholar] [CrossRef]
  11. Sousounis, M.C.; Shek, J.K.H.; Mueller, M.A. Modelling, control and frequency domain analysis of a tidal current conversion system with onshore converters. IET Renew. Power Gener. 2016, 10, 158–165. [Google Scholar] [CrossRef] [Green Version]
  12. Odedele, N.; Olmi, C.; Charpentier, J.F. Power Extraction Strategy of a Robust kW Range Marine Tidal Turbine Based on Permanent Magnet Synchronous Generators and Passive Rectifiers. In Proceedings of the 3rd Renewable Power Generation Conference (RPG 2014), Naples, Italy, 24–25 September 2014; p. 2.3.2. [Google Scholar]
  13. Yang, B.; Zhong, L.; Yu, T.; Shu, H.; Cao, P.; An, N.; Sang, Y.; Jiang, L. PCSMC design of permanent magnetic synchronous generator for maximum power point tracking. IET Gener. Transm. Distrib. 2019, 13, 3115–3126. [Google Scholar] [CrossRef]
  14. Michas, M.; Ugalde-Loo, C.E.; Ming, W.; Jenkins, N.; Runge, S. Maximum power extraction from a hydrokinetic energy conversion system. IET Renew. Power Gener. 2019, 13, 1411–1419. [Google Scholar] [CrossRef]
  15. Huang, L.; Hu, M.; Yu, H.; Liu, C.; Chen, Z. Design and experiment of a direct-drive wave energy converter using outer-PM linear tubular generator. IET Renew. Power Gener. 2017, 11, 353–360. [Google Scholar] [CrossRef]
  16. Mosaad, M.I. Direct power control of SRG-based WECSs using optimised fractional-order PI controller. IET Electric Power Appl. 2020, 14, 409–417. [Google Scholar] [CrossRef]
  17. Couch, J.S.; Bryden, I. Tidal current energy extraction: Hydrodynamic resource characteristics. Proc. Inst. Mech. Eng. Part M J. Eng. Marit. Environ. 2006, 220, 185–194. [Google Scholar] [CrossRef]
  18. Myers, L.E.; Bahaj, A.S. Power output performance characteristics of a horizontal axis marine current turbine. Renew. Energy 2006, 31, 197–208. [Google Scholar] [CrossRef]
  19. Abo-Khalil, A.G.; Lee, D.C.; Seok, J.K. Variable Speed Wind Power Generation System Based on Fuzzy Logic Control for Maximum Output Power Tracking. In Proceedings of the Power Electronics Specialists Conference’04, Aachen, Germany, 20–25 June 2004; pp. 2039–2043. [Google Scholar]
  20. Ab-Khalil, A.G. Control system of DFIG for Wind Power Generation Systems; LAP LAMBERT Academic Publishing: Raja, Latvia, 2015; ISBN 978-3659649813. [Google Scholar]
  21. Abo-Khalil, A.G.; Kim, H.G.; Lee, D.C.; Seok, J.K. Maximum Output Power Control of Wind Generation System Considering Loss Minimization of Machines. In Proceedings of the IECON’04, Busan, South Korea, 2–6 November 2004; pp. 1676–1681. [Google Scholar]
  22. Abokhalil, A.G. Grid Connection Control of DFIG for Variable Speed Wind Turbines under Turbulent Conditions. Int. J. Renew. Energy Res. 2019, 9, 1260–1271. [Google Scholar]
  23. Abo-Khalil, A.G.; Alghamdi, A.S.; Eltamaly, A.M.; Al-Saud, M.S.; Praveen, P.R.; Sayed, K. Design of State Feedback Current Controller for Fast Synchronization of DFIG in Wind Power Generation Systems. Energies 2019, 12, 2427. [Google Scholar] [CrossRef] [Green Version]
  24. Abo-Khalil, A.G.; Alyami, S.; Sayed, K.; Alhejji, A. Dynamic Modeling of Wind Turbines Based on Estimated Wind Speed under Turbulent Conditions. Energies 2019, 12, 1907. [Google Scholar] [CrossRef] [Green Version]
  25. Strachan, B.P.W.; Jovcic, D. Dynamic Modelling, Simulation and Analysis of an Offshore Variable-Speed Directly-Driven Permanent-Magnet Wind Energy Conversion and Storage System (WECSS). In Proceedings of the IEEE/OES Oceans 07, Aberdeen, Scotland, 8–21 June 2007. [Google Scholar]
  26. Hansen, A.D.; Michalke, G. Multi-pole permanent magnet synchronous generator wind tubines’ grid support capability in uninterrupted operation during grid faults. IET Renew. Power Gener. 2008, 3, 333–348. [Google Scholar] [CrossRef]
  27. Abo-Khalil, A.G.; Eltamaly, A.M.; Alsaud, M.S.; Sayed, K.; Alghamdi, A.S. Sensorless control for PMSM using model reference adaptive system. Int. Trans. Electr. Energy Syst. 2020, 31, 1–11. [Google Scholar] [CrossRef]
  28. Abo-Khalil, A.G.; Eltamaly, A.M.; Praveen, P.R.; Alghamdi, A.S.; Tlili, I. A Sensorless Wind Speed and Rotor Position Control of PMSG in Wind Power Generation Systems. Sustainability 2020, 12, 8481. [Google Scholar] [CrossRef]
  29. Abo-Khalil, A.G.; Alghamdi, A.; Tlili, I.; Eltamaly, A. A Current Controller Design for DFIG-based Wind Turbines Using State Feedback Control. IET Renew. Power Gener. 2019, 13, 1938–1949. [Google Scholar] [CrossRef]
  30. Abo-Khalil, A.G.; Ab-Zied, H. Sensorless Control for DFIG Wind Turbines Based on Support Vector Regression. In Proceedings of the Industrial Electronics Conference IECON, Montreal, QC, Canada, 25–28 October 2012. [Google Scholar]
  31. Abo-Khalil, A.G.; Berrouche, Y.; Barhoumi, E.M.; Baseer, A.M.; Praveen, R.P.; Awan, A.B. A low-cost PMSG topology and control strategy for small-scale wind power generation systems. Int. J. Eng. Sci. Res. Technol. 2016, 5, 585–592. [Google Scholar]
  32. Abo-Khalil, A.G. Impacts of Wind Farms on Power System Stability. In Wind Farm; Intechopen: London, UK, 2013; ISBN 980-953-307-562-9. [Google Scholar]
  33. Abo-Khalil, A.G.; Lee, D.C. Maximum Power Point Tracking Based on Sensorless Wind Speed Using Support vector Regression. IEEE Trans. Ind. Electron. 2008, 55, 678–682. [Google Scholar]
  34. Nuller, K.R.; Smola, A.; Ratrch, G.; Scholkopf, B.; Kohlmargen, J.; Vapnik, V. Predicting time series with support vector machine. In International Conference on Artificial Neural Networks, Lausanne, Switzerland, 8–10 October 1997; Springer: Berlin, Germany, 1997; pp. 999–1004. [Google Scholar]
  35. Schölkopf, B.; Burges, C.J.C.; Smola, A.J. Using support vector support machines for time series prediction. In Advances in Kernel Methods; MIT Press: Cambridge, MA, USA, 1999; pp. 242–253. [Google Scholar]
  36. Abo-Khalil, A.G.; Lee, D.C. SVR-based wind speed estimation for power control of wind energy generation system. In Proceedings of the Power Conversion Conference, Nagoya, Japan, 2–5 April 2007; IEEE: New York, NY, USA, 2007; pp. 1431–1436. [Google Scholar]
  37. Cherkassky, V.; Miller, F. Learning from Data Concepts, Theory and Methods; John Wiley & Sons: New York, NY, USA, 1998. [Google Scholar]
  38. Lee, D.C.; Abo-Khalil, A.G. Optimal efficiency control of induction generators in wind energy conversion systems using support vector regression. J. Power Electron. 2008, 8, 345–353. [Google Scholar]
  39. Eltamaly, A.M.; Al-Saud, M.S.; Sayed, K.; Abo-Khalil, A.G. Sensorless Active and Reactive Control for DFIG Wind Turbines Using Opposition-Based Learning Technique. Sustainability 2020, 12, 3583. [Google Scholar] [CrossRef]
Figure 1. Variable speed tidal generation system block diagram.
Sustainability 13 02223 g001
Figure 2. Tidal turbine power coefficient and tip-speed ratio (TSR) characteristic curve.
Sustainability 13 02223 g002
Figure 3. The maximum power curve depending on rotating speed.
Sustainability 13 02223 g003
Figure 4. DC−link voltage controller and grid reactive power block diagram of grid-side converter.
Sustainability 13 02223 g004
Figure 5. SVR MPPT of tidal energy system process: (a) testing data, (b) offline and online process.
Sustainability 13 02223 g005aSustainability 13 02223 g005b
Figure 6. PMSG overall control block diagram.
Sustainability 13 02223 g006
Figure 7. PMSG experimental setup.
Sustainability 13 02223 g007
Figure 8. Maximum power point tracking for variable water speed (a) tidal current speed, (b) generator speed, (c) generator power, (d) generator q-axis current.
Sustainability 13 02223 g008
Figure 9. Maximum power point tracking for constant water speed (a) tidal current speed, (b) generator speed, (c) generator power, (d) generator q-axis current.
Sustainability 13 02223 g009
Figure 10. Maximum power point tracking for constant water speed (a) tidal current speed, (b) generator speed, (c) generator power, (d) generator q-axis current.
Sustainability 13 02223 g010
Table 1. Parameters of the PM synchronous machine.
ParametersValue
Rated Power2.7 [kW]
Rated speed1200 [rpm]
Number of poles6
Rated current9.5 [A]
Stator resistance0.5 [Ω]
d-axis inductance3 [mH]
q-axis inductance7 [mH]
Flux Linkage0.175 [Wb]
Moment of inertia1.8 × 10−3 [kg.m2]
Publisher’s Note: MDPI stays neutral with regard to jurisdictional claims in published maps and institutional affiliations.