Abstract
The residential sector consumes about 50% of the electricity produced from fossil fuels in Saudi Arabia. The residential energy demand is increasing. Moreover, a simple building energy performance assessment framework is not available for hot arid developing countries. This research proposes an energy performance assessment framework for residential buildings in hot and arid regions, which focuses on three performance criteria: operational energy, GHG emissions, and cost. The proposed framework has been applied to three types of residential buildings, i.e., detached, attached, and low-rise apartments, in five geographical regions of Saudi Arabia. Design Builder® was used to simulate the energy demand in buildings over a whole year. Four types of efficiency improvement interventions, including double-glazed windowpanes, triple-glazed windowpanes, LED lighting, and split air conditioners, were introduced in 12 combinations. Overall, 180 simulations were performed which are based on 12 intervention combinations, three building types, and five regions. Three performance criteria were evaluated for each simulation and then aggregated using a multi-criteria decision analysis method to identify the best intervention strategy for a given building type and a geographical region in Saudi Arabia. Each building type with interventions consumes higher energy in the western, central, and eastern regions and consumes a lesser amount of energy in the southern and northern regions. The proposed framework is helpful for long-term planning of the residential sector.
1. Introduction
The world is facing serious environmental challenges due to massive energy use that are mainly generated from fossil fuels and coal. The global energy use has resulted in environmental consequences such as greenhouse gas emissions (GHG), causing global warming and climate change, air and water pollution, deforestation, and radioactive waste generation. Climate change is not only causing temperature rise but also extreme events, shifting wildlife habitats, rising seas, and melting glaciers [1]. The global sea level has risen from 21 to 24 cm since 1880, and also Arctic sea ice is decreasing at the rate of 13.1% per decade, extending reach 3.92 million square km [2,3].
The building sector is responsible for over 40% of the world’s total primary energy consumption and up to 30% of the total carbon dioxide emissions, indicating that this sector has a major role to play in tackling climate change issues. According to the International Energy Agency (IEA), Saudi Arabia consumed 345.1 TWh of electricity, about 0.5 million barrels of fuel oil per day, and 10.6 billion cubic feet of natural gas per day [4,5]. Energy needs are met from two main energy sources in Saudi Arabia, i.e., oil (51%) and natural gas (49%). The residential sector consumes approximately 50% of the electricity produced from fossil fuel annually [6].
The demand for electricity is rapidly growing in Saudi Arabia. The residential sector is the biggest consumer of electricity, which accounts for 52% of the total national electricity consumption [7]. The residential sector is expected to experience significant growth in the future as the population is rising at a rate of 2.5% per year and only 24% of the Saudi nationals have their own homes. Moreover, around two-thirds of the population is under the age of 30 years, including the young population of the country. The estimation suggested that in order to meet the needs of the growing population, the country has to build 2.32 million new homes by 2020, which is a challenging task. The residential energy demand in Saudi Arabia is increasing because of population growth, high economic growth, heavily subsidized electricity rates, and the high use of air conditioner during summer [6] and is expected to double by the year 2025 compared to that in 2011 [8]. The volume of carbon dioxide emissions from fossil fuels and industrial operations was about 172.85 million tons in 1990 and reached 625 million tons in 2018 in Saudi Arabia [9]. According to the Carbon Dioxide Information Analysis Center, the petroleum products consumption from fossil fuel and industrial processes contribute about 65% of the CO2 emissions [10,11].
Several building energy rating systems are developed in different countries in the last two decades to promote the concept of zero-carbon and zero-energy residences, such as the Building Research Establishment Environmental Assessment Methodology (BREEAM) in UK, Leadership in Energy and Environmental Design (LEED) in US, Comprehensive Assessment System for Built Environment Efficiency (SASBEE) in Japan, Deutsches Gutesiegel Nachhaltiges Bauen (DGNB) in Germany, and Green Stat in Australia [12]. Moreover, sustainable building rating systems, e.g., LEED and Building Owner and Manager Association in Building Environmental Standards (BOMA BEST) are used widely. Both building energy and sustainability rating systems are commonly used for new building construction [13]. However, the major disadvantage of these rating systems is the complexity, high cost, and long-time requirement to conduct an assessment [14,15]. For example, the Energy Star rating system evaluates energy performance based on complex criteria, e.g., 95% Annual Fuel Utilization Efficiency (AFUE) or higher in gas-powered boilers, 90% AFUE or higher in oil-powered boilers, and 97% AFUE or higher in furnace system status [16]. Moreover, Home Energy Rating System (HERS) and EnerGuide rating systems assess energy consumption based on the standard operation assumptions, e.g., the number of occupants, which is an ideal performance evaluation for comparing different new buildings. These rating systems do not consider energy use by home appliances in estimating total energy consumption, which is, in fact, important for better evaluation of the existing buildings [17].
Moreover, geographical region-specific climate conditions have significant effects on the heating and cooling energy demand of residential buildings, affecting energy performance. However, common rating systems such as BOMA BEST use the same benchmark for total energy consumption in every location in Canada. Such a benchmark does not account for the effects of regional climates on energy consumption and its performance [18,19]. Furthermore, many generic frameworks and studies on the energy performance of the public, industry, and residential buildings are available for developed countries. However, there is no particular initiative taken for hot, arid and developing countries, such as Saudi Arabia. In particular, the Saudi Code National Committee (SCNC) had developed energy efficiency standards and programs, such as the National Energy Efficiency Program (NEEP) at the King Abdulaziz City for Science and Technology (KACST) to provide recommendations to meet the country’s goal of improving energy consumption patterns [20,21]. Additionally, the country established the Saudi Energy Efficiency Center (SEEC) to promote energy efficiency for all sectors, including buildings, through education and regulations [12]. SEEC has promoted a new MEPS energy efficiency label for air conditioners and a requirement to install thermal insulation in walls and roofs for all new buildings [21]. Therefore, a relatively simple building energy performance assessment system is required for hot, arid, developing countries.
The priorities for sustainable energy use in buildings can be arranged in increasing order, from energy conservation to energy efficiency to renewable energy [22,23,24,25,26]. The first level or high priority is energy conservation, which incorporates positive changes in occupant behavior in houses, e.g., turning lights off when not needed. The second level is energy efficiency, which focuses on improving the energy performance of appliances to reduce waste, thereby using less input energy to complete the same output task. The goal of efficient energy use is to reduce the amount of energy required for products and services. The final level is the renewable energy that is generated from clean alternative resources, such as solar, wind, and geothermal.
This paper mainly focuses on the energy efficiency strategy for the residential sector in arid countries. This research aims to develop a building energy performance assessment framework considering operational energy use, GHG emissions, and associated cost for hot and arid regions. The framework uses multicriteria decision-analysis (MCDA) methods to estimate the overall performance of various building energy efficiency interventions based on the above-listed criteria. Such framework should incorporate the building energy interventions that are suitable for hot arid regions. The proposed framework will be applied to the residential building sector in Saudi Arabia to demonstrate the effectiveness of this research. Currently, around 7 million residential consumers of Saudi Arabia are connected to the electrical grid, consuming 79% of total energy [27]. This framework can be adopted by municipalities, energy agencies, developers, and policymakers for improving energy efficiency in the residential sector.
2. Methodology
This research has proposed Building Energy Performance Assessment Framework (BEPAF) for residential buildings in hot and arid regions. The framework consists of four steps, namely (1) building energy modeling, (2) intervention analysis, (3) energy simulations, and (4) MCDA methods, as described below in Figure 1.
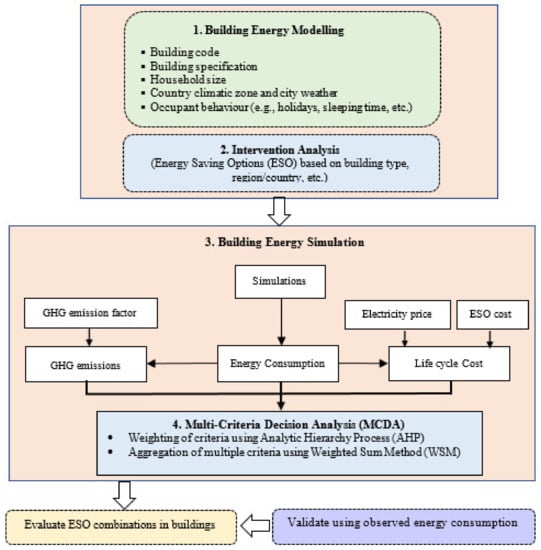
Figure 1.
Building energy performance assessment framework.
2.1. Building Energy Modeling
For the modeling of building energy, 2D diagrams of buildings are obtained and then converted into 3D through Revit [28]. The 3D diagram can be modelled in a Design Builder® software [29]. The building modeling requires data such as floor area, outlet structure, building material, regional elevation, and annual climate data. If the climate and other databases of a specific country or city are not available in Design Builder, a new building specification is required to be developed using the country’s building code, structural design, family size, local climate, and occupant behavior, e.g., holidays, sleeping time, etc. [6].
2.2. Intervention Analysis
Different building interventions for improving energy efficiency referred hereafter as “Energy Saving Options (ESO)” such as LED lights, energy-efficient split A/C, double glazed windows, and triple glazed windows are identified and then applied in the buildings, as described in the Equation (1).
O = (Oi, Oij, Oijk,… Oij…k(N))
Then,
where
O = (Oi, Oij, Oijk, … Oij…k(N−(j+k)))
i = N;
i, j, k is a single intervention number;
if j and k cannot be applied simultaneously, then i = N − (j + k).
2.3. Building Energy Simulations
Both baseline buildings and the buildings with Energy Saving Options (ESO), which are designed in Design Builder are simulated. Baseline energy buildings consume the current level of energy demand over a defined period. The purpose of adding ESO as intervention in the current building energy system is to improve the energy efficiency of the residential buildings.
(a) Energy consumption
The simulation estimates the energy consumed by the buildings in different months of the year. Design-Builder outputs energy use in six different building energy zones (loads), which are summed together to estimate the total operational energy consumption by a building, as shown in Equation (2).
where
E1: room equipment loads;
E2: lighting;
E3: system fans;
E4: heat generation;
E5: cooling generation;
E6: domestic heating water (DHW).
(b) GHG emissions
The GHG emissions due to the operational energy use of a building is estimated as the product of operational energy use and its carbon emission factor specific to a region or country as given in Equation (3) [30].
where
Ei refers to energy use by a specific building zone;
EF is carbon emission factor.
(c) Life cycle cost
The cost estimation includes the cost of operational energy consumption by buildings (each baseline building and ESO building) and the capital cost of ESO. The cost of the operational energy use in both baseline and ESO buildings is estimated by using electricity price and the energy consumed based on the literature. Similarly, the capital cost of ESO is obtained from the relevant manufacturers. All the costs are expressed in net present value (NPV) of electricity use and ESO cost as given in Equation (4) [31].
NPV of Energy use = Energy use × (Price)npv
where
i is discount rate;
t is number of years;
N is total planning duration (years);
Rt is net cash flow at time t.
2.4. Multicriteria Decision Analysis (MCDA)
Multicriteria decision analysis (MCDA) provides a systematic approach to evaluate the input criteria to build a rational decision and select the best alternatives [32,33]. MDCA reduces biases associated with decisionmakers in the energy supply system, planning, and management [34]. In this study, the major criteria of energy performance such as total energy consumption, related GHG emissions, and cost can be used to evaluate energy performance using MCDA as follows.
(a) Weighting
Analytic Hierarchy Process (AHP), a common technique, can be used for generating weights of the selection criteria. AHP is a subjective weighting method, which compares each criterion against all others. AHP was developed by Saaty, which is based on the relative importance of pairwise comparison and can be calculated by geometric mean method, characteristic root method, or least square method [35]. AHP transforms qualitative pairwise comparison to quantitative weights as given in Equation (5) [35] and Table 1.

Table 1.
The Analytic Hierarchy Process (AHP) pairwise comparison scale.
First Step: A pairwise comparison matrix of n × n based on the relative importance of each criterion is prepared. Then, the geometric means for each criterion is calculated. A sample comparison matrix is given in Appendix A.
Second Step: The relative contribution, i.e., weight of each criterion, is calculated using the geometric means in the pairwise comparison matrix as given in Equation (5).
where, aij is a geometric mean for each criterion (refer to Appendix A for detail).
Third Step: The consistency verification is performed as follows:
- i.
- Calculate the maximum eigenvalue ;
- ii.
- Calculate the consistency index as describe in Equation (6);
- iii.
- Calculate consistency ratio as describe in Equation (7);where RI is given random index. If CR > 0.1, the comparison matrix is inconsistent.
(b) Aggregation
The weighted sum method (WSM) as a MCDA method is used to aggregate the criteria, i.e., energy consumption, GHG emissions, and cost for each option and then rank all alternatives [36]. WSM is a widely used method in MCDA. It is the method that can be applied into single-dimensional cases as well as multidimensional problems. This method simply finds the best alternative with the highest value of the priority score (P*) based on “A” number of alternatives and “C” number of criteria. The priority score is calculated using Equation (8) [34,37].
where
is the priority score of the best alternative;
is the normalized value of the ith in terms of the jth decision criteria;
is the importance weight of the jth criteria;
2.5. Case Study
A framework is developed for assessing the energy performance of residential buildings in hot and arid regions. The framework considers energy consumption, GHG emissions, and the related cost. The developed framework was applied to the Kingdom of Saudi Arabia as a case study.
2.5.1. Study Area
The residential buildings of Saudi Arabia are classified into six types: (a) Traditional house, (b) Floor in traditional house, (c) Villa, (d) Floor-in-villa, (e) Apartment, and (f) Other houses [38]. In this research, we considered three residential building types: (1) Detached residential building containing villa and floor-in-villa; (2) Attached residential building containing a traditional house, a floor in a traditional house, and other houses; and, finally, (3) Low-rise apartment buildings as shown in Table 2. The total number of residential buildings in Saudi Arabia are ~5,446,910, which has an average household size of 5.97 in 2018 [39]. The residential buildings are distributed with the highest percentage of 24.96% in the western region, following by 23.68% in the central region, 14.31% in the eastern region, 8.55% in the southern region, and finally 3.37% in the northern region (Table 2).
Table 2.
Residential building distribution by housing type in Saudi Arabia.
Saudi Arabia predominantly has hot climate characterized by extreme aridity and heat, with an average annual rainfall of 93.5 mm recorded during the period from 1979 to 2009 [40,41] and five major geographical regions, which cover the Kingdom of Saudi Arabia. The annual temperature and altitudes of each region are given in Table 3 [42].
Table 3.
Climatic and geographical factors in various regions of Saudi Arabia.
2.5.2. Building Energy Modeling
Three types of common residential buildings: detached buildings, attached buildings, and low-rise apartment buildings, were considered, which suites local architectural and construction practices. The 2D models of the representative buildings were obtained from the local architectural company. These 2D models were converted into 3D models by using Revit software. These 3D models are input to Design Builder software. The layout plan and highlighted the parameters of the building envelope are shown in Figure 2.
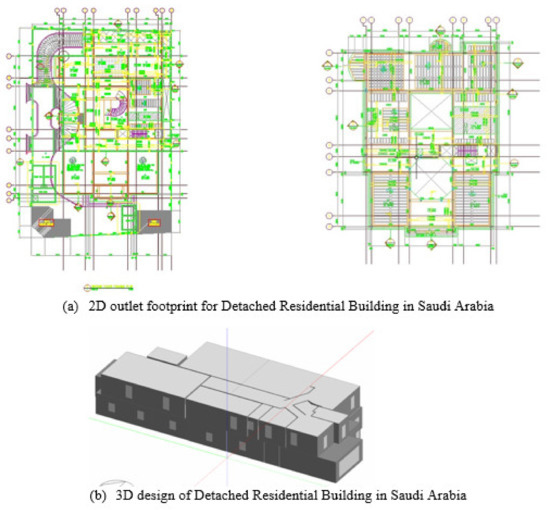
Figure 2.
Illustration of layout plan in 2-D and 3-D.
The key parameters are taken into consideration as follows:
- The household activity is the buildings considered to be inactive from 8:00 a.m. to 4:00 p.m. from Sunday to Thursday because the residents are out of the house during working hours [43];
- Occupant activities that have been considered in the house are computer activity by 0.2787 W/ft2, miscellaneous by 0.4645 W/ft2, and catering by 0.5 W/ft2;
- Climatic and geographical data are collected from literature as shown in Table 5;
- The average area of low-rise apartment attached residential, and detached residential buildings are assumed to be 350, 450, and 850 m2, respectively.
2.5.3. Building Energy Interventions
Building interventions were applied by replacing conventional building components by energy-efficient components, which are also referred to as Energy Saving Options (ESO) as reported in the literature such as [21,44,45]. The following energy efficiency interventions (ESO) were applied:
- (a)
- ESO0: Baseline Residential Building (Without Energy Saving Options);
- (b)
- ESO1: Replace a single pane window with an energy-efficient double-glazed pane [46,47];
- (c)
- ESO2: Replace a single pane window with an energy-efficient triple-glazed pane [48,49];
- (d)
- ESO3: Replace fluorescent lamps with LED lights [45,50,51];
- (e)
- ESO4: Replace a window air-condition with energy-efficient ductless split air conditioner [52,53].
Each ESO intervention and ESO combinations affect the building energy performance in different ways. Altogether 12 combinations of ESOs were considered under three categories: One-Intervention-Combination (One-IC), Two-Intervention-Combinations (Two-IC), and Three-Intervention-Combination (Three IC). The combinations are one-IC: ESO1, ESO2, ESO3, and ESO4; Two-IC: ESO13, ESO14, ESO23, ESO24, and ESO34; and three-IC: ESO134 and ESO234 as formulated in Equation (9). These 12 combinations for each of the three types of residential buildings in five regions produce 180 different buildings. The stated building combinations for each region is shown in Figure 3. The description of developing intervention combinations using Equation (10) is expanded upon below.
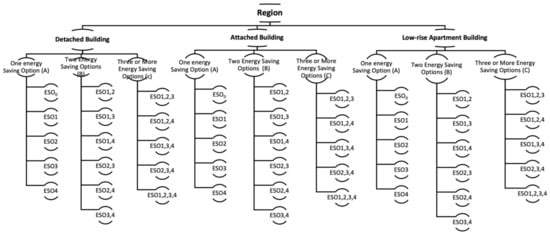
Figure 3.
Tree diagram showing intervention combinations in each region.
Oi = Oi
Oij = Oi, Oj, (Oi+Oj)
Oijk = Oi, Oj, Ok, (Oi+Oj), (Oi+Ok), (Oj+Ok), (Oi+Oj+Ok)
Oijkl = Oi, Oj, Ok, Ol, (Oi+Oj), (Oi+Ok), (Oi+Ol), (Oj+Ok), (Oj+Ol), (Ok+Ol), (Oi+Oj+Ok), (Oi+Oj+Ol), (Oj+Ok+Ol), (Oi+Oj+Ok+Ol)
Thus, i = N
O = (Oi, Oij, Oijk, … Oij… k (N))
If j and k cannot be applied simultaneously, then i = N−(j + k).
Then,
O = (Oi, Oij, Oijk, … Oij… k (N−(j+k)))
Which means in this research, e.g., it cannot be simulated and installed (double and triple glazed windows) to improve the energy performance.
Oi = Oi
Oij = Oi, Oj, (Oi+Oj)
Oijk = Oi, Oj, Ok, (Oi+Oj), (Oi+Ok)
Oijkl = Oi, Oj, Ok, Ol, (Oi+Oj), (Oi+Ok), (Oi+Ol), (Oj+Ol), (Ok+Ol), (Oi+Oj+Ol), (Oi+Ok+Ol)
2.5.4. Energy Simulations and Performance
All 180 buildings were modeled and simulated in DesignBuilder [29]. Based on the simulation, annual energy consumption was estimated. Based on the energy use, carbon emissions were estimated as the product of energy (electricity) use and the GHG emission factor of electricity for each building. The GHG emission factor of the electricity of Saudi Arabia is 0.755 kg CO2e/kWh [6].
2.5.5. Cost of Energy and Building Intervention
The total cost was estimated as the sum of energy cost and capital cost of interventions. The costs of energy and intervention were expressed in Net Present Value (NPV) considering a period of 30 years. The electricity tariffs price for the residential sector was USD 0.0479 per kwh in Saudi Arabia. The rate of increase of electricity in Saudi Arabia was 0.038% per year [54,55]. For the calculation of NPV, the average discount rate for investment in generic energy technology in Saudi Arabia is estimated as 1.85% [56,57] The cost of the capital investment in Energy Saving Options (ESOs) in different buildings was calculated based on the unit cost given in Table 4. The unit cost of double-glazed intervention and the triple-glazed intervention was based on a unit area. Similarly, the required numbers of LED lights of particular capacity (power) were calculated by dividing the estimated total lumens by the specific lumen of each LED light (particular power). The total lumen was estimated by multiplying average candles per foot and area of the room in square meters [58,59]. Additionally, the cost of ductless split system intervention was estimated based on the required BTU per hour for the specific room area (Appendix B). In this research, the price of the split systems of different BTU per hour was used as an average of the price of LG, Fuji, Samsung, Gree, and Craft as shown in Table 4.
Table 4.
Unit cost of interventions.
Using the unit cost given in Table 4, the estimated cost of each ESO combination in each building type is given in Table 5. The ESO cost of each building type was the same in all the regions.
Table 5.
Estimation cost for ESO combinations for each building types in all regions.
2.5.6. Weighting Scenarios
The weights of energy consumption, GHG emissions, and cost, were estimated using AHP. Two scenarios: pro-economic and pro-environmental scenarios were considered. The pro-economic scenario gives the highest weightage to economy considering Cost (7 times) > Energy, Cost (3 times) > GHG, and GHG (3 times) > Energy. The pro-environmental scenario considers the highest weightage to environment assuming Energy (seven times) > Cost, Energy (five times) > GHG, and GHG (three times) > Cost [72]. The comparison matrix generated by AHP and the estimated weights are shown in Table 6. The values of criteria and their weights were aggregated using the weighted sum method.
Table 6.
Comparison matrix and estimated weights in different scenarios.
2.5.7. Statistical Analysis
Building energy consumption is not normally distributed. For the non-normally distributed data, Friedman’s Two-Way Analysis Variance by ranks was tested to evaluate the significance of the difference in building energy consumption by ESO types and building types under each One-IC, two-IC, and three-IC [73]. If energy consumption was normally distributed, parametric analysis of variance (ANOVA) could be conducted.
3. Results and Discussion
The performance of energy consumption by 180 different types of residential buildings, which are of 12 combinations for each of three types of residential buildings in five regions, are discussed below.
3.1. Building Energy Consumption and GHG Emissions
3.1.1. Baseline Zonal Energy Consumption Pattern
The energy consumption by different building zones: room electricity, lighting, system fans, heating, cooling, and domestic hot water (DHW) in three building types (detached, attached, and low-rise apartment) for ESO0 in five regions of Saudi Arabia is shown in Figure 4. The highest energy is consumed by the cooling zone in all types of buildings in all regions. This may be attributed to hot and dry climate of the country [41], and each building uses a traditional air conditioner to maintain room temperature. The cooling zone consumes the energy ranging from 60.9% in an apartment in the northern region to 68.7% in the detached building in the eastern region. Among the three building types, the detached building has the highest energy consumption in almost all regions because the building size is almost double of the attached building and more than double in a low-rise apartment building. The second-largest energy consumer is lighting. Lighting consumes energy ranging between 9.1% in the detached building in the eastern region to 17.9% in the attached residential building in the southern region. Similarly, the room electricity, the third-highest energy consumer, uses electricity ranging between 7.7% in the detached building in the eastern region to 13.8% in the attached in the southern region. However, the system fans consume the least energy, which is less than 1% in every building in each region.
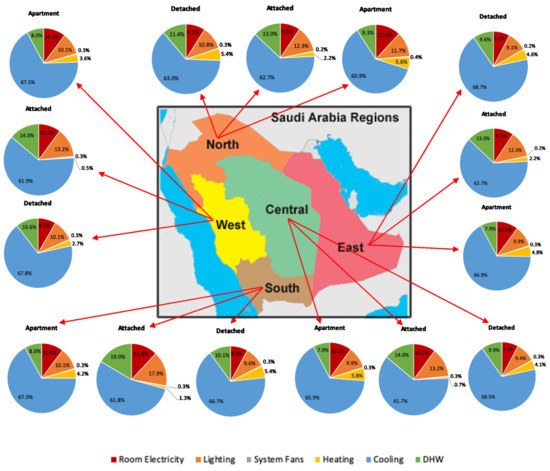
Figure 4.
Energy consumption pattern in buildings under ESO0 in different regions of Saudi Arabia.
3.1.2. Baseline Total Energy Consumption
The total energy consumption by each building in five regions for ESO0 is shown in Figure 5. The results show that the detached residential building consumes the highest total energy among the three building types in all regions ranging from 158 MWh/yr in the northern region to 186 MWh/yr in the eastern region. This is mainly due to the fact that the size of the detached building (850 m2) is approximately double of the attached building (450 m2) and more than double of apartment size (350 m2). The attached residential building consumes the lowest total energy among the three building types ranging between 56 MWh/yr in the southern region to 82 MWh/yr in the northern region, which may be due to smaller building size (apartment and attached building) and colder regions (southern and northern) [40,41].
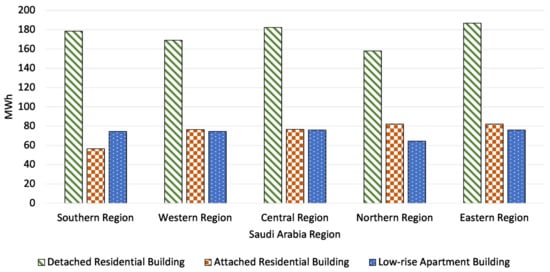
Figure 5.
Energy consumption by each building with ESO0 in different regions.
Figure 6 shows the total energy consumed by all buildings of three types of houses in five regions. The results show that the central region has the highest energy consumption with an average of 39.4 ± 28.7 TWh and the northern region has the lowest energy use with an average of 4.7 ± 1.6 TWh in the northern region. This may be because currently, the central region has the largest number (1.73 million) of buildings with the highest proportion (54%) of the detached buildings that are the highest energy consuming building type. Similarly, the northern region has the lowest number of buildings with the lowest proportion (5%) composed by detached buildings.
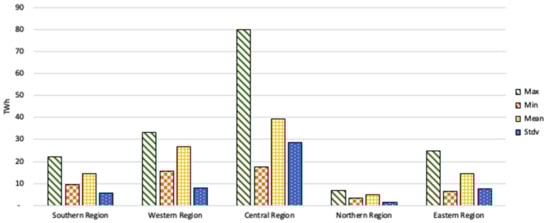
Figure 6.
Statistical summary of energy consumption in ESO0 by regions.
3.1.3. Zonal Energy Saving by Building Interventions
The energy-saving in different building zones in various ESO and their combinations are almost similar in all regions as shown in Figure 7. The total energy saving percentage in the detached residential building can be achieved between 11% in the western and the northern regions to 15% in the central region. In the attached residential building, the total energy saving percentage ranges between 8% in the southern region to 10% in the northern and eastern regions. Moreover, the total energy saving percentage in the low-rise apartment building ranges from 6% in the southern region to 11% in the eastern region.
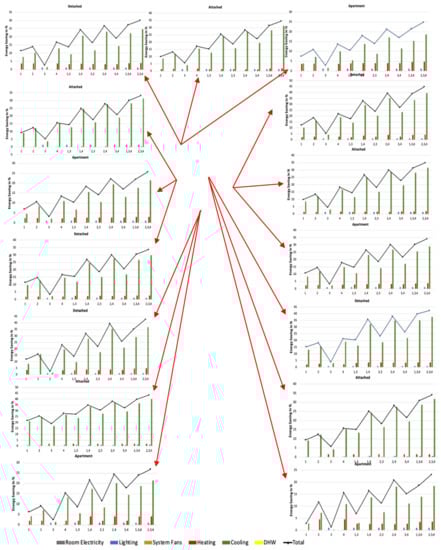
Figure 7.
Zonal energy saving in each building type with different ESOs in all regions.
The intervention using double-glazed windowpanes (ESO1) increases building insulation, which reduced heating load from 1% to 4% and cooling load from 5% to 13% in all building types in all regions. Due to this, ESO1 has reduced the total energy consumption by about 3% to 15% compared to baseline (ESO0) in all types of buildings, as given in Figure 8. This is supported by other study findings that show a saving of 12.5% to 16% of residential building energy consumption by double-glazed windowpanes in hot climates [46,47]. Similarly, the use of triple-glazed windowpanes (ESO2) increases insulation more than double-glazed panes, which reduced total energy consumption by about 9% to 19% compared to baseline (ESO0) in all types of building in all regions, as given in Figure 8. Similar results are obtained by S. Li et al. (2018) in the triple-glazed window filled with phase change material (PCM), which increases energy savings from 21.3% to 32.8% in hot climates [49]. Triple-glazed panes increased the reduction of cooling load from 7% to 25%. However, triple-glazed panes reduced heating load from 0.5% to 3.7% only, which is lower than that in double-glazed panes. He, Ng, Hossain, and Skitmore (2019) also obtained a reduction in heating load in triple-glazed panes, lower than that in double-glazed windows, similar to our findings [48].
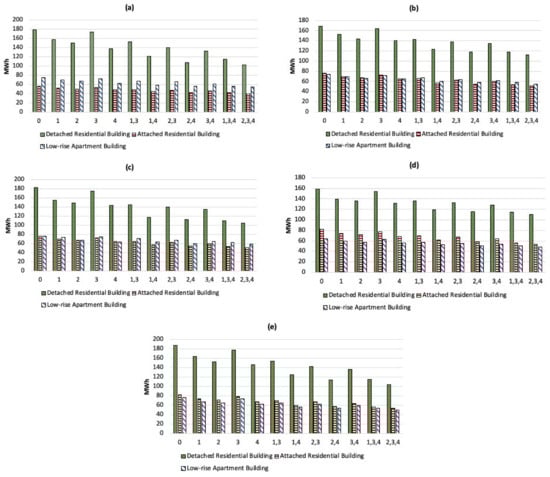
Figure 8.
Energy consumption by each building with different ESO in (a) southern (b) western (c) central (d) northern (e) eastern regions.
In ESO3, the results show that LED lighting decreased lighting energy by 10% to 15% compared to traditional light used in ESO0. This is so because LED lighting is more energy-efficient and saves up to 25% or more energy compared to fluorescent lights [50,51]. Overall, LED lighting has decreased the total building energy consumption from baseline by about 1% to 6% in all buildings in all regions as given in Figure 7. The comparatively lower energy saving by LED lighting in an entire building is attributed to a lower energy load of 9.4% to 17.9% by lighting in buildings. LED lighting decreased specifically lighting load by about 1.0% to 1.7% and cooling load by 1.5% to 4.3% in an entire building in all the regions. This is because LED lighting affects both cooling and heating loads [45]. Similarly, a split air conditioner (ESO4) decreases heating load by 1% to 5% and cooling load by 11% to 27% considering all buildings in all regions. Cumulatively, the split air conditioner, i.e., ductless heating and cooling system, reduce the total building energy consumption by 13% to 23% compared to the baseline in all types of buildings in regions as given in Figure 7. This is because the certified mini-split air conditioner consumes about 30% less energy compared to a traditional air conditioner [52,53].
The energy consumption by a building is significantly different by building types and ESO types under one-IC (p = 0.000), two-IC (p = 0.000), and three-IC (p = 0.000) due to which the energy saving is also highly variable. The order of energy saving in one, two, and three-IC in buildings in all regions are: ESO3 < ESO1 < ESO2 < ESO4 for one-IC; ESO13 < ESO23 < ESO34 < ESO14 < ESO24 for two-ICs and ESO134<ESO234 for three-ICs. However, comparing all at once, the orders are different in various buildings and regions due to the interaction of regional climate with building types as follows:
- (a)
- ESO3 < ESO1 < ESO2 < ESO13 < ESO4 < ESO23 < ESO34 < ESO14 < ESO24 < ESO124 < ESO234 for the detached buildings in the western and central; for the attached residential buildings in the southern, western, central, and northern regions as well as for the apartment in the eastern region.
- (b)
- ESO3 < ESO1 < ESO13 < ESO2 < ESO23 < ESO4 < ESO34 < ESO14 < ESO134 < ESO24 < ESO234 for the detached buildings in the southern and northern regions and for the apartment in the southern region
- (c)
- ESO3 < ESO1 < ESO13 < ESO2 < ESO4 < ESO23 < ESO34 < ESO14 < ESO134 < ESO24 < ESO234 for the detached buildings in the eastern region and for the apartment in the western and northern regions
- (d)
- ESO3 < ESO1 < ESO13 < ESO23 < ESO2 < ESO34 < ESO4 < ESO14 < ESO134 < ESO24 < ESO234 for the apartment in the central region
- (e)
- ESO3 < ESO1 < ESO2 < ESO13 < ESO23 < ESO4 < ESO34 < ESO14 < ESO24 < ESO134 < ESO234 for the attached residential buildings in the eastern region
The comparison of all intervention combinations shows that one-IC such as ESO2 is more efficient than ESO13 and ESO4 is more efficient than two-ICs ESO13 and ESO23. This is because ESO1 and ESO3 save only 3% to 15% and 1% to 6%, respectively. However, ESO2 and ESO4 save from 11% to 19% and 13% to 23%, respectively. ESO3 has the least building energy saving, whereas ESO4 has the highest building energy saving.
3.2. Energy Performance with Intervention Combinations
3.2.1. Total Energy Consumption
The energy consumption by each building with each ESO in three building types in all five regions is given in Figure 8. In general, energy consumption decreased from ESO1 to ESO234 due to cumulative addition of a number of interventions (ESO). Similarly, the detached buildings consumed the highest amount of energy in all ESO combinations in all regions, mainly because a detached residential building has the largest area (850 m2) per building, whereas an attached building (450 m2) and apartment (350 m2) have smaller areas considered in this study.
Figure 8a–e show that the attached buildings with ESO234 have the lowest annual energy consumption of 40, 51, and 51 MWh in the southern, western, and central regions, respectively, among three building types. However, the detached buildings with ESO3 have the highest energy consumption of 174, 163, 175 MWh in the southern, western, and central regions, respectively, among the three building types. Similarly, Figure 8d,e shows that in the northern and eastern regions, the lowest annual energy is consumed by an apartment building with ESO234 with 48 and 50 MWh, respectively, among three building types. At the same time, the highest annual energy is consumed by the detached building with ESO3 with 154 and 177 MWh in the northern and eastern regions, respectively. Among the regions, each building type with ESO consumes higher energy in the western, central, and eastern regions and consumes a lesser amount of energy in the southern and northern regions. This may be attributed to local climates as shown by the lowest mean temperatures in the southern (18.9 °C) and northern (24.7 °C) regions compared to western (27.9 °C), eastern (25.8 °C), and central (25.1 °C) regions [42].
Figure 9 shows the total energy consumption by all types of buildings in all regions for each ESO if the same ESO is applied to all building types throughout the country. ESO234 consumes the least energy (192.5 TWh per year), i.e., 35.6% energy saving, whereas ESO3 consumes the highest energy (284.7 TWh), i.e., 4.7% energy saving compared to ESO0.
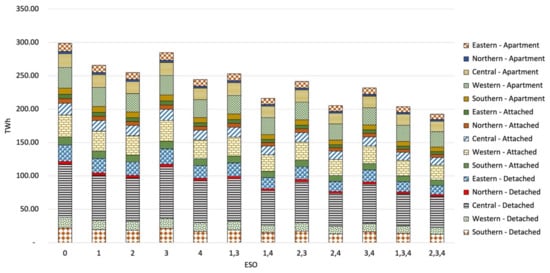
Figure 9.
Total energy consumption in different ESO combinations for different building.
This research shows that the total energy use in the residential buildings under ESO0 in Saudi Arabia is 296.75 TWh in 2018 based on the simulation. This estimate is comparable with the actual total energy use of 259.8 TWh by the residential buildings in the same year as provided by the Saudi Electricity Company (SEC) in 2018 [74].
3.2.2. Total GHG Emissions
The GHG emissions by three building types with different ESO combinations in each region is shown in Figure 10. The total GHG emissions are the product of total energy consumption (Figure 8) and GHG emission factor. The detached residential buildings produce the largest GHG emissions in southern, central, and eastern regions because the detached building is the largest energy consuming building type as per Figure 10, and the number of buildings is also larger in these regions. The attached and apartment buildings produce a similar amount of total GHG emissions in the western region, which is higher than the detached buildings because the total number of attached and apartment buildings are very larger than the detached buildings. Similarly, the attached buildings produce the highest GHG emissions in the northern region because they have the highest number of buildings. The GHG emissions also follow the same pattern of energy use as the energy source is the only one, i.e., electricity. When the source of energy is different in various buildings and regions, the GHG emissions pattern may be different than the energy use pattern for various buildings and regions.
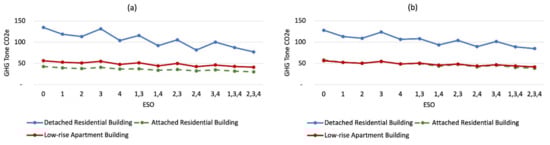
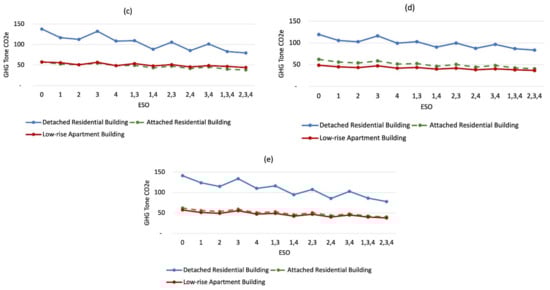
Figure 10.
GHG emissions by each building with different ESO in (a) southern (b) western (c) central (d) northern (e) eastern regions.
3.2.3. Life Cycle Cost
The sum of the cost of energy use and interventions is used to estimate the total cost for each ESO and is expressed in NPV. The total cost of ESO in different building types in all regions is shown in Figure 11a–e. Higher the cost of building ESO combinations, higher energy use, and a larger number building lead to a higher total cost. The results show that the detached buildings have the highest total cost in each intervention combination primarily because the detached building has the highest building area causing the highest energy use. However, in the detached buildings, the total cost generally decreases from ESO0 to ESO234 in all the regions because the annual energy consumption generally decreases in the same order ESO234 being the lowest energy consumer among all types of ESO combinations. The minimum to the maximum range of ESO combinations based on the total cost for each building type in each region is shown in Table 7.
Figure 11.
Total cost of ESO of each building type in (a) southern (b) western (c) central (d) northern (e) eastern regions.
Table 7.
Range of ESO based on the total cost.
The total cost is based on the individual cost of ESO combinations (Table 6) and their number of buildings (Table 2), total energy use (Figure 10), and electricity tariffs price, as shown in Figure 12.
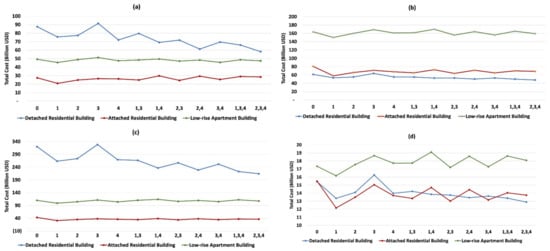
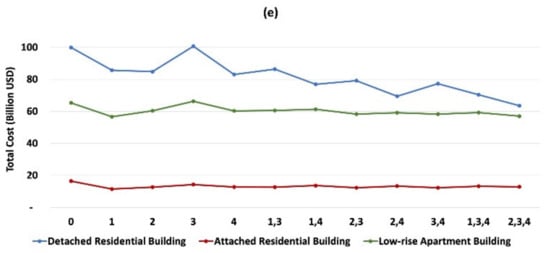
Figure 12.
Total cost for all building types in (a) southern (b) western (c) central (d) northern (e) eastern regions.
3.2.4. Energy Performance Assessment
The overall performance of building energy use is assessed by aggregating three criteria: energy, GHG emission, and cost using the weighted sum method considering two scenarios: pro-economic and pro-environment. The priority scores of each ESO combination in each region is shown in Figure 13a–e for the pro-economic scenario and in Figure 13f–j for pro-environmental scenarios. Based on Figure 13, the best ESO combination in each building type in each region under each weighting scenario is summarized in Table 8. Based on the estimated priority scores, ESO234 is the best option among all ESO combinations in each building type in all regions under the pro-environmental scenario. Under the pro-economic scenario, the same ESO234 is the most preferable among all ESO in each building type except in the attached residential buildings in the southern and western regions, where ESO1 is the best option as ESO1 has the lowest total cost in the attached residential building as shown in Figure 11a,b.
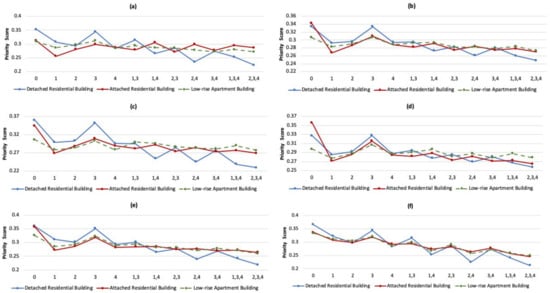
Figure 13.
Priority scores of ESO combination in (a) southern, (b) western, (c) central, (d) northern, and (e) eastern under pro-economic; (f) southern, (g) western, (h) central, (i) northern, and (j) eastern under pro-environmental.
Table 8.
Best energy saving options in each building type in different regions.
The best options under one-IC, two-IC, and three-IC are shown in Table 8. In the pro-economic scenario, ESO1 is the best option in each building type in many regions under one-IC. Under two-IC, ESO24 and ESO34 are the best options in each building type in many regions. Under three-IC, ESO234 is the best ESO in all building types in all regions. In the pro-environmental scenario, ESO4, ESO24, and ESO234 are the best combinations under one, two, three-IC, respectively, in all building types in all regions.
3.2.5. Overall Discussion
The proposed framework has considered three major criteria: energy consumption, GHG emissions, and associated cost for assessing the overall performance of building energy. The energy consumption and related GHG emissions assess the environmental performance, whereas the cost evaluates the economic performance. The three criteria assess the holistic performance of building energy use. The framework makes it simple and computationally less demanding for building energy performance assessment. Moreover, the framework has considered zonal energy use, such as room electricity, lighting, system fans, heating, cooling, and domestic hot water of building’s total energy use. The consideration of zonal energy use made it more practical and region-specific because building zones are the ultimate energy consumers that differ with respect to buildings if the total energy vary by building. For example, ESO4 can alternatively consider increasing the set window air-conditioner temperature, e.g., 20 to 22 °C as an energy conservation option to decrease energy consumption for an air-conditioner without replacing it with the energy-efficient split air conditioner of buildings. However, this research considered a split air conditioner option as this option is the most common measure in the country [75]. It shows this research considered practical interventions for the buildings in hot arid regions so as to make study as practicable as possible. In addition, the research considered that relative changes in the costs of different interventions will be due to a discounting factor only in future. Additionally, the discount rate considered in this study may vary with time, which can affect the life cycle cost of each building and its interventions. However, the change will affect all the costs monotonically. The framework is an initial step to enhance energy efficiency and reduce GHG emissions and cost in different residential building types in various regions. The application of the proposed framework will help to evaluate the baseline energy performance of residential buildings. Moreover, this framework can be used to select the cost-effective Energy Saving Options (ESO) in different residential buildings and help reduce energy consumption and GHG emissions at the residential level. The proposed framework is generalizable and can be used in other countries too. Furthermore, additional research can be conducted to identify the best GHG emission reduction strategy considering renewable energy and government–community collaboration for reducing GHG emissions. Additionally, the proposed framework can be extended to include the qualitative aspect, such as human behavior in energy conservation for assessing energy performance. Additionally, the location-specific intervention cost data and other uncertainties can be included in the performance assessment in future research.
4. Conclusions
The proposed building energy performance assessment framework for hot and arid regions has been applied to Saudi Arabia as a case study, considering three types of residential buildings: detached, attached, and low-rise apartments in five geographical regions. Based on energy consumption, generally, energy saving energy options (ESO) have the most energy-saving percentage in the detached residential buildings in various regions. Among the regions, each building type with ESO consumes higher energy in the western, central, and eastern regions and consumes a lesser amount of energy in the southern and northern regions. Considering all building interventions for all regions, ESO4, ESO24, and ESO234 have the least energy consumption under one-IC, Two-IC, and three-IC, respectively for the detached and apartment buildings in the northern region and for the attached buildings in the eastern region. Moreover, the ESO3, ESO13, and ESO134 have the highest energy consumption under one-IC, Two-IC, and three-IC, respectively for the detached and apartment buildings in the western region and for the attached buildings in the central region. The GHG emissions also follow the same pattern of energy use as the energy source is the same. Based on the total cost, ESO234 in the northern region is the most economic intervention for all building types, whereas ESO3 in the eastern region is the least economic intervention in the detached residential buildings among all regions. Similarly, ESO1 in the northern region is the most economic intervention, whereas the total cost is highest for ESO14 in the western region in the attached residential building among all regions. Additionally, the ESO1 in the northern region is the most economic intervention, whereas the highest total cost is ESO14 in the western region in the detached residential building among all regions.
Aggregating all the criteria using the developed framework, in the pro-economic scenario ESO1 is the best combination under one-IC for each type of building; ESO24 and ESO34 are the best combinations under two-IC and ESO234 is the best combination under three-IC in all building types in all the regions. Moreover, in the pro-environmental scenario, ESO4, ESO24, and ESO234 are the best combinations under one, two, and three IC, respectively. The framework is an initial step to improve energy efficiency and reduce GHG emissions in different residential building types in various regions. The proposed framework can be used to evaluate the baseline energy performance of residential buildings and select the cost-effective Energy Saving Options (ESO) for different types of residential buildings. Furthermore, additional research can be conducted to identify the best GHG emission reduction strategy considering renewable energy and government–community collaboration for reducing GHG emissions.
Author Contributions
M.A. developed a conceptual framework, collected data, modelled buildings, performed simulations and data analysis, and prepared an initial draft of the paper. G.C.-S. contributed to the development of the methodology, data analysis, and paper writing. R.R. contributed to conceptual framework development and refinement of the paper, K.M.N. assisted in the refinement of the paper, K.H. contributed to refine the conceptual framework and methodology, and R.S. contributed to the conceptualization and refinement of the data analysis and conclusions. All authors have read and agreed to the published version of the manuscript.
Funding
This research received no external funding.
Institutional Review Board Statement
Not applicable.
Informed Consent Statement
Not applicable.
Acknowledgments
The authors gratefully acknowledge the financial support from the King Abdullah Bin Abdullaziz Scholarship Program. This research would have not been possible without the support of the Life Cycle Management Laboratory team at the University of British Columbia Okanagan campus.
Conflicts of Interest
The authors declare no conflict of interest.
Appendix A. Sample Comparison Matrix
| E | G | C | Geometric Mean (aij) | |
| E | 1 | E/G | E/C | Geomean (1, E/G, E/C) |
| G | G/E | 1 | G/C | Geomean (G/E, 1, G/C) |
| C | C/E | C/G | 1 | Geomean (C/E, C/G, 1) |
where, n is number of criteria, E: Energy, G: GHG, and C: Cost.
Appendix B. Determination of Air Conditioner Capacity
The following table is an approximate estimation of the required cooling capacity of a cooling system to effectively cool a room/house based on the square footage of the room/house [52].
| Area to Be Cooled (ft2|) | Required Capacity (BTU/h) |
| 100 to 150 | 5000 |
| 150 to 250 | 6000 |
| 250 to 300 | 7000 |
| 300 to 350 | 8000 |
| 350 to 400 | 9000 |
| 400 to 450 | 10,000 |
| 450 to 550 | 12,000 |
| 550 to 700 | 14,000 |
| 700 to 1000 | 18,000 |
| 1000 to 1200 | 21,000 |
| 1200 to 1400 | 23,000 |
| 1400 to 1500 | 24,000 |
| 1500 to 2000 | 30,000 |
| 2000 to 2500 | 34,000 |
References
- National Geographic. Causes and Effects of Climate Change. Christina Nunez. 2019. Available online: https://www.nationalgeographic.com/environment/global-warming/global-warming-causes/ (accessed on 17 January 2019).
- Lindsey, R. Climate Change: Global Sea Level. In Climate Government; 2021. Available online: https://www.climate.gov/news-features/understanding-climate/climate-change-global-sea-level (accessed on 25 January 2021).
- NASA. Arctic Sea Ice Minimum. In Global Climate Change NASA; 2021. Available online: https://climate.nasa.gov/vital-signs/arctic-sea-ice/ (accessed on 9 February 2021).
- International Energy Agency. Energy in Saudi Arabia. 2018. Available online: https://www.iea.org/countries/saudi-arabia (accessed on 1 January 2018).
- U.S. Energy Information Administration. Saudi Arabia Used Less Crude Oil for Power Generation in 2019. Available online: https://www.eia.gov/todayinenergy/detail.php?id=39693 (accessed on 3 June 2020).
- Alhashmi, M.; Haider, H.; Hewage, K.; Sadiq, R. Energy efficiency and global warming potential in the residential sector: Comparative evaluation of Canada and Saudi Arabia. J. Archit. Eng. 2017, 23, 04017009. [Google Scholar] [CrossRef]
- Alrashed, F.; Asif, M. Prospects of renewable energy to promote zero-energy residential buildings in the KSA. Energy Procedia 2012, 18, 1096–1105. [Google Scholar] [CrossRef]
- Yousef, A.; Paul, S. The cost of domestic energy prices to Saudi Arabia. Energy Policy 2011, 39, 6900–6905. [Google Scholar]
- Tiseo, I. Carbon dioxide emissions from fossil fuel and industrial purposes in Saudi Arabia from 1990 to 2018. Statista. 2020. Available online: https://www.statista.com/statistics/486065/co2-emissions-saudi-arabia-fossil-fuel-and-industrial-purposes/ (accessed on 17 November 2020).
- CDIAC. Saudi Arabia Fossil-Fuel CO2 Emissions. In Carbon Dioxide Information Analysis; 2012. Available online:https://cdiac.ess-dive.lbl.gov/trends/emis/tre_sau.html (accessed on 26 September 2012).
- EPA. Global Greenhouse Gas Emissions Data. In Environment Protection Agency; 2020. Available online: https://www.epa.gov/ghgemissions/global-greenhouse-gas-emissions-data (accessed on 10 September 2020).
- Asif, M. Growth and sustainability trends in the buildings sector in the GCC region with particular reference to the KSA and UAE. Renew. Sustain. Energy Rev. 2016, 55, 1267–1273. [Google Scholar] [CrossRef]
- Natural Resources Canada. Canada Doubles Government Investment in Clean Energy Research and Development; Natural Resources Canada: Ottawa, ON, Canada, 2016. [Google Scholar]
- Indian Green Building Council. IGBC Green Existing Buildings O&M; Confederation of Indian Industry: Hyderabad, India, 2015. [Google Scholar]
- Namini, S.B.; Shakouri, M.; Tahmasebi, M.M.; Preece, C. Managerial sustainability assessment tool for Iran’s buildings. Proc. Inst. Civ. Eng. Eng. Sustain. 2014, 167, 12–23. [Google Scholar] [CrossRef]
- Energy Star. United States Environmental Protection Agency—Office of Air and Radiation; Proceedings of the Water Environment Federation: Washington, DC, USA, 2018. [Google Scholar]
- Gamalath, I.M. Energy Performance Assessment for Existing Multi Unit Residential Buildings; University of British Columbia: Okanagan, BC, Canada, 2017. [Google Scholar]
- Li, D.H.W.; Yang, L.; Lam, J.C. Impact of climate change on energy use in the built environment in different climate zones—A review. Energy 2012, 42, 103–112. [Google Scholar] [CrossRef]
- Pérez-Lombard, L.; Ortiz, J.; Pout, C. A review on buildings energy consumption information. Energy Build. 2008, 40, 394–398. [Google Scholar] [CrossRef]
- Mujeebu, M.A.; Alshamrani, O.S. Prospects of energy conservation and management in buildings—The Saudi Arabian scenario versus global trends. Renew. Sustain. Energy Rev. 2016, 58, 1647–1663. [Google Scholar] [CrossRef]
- Krarti, M.; Dubey, K.; Howarth, N. Evaluation of building energy efficiency investment options for the Kingdom of Saudi Arabia. Energy 2017, 134, 595–610. [Google Scholar] [CrossRef]
- Bartlett, D. The top ten ways we waste energy and water in buildings. IBM. 2011. Available online: https://breakingenergy.com/2011/07/26/the-top-ten-ways-we-waste-energy-and-water-in-buildings/ (accessed on 26 July 2011).
- Commission for Architecture and the Built Environment. Thinking differently—The energy hierarchy. In Commission for Architecture and the Built Environment; 2011. Available online: https://webarchive.nationalarchives.gov.uk/20110118142816/http://www.cabe.org.uk/sustainable-places/advice/the-energy-hierarchy (accessed on 1 January 2011).
- City of London. Sustainable energy—The London Plan. In London Plan; 2011. Available online: https://web.archive.org/web/20130305005446/http://www.london.gov.uk/thelondonplan/climate/sustainable_energy.jsp (accessed on 2 March 2019).
- Energy Saving Trust. Working to Address the Climate Emergency. Energy Saving Trust. 2020. Available online: https://energysavingtrust.org.uk (accessed on 6 October 2010).
- Harris, J.; Diamond, R.; Iyer, M.; Payne, C.; Blumstein, C.; Siderius, H.P. Towards a sustainable energy balance: Progressive efficiency and the return of energy conservation. Energy Effic. 2008, 1, 175–188. [Google Scholar] [CrossRef]
- Ministry of Municipal and Rural Affairs. MOMRA. Construction Licenses Statistics. In Ministry of Municipal and Rural Affairs; 2020. Available online: https://www.momra.gov.sa (accessed on 1 January 2020).
- Autodesk. Revit. 2020. Available online: https://www.autodesk.ca/en/products/revit/overview?plc=RVT&term=1-YEAR&support=ADVANCED&quantity=1 (accessed on 1 January 2020).
- DesignBuilder Software LTD and Design Builder. Design Builder. 2020. Available online: https://designbuilder.co.uk (accessed on 12 December 2020).
- United States Environmental Protection Agency. Greenhouse Gas Equivalencies Calculator. 2020. Available online: https://www.epa.gov/energy/greenhouse-gas-equivalencies-calculator (accessed on 1 March 2020).
- Chhipi-Shrestha, G.; Hewage, K.; Sadiq, R. Impacts of neighborhood densification on water-energy-carbon nexus: Investigating water distribution and residential landscaping system. J. Clean. Prod. 2017, 156, 786–795. [Google Scholar] [CrossRef]
- Kabir, G.; Sadiq, R.; Tesfamariam, S. A review of multi-criteria decision-making methods for infrastructure management. Struct. Infrastruct. Eng. 2013, 10, 1176–1210. [Google Scholar] [CrossRef]
- Chhipi-Shrestha, G.; Kaur, M.; Hewage, K.; Sadiq, R. Optimizing residential density based on water-energy-carbon nexus using UTilités Additives (UTA) method. Clean Technol. Environ. Policy 2018, 20, 855–870. [Google Scholar] [CrossRef]
- Wang, J.J.; Jing, Y.Y.; Zhang, C.F.; Zhao, J.H. Review on multi-criteria decision analysis aid in sustainable energy. Renew. Sustain. Energy Rev. 2009, 13, 2263–2278. [Google Scholar] [CrossRef]
- Yoram, W.; Saaty, T. Marketing applications of the analytic hierarchy process. Manage. Sci. 1980, 26, 641–745. [Google Scholar]
- L-Nassar, F.A.; Ruparathna, R.; Chhipi-Shrestha, G.; Haider, H.; Hewage, K.; Sadiq, R. Sustainability assessment framework for low rise commercial buildings: Life cycle impact index-based approach. Clean Technol. Environ. Policy 2016, 18, 2579–2590. [Google Scholar] [CrossRef]
- Triantaphyllou, E.; Lin, C. Development and evaluation of five fuzzy multiattribute decision-making methods. Int. J. Approx. Reason. 1996, 14, 281–310. [Google Scholar] [CrossRef]
- General Authority for Statistics. Housing Bulletin Semi Annual; Housing Statistic: Riyadh, Saudi Arabia, 2018. [Google Scholar]
- General Authority for Statistics. Housing Tables. 2018. Available online: https://www.stats.gov.sa/en (accessed on 1 January 2018).
- Almazroui, M.; Islam, M.N.; Jones, P.D.; Athar, H.; Rahman, M.A. Recent climate change in the Arabian Peninsula: Seasonal rainfall and temperature climatology of Saudi Arabia for 1979–2009. Atmos. Res. 2012, 111, 29–45. [Google Scholar] [CrossRef]
- Krishna, L. Long term temperature trends in four different climatic zones of Saudi Arabia. Int. J. Appl. Sci. Technol. 2014, 4, 233–242. [Google Scholar]
- Alrashed, F.; Asif, M.; Al-sanea, S.A.; Zedan, M.F.; Alaidroos, A.; Krarti, M. Analysis of critical climate related factors for the application of zero-energy homes in Saudi Arabia. Renew. Sustain. Energy Rev. 2015, 41, 1395–1403. [Google Scholar] [CrossRef]
- Gulf Talent. Saudi Labour Law. 2008. Available online: https://www.gulftalent.com/saudi/resources/labour-law (accessed on 1 January 2008).
- Aldossary, N.A.; Rezgui, Y.; Kwan, A. Energy consumption patterns for domestic buildings in hot climates using Saudi Arabia as case study field: Multiple case study analyses. Comput. Civ. and Build. Eng. 2014, 1986–1993. [Google Scholar] [CrossRef]
- Ahn, B.L.; Jang, C.Y.; Leigh, S.B.; Yoo, S.; Jeong, H. Effect of LED lighting on the cooling and heating loads in office buildings. Appl. Energy 2014, 113, 1484–1489. [Google Scholar] [CrossRef]
- Fasi, M.A.; Budaiwi, I.M. Energy performance of windows in office buildings considering daylight integration and visual comfort in hot climates. Energy Build. 2015, 108, 307–316. [Google Scholar] [CrossRef]
- Forughian, S.; Taheri Shahr Aiini, M. Comparative study of single-glazed and double-glazed windows in terms of energy efficiency and economic expenses. J. Hist. Cult. Art Res. 2017, 6, 879. [Google Scholar] [CrossRef]
- He, Q.; Ng, S.T.; Hossain, M.U.; Skitmore, M. Energy-efficient window retrofit for high-rise residential buildings in different climatic zones of China. Sustainability 2019, 11, 6473. [Google Scholar] [CrossRef]
- Li, S.; Zou, K.; Sun, G.; Zhang, X. Simulation research on the dynamic thermal performance of a novel triple-glazed window filled with PCM. Sustain. Cities Soc. 2018, 40, 266–273. [Google Scholar] [CrossRef]
- Constellation Energy Resources. LED vs. CFL Bulbs: Which Is More Energy-Efficient? 2016. Available online: https://blog.constellation.com/2016/03/25/led-vs-cfl-bulbs/ (accessed on 2 March 2016).
- Bay Lighting. 8 Reasons to Consider LED Replacement Bulbs vs. T8 Fluorescent Bulbs. 2016. Available online: https://baylighting.net/8-reasons-consider-led-replacement-bulbs-vs-t8-fluorescent-bulbs/ (accessed on 11 April 2016).
- Energy Star. Energy Efficient Products—Ductless Heating & Cooling. 2020. Available online: https://www.energystar.gov/products/heating_cooling/ductless_heating_cooling (accessed on 1 January 2020).
- Quality Home Maintenance. Window AC vs. mini split AC for my add-on room: Which consumes more energy? Georg. Braz. HVAC. 2018. Available online: https://georgebrazilhvac.com/blog/window-ac-vs-mini-split-ac-for-my-add-on-room-which-consumes-more-energy (accessed on 6 November 2018).
- Saudi Electricity Company. Consumption Tariffs; Saudi Electricity Company: Riyadh, Saudi Arabia, 2018. [Google Scholar]
- Elshurafa, A.M.; Alsubaie, A.M.; Alabduljabbar, A.A.; Al-Hsaien, S.A. Solar PV on mosque rooftops: Results from a pilot study in Saudi Arabia. J. Build. Eng. 2019, 25, 100809. [Google Scholar] [CrossRef]
- Lavappa, P.D.; Kneifel, J.D.; Rear, E.G.O. Energy Price Indices and Discount Factors for Life-Cycle Cost Analysis—2017. In Annual Supplement to NIST Handbook 135; National Institute of Standards and Technology; US Department of Energy; US Department of Commerce: Gaithersburg, MD, USA, 2017; NISTIR 327. no. April 2005. [Google Scholar]
- Energy Star. Energy Star® Qualified Light Bulbs 2006 Partner Resource Guide; Department of Energy: Washington, DC, USA, 2006. [Google Scholar]
- Hakimi, D.P. How to determine how many led lumens you’ll need to properly light your space. Alcon Lighting. 2018. Available online: https://www.alconlighting.com/blog/residential-led-lighting/how-do-i-determine-how-many-led-lumens-i-need-for-a-space/ (accessed on 25 December 2018).
- Fixr. Window Glass Replacement Cost. Fixr. 2020. Available online: https://www.fixr.com/costs/window-glass-replacement (accessed on 29 November 2020).
- Modernize. How Much Do Triple Pane Windows Cost? Modernize. 2020. Available online: https://modernize.com/windows/energy-efficient/triple-pane-windows (accessed on 1 January 2020).
- Lamp Shop. How to Choose and Buy the Correct Led Floodlights for Your Home or Business. Available online: https://www.lampshoponline.com/advice/choose-buy-led-floodlight (accessed on 1 January 2020).
- Bulbs Company. LED CFL-10W. 2020. Available online: https://www.bulbs.com/Light_Bulbs/10W_--_14W/CFL-Bulb_Technology/LED-Bulb_Technology/Medium_(E26)-Base/results.aspx (accessed on 1 January 2020).
- Lamps Plus. 3W–15W Candelabra Light Bulbs. 2020. Available online: https://www.lampsplus.com/products/light-bulbs/wattage_3w-@-15w/base_candelabra/ (accessed on 1 January 2020).
- Renegade Electric Supply. Halogen LED-18W. Available online: http://renegadeelectricsupply.com/lighting/fixture/LED (accessed on 1 January 2020).
- Grainger. Linear LED Bulb, UL Type A, T8, Medium Bi-Pin (G13), 6500K Color Temperature, Lumens 1900 lm. 2020. Available online: https://www.grainger.com/product/GE-LIGHTING-Linear-LED-Bulb-49YR84 (accessed on 1 January 2020).
- PickHvac. LG Mini Split Heat Pump/AC Reviews and Prices 2020. PickHvac. 2020. Available online: https://www.pickhvac.com/ductless/lg/ (accessed on 1 January 2020).
- Acwholesalers Inc. Fujitsu Ductless Mini Splits. Acwholesalers. 2020. Available online: https://www.acwholesalers.com/cooling/fujitsu-ductless-mini-splits.html (accessed on 1 January 2020).
- PickHvac. Samsung Mini Split Heat Pump Prices and Reviews. PickHvac. 2020. Available online: https://www.pickhvac.com/ductless/samsung/ (accessed on 1 January 2020).
- HVACDirect. Gree Mini Split A/C Systems. HVACDirect. 2020. Available online: https://hvacdirect.com/brands/gree-comfort.html (accessed on 1 January 2020).
- Extra. Craft Split AC Price. Extra. 2020. Available online: https://www.extra.com/en-sa/white-goods/air-conditioner/c/4-402 (accessed on 1 January 2020).
- Saleem, M.; Chhipi-Shrestha, G.; Andrade, M.T.B.; Dyck, R.; Ruparathna, R.; Hewage, K.; Sadiq, R. Life Cycle Thinking—Based Selection of Building Facades. J. Archit. Eng. 2018, 24, 04018029. [Google Scholar] [CrossRef]
- IBM. IBM SPSS software. IBM. 2020. Available online: https://www.ibm.com/analytics/spss-statistics-software (accessed on 1 January 2020).
- Saudi Electricity Company. Electricity consumption bills of residential sector in Saudi Arabia in 2018. Unpublished Data. 2019. [Google Scholar]
- Krarti, M.; Howarth, N. Transitioning to high efficiency air conditioning in Saudi Arabia: A benefit cost analysis for residential buildings. J. Build. Eng. 2020, 31, 101457. [Google Scholar] [CrossRef]
- Proctor Engineering Group. High EER at 46 °C Kingdom of Saudi Arabia Air Conditioner Project; AMAD: Riyadh, Saudi Arabia, 2020. [Google Scholar]


Publisher’s Note: MDPI stays neutral with regard to jurisdictional claims in published maps and institutional affiliations. |
© 2021 by the authors. Licensee MDPI, Basel, Switzerland. This article is an open access article distributed under the terms and conditions of the Creative Commons Attribution (CC BY) license (http://creativecommons.org/licenses/by/4.0/).