Article

Scoring Sufficiency Economy Philosophy through GRI Standards and Firm Risk: A Case Study of Thai Listed Companies

by
Veerawin Korphaibool
1,*,
Pattanaporn Chatjuthamard
2 and
Sirimon Treepongkaruna
2,3
1
Environmental, Development and Sustainability Program, Graduate School, Chulalongkorn University, Phatumwan, Bangkok 10330, Thailand
2
Center of Excellence in Management Research for Corporate Governance and Behavioral Finance, Sasin School of Management, Chulalongkorn University, Phatumwan, Bangkok 10330, Thailand
3
UWA Business School, The University of Western Australia, Crawley, WA 6900, Australia
*
Author to whom correspondence should be addressed.
Sustainability 2021, 13(4), 2321; https://doi.org/10.3390/su13042321
Submission received: 14 January 2021 / Revised: 8 February 2021 / Accepted: 16 February 2021 / Published: 20 February 2021
(This article belongs to the Special Issue Financial Risk Management and Sustainability)

Abstract

:
The purpose of this study is to evaluate sufficiency economy philosophy (SEP) performance through annual reports and voluntary sustainable development reports and examines the relationship between SEP performance and firm-specific risk of Thai listed companies from 2013 to 2018. Based on global reporting initiative (GRI) standards, the SEP performance was measured by aligning each GRI topic with each of the SEP elements to create an SEP scoring system. The scoring system was applied and tested by evaluating 34 firms for six years. The outcome scores were recorded in panel data structure and used to test two competing hypotheses of risk reduction and managerial opportunism. The regression results supported the risk reduction hypothesis and thus practicing SEP reduced firm-specific risk. Since our sample was limited to 34 firms, a two-stage least squares instrumental variable (2SLS-IV) analysis was performed to estimate the causal relationship between SEP performance and firm-specific risk. The result remained negatively and significantly correlated, indicating that SEP practice stimulated business sustainability. The finding suggested that the SEP scoring system was able to capture SEP performance and practicing SEP appeared to reduce firm-specific risk, which was consistent with the risk reduction hypothesis of the stakeholder theory.

1. Introduction

In 1997, Thailand was the ground zero of the Asian financial crisis. Thai firms with foreign currency loans, especially US dollars (USD) faced their debt level increase by twofold due to the Thai baht devalued from 25 baht per USD to 60 baht per USD. The stock exchange of Thailand (SET) was hard hit and the index fell from 1100 points in January 1996 to 259 points in December 1997. During the crisis, Sufficiency Economy Philosophy (SEP) was asserted by the late King Bhumibol Adulyadej so that Thai people could overcome the crisis by adopting the SEP [1,2,3,4,5,6,7]. The SEP bases its foundation on three core principles (i.e., moderation, reasonableness, self-immunity) and two underlying conditions (i.e., knowledge and morality), as shown in Figure 1. The outcome of practicing the SEP is to increase the flexibility to mitigate the impacts from economic, social, and environmental changes [2,4,5,8,9]. Adopting the SEP would allow firms to be more prepared for negative impacts that arise from internal and external changes and crises [5,6,8,9,10,11,12,13,14,15]. The philosophy can be practiced according to resources availability, accessibility, and constraint of the organization [5,8,10,13,15]. In other words, firms can practice SEP according to their strengths, conditions, and limitations.
After the Asian financial crisis, researchers have been studying the consequences of practicing SEP and the results have been appealing and intuitive. As the study sample has been focused on small and medium enterprises (SMEs) through a semi-structure interview, or survey, they faced at least three important limitations and further investigation should be executed [4,5,6,13,16,17]. First, previous studies on SMEs conducted via primary data (i.e., interview or survey) may provide in-depth superior results but there have been debates from skeptical parties who claim that the SEP remains subjective and vague [18]. Although conducting research using primary data provides a superior in-depth result, it can be costly and time-consuming and limit the sample size to the specific boundary. Using regulated secondary data can simplify the study process, and thus the study can be conducted on a larger sample size with comprehensive detail. This study aims to further clarify the SEP by improving SEP performance evaluation method to meet the international standard. Measuring the SEP performance based on existing international standard could provide objective results in a structure that has already been understood and widely accepted.
Second, Thai listed companies operate under more strict regulations and laws, and thus they may behave toward SEP practice differently [6,19,20,21]. This fact should not be neglected because listed companies may concentrate more resources on SEP practice to increase the level of stakeholder engagement to avoid facing risks such as compliance risk. The positive relationship between SEP practice and firm-specific risk remains unknown and needs to be further investigated. Third, Thai listed companies have at least 150 minority shareholders while SMEs tend to have far fewer [21]. This limitation involves an ethical aspect for the managers who may aim to use company’s resources in SEP practice to increase personal reputation and value because they have to create a good image to shareholders [22,23]. The negative impact of practicing SEP has not been explored and our study aims to fill the gap.
In this study, we examine the relationship between the SEP performance of 34 Thai listed companies and firm-specific risk from 2013 to 2018. As Thai listed companies annually disclose sustainable development (SD) reports, we evaluated SEP performance via the information disclosed in SD reports and investigate the relationship between different levels of SEP performance and firm-specific risk [19,20]. To improve the SEP performance evaluation method to meet the international standard, we implemented an SEP scoring system based on global reporting initiative (GRI) guidelines [24,25,26]. Then, we studied whether firms with a high level of SEP performance are being more moderate, reasonable, and resilient towards stakeholders that in turn reduce firm-specific risk (the risk-reduction hypothesis). On the other hand, firms which practice SEP may only attempt to create personal reputation and thus, the results only benefit the managers. Investors do not appreciate unethical firms and typically distance their investments from these firms that eventually increase firm-specific risk (the managerial opportunism hypothesis) [22,23,27,28]. To empirically determine the causal relationship between SEP performance and firm-specific risk, we perform regression analysis on the panel data of 34 Thai listed firms over six years.
Our results show that practicing SEP reduces firm-specific risk, which supports the risk-reduction hypothesis. All of the three core SEP principles are negatively associated with firm risk. It appears that self-immunity and moderation have a stronger effect on risk reduction than reasonableness. Two underlying conditions (i.e., knowledge and morality) are both negatively and significantly related to firm risk. In 2020, 23 years after the 1997 Asian financial crisis, the world faced another challenge in the Covid-19 pandemic. During the Covid-19 pandemic, the world has experienced tremendous changes in the form of a “new normal”. The new normal lifestyle reduces economic transactions (i.e., many people work from home and reduce their spending); this has created a riskier business environment for many business sectors. In such crisis, our study’s findings contribute largely to the business, academic, and regulator sectors. Since our empirical results confirm that practicing SEP can reduce firm-specific risk, firms can urgently reduce risk by being more moderate and self-immune. Academically, the SEP practice can be objectively explained as involving moderation and self-immunity as the key drivers of the SEP practice, while knowledge and morality are precondition to reduce firm-specific risk. Finally, this study’s results address that the SET regulators could encourage firms to adopt the SEP practice and evaluate SEP performance using our SEP scoring system, as this would help Thai listed companies to endure economic downfall, and thus maintain market value.
The remainder of this paper is structured as follows. Section 2 describes the related theoretical framework and research hypotheses: Section 3 presents sample selection and research methodology applied in the study: Section 4 shows the results and discussion of SEP scoring, descriptive statistics, and regression analysis: Section 5 concludes our work with recommendations and limitations.

2. Literature Review and Research Hypotheses

2.1. SEP in a Business Context and Business Sustainable Development

SEP practice has been suggested as a way to adapt to the coexistence between firms and stakeholders through three core principles (i.e., moderation, reasonableness, and self-immunity) and two underlying conditions (i.e., knowledge and morality) [4,5,6,7,8,9,10,11,12,13,14,15,29,30,31]. These are herein referred to as the five SEP elements. The philosophy emphasizes Buddhism’s Middle Way (i.e., mindfulness, consciousness, and state of balance) as a foundational principle, as it can be simply adopted and practiced as guidance for daily life in the local community and assist in national strategic planning [6,7,8,9,11,12,15,31,32].
In general, moderation can be conceived of as being consistent or harmonious with the surrounding environment and relying on oneself to avoid excessive extremism [12]. In a business context, moderation refers to knowing the capabilities and limitations of the internal and external environments before decision-making to appropriately consume and produce [5,6,8,11,12,13,14,33]. Organization moderation practices aim for long-term results through efficient and effective use of available resources and cooperating with stakeholders, which could result in prudent business growth [5,6,8,13]. Based on the SEP, a firm is being moderate when it chooses to produce based on plan and target according to its capability [5,6,7,8,13,14]. For example, to achieve moderation, the firm needs to prepare a long-term plan, diversify source of raw materials with local sources as a priority, and create a business alliance (i.e., employees, suppliers, and customers) [8].
Reasonableness is commonly perceived as making rational decisions and being aware of the consequences of one’s actions on others and oneself to maintain virtuous outcomes [5,6,7,12,13,14]. To make a rational decision, appropriate basic knowledge is required [12]. Reasonableness directly relates to good governance in the business context. It can be achieved through regulations, rules and laws which control the action within the scope. Reasonableness considers the cause and effect of actions [5,6,7,8,12,13,14]. In other words, knowing the cause and effect before making a decision and being aware and cautious of the consequences from the decisions made are important parts of reasonableness. Reasonableness is principally used in conjunction with decision-making in business practices since it is the key to prudent outcomes [8]. Decision-making under the influence of reasonableness requires the use of knowledge and experience as its fundamental support, in addition to consideration of impacts on stakeholders to avoid exploiting others [5,6,8,13,14]. Based on the SEP, a firm is being reasonable when it considers the impacts on all stakeholders [6,7,8,12,13,14]. For example, to achieve reasonableness, a firm needs to thoroughly understand and have the knowledge related to its business and market, focus on mutual benefits as a priority, and be aware of the future consequences created from its activities both positively and negatively [5,6].
Self-immunity refers to the ability to cope with the impact of future changes [5,6,8,12,13,14]. This involves the ability to identify possible future threats and prepares one to handle and overcome them [12]. In the business aspect, self-immunity strongly relates to risk management. Internal audits, products/services diversification, market expansion, and multilocation sourcing are examples of risk management [5,6,7,8,13,14]. A study on SMEs which survived through the 1997 Asian financial crisis suggested that preparation for an economic downturn was among the important business practices [34]. Based on the SEP, a firm creates self-immunity when it performs risk management and integrates it into its policy and action throughout the firm’s activity [8,13]. For example, a firm diversifies its product and services, and material sourcing to reduce risk [13]. A firm may choose to share its knowledge with the local supplier to help reduce costs, and in turn reduce the price of the product sold back to the firm [8].
SEP views knowledge as one of two basic elements needed to support the three core principles. Knowledge is generated through experience and information accumulation [5,6,7,8,11,12,13,14]. In the business sector, knowledge is used in the form of market research, product innovation, research and development (R&D), and training as a tool to generate competitiveness in the market [5,7,8,14,15]. Another fundamental element required to practice SEP is morality. Business ethics toward stakeholders, appropriate employee welfare, corporate governance, corporate social responsibility (CSR), activity, and legal compliance are examples of morality in business practice [5,6,8,14].
SEP practice was found to be associated with the survivability of small and medium-sized enterprises (SMEs) during the 1997 Asian financial crisis [1,2,3,4,5,6,7]. The studies of SEP practice using semi-structured interviews or surveys for large firms or observations on specific characteristics of a few SMEs suggested that SEP practice is beneficial to business sustainable development [5,6,7,8,9,14,35]. Several beneficial attributes that could be created by practicing SEP are information transparency, reduced risk, and improved relationship with a business alliance [1,2,3,4,5,6,7,8,11,12,13,14,15,16,17,30,31,35].

2.2. SEP and Information Transparency

Suttipun and Saefu conducted a study focus on SEP reporting, corporate characteristics, and performance. Their findings suggested that a higher level of SEP disclosure combined with information transparency improved firm performance [14]. This finding is consistent with that of Kantabutra who claimed that vision statement clarity is among the important attributes of SEP practice that improved sustainable business performance [3]. It is conceivable that a firm practicing SEP would disclose reliable information to maintain its transparency. In 1997, the Coalition for Environmentally Responsible Economies (CERES), the Tellus Institute, and the United Nations Environment Program (UNEP) established the Global Reporting Initiative (GRI), which aimed to provide sustainability guidance for companies to follow. The three main GRI standards are associated with economic, environmental, and social aspects, which are referred to as GRI200s, GRI 300s, and GRI 400s, respectively [24]. Sustainable development (SD) reports follow GRI standards and reveal valuable economic, environmental, and social activities of the firm. They are often used to indicate environmental and social performance, as well as the business sustainability score [25,26,36,37]. For example, Clarkson et al. used environmental information disclosures based on the Global Reporting Initiative guidelines in order to show that firms with higher environmental disclosure levels have stronger environmental performance [37]. Corporate environmental responsibility is an activity that was once perceived as a financial burden but has been shown to add financial value to a firm [38,39]. Because SEP is directly related to information transparency and SD report disclosures have been extensively used to evaluate firm’s performance, these findings assist building an SEP scoring system that is later used to evaluate SEP performance.

2.3. SEP and Risk

Generally, business risks may emerge from the internal or external environment. For example, economic risk, compliance risk, fraud risk, reputation risk, and climate change risk. The Sharpe–Lintner Capital Asset Pricing Model (CAPM), which combines risk and return for assets, is widely used to evaluate the relationship between risk and expected return [40,41,42,43,44]. According to the CAPM, total risk comprises market risk (systematic risk) and firm-specific risk (unsystematic risk) where firm-specific risk can be avoided by diversification of the investment but all investment unavoidably faces market risk [45,46,47]. Market risk represents the risk that every firm in the market experiences, such as global economic crisis, while firm-specific risk can be affected by internal accident or sales loss through disclosed information [44,45,46,47,48]. The firm-specific risk varies among firms and represents the uniqueness of each firm’s management behaviors [44,45,46,47,48,49]. Corporate sustainable development (SD) performance involves three dimensions of economic, social, and environmental activities and outcomes, such as financial performance, corporate social responsibility (CSR) engagement, or environmental engagement [41,45,50]. The relationship between firm risk and SD performance has been extensively studied [41,45,46,47,50,51,52,53].
Several leading research papers have found that sustainable development activities such as environmental preservation or social campaign are negatively correlated with firm risk [36,38,41,45,46,47,50,51,52,54]. For example, risk reduction is essential in the strategic management of firms to increase firm value to meet investor expectations [41,45,46,50,54]. In 2019, Hu et al. found that corporate social responsibility disclosure has a strong tendency to mitigate information asymmetry and fraud committed by the organization to reduce firm risk [50]. SEP practice has been known to reduce risk through several attributes. Kantabutra suggested that resilience is among the essential characteristics found in business sustainability [2]. In other words, a firm practicing SEP would emphasize on risk-management, diversify product and services, and use knowledge and information learned to plan for volatility, and thus create a readiness to stand against the crisis. In another example, Sornsri conducted a study on SEP practice in organization purchasing and found evidence that a firm conducted self-immunity by frequently visiting suppliers to prevent material shortage as part of the risk management strategy [13]. Although previous studies have suggested that there is a link between a firm practicing SEP and risk, they have never focused on the connection between SEP and firm-specific risk, nor closely inspected the impacts of each of the five SEP elements. This study attempts to explore the unstudied terrain.

2.4. SEP and Business Alliance

Several studies on SEP concluded that one of the core attributes of SEP practice is to promote collaboration among stakeholders [1,3,4,5,6,7,8,9,11,12,13,14,16,17,30,31,35]. For example, a recent study conducted by Kantabutra showed that stakeholder engagement as part of the SEP practice improves corporate sustainability performance [16]. Another example, Buranapin and Ratthawatankul studied the SEP and business sustainability through questionnaire. Their findings suggested stakeholder engagement as part of SEP business practices created adaptability that is an essential attribute in business sustainability [9]. Freeman’s stakeholder theory (1984) has been a fundamental concept in the field of business ethics, which focuses on creating value for all stakeholders [55]. It has become a customary practice for listed companies to perform stakeholder engagements together with corporate governance since they state compulsory disclosures in their annual reports. Similar to the stakeholder theory, the three core principles of SEP directly aim to generate coexistence between corporate and other stakeholders under the mutual benefits and shared value [12]. Assisted by the SEP practice, businesses and stakeholders can morally cooperate, conflict between parties can be reduced, and thus firms experience less risk. According to the stakeholder theory, practicing SEP improves the relationship between corporate actors and stakeholders, resulting in lower firm-specific risk, and thus we can deploy the following hypothesis:
Hypothesis 1.
SEP practice level is negatively related to firm-specific risk.
Although not the direct purpose of practicing SEP, firm reputation is enhanced as a result of a better relationship between firm and stakeholders [6,29]. A side effect of SEP practice may create an opportunity for greedy managers. Managerial opportunism views the relationship between firms and stakeholders differently. The opportunistic managers operate businesses for their own benefits to magnify their reputations or to generate personal interests [23,27]. Barnea and Rubin argued that managers may overly invest in corporate social responsibility (CSR) activity at an unjustified spending level just to be appreciated as a good corporate citizen toward their employees and society in general [56]. As a result, business operations under the managerial opportunism hypothesis increase the risk of a firm.
Hypothesis 2.
SEP practice level is positively related to firm-specific risk.

3. Sample and Methodology

3.1. Sample

This study focuses on two important indices in Thailand: SET100 and SETTHSI. The SET100 index includes 100 listed firms with the highest market capitalization in the list. In 2015, the SET initiated the Thailand Sustainability Investment Index (SETTHSI), which represents listed companies who voluntarily joined the Thailand Sustainability Investment survey [20]. Both SET100 and SETTHSI are re-evaluated every six months. Initially, we aimed to study 214 firms from the SET100 and SETTHSI indices for ten years (from 2008 to 2018), but most of them did not disclose sustainable development (SD) reports during the 10 years. After screening for the availability of SD reports, we found that the six-year period between 2013 and 2018 provided us with the greatest number of observations (i.e., with 34 firms multiplied by the number of years we had 204 samples). If we were to select more firms, the number of available SD reports would become much smaller, and thus we would have fewer than 204 samples. As a result, 34 listed companies were selected from the SET100 and SETTHSI indices based on the availability of SD reports during 2013 to 2018, whereas 30 firms were from the SET100 index and 4 firms were from the SETTHSI index. Thai listed companies in the financial industry were excluded from the study because their financial indicators were incomparable with firms from other sectors due to specific regulations [22]. In summary, 4 firms were in agriculture and food, 3 firms were in industrials, 5 firms were in property and construction, 11 firms were in resources, 8 firms were in services, and 3 firms were in technology, as shown in Table 1.

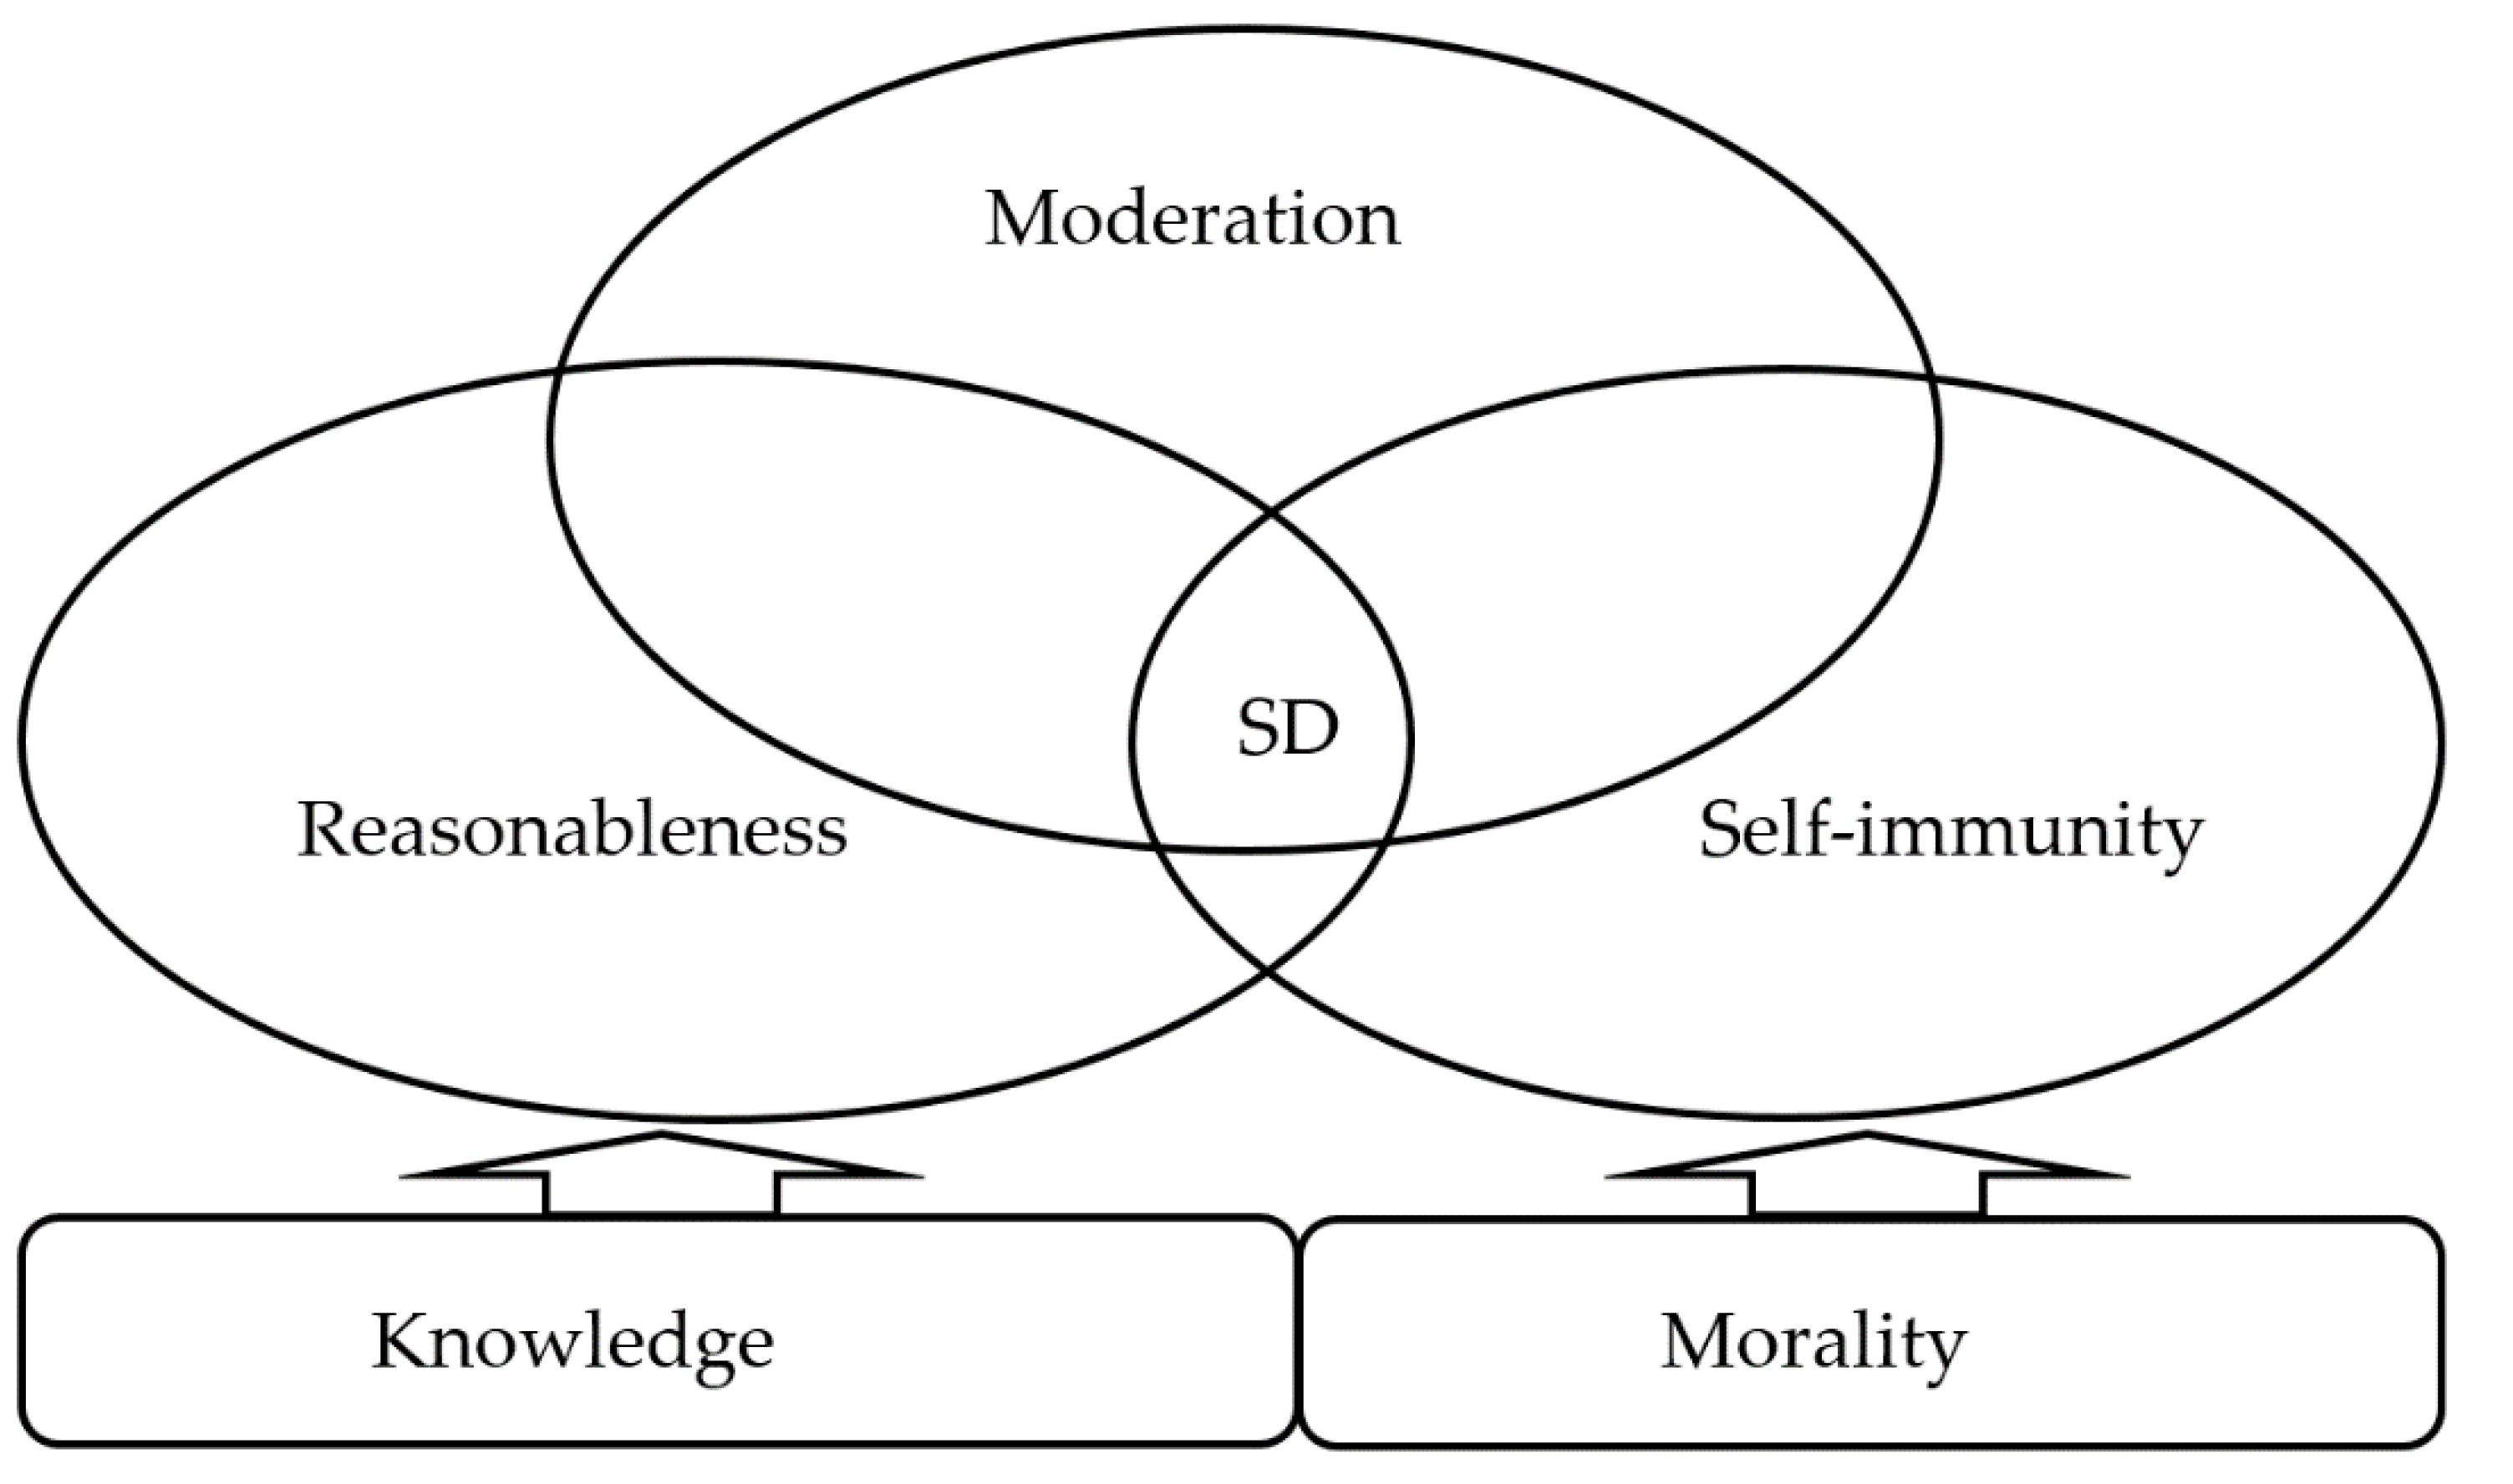
3.2. Measuring Sufficiency Economy Philosophy (SEP)

The SEP performance represented by the SEP score is measured through the alignment of five SEP elements with global reporting initiative (GRI) standards. GRI standards that deal with economic (GRI 201–206), environmental (GRI 301–308) and social (GRI 401–419) performances were used as the fundamental structure for the scoring system. GRI 201–206 consisted of 37 disclosure provisions that covered important subjects from an economic perspective, such as direct and indirect economic value generated by corporate activity, procurement practice, anti-corruption, and anti-competitive behavior. GRI 301–308 consisted of 108 disclosure provisions for the environmental aspect, which included important subjects, such as raw material usage, type of energy consumption, pollution and waste generated by the corporate activity, impact on biodiversity, and supplier environmental assessment. Social aspect disclosures, GRI 401–419, comprised of 90 provisions that observed employment benefits and well-being, human rights assessment, nondiscrimination, public policy, customer privacy, and socioeconomic compliance. The three GRI series have a total of 235 provisions.
We reviewed and aligned each GRI subtopic with each of the five SEP elements that has been previously defined in a business context by leading literature, as shown in Table 2 [5,6,7,8,13,14]. To construct an SEP scoring system, each of the 235 disclosure provisions was carefully assessed for its direct relevance with each of the five SEP elements. For example, GRI disclosure 205-1 instructs firms to disclose their information as follows: “Operations assessed for risks related to corruption (a) total number and percentage of operations assessed for risks related to corruption: (b) significant risks related to corruption identified through the risk assessment” [24]. Information required from being disclosed should be directly relevant to the definition of the five SEP elements, as shown in Table 2 under the variables MOD, REA, SEL, KNO, and ETH, where MOD represents moderation, REA represents reasonableness, SEL represents self-immunity, KNO represents knowledge, and ETH represents morality.
For GRI disclosure 205-1, we concluded that “(a) total number and percentage of operations assessed for risks related to corruption” is aligned with the definition of self-immunity as a firm which performs risk management. For GRI disclosure 205-1, “(b) significant risks related to corruption identified through the risk assessment” is aligned with the definition of self-immunity as a firm which monitors and identifies business related changes, threats, and risks. Moreover, GRI disclosure 205-1 (a) and (b) are also aligned with morality that is defined as a firm that performs the activity with corporate governance, ethics, morality, code of conduct, integrity, and perseverance.
The alignment between each definition of the five SEP elements and each GRI disclosure provision captures discrete corporate action, management decision-making behavior, and corporate culture in the sense of the five SEP elements. The result from the mapping process provides us the essential link between each of the GRI disclosure provisions and five SEP elements, which is used to construct the SEP scoring system. After mapping each GRI subtopics with each of the five SEP elements, we constructed an SEP performance checklist that was used in the next process to evaluate each firm SEP performance through an annual SD report by three SEP experts. Some of the GRI subtopic may align with more than one SEP elements while some may not align at all. The SEP scoring system is not shown here but can be provided upon request.
Following Morhardt et al., as well as Yadava and Sinha, the GRI score is evaluated according to the following criteria: the score is zero when the specific indicator is not mentioned, the score is one when the specific indicator is partly mentioned (i.e., not all sub-questions were mentioned) or given in generic statements (i.e., company production processes do not have environmental impact), the score is two when the specific indicator is provided with detail but not comparable (i.e., restricted to a specific facility or covers only one year), and the score is three when the specific indicator is described in full (i.e., covers all sub-questions) and in a comparable form (i.e., coverage of more than one year) [25,26]. Mohardt et al. considered each of the GRI subtopics as equally important [25]. To keep the scoring model simple, this study weighs each subtopic evenly, as was the case in the preceding study. Economic, environmental, and social performance scores are converted into a 0 to 100 scale; then, the final SEP_score is the average score of the three aspects. The SEP_score is the sum of the SEP score on economic, environmental, and social aspects, which is weighted based on the alignment of each disclosure with the five SEP elements.
We tested the developed SEP scoring system by evaluating the SEP score for the 34 listed firms and assessed the relationship between the SEP score and firm-specific risk. The SEP scores were evaluated by three SEP experts and the final score must be agreed upon by at least two of the experts. Once we had the final SEP_score, we estimated panel regression of the relationship between SEP_score and firm risk.

3.3. Data Collection Process

Publicly disclosed annual and sustainable development (SD) reports were downloaded from each company’s website. Both types of reports were used for SEP performance evaluation. Each of the SEP experts was provided with a printed copy of annual and SD reports of 34 firms from 2013 to 2018 and SEP scoring checklists. The process of SEP scoring evaluation was explained to the experts and each were given sufficient time to evaluate all of the 204 samples (34 firms for 6 years). Once the experts have the results, the SEP scores were then entered into the Excel spreadsheet and checked for similarity and differences using Excel IF function. If the results from at least two experts were matched, it became the final results. Many firms organized their sustainable development performance based on GRI standards in the summary section while nearly half of the firms disclosed the performance scattered throughout the reports. Due to this issue, several topics of SEP scores did not match but once all three experts shared the evidences on the reports, they could quickly conclude the final result. The final SEP scores were then entered into an Excel spreadsheet and STATA for further analysis. For financial data that were used for the control variables, they were collected from Bloomberg and DataStream except for firm’s age, for which we gathered the information from the firm’s website and the stock exchange of Thailand website.

3.4. The Relation between SEP and Firm-Specific Risk

3.4.1. Measuring Firm-Specific Risk

To measure firm-specific risk, we estimated the Fama and French three-factor model, as follows [57]:
Rit − Rft = αit + β1 (Rmt − Rft) + β2 SMBt + β3 HMLt + εit
where Rit is the return of the stock of firm i during period t, Rft is risk-free rate of return at time t, and Rmt represents the market return during period t. Subtracting the risk-free rate of return at time t from the total return of stock i at time t (Rit − Rft) resulted in an expected excess return. Moreover, subtracting the total risk-free rate of return of stock i at time t from the total market portfolio return at time t (Rmt − Rft) resulted in an excess return on the market portfolio. SMBt (small minus big) is the difference in returns on small and large firms during time period t, which captured the risk factors related to firm size. HMLt (high minus low) is the difference in returns of firms with high book-to-market value ratios with low book-to-market value ratios firms, which captured the risk factors related to the book-to-market value ratio [57]. The remaining risk factors which were not captured by the market factor, size factor, or value factor were in the residual. We regressed the monthly data from January 2009 to January 2019 and used the median of the monthly square residuals to represent the firm-specific risk. The data for estimating the firm-specific risk consisted of the stock closing price of firm i, the number of shares outstanding, the stock exchange of Thailand (SET) market, and the book value of firm i. Data for risks calculation were collected from DataStream.

3.4.2. Selection of Control Variables

Different firm sizes had different abilities to recover from the economic impact given that firm size was used, to determine the related risk [49,58]. We included the total assets (TA) as a control variable for firm size. The literature on financial asymmetric information used dividend payouts as part of their empirical models to evaluate shareholder strength [23,59]. We used dividend payout ratios (DPR) as a control variable for shareholder strength. Profitability was another important indicator for firm performance and business condition [41,52]. We controlled return on equity (ROE) for the profitability of a firm. An investor’s view on firm future growth or under distress conditions reflected the market value, so we controlled price-to-book ratio (PB) for the growth opportunity [50,53]. A firm’s risk appetite could be evaluated through leverage levels [53]. Thus, we included total-debt-to-total-assets (TDTA) as control variable. A firm gains knowledge over time, which can increase a firm’s perseverance. We considered firm age (Age), which we calculated from the year of establishment until the year of study, as our control variable [50,51]. In summary, TA (natural logarithm term), DPR, ROE, PB, TDTA, and Age (natural logarithm term) were controlled in the regression since they may have influenced firm-specific risk.

3.4.3. Modeling Framework

To determine the causal relationship between the level of the firm practicing SEP and firm-specific risk, we adopted a two-stage least squares instrumental variable (2SLS-IV) approach to estimate the following model:
Yit = αi + β1 Xit + controls + εit
where Yit is firm-specific risk for firm i at time t, Xit is various proxies of SEP for firm i at time t, and εit is an error term. For SEP, we focused on the three sustainability aspects and five SEP elements. We also reported our baseline ordinary least squares (OLS) and fixed effects (FE) panel regression models. Table 2 describes the definition of all variables used in the regression analysis.

4. Results and Discussion

4.1. SEP and GRI Alignment

After mapping each GRI provision with each of the five SEP elements, our findings showed that moderation aligned with 22 out of 37 GRI disclosures for the economic aspects (59.5%), 23 out of 108 GRI disclosures for the environmental aspects (21.3%), and 49 out of 90 GRI disclosure for the social aspects (54.4%). Reasonableness aligns with 10 out of 108 GRI disclosures for the environmental aspects which was less than 10%, whereas knowledge only aligned with 1 out of 108 GRI provisions for the environmental aspects, which accounted for 0.9%. This evidence suggests that GRI disclosures on environmental aspects are not mainly relevant to reasonableness nor knowledge. On the other hand, self-immunity aligned with all GRI provisions in all aspects, which suggests that disclosing information based on the three GRI series is directly relevant to SEP self-immunity. Since self-immunity in a business context implies that a firm performs monitoring, identifying, and evaluating business functions, all information disclosures fall into this category because a firm needs to perform such functions to acquire disclosure information. As a result, 235 out of 235 GRI provisions were directly relevant to self-immunity. Disclosing information may arguably imply the accumulation of information, but it does not guarantee that a firm could implement the accumulated information, and thus it falls short of capturing the full definition of the knowledge element. As a result, unless GRI disclosure provisions clearly state that the disclosed information implies the use of accumulated information for improving or better understanding the business environment, many of the disclosure provisions do not align with knowledge. Thus, only 28 out of 235 GRI provisions were relevant to the knowledge element. In summary, GRI disclosures are highly related to self-immunity (SEL = 100%) and morality (ETH = 60.9%), partly related to moderation (MOD = 40%) and reasonableness (REA 33.6%), and mildly related to knowledge (KNO = 11.9%). The results give a clearer view on the different levels of the relationship between each of the five SEP elements and SD aspects. As a result, firms practicing SEP can use their SEP score to emphasize specific improvements in order to become prudent regarding risks.
Table 3 shows the alignment results between five SEP elements and GRI provisions, which are used for the SEP scoring system. Since each provision alignment can have a value from zero to three, a single provision alignment can have a maximum score of 3 points. For example, a moderation element with 94 provision alignments can have a maximum score of 282 points. In summary, the SEP score has 1737 maximum points, which consists of 282 points from the moderation score (MOD), 237 points from the reasonableness score (REA), 705 points from the self-immunity score (SEL), 84 points from the knowledge score (KNO), and 429 points from the morality score (ETH).

4.2. Descriptive Statistics

Table 4 shows descriptive statistics of all variables included in our analysis. The first set of information represents the SEP performance on sustainability: SEP_eco, SEP env, and SEP_soc. Among the three aspects, the economic aspect had the highest average score (SEP_eco = 41.5), followed by the social (SEP_soc = 31.3) and environmental (SEP_env = 28.6) aspects, respectively. This suggests that, on average, listed firms disclose more information on the economic aspect than the other two aspects. This evidence is supported by the fact that SET, under the supervision of the Securities and Exchange of Commission (SEC), controls listed companies to mandatory disclose financial statements and financial performance [19]. The second set of information shows the descriptive statistics result of three SEP core principles (MOD, REA, and SEL) and two underlying conditions (KNO and ETH). The three SEP core principles had nearly the same average score level, i.e., 33.3 to 33.5. Among the two underlying conditions, the knowledge average score (KNO = 35.8) was slightly higher than the morality element (ETH = 33.0), but the scores remained on the similar level between 33.0 to 35.8. This suggests that the sample firm practices the five SEP elements at a balance level that aligns them with the key success factors of the philosophy in a business context, emphasizing good balance and avoiding extremes. The average SEP_score of all firms was 33.8. The result shows that our initiated SEP scoring provides details in two categories as three SD aspects and five SEP elements. A total of eight dimensions from both categories offer a clearer view of the strengths and weaknesses of the organizations, and thus the management can specifically improve the weaknesses without wasting resources. Firm-specific risk, measured through Fama and French’s three–factor model, had an average of 0.0015. On average, the sample consisted of profitability (ROE = 10.7) and large firm size (TA = 1.88 × 10⁸), as they had been operating for over three decades (Firm_Age = 32.6) and paid dividends to shareholders (DPR = 54.4).

4.3. Main Results

4.3.1. Hausman Test for Panel Data

We conducted the Hausman test to determine whether fixed effects or random effects regressions were an appropriate estimation for the model. The Hausman test’s criteria suggest that if the p-value is statistically significant, we can reject the null hypothesis. Our result with low p-value (p-value < 0.01) indicated that we rejected the null hypothesis, and thus fixed-effects regression is an appropriate estimation as shown in Table 5.

4.3.2. Three Aspects of SD, Five SEP Elements, and Firm Risk

Table 6 reports the baseline fixed-effects regression results. The dependent variable for models 1 to 8 is Firm_risk, which represents a firm-specific risk. Panel A of Table 6 reports regression, wherein three aspects of SD are used as independent variables, while Panel B of Table 6 reports regression results, wherein five SEP elements (moderation, reasonableness, self-immunity, knowledge, and morality) are used as explanatory variables. Control variables for all eight models are total assets (in natural log form l_TA), price-to-book ratio (PB), total-debt-to-total-assets ratio (TDTA), return on equity (ROE), firm age (in natural log form l_Age), and dividend payout ratio (DPR). Robust standard errors are reported in parentheses. Further, ***, **, and * indicate statistically significant values at the 1%, 5%, and 10% levels, respectively.
Among the three aspects of SD, SEP_env had the greatest impact on firm-specific risk as it is negatively (SEP_env = −4.55 × 10⁻⁵) and significantly related to Firm_risk (significant at 5%). On the other hand, SEP_eco and SEP_soc had no significant effect on Firm_risk. Economic and social aspects, such as financial operation results and corporate social responsibility activities, are compulsory disclosure information for the listed companies, and they do not reduce firm risk. SET should encourage or enforce listed firms to disclose environmental activities since this in turn helps mitigate risks. Moderation (MOD = −5.55 × 10⁻⁵) and self-immunity (SEL = −6.57 × 10⁻⁵) were negatively and significantly associated with Firm_risk, with the significance level at 10% and 5%, respectively. Based on FE regression, REA did not affect Firm_risk. The two underlying SEP conditions were both negatively and significantly associated with Firm_risk. The significance level of KNO was 1%, while ETH was significant at 5%. In summary, the regression results suggested that among the three aspects of business sustainability, SEP_env was the most important key driver in reducing firm-specific risk. Moreover, moderation, self-immunity, knowledge, and morality were the SEP key drivers for reducing firm-specific risk. The results of knowledge and morality were both negatively and significantly related to firm-specific risk and strongly supported the SEP to successfully perform the three SEP core principles, as well as the two necessary conditions.

4.3.3. SEP Performance and Firm Risk

Table 7 presents the result of OLS, FE, and 2SLS-IV regressions. The SEP_score was calculated from the weighted average of the two sets of scores, the three core principles (MOD, REA, and SEL), and the two underlying conditions (KNO and ETH). From OLS and FE regressions, SEP_score is negatively and significantly related to firm-specific risk.
Because our sample was limited to 34 listed firms, the result reliability can be challenged, we performed 2SLS-IV to estimate the causal effects [60]. Although Jiraporn suggested that, generally, it may be hard to discover truly exogenous instrument variables, we examined the possible endogenous relation between firm-specific risk and the SEP practice [23]. According to the SEP, the two underlying conditions of SEP were the preconditions of the individual or firm to achieve business sustainability through practicing the SEP. Kantabutra found that sustainable enterprises commonly pose similar distinctive characteristics such as products and services diversification through internal development (i.e., knowledge), as well as consistently endorsing ethical business practices (i.e., morality) [7]. In light of this evidence, we argued that the score of the two underlying conditions likely correlated with the SEP_score; thus, the score of the two conditions (twocon_AVE) was used as an instrumental variable for the endogenous variable, which was the SEP_score. The 2SLS-IV result showed that SEP_score remains negatively and significantly associated with firm-specific risk, and thus our 2SLS-IV analysis confirmed this causal relation and supported the risk reduction hypothesis.
In summary, models 9 to 11 provided consistent results, indicating a significant and negative relationship between SEP and firm-specific risk. Practicing SEP benefits firms and can help them to experience less risks; thus, our SEP scoring system appears adequate and can be used as a tool to verify SEP performance.

5. Conclusions

This research contributes to three main aspects. First, initiating and testing the sufficiency economy philosophy (SEP) scoring system that can be further conducted on large-scale research. Our initiated SEP scoring system, based on GRI standards, was validated through its application in a corporate finance context. The results suggested that the SEP scoring can be applied as an extension of the existing knowledge. The results from our SEP scoring provide a clear and specific descriptions that can be further used to improve the weaknesses of the evaluated firm. Our SEP scoring gives higher practicality to the future researchers who aim to study business sustainability via SEP practice. By merging the local knowledge, SEP, with international standard, Global Reporting Initiative (GRI), researchers can now evaluate SEP performance of listed firms outside Thailand as long as they disclose annual and sustainable development reports. This will extend the research on the SEP subject well beyond the existing literature.
Second, this is the first empirical research to explore the unknown relationship between SEP practice and firm-specific risk. We proposed a theory using multidisciplinary approach from social science, corporate finance, and econometrics to test the risk reduction hypothesis. The materials of the proposed theory consist of the three core principles and two underlying conditions of the SEP, and firm-specific risk from Fama and French’s three-factor model [4,5,6,7,8,9,10,11,12,13,14,15,28,29,30,31,33,40,41,43,44,45,46,47,48,49,50,51,52,53,57]. Fixed-effects regression was performed to analyze the model and supplement statistics from the econometrics approach, the instrumental variable two-stage least squares assists our causal relation test. Our findings revealed valid evidence that SEP practice reduces firm-specific risk, and thus supported the existing literatures. Third, we examined the possible of negative impacts from SEP practice. Although previous SEP studies showed promising positive effects, our proposed hypothesis tested the reverse relationship. However, our results did not support the managerial hypothesis.
Since our findings provide empirical evidence that practicing SEP can reduce firm-specific risk, firms who want to reduce firm-specific risk can use our SEP scoring to evaluate their firms and improve their weaknesses as our SEP scoring provides specific practical guidelines on the strength and weakness according to GRI standards. Our results favor previous literature on the positive impacts from SEP practice, but discourage the skeptical argument on the negative effect [1,2,3,4,5,6,7,8,9,10,11,12,13,14,15,16,17,18,29,30,31,33,35]. The contribution of this research goes beyond supporting the business practitioners, academic researchers, and SET regulators. The Thai government can adopt SEP scoring in the next national economic and social development plan (NESDP) and share knowledge with the local small and medium enterprises (SMEs) to strengthen the Thai economy.
Although our study provides valuable empirical results of the SEP practice, it is far from flawless. One limitation of this study is that the sample was still limited within Thailand. It is recommended for future researchers to extend the study to other countries to evaluate the alignment of the foreign firm’s disclosure and SEP practice. Expanding the study to international firms will provide insightful intellectual knowledge for the academic community with an alternative sustainable development theory.

Author Contributions

Conceptualization, V.K. and P.C.; methodology, V.K.; validation, V.K., P.C. and S.T.; formal analysis, V.K. and S.T.; investigation, V.K., P.C. and S.T.; data curation, V.K. and S.T.; writing—original draft preparation, V.K.; writing—review and editing, V.K. and S.T.; supervision, P.C. All authors have read and agreed to the published version of the manuscript.

Funding

This research received no external funding.

Institutional Review Board Statement

Not applicable.

Informed Consent Statement

Not applicable.

Data Availability Statement

The data presented in this study are available on request from the corresponding author. The data are not publicly available due to privacy and copyright.

Conflicts of Interest

The authors declare no conflict of interest.

References

  1. Kantabutra, S.; Siebenhuner, T. Predicting corporate sustainability: A Thai approach. J. Appl. Bus. Res. (JABR) 2011, 27, 123–134. [Google Scholar] [CrossRef]
  2. Kantabutra, S. Measuring corporate sustainability: A Thai approach. Meas. Bus. Excel. 2014, 18, 73–88. [Google Scholar] [CrossRef]
  3. Kantabutra, S. Relating vision-based leadership to sustainable business performance: A Thai perspective. Kravis Leader. Inst. Leader. Rev. 2006, 6, 37–53. [Google Scholar]
  4. Khunthongjan, S.; Wiboonpongse, A. A study of performance of SMEs in their application of sufficiency economy philosophy. GMSARN Int. J. 2010, 4, 177–182. [Google Scholar]
  5. Suttipun, M.; Arwae, A. The influence of sufficiency economy philosophy practice on SMEs’ performance in Thailand. Entrep. Bus. Econ. Rev. 2020, 8, 179–198. [Google Scholar] [CrossRef]
  6. Suttipun, M. The longitudinal study of sufficiency economy philosophy reporting of listed companies in the Stock Exchange of Thailand. Asia-Pac. J. Bus. Adm. 2019, 11, 187–206. [Google Scholar] [CrossRef]
  7. Kantabutra, S. Development of the sufficiency economy philosophy in the Thai business sector: Evidence, future research & policy implications. In Seminar on Sufficiency Economy, Crown Property Bureau, Bangkok, Thailand). For a Fuller Discussion of the Concept, See UNDP, Thailand Human Development Report; Citeseer: Princeton, NJ, USA, 2007. [Google Scholar]
  8. Sasin Graduate Institute of Business Admisitration of Chulalongkorn University. Corporate Sustainability under the Sufficiency Economy Philosophy; The National Economic and Social Development Board of Thailand: Bangkok, Thailand, 2010. [Google Scholar]
  9. Buranapin, S.; Ratthawatankul, T. Philosophy of sufficiency economy and business sustainability: A framework for operational implications. J. Bus. Behav. Sci. 2015, 27, 115. [Google Scholar]
  10. Isarangkun, C.; Pootrakool, K. Sustainable Economic Development through the Sufficiency Economy Philosophy; National Economic and Social Development Board of Thailand: Bangkok, Thailand, 2001; pp. 1–14. [Google Scholar]
  11. Mongsawad, P. The philosophy of the sufficiency economy: A contribution to the theory of development. Asia Pac. Dev. J. 2012, 17, 123–143. [Google Scholar] [CrossRef] [Green Version]
  12. Song, H. Sufficiency economy philosophy: Buddhism-based sustainability framework in Thailand. Bus. Strat. Environ. 2020, 29, 2995–3005. [Google Scholar] [CrossRef]
  13. Sornsri, S. The possibility of applying the philosophy of sufficiency economy in organizational purchasing. UWF Umw. 2016, 24, 393–407. [Google Scholar] [CrossRef]
  14. Suttipun, M.; Saefu, S. Investigation of sufficiency economy philosophy reporting in Thailand. DLSU Bus. Econ. Rev. 2017, 26, 53–65. [Google Scholar]
  15. Wibulswasdi, C.; Piboolsravut, P.; Pootrakool, K. Sufficiency Economy Philosophy and Development; Sufficiency Economy Research Project, Bureau of the Crown Property: Bangkok, Thailand, 2011. [Google Scholar]
  16. Kantabutra, S. Achieving corporate sustainability: Toward a practical theory. Sustainability 2019, 11, 4155. [Google Scholar] [CrossRef] [Green Version]
  17. Kantabutra, S. Putting Rhineland principles into practice in Thailand: Sustainable leadership at Bathroom Design Company. Glob. Bus. Organ. Excel. 2012, 31, 6–19. [Google Scholar] [CrossRef]
  18. Unger, D. Sufficiency economy and the bourgeois virtues. Asian Aff. Am. Rev. 2009, 36, 139–156. [Google Scholar] [CrossRef]
  19. The Stock Exchange of Thailand. Disclosure Guidelines for Listed Companies’ Management; The Stock Exchange of Thailand: Bangkok, Thailand, 2005. [Google Scholar]
  20. The Stock Exchange of Thailand. Fixed income and other product department. In Ground Rules for SET Index Series; The Stock Exchange of Thailand: Bangkok, Thailand, 2019. [Google Scholar]
  21. The Stock Exchange of Thailand. Distribution of Minority Shareholdings (Free Float); The Stock Exchange of Thailand: Bangkok, Thailand, 2019; pp. 1–9. [Google Scholar]
  22. Jiraporn, P.; Kim, Y.S.; Davidson, W.N.; Singh, M. Corporate governance, shareholder rights and firm diversification: An empirical analysis. J. Bank. Financ. 2006, 30, 947–963. [Google Scholar] [CrossRef]
  23. Jiraporn, P.; Ning, Y. Dividend Policy, Shareholder Rights, and Corporate Governance. Shareholder Rights, and Corporate Governance. 18 September 2006. Available online: https://papers.ssrn.com/sol3/papers.cfm?abstract_id=931290 (accessed on 10 December 2020). [CrossRef]
  24. Global Reporting Initiative. Full Set of GRI Standards—English; Global Reporting Initiative: Amsterdam, The Netherlands, 2018. [Google Scholar]
  25. Morhardt, J.E.; Baird, S.; Freeman, K. Scoring corporate environmental and sustainability reports using GRI 2000, ISO 14031 and other criteria. Corp. Soc. Responsib. Environ. Manag. 2002, 9, 215–233. [Google Scholar] [CrossRef]
  26. Yadava, R.N.; Sinha, B. Scoring sustainability reports using GRI 2011 guidelines for assessing environmental, economic, and social dimensions of leading public and private Indian companies. J. Bus. Ethic. 2016, 138, 549–558. [Google Scholar] [CrossRef]
  27. Chalmers, J.M.; Dann, L.Y.; Harford, J. Managerial opportunism? Evidence from directors’ and officers’ insurance purchases. J. Financ. 2002, 57, 609–636. [Google Scholar]
  28. Rajverma, A.K.; Misra, A.; Mohapatra, S.; Chandra, A. Impact of ownership structure and dividend on firm performance and firm risk. Manag. Financ. 2019, 45, 1041–1061. [Google Scholar] [CrossRef]
  29. Janmaimool, P.; Denpaiboon, C. Rural villagers’ quality of life improvement by economic self-reliance practices and trust in the philosophy of sufficiency economy. Societies 2016, 6, 26. [Google Scholar] [CrossRef] [Green Version]
  30. Jitsuchon, S. Thailand’s sufficiency economy philosophy as an alternative path to sustainable development. Eur. J. Sustain. Dev. 2019, 8, 191. [Google Scholar] [CrossRef]
  31. Piboolsravut, P. Sufficiency economy. Asean Econ. Bull. 2004, 21, 127–134. [Google Scholar] [CrossRef]
  32. Isarangkun, C.; Pootrakool, K. Sustainable economic development through the sufficiency economy philosophy. Natl. Econ. Soc. Dev. Board Thail. 2005, 6, 2006. [Google Scholar]
  33. Chatjuthamard, P.; Lawatanatrakul, V.; Pisalyaput, N.; Srivibha, V. Sufficiency economy philosophy and firm risks. SSRN Electron. J. 2016. [Google Scholar] [CrossRef]
  34. Supawadee, K.; Apichai, P.; Aree, W. A complete report of small and medium enterprises according to the royal initiative sufficiency economy principles: Present to Thailand research fund. J. Hum. Soc. Sci. 2011, 2, 111–121. [Google Scholar]
  35. Kantabutra, S.; Ketprapakorn, N. Toward a theory of corporate sustainability: A theoretical integration and exploration. J. Clean. Prod. 2020, 270, 122292. [Google Scholar] [CrossRef]
  36. Naciti, V. Corporate governance and board of directors: The effect of a board composition on firm sustainability performance. J. Clean. Prod. 2019, 237, 117727. [Google Scholar] [CrossRef]
  37. Clarkson, P.M. Revisiting the relation between environmental performance and environmental disclosure: An empirical analysis. Account. Organ. Soc. 2008, 33, 303–327. [Google Scholar] [CrossRef]
  38. Hart, S.L.; Ahuja, G. Does it pay to be green? An empirical examination of the relationship between emission reduction and firm performance. Bus. Strat. Environ. 1996, 5, 30–37. [Google Scholar]
  39. Li, D.; Cao, C.; Zhang, L.; Chen, X.; Ren, S.; Zhao, Y. Effects of corporate environmental responsibility on financial performance: The moderating role of government regulation and organizational slack. J. Clean. Prod. 2017, 166, 1323–1334. [Google Scholar] [CrossRef]
  40. Miller, J.S.; Wiseman, R.M.; Gomez-Mejia, L.R. The fit between CEO compensation design and firm risk. Acad. Manag. J. 2002, 45, 745–756. [Google Scholar]
  41. Jo, H.; Na, H. Does CSR reduce firm risk? Evidence from controversial industry sectors. J. Bus. Ethics 2012, 110, 441–456. [Google Scholar]
  42. Irvine, P.J.; Pontiff, J. Idiosyncratic return volatility, cash flows, and product market competition. Rev. Financ. Stud. 2009, 22, 1149–1177. [Google Scholar] [CrossRef]
  43. Goyal, A.; Santa-Clara, P. Idiosyncratic risk matters! J. Financ. 2003, 58, 975–1007. [Google Scholar] [CrossRef]
  44. Cao, C.; Simin, T.; Zhao, J. Can growth options explain the trend in idiosyncratic risk? Rev. Financ. Stud. 2008, 21, 2599–2633. [Google Scholar] [CrossRef] [Green Version]
  45. Cai, L.; Cui, J.; Jo, H. Corporate environmental responsibility and firm risk. J. Bus. Ethic. 2016, 139, 563–594. [Google Scholar] [CrossRef]
  46. Bouslah, K.B.H.; Kryzanowski, L.; M’Zali, B. Social performance and firm risk: Impact of the financial crisis. J. Bus. Ethic. 2018, 149, 643–669. [Google Scholar] [CrossRef] [Green Version]
  47. Benlemlih, M.; Shaukat, A.; Qiu, Y.; Trojanowski, G. Environmental and social disclosures and firm risk. J. Bus. Ethic. 2018, 152, 613–626. [Google Scholar] [CrossRef]
  48. Brown, G.; Kapadia, N. Firm-specific risk and equity market development. J. Financ. Econ. 2007, 84, 358–388. [Google Scholar] [CrossRef]
  49. Ben-Zion, U.; Shalit, S.S. Size, leverage, and dividend record as determinants of equity risk. J. Financ. 1975, 30, 1015–1026. [Google Scholar] [CrossRef]
  50. Hu, H.; Dou, B.; Wang, A. Corporate social responsibility information disclosure and corporate fraud—“Risk Reduction” effect or “Window Dressing” effect? Sustainability 2019, 11, 1141. [Google Scholar] [CrossRef] [Green Version]
  51. Mishra, S.; Modi, S.B. Positive and negative corporate social responsibility, financial leverage, and idiosyncratic risk. J. Bus. Ethics 2013, 117, 431–448. [Google Scholar] [CrossRef]
  52. Orlitzky, M.; Benjamin, J.D. Corporate social performance and firm risk: A meta-analytic review. Bus. Soc. 2001, 40, 369–396. [Google Scholar] [CrossRef]
  53. Sila, V.; Gonzalez, A.; Hagendorff, J. Women on board: Does boardroom gender diversity affect firm risk? J. Corp. Financ. 2016, 36, 26–53. [Google Scholar] [CrossRef] [Green Version]
  54. Ullmann, A.A. Data in search of a theory: A critical examination of the relationships among social performance, social disclosure, and economic performance of U.S. firms. Acad. Manag. Rev. 1985, 10, 540–557. [Google Scholar]
  55. Freeman, R.E.; Harrison, J.S.; Wicks, A.C.; Purnell, L.; De Colle, S. Stakeholder Theory: The State of the Art; Cambridge University Press: Cambridge, UK, 2010. [Google Scholar]
  56. Barnea, A.; Rubin, A. Corporate social responsibility as a conflict between shareholders. J. Bus. Ethics 2010, 97, 71–86. [Google Scholar] [CrossRef]
  57. Fama, E.F.; French, K.R. Multifactor explanations of asset pricing anomalies. J. Financ. 1996, 51, 55–84. [Google Scholar] [CrossRef]
  58. Perez-Quiros, G.; Timmermann, A. Firm size and cyclical variations in stock returns. J. Financ. 2000, 55, 1229–1262. [Google Scholar] [CrossRef]
  59. Miller, M.H.; Rock, K. Dividend policy under asymmetric information. J. Financ. 1985, 40, 1031–1051. [Google Scholar] [CrossRef]
  60. Maydeu-Olivares, A.; Shi, D.; Rosseel, Y. Instrumental variables two-stage least squares (2SLS) vs. maximum likelihood structural equation modeling of causal effects in linear regression models. Struct. Equ. Model. A Multidiscip. J. 2019, 26, 876–892. [Google Scholar] [CrossRef]
Figure 1. Three core principles and two underlying condition of the sufficiency economy philosophy, and SD represents sustainable development located at the center of the three cores.
Sustainability 13 02321 g001
Table 1. The outcomes of company selection from each index.
IndustrySET100
(2008–2018)
SETTHSI
(2015–2018)
SET100
and
SETTHSI
Firms Disclose
Sustainable
Development
Reports
from 2013 to 2018
Agriculture and Food174214
Consumer Products2460
Industrials165213
Property and Construction573605
Resources3043411
Services471488
Technology222243
Total companies1912321434
This table presents the company selection process. The SET100 is the index with the 100 largest market capitalization firms and the SETTHSI is the index with firms on the Thailand sustainability investment list. Initially, 191 firms listed on SET100 from 2008 to 2018, and 23 firms listed on SETTHSI from 2015 to 2018 were the study subjects. However, due to the limitations of sustainable development (SD) reports available and delisting events of a firm, only 34 firms provided sufficient information for the study. As a result, only firms with SD reports (excluded financial sector) available from 2013 to 2018 were selected for the study.
Table 2. Definition of variables.
VariableDefinition
SEP_ecoSEP performance for the economic aspect according to GRI 201–206. that covers
  • economic performance,
  • market presence,
  • indirect economic impacts,
  • procurement practice,
  • anti-corruption,
  • anti-competitive behavior.
SEP_envSEP performance on environmental aspects according to GRI 301–308. that covers
  • materials,
  • energy,
  • water and effluents,
  • biodiversity,
  • emissions,
  • effluent and waste,
  • environmental compliance,
  • supplier environmental assessment.
SEP_socSEP performance on social aspect according to GRI 401–419. that covers
  • employment,
  • labor management relations,
  • occupational health and safety,
  • training and education,
  • diversity and equal opportunity,
  • nondiscrimination,
  • freedom of association and collective bargaining,
  • child labor,
  • forced or compulsory labor,
  • security practices,
  • rights of indigenous peoples,
  • human rights assessment,
  • local communities,
  • supplier social assessment,
  • public policy,
  • customer health and safety,
  • marketing and labeling,
  • customer privacy,
  • socioeconomic compliance.
MODModeration score is defined as a firm which
  • lproduces as planned/targeted/according to demand,
  • produces within capability,
  • has efficient and effective use of resources and core competencies,
  • sets appropriate price of product and service,
  • focuses on long-term result over short-term results,
  • creates business alliances with stakeholders,
  • is not overleveraged,
  • uses local resources or available resources,
  • appropriately consumes, satisfies, and grows.
REAReasonableness score is defined as a firm which
  • makes decisions and actions based on understanding the business and market,
  • makes decisions and action based on rational or result of situation analysis,
  • considers stakeholders’ interest upon making a business decision,
  • focuses on long-term mutual benefits of the firm and stakeholders such as employees, suppliers, customers, and the community,
  • makes decisions based on knowledge and being aware of the consequences,
  • makes decisions based on cause and effects.
SELSelf-immunity score is defined as a firm which
  • performs risk management,
  • diversifies product and services to reduce risk,
  • diversifies business-related input and output (i.e., material sourcing and product sales),
  • performs internal audit, assessment and evaluation function, (e)
  • monitors and identifies business related changes, threats, and risks
  • uses knowledge and information learned to plan for volatility.
KNOKnowledge score is defined as a firm which
  • lprovides training, orientation and performs research and development (R&D) and innovation,
  • accumulates information and implementation overtime for better understanding of the business environment.
ETHMorality score is defined as a firm which
  • performs activity with corporate governance, ethics, morality, code of conduct, integrity, and perseverance,
  • conducts responsible business (i.e., corporate social responsibility (CSR) or environmental preservation),
  • provides employee welfare (i.e., fair remuneration or provident fund)
  • complies with laws.
SEP_scoreSufficiency economy philosophy performance
TATotal assets of a firm
l_TANatural log of total assets
ROEReturn on equity ratio
TDTAtotal-debt-to-total-assets ratio
AgeAge of the firm (years)
l_AgeNatural log of Age
DPRDividend payout ratio is the dividend per share divided by earning per share.
PBPrice-to-Book Value is the share price divided by the book value per share of a firm.
Firm_riskFirm specific risk is the square of residual of Fama and French’s (1993) three factor model.
twocon_AVEAverage of two underlying conditions is the six-year average of KNO and ETH.
MOD, REA, SEL, KNO, and ETH definitions are selected and summarized from previous studies to be used in the process of initiating SEP scoring.
Table 3. Sufficiency economy philosophy (SEP) scoring system: the alignment of the five SEP elements with global reporting initiative (GRI) provisions.
GRI
Provisions
Alignment of GRI Provisions and Five SEP Elements
MODREASELKNOETHAVE
Economic3722
(59.5%)
22
(59.5%)
37
(100%)
12
(32.4%)
32
(86.5%)
25
(67.6%)
Environment10823
(21.3%)
10
(9.3%)
108
(100%)
1
(0.9%)
37
(34.3%)
36
(33.1%)
Social9049
(54.4%)
47
(52.2%)
90
(100%)
15
(16.7%)
74
(82.2%)
55
(61.1%)
Total23594
(40.0%)
79
(33.6%)
235
(100%)
28
(11.9%)
143
(60.9%)
116
(49.3%)
This table shows the cross-functional alignment between global reporting initiative (GRI) disclosure provisions and five SEP elements. Note that some of the GRI provisions may align with more than one SEP elements. Percentage is shown in parentheses.
Table 4. Descriptive statistics.
VariableMeanStandard
Deviation
MinMaxN
SEP_eco41.511.219.768.0204
SEP_env28.615.81.0665.9204
SEP_soc31.312.43.9760.1204
MOD33.512.08.8965.2204
REA33.312.87.9264.7204
SEL33.512.010.761.6204
KNO35.814.63.7066.9204
ETH33.010.911.159.3204
SEP_score33.812.08.8462.7204
Firm_risk0.00150.00220.00000.0254204
TA1.88 × 1083.70 × 1082,468,1522.33 × 109204
l_TA17.91.6014.721.6204
PB2.442.600.55032.0204
TDTA32.414.30.00065.5204
ROE10.722.2−176.890.3204
Firm_Age32.618.02.00105204
l_Age3.340.5730.6934.65204
DPR54.468.9−250648204
twocon_AVE34.310.711.059.3204
This table reports descriptive statistics of all variables included in our analysis. The sample covers 34 Thai listed firms from 2013 to 2018 (excluded financial sector). Variable definitions are provided in Table 2. Data is sourced from the DataStream database, Bloomberg, the stock exchange of Thailand (SET), and company websites. MOD, REA, SEL, KNO, ETH, SEP_eco, SEP_env, SEP_soc, SEP_score, and twocon_AVE are presented on a scale of 0 to 100.
Table 5. Hausman test for panel data.
Dependent VariableChi2Prob > Chi2Test Summary
Firm_risk19.20.0076Fixed effects
Table 6. Fixed-effects regression results.
Panel A: SD Three Aspects and Firm RisksPanel B: SEP Five Elements and Firm Risks
Model 1Model 2Model 3Model 4Model 5Model 6Model 7Model 8
SEP_ecoSEP_envSEP_socMODREASELKNOETH
−4.06 × 10⁻⁵−4.55 × 10⁻⁵ **−1.36 × 10⁻⁵−5.55 × 10⁻⁵ *−4.96 × 10⁻⁵−6.57 × 10⁻⁵ **−3.43 × 10⁻⁵ *−6.96 × 10⁻⁵ **
(0.000)(0.000)(0.000)(0.000)(0.000)(0.000)(0.000)(0.000)
l_TA−0.000619−0.00046−0.000765−0.000485−0.000513−0.000438−0.000502−0.000403
(0.001)(0.001)(0.001)(0.001)(0.001)(0.001)(0.001)(0.001)
PB0.0002150.0002290.0002140.0002190.0002090.0002110.0002180.000218
(0.000)(0.000)(0.000)(0.000)(0.000)(0.000)(0.000)(0.000)
TDTA3.18 × 10−52.76 × 10−53.07 × 10−53.00 × 10−52.90 × 10−53.22 × 10−52.72 × 10−52.98 × 10⁻⁵
(0.000)(0.000)(0.000)(0.000)(0.000)(0.000)(0.000)(0.000)
ROE3.33 × 10−53.34 × 10−53.29 × 10−53.48 × 10−53.43 × 10−53.39 × 10−53.40 × 10−53.38 × 10⁻⁵
(0.000)(0.000)(0.000)(0.000)(0.000)(0.000)(0.000)(0.000)
l_Age−0.0002840.000279−0.0009250.0002720.0001750.000391−0.0001410.000425
(0.001)(0.001)(0.001)(0.001)(0.001)(0.001)(0.001)(0.001)
DPR2.09 × 10−6 *1.70 × 10−61.78 × 10−6 *2.04 × 10−6 *1.77 × 10−6 *2.07 × 10−6 *1.90 × 10−62.03 × 10−6 *
(0.000)(0.000)(0.000)(0.000)(0.000)(0.000)(0.000)(0.000)
Constant0.01320.008230.01680.009160.009860.008230.01030.00765
(0.012)(0.009)(0.011)(0.011)(0.011)(0.010)(0.010)(0.011)
Observations204204204204204204204204
R-squared0.0630.0760.0560.0660.0650.0690.070.069
This table reports the fixed-effects regression (FE) results. The sample covers 34 Thai listed firms from 2013 to 2018 (excluded financial sector). Variable definitions are provided in Table 2. Data are sourced from the DataStream database, Bloomberg, the stock exchange of Thailand (SET), and company websites. The dependent variable is Firm_risk for models 1 to 8. Panel A, independent variables are the three aspects of sustainability: economic aspect (SEP_eco) for model 1, environmental aspect (SEP_env) for model 2, and social aspect (SEP_soc) for model 3. Panel B, independent variables are the three SEP core principles: moderation (MOD) for model 4, reasonableness (REA) for model 5, and self-immunity (SEL) for model 6. SEP has two underlying conditions: knowledge (KNO) for model 7 and morality (ETH) for model 8. Control variables for all eight models are total assets (in natural log form l_TA), price-to-book ratio (PB), total-debt-to-total-assets ratio (TDTA), return on equity (ROE), firm age (in natural log form l_Age), and dividend payout ratio (DPR). Robust standard errors (clustered by firm for ordinary least-squares) are reported in parentheses. Further, ** and * indicate statistically significant at the 5% and 10% levels, respectively.
Table 7. SEP score and firm risks.
OLSFixed Effects2SLS-IV
Model 9Model 10Model 11
SEP_score−4.11 × 10⁻⁵ **−6.25 × 10⁻⁵ **−0.000155 **
(0.000)(0.000)(0.000)
l_TA3.68 × 10−5−0.0003940.000550 *
(0.000)(0.001)(0.000)
PB−8.09 × 10−50.000214−0.000183 *
(0.000)(0.000)(0.000)
TDTA2.24 × 10−52.88 × 10−52.57 × 10−5
(0.000)(0.000)(0.000)
ROE−1.29 × 10−53.46 × 10−5−1.41 × 10⁻⁶
(0.000)(0.000)(0.000)
l_Age−0.0001450.000472−0.000526 *
(0.000)(0.001)(0.000)
DPR−8.10 × 10−72.00 × 10−6 *8.53 × 10−7
(0.000)(0.000)(0.000)
Constant0.002390.00717−0.00173
(0.003)(0.011)(0.004)
Observations204204204
R-squared0.0910.071
This table reports the results of three regression methods: ordinary least squares (OLS), fixed-effects regression (FE), and instrumental variable two-stage least squares (2SLS-IV). The sample covers 34 Thai listed firms from 2013 to 2018 (excluding the financial sector). Variable definitions are provided in Table 2. Data are sourced from the DataStream database, Bloomberg, the stock exchange of Thailand (SET), and company websites. The dependent variable is Firm_risk and the independent variable is SEP_score. Control variables for all eight models are total assets (in natural log form l_TA), price-to-book ratio (PB), total-debt-to-total-assets ratio (TDTA), return on equity (ROE), firms age (in natural log form l_Age), and dividend payout ratio (DPR). Robust standard errors (clustered by firm for OLS) are reported in parentheses. Further, ** and * indicate statistically significant at the 5% and 10% levels, respectively.
Publisher’s Note: MDPI stays neutral with regard to jurisdictional claims in published maps and institutional affiliations.

