Rethinking Corporate Responsibility and Sustainability in Light of Economic Performance
Abstract
1. Introduction
2. Literature Review
2.1. Sustainable Development
2.2. Interconnecting Corporate Responsibility and Sustainability Development
3. Research Methodology
3.1. Sample Selection and Variables
3.2. Hypothesis and Methods
- α1, α2,…, αp, ε—parameters of linear regression;
- x1, x2,…, xp—dependent variables;
- y—independent variable.
- ρ—Spearman rank correlation value;
- d—margin of each pair value;
- n—Spearman rank pair values.
- w, x—vectors of weights and inputs;
- b—bias;
- φ—activation function.
- n—input variable;
- f(n)—output variable.
- η, ξ—endogenous and exogenous latent variables;
- B—matrix of regression coefficients relating the latent endogenous variables to each other;
- Γ—matrix of regression coefficients relating the endogenous variables to exogenous variables;
- ζ—disturbance.
- —mean of the variables x and y;
- σx, σy—standard deviation of the variables x and y.
4. Empirical Results and Discussion
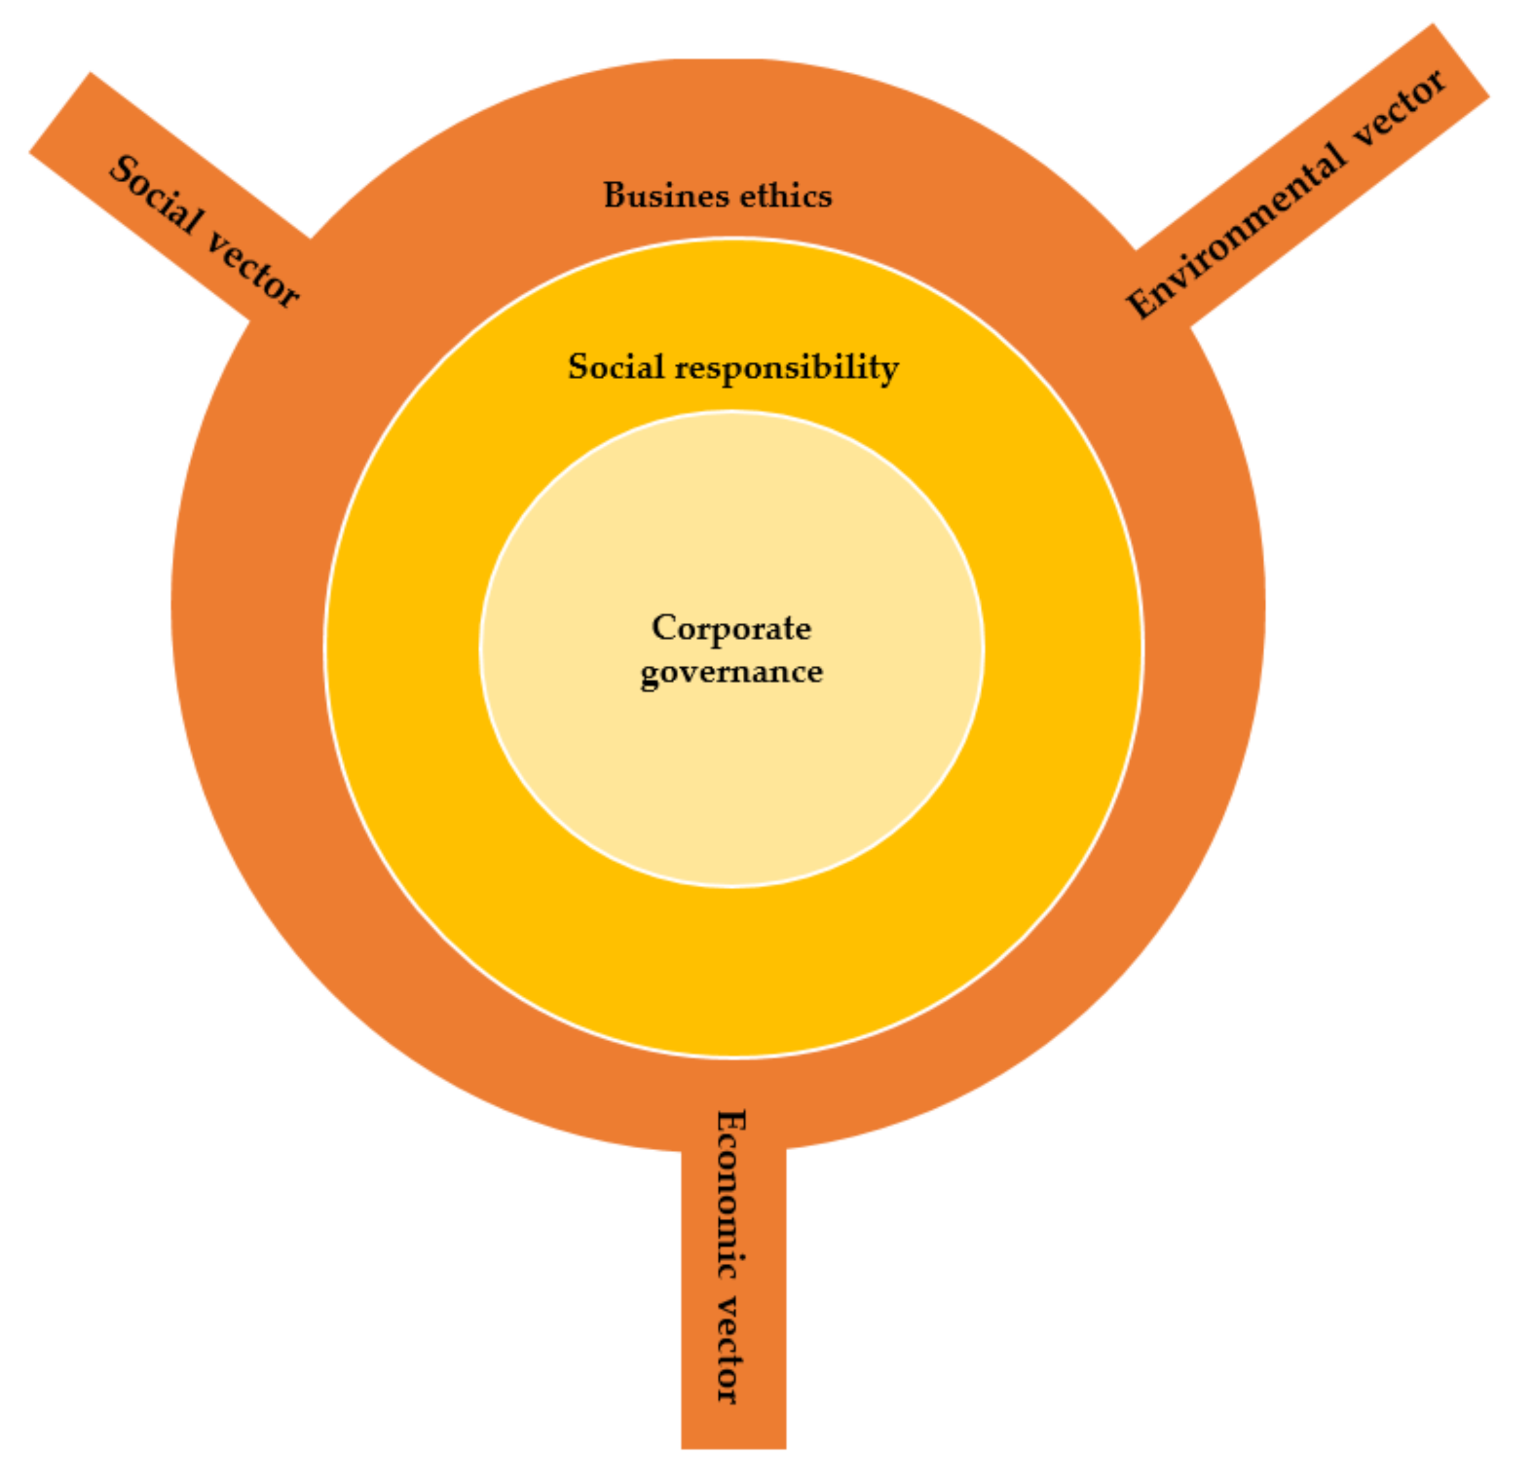
5. Integrative Approach of Corporate Responsibility to Ensure Sustainable Development
6. Conclusions
Author Contributions
Funding
Institutional Review Board Statement
Informed Consent Statement
Data Availability Statement
Conflicts of Interest
References
- Aguilera, R.; Ruth, V.; Rupp, D.; Williams, C.A.; Ganapathi, J. Putting the S back in corporate social responsibility: A multi-level theory of social change in organizations. Acad. Manag. Rev. 2007, 32, 836–863. [Google Scholar] [CrossRef]
- Nicolaides, A. Corporate social responsibility as an ethical imperative. Athens J. Law 2018, 4, 285–300. [Google Scholar] [CrossRef]
- Tuazon, D.; Corder, G.; McLellan, B. Sustainable development: A review of theoretical contributions. Int. J. Sustain. Futur. Hum. Secur. 2013, 1, 40–48. [Google Scholar] [CrossRef]
- Boyer, R.H.W.; Peterson, N.D.; Arora, P.; Caldwell, K. Five Approaches to social sustainability and an integrated way forward. Sustainability 2016, 8, 878. [Google Scholar] [CrossRef]
- Filho, W.L.; Ulisses, A.; Alves, F.; Pace, P.; Mifsud, M.; Brandli, L.; Caeiro, S.S.; Disterheft, A. Reinvigorating the sustainable development research agenda: The role of the sustainable development goals (SDG). Int. J. Sustain. Dev. World Ecol. 2017, 25, 131–142. [Google Scholar] [CrossRef]
- Ramos, T.B. Development of regional sustainability indicators and the role of academia in this process: The Portuguese practice. J. Clean. Prod. 2009, 17, 1101–1115. [Google Scholar] [CrossRef]
- European Commission. Key European Action Supporting the 2030 Agenda and the Sustainable Development Goals; European Comission: Strasbourg, Germany, 2016. [Google Scholar]
- Josephsen, L. Approaches to the Implementation of the Sustainable Development Goals—Some Considerations on the Theoretical Underpinnings of the 2030 Agenda. Economics Discussion Papers, No 2017-60. Kiel Institute for the World Economy. 2017. Available online: http://www.economics-ejournal.org/economics/discussionpapers/2017-60 (accessed on 22 October 2020).
- United Nations. Transforming Our World: The 2030 Agenda for Sustainable Development. 2015. Available online: https://sustainabledevelopment.un.org/post2015/transformingourworld (accessed on 19 October 2020).
- Lehtonen, M. The environmental-social interface of sustainable development: Capabilities, social capital, institutions. Ecol. Econ. 2004, 49, 199–214. [Google Scholar] [CrossRef]
- Le Blanc, D. Towards Integration at Last? The Sustainable Development Goals as a Network of Targets. UN Department of Economic and Social Affairs 2015, DESA Working Paper No. 141. ST/ESA/2015/DWP/141. Available online: http://www.un.org/esa/desa/papers/2015/wp141_2015.pdf (accessed on 27 October 2020).
- Coopman, A.; Derek, O.; Farooq, U. Seeing the Whole: Implementing the SDGs in an Integrated and Coherent Way. A Research Pilot by Stakeholder Forum, Bioregional and Newcastle University. 2015. Available online: http://lcn.pascalobservatory.org/pascalnow/pascal-activities/news/seeing-whole-implementing-sustainable-development-goals-integrated- (accessed on 25 October 2020).
- Flammer, C. Does corporate social responsibility lead to superior financial performance? A Regression Discontinuity Approach. Manag. Sci. 2015, 61, 2549–2568. [Google Scholar] [CrossRef]
- Carroll, A.B. Corporate social responsibility. Bus. Soc. 1999, 38, 268–295. [Google Scholar] [CrossRef]
- Zingales, L.; Guiso, L.; Sapienza, P. The values of corporate culture. J. Financ. Econ. 2016, 117, 60–76. [Google Scholar]
- Sahut, J.-M.; Peris-Ortiz, M.; Teulon, F. Corporate social responsibility and governance. J. Manag. Gov. 2019, 23, 901–912. [Google Scholar] [CrossRef]
- Dyck, A.; Morse, A.; Zingales, L. How Pervasive Is Corporate Fraud? Working Paper; University of Chicago: Chicago, IL, USA, 2014. [Google Scholar]
- Ntim, C.G.; Opong, K.K.; Danbolt, J. The Relative value relevance of shareholder versus stakeholder corporate governance disclosure policy reforms in South Africa. Corp. Gov. Int. Rev. 2011, 20, 84–105. [Google Scholar] [CrossRef]
- Postel, N.; Rousseau, S. RSE et éthique d’entreprise: La nécessité des institutions. Management 2008, 11, 137–160. [Google Scholar] [CrossRef]
- Ashrafi, M.; Adams, M.; Walker, T.R.; Magnan, G. ‘How corporate social responsibility can be integrated into corporate sustainability: A theoretical review of their relationships’. Int. J. Sustain. Dev. World Ecol. 2018, 25, 672–682. [Google Scholar] [CrossRef]
- Montiel, I. Corporate social responsibility and corporate sustainability separate pasts, common futures. Organ. Environ. 2008, 21, 245–269. [Google Scholar] [CrossRef]
- Linnenluecke, M.K.; Russell, S.V.; Griffiths, A. Subcultures and sustainability practices: The impact on understanding corporate sustainability. Bus. Strategy Environ. 2009, 18, 432–452. [Google Scholar] [CrossRef]
- Lozano, R. Towards better embedding sustainability into companies’ systems: An analysis of voluntary corporate initiatives. J. Clean. Prod. 2012, 25, 14–26. [Google Scholar] [CrossRef]
- Bansal, P.; Song, H.C. Similar but not the same: Differentiating corporate responsibility from sustainability. Acad. Manag. Ann. 2017, 11, 105–149. [Google Scholar] [CrossRef]
- Chang, R.D.; Zuo, J.; Zhao, Z.Y.; Zillante, G.; Gan, X.L.; Soebarto, V. Evolving theories of sustainability and firms: History, future directions and implications for renewable energy SSO research. Renew. Sustain. Energy Rev. 2017, 72, 48–56. [Google Scholar] [CrossRef]
- Montiel, I.; Delgado-Ceballos, J. Defining and measuring corporate sustainability: Are we there yet? Organ. Environ. 2014, 27, 48–56. [Google Scholar] [CrossRef]
- Hahn, T.; Pinkse, J.; Preuss, L.; Figge, F. Tensions in corporate sustainability: Towards an integrative framework. J. Bus. Ethics 2015, 127, 297–316. [Google Scholar] [CrossRef]
- Dyllick, T.L.; Muff, K. Clarifying the meaning of sustainable business: Introducing a typology from business-as-usual to true business sustainability. Organ. Environ. 2015, 29, 156–174. [Google Scholar] [CrossRef]
- Lozano, R. A holistic perspective on corporate sustainability drivers. Corp. Soc. Responsib. Environ. Manag. 2015, 22, 32–44. [Google Scholar] [CrossRef]
- Carroll, A.B. Corporate social responsibility: The centerpiece of competing and complementary frameworks. Organ. Dyn. 2015, 44, 87–96. [Google Scholar] [CrossRef]
- Aguinis, H. Organizational responsibility: Doing good and doing well. In APA Handbook of Industrial and Organizational Psychology; Zedeck, S., Ed.; American Psychological Association: Washington, DC, USA, 2011; Volume 3, pp. 855–879. [Google Scholar]
- Schwartz, M.S.; Carroll, A.B. Integrating and unifying competing and complementary frameworks. Bus. Soc. 2008, 47, 148–186. [Google Scholar] [CrossRef]
- Fassin, Y.; Van Rossem, A.; Buelens, M. Small-business owner-managers’ perceptions of business ethics and CSR-related concepts. J. Bus. Ethics 2011, 98, 425–453. [Google Scholar] [CrossRef]
- Orlitzky, M. Corporate social responsibility, noise, and stock market volatility. Acad. Manag. Perspect. 2013, 27, 238–254. [Google Scholar] [CrossRef]
- Kendall, N. Good corporate governance. Account. Dig. 1999, 40, 42–54. [Google Scholar]
- Ntim, C.G.; Soobaroyen, T. Black economic empowerment disclosures by South African listed corporations: The influence of ownership and board characteristics. J. Bus. Ethics 2013, 116, 121–138. [Google Scholar] [CrossRef]
- Marcus, J.; Kurucz, E.C.; Colbert, B.A. Conceptions of the business-society-nature interface: Implications for management scholarship. Bus. Soc. 2010, 49, 402–438. [Google Scholar] [CrossRef]
- Martínez-Ferrero, J.; Frías-Aceituno, J.V. Relationship between sustainable development and financial performance: International empirical research. Bus. Strategy Environ. 2013, 24, 20–39. [Google Scholar] [CrossRef]
- Elalfy, A.; Palaschuk, N.; El-Bassiouny, D.; Wilson, J.; Weber, O. Scoping the evolution of corporate social responsibility (CSR) research in the sustainable development goals (SDGs) Era. Sustainability 2020, 12, 5544. [Google Scholar] [CrossRef]
- Webb, N.J. Corporate profits and social responsibility: Subsidization of corporate income under charitable. J. Econ. Bus. 1996, 48, 401–421. [Google Scholar] [CrossRef]
- Dowell, G.; Hart, S.; Yeung, B. Do corporate global environmental standards create or destroy market value? Manag. Sci. 2000, 46, 1059–1074. [Google Scholar] [CrossRef]
- Peirö-Signes, A.; Segarra-Ona, M.; Mondejar-Jimenez, J.; Vargas-Vargas, M. Influence of the environmental, social and corporate governance ratings on the economic performance of companies: An overview. Int. J. Environ. Res. 2013, 7, 105–112. [Google Scholar]
- Friede, G.; Busch, T.; Bassen, A. ESG and financial performance: Aggregated evidence from more than 2000 empirical studies. J. Sustain. Financ. Invest. 2015, 5, 210–233. [Google Scholar] [CrossRef]
- Shaukat, A.; Qiu, Y.; Trojanowski, G. Board Attributes, Corporate Social Responsibility Strategy, and Corporate Environmental and Social Performance. J. Bus. Ethics 2016, 135, 569–585. [Google Scholar] [CrossRef]
- Velte, P. Does ESG performance have an impact on financial performance? Evidence from Germany. J. Glob. Responsib. 2017, 8, 169–178. [Google Scholar] [CrossRef]
- Taliento, M.; Favino, C.; Netti, A. Impact of environmental, social, and governance information on economic performance: Evidence of a corporate ‘sustainability advantage’ from Europe. Sustainability 2019, 11, 1738. [Google Scholar] [CrossRef]
- Lokuwaduge, C.S.D.S.; Heenetigala, K. Integrating environmental, social and governance (esg) disclosure for a sustainable development: An australian study. Bus. Strategy Environ. 2017, 26, 438–450. [Google Scholar] [CrossRef]
- Van Beurden, P.; Gössling, T. The worth of values—A literature review on the relation between corporate social and financial performance. J. Bus. Ethics 2008, 82, 407–424. [Google Scholar] [CrossRef]
- Landi, G.; Sciarelli, M. Towards a more ethical market: The impact of ESG rating on corporate financial performance. Soc. Responsib. J. 2018, 15, 11–27. [Google Scholar] [CrossRef]
- Sachs, J.; Schmidt-Traub, G.; Kroll, C.; Lafortune, G.; Fuller, G.; Woelm, F. The Sustainable Development Goals and COVID-19. Sustainable Development Report 2020; Cambridge University Press: Cambridge, UK, 2020. [Google Scholar]
- Candriam. ESG Country Report. 2017. Available online: https://www.candriam.com/en/professional/market-insights/topics/sri/candriam-releases-its-2017-esg-country-report/ (accessed on 26 October 2020).
- World Bank. Doing Business 2020; World Bank: Washington, DC, USA, 2020. [Google Scholar]
- World Bank. World Bank National Accounts Data, and OECD National Accounts Data Files. 2020. Available online: https://data.worldbank.org/indicator/NY.GDP.MKTP.KD.ZG (accessed on 25 October 2020).
- Eurostat. GDP per Capita in PPS. 2020. Available online: http://appsso.eurostat.ec.europa.eu/nui/show.do?dataset=tec00114&lang=en (accessed on 29 October 2020).
- Kaplan, D. Structural Equation Modeling. In International Encyclopedia of the Social and Behavioral Sciences; Neil, J., Smelser, P., Baltes, B., Eds.; Pergamon: Oxford, UK, 2001; pp. 15215–15222. [Google Scholar]
- Everitt, B.S.; Landau, S.; Leese, M. Cluster Analysis, 4th ed.; Wiley Publishing: Hoboken, NJ, USA, 2009. [Google Scholar]
- Sarkar, S.; Searcy, C. Zeitgeist or chameleon? A quantitative analysis of CSR definitions. J. Clean. Prod. 2016, 135, 1423–1435. [Google Scholar] [CrossRef]
- Sitnikov, C.S. Triple Bottom Line. In Encyclopedia of Corporate Social Responsibility; Idowu, S.O., Capaldi, N., Zu, L., Das Gupta, A., Eds.; Springer: New York, NY, USA, 2013; pp. 2558–2564. [Google Scholar]
- Browne, M.W.; Cudeck, R. Alternative Ways of Assessing Model Fit. In Testing Structural Equation Models; SAGE: Newbury Park, CA, USA, 1993; pp. 136–162. ISBN 978-08-0394-507-4. [Google Scholar]
- Jørgensen, T.H.; Remmen, A.; Mellado, M.D. Integrated management systems—Three different levels of integration. J. Clean. Prod. 2006, 14, 713–722. [Google Scholar] [CrossRef]
- Mangra, M.G.; Cotoc, E.; Dumitru, A. Sustainable economic development through environmental management systems implementation. J. Stud. Soc. Sci. 2014, 6, 1–14. [Google Scholar]

| Variable | N | Minimum | Maximum | Mean | Std. Deviation | Skewness | Kurtosis |
|---|---|---|---|---|---|---|---|
| S | 28 | 70.80 | 84.70 | 78.2857 | 3.27354 | 0.058 | 0.088 |
| CSR | 28 | 48.75 | 93.85 | 75.4232 | 10.32313 | −0.497 | 0.036 |
| CG | 28 | 54.30 | 85.30 | 75.9286 | 6.04366 | −0.392 | 1.191 |
| BE | 28 | 66.10 | 85.30 | 76.4750 | 4.51373 | −0.273 | −0.016 |
| GDPg | 28 | −1.03 | 7.06 | 2.3950 | 1.46557 | 0.835 | 3.287 |
| GDPw | 28 | 53 | 261 | 102.11 | 42.038 | 2.360 | 7.238 |
| Valid N (listwise) | 28 |
| S | CSR | CG | BE | ||
|---|---|---|---|---|---|
| S | Correlation Coefficient | 1.000 | 0.131 | 0.566 ** | 0.609 ** |
| Sig. (2-tailed) | 0.505 | 0.002 | 0.001 | ||
| N | 28 | 28 | 28 | 28 | |
| CSR | Correlation Coefficient | 0.131 | 1.000 | 0.134 | 0.062 |
| Sig. (2-tailed) | 0.505 | 0.497 | 0.755 | ||
| N | 28 | 28 | 28 | 28 | |
| CG | Correlation Coefficient | 0.566 ** | 0.134 | 1.000 | 0.709 ** |
| Sig. (2-tailed) | 0.002 | 0.497 | 0.000 | ||
| N | 28 | 28 | 28 | 28 | |
| BE | Correlation Coefficient | 0.609 ** | 0.062 | 0.709 ** | 1.000 |
| Sig. (2-tailed) | 0.001 | 0.755 | 0.000 | ||
| N | 28 | 28 | 28 | 28 |
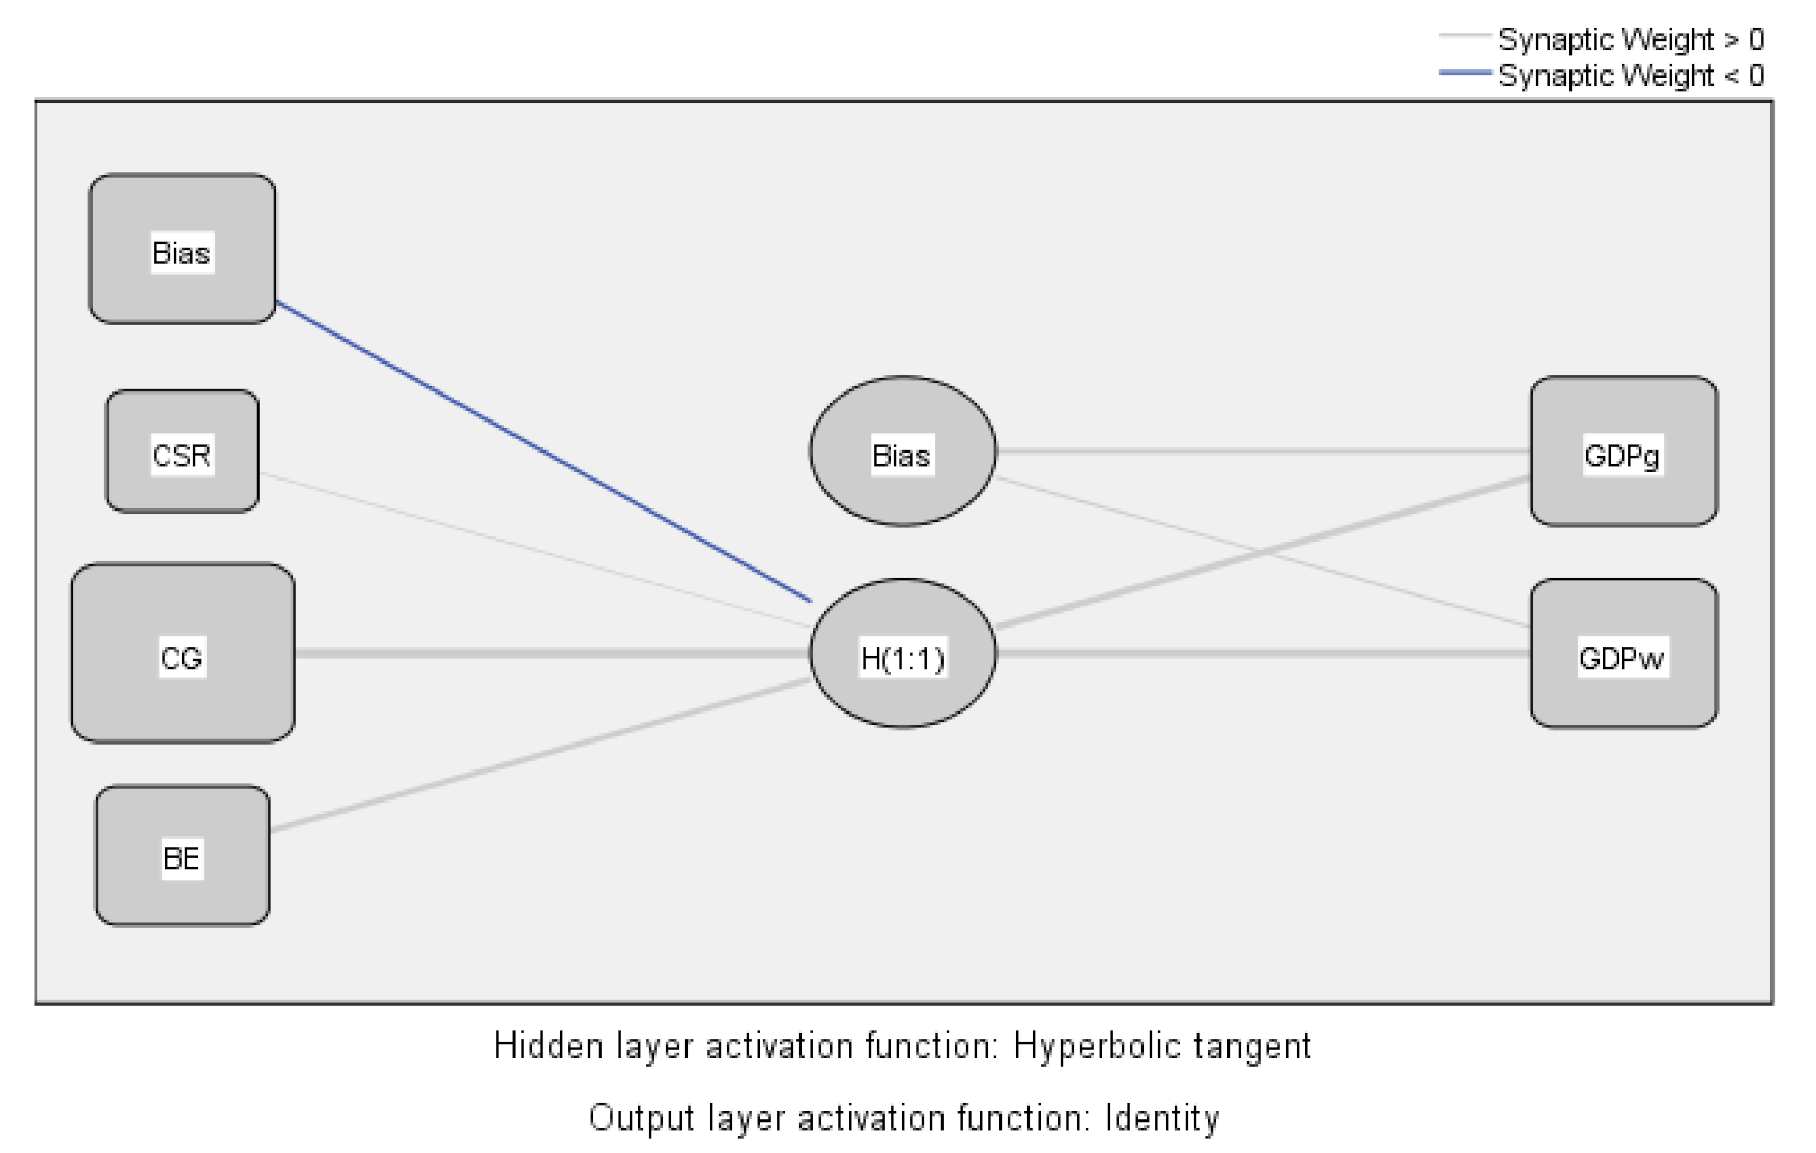
| Predictor | Predicted | |||||
|---|---|---|---|---|---|---|
| Hidden Layer 1 | Output Layer | |||||
| H(1:1) | GDPg | GDPw | Importance | Normalized Importance | ||
| Input Layer | (Bias) | −0.055 | ||||
| CSR | 0.041 | 0.029 | 4.0% | |||
| CG | 1.035 | 0.729 | 100.0% | |||
| BE | 0.309 | 0.242 | 33.2% | |||
| Hidden Layer 1 | (Bias) | 0.068 | 0.047 | |||
| H(1:1) | 0.422 | 0.781 | ||||
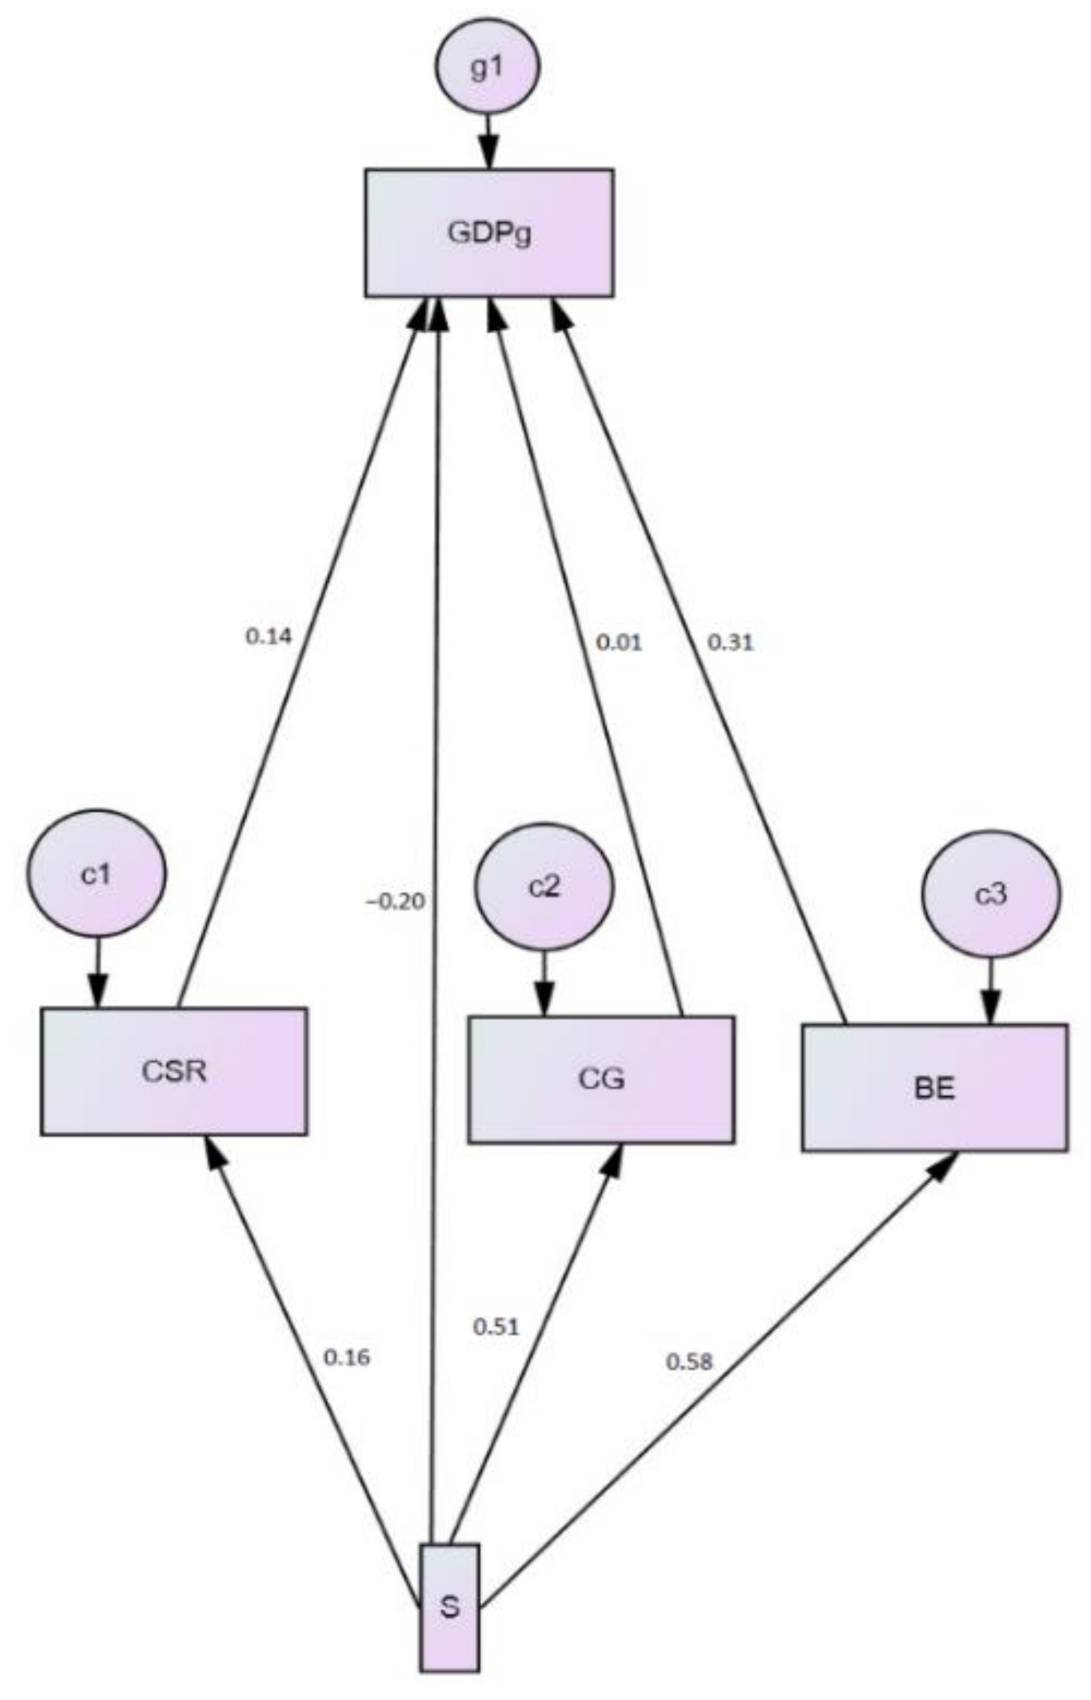
| Total Standardized Effects | Direct Standardized Effects | Indirect Standardized Effects | ||||||||||||
|---|---|---|---|---|---|---|---|---|---|---|---|---|---|---|
| S | BE | CSR | CG | S | BE | CSR | CG | S | BE | CSR | CG | |||
| BE | 0.577 | 0.000 | 0.000 | 0.000 | BE | 0.577 | 0.000 | 0.000 | 0.000 | BE | 0.000 | 0.000 | 0.000 | 0.000 |
| CSR | 0.157 | 0.000 | 0.000 | 0.000 | CSR | 0.157 | 0.000 | 0.000 | 0.000 | CSR | 0.000 | 0.000 | 0.000 | 0.000 |
| CG | 0.509 | 0.000 | 0.000 | 0.000 | CG | 0.509 | 0.000 | 0.000 | 0.000 | CG | 0.000 | 0.000 | 0.000 | 0.000 |
| GDPg | 0.007 | 0.312 | 0.137 | 0.014 | GDPg | −0.202 | 0.312 | 0.137 | 0.014 | GDPg | 0.209 | 0.000 | 0.000 | 0.000 |
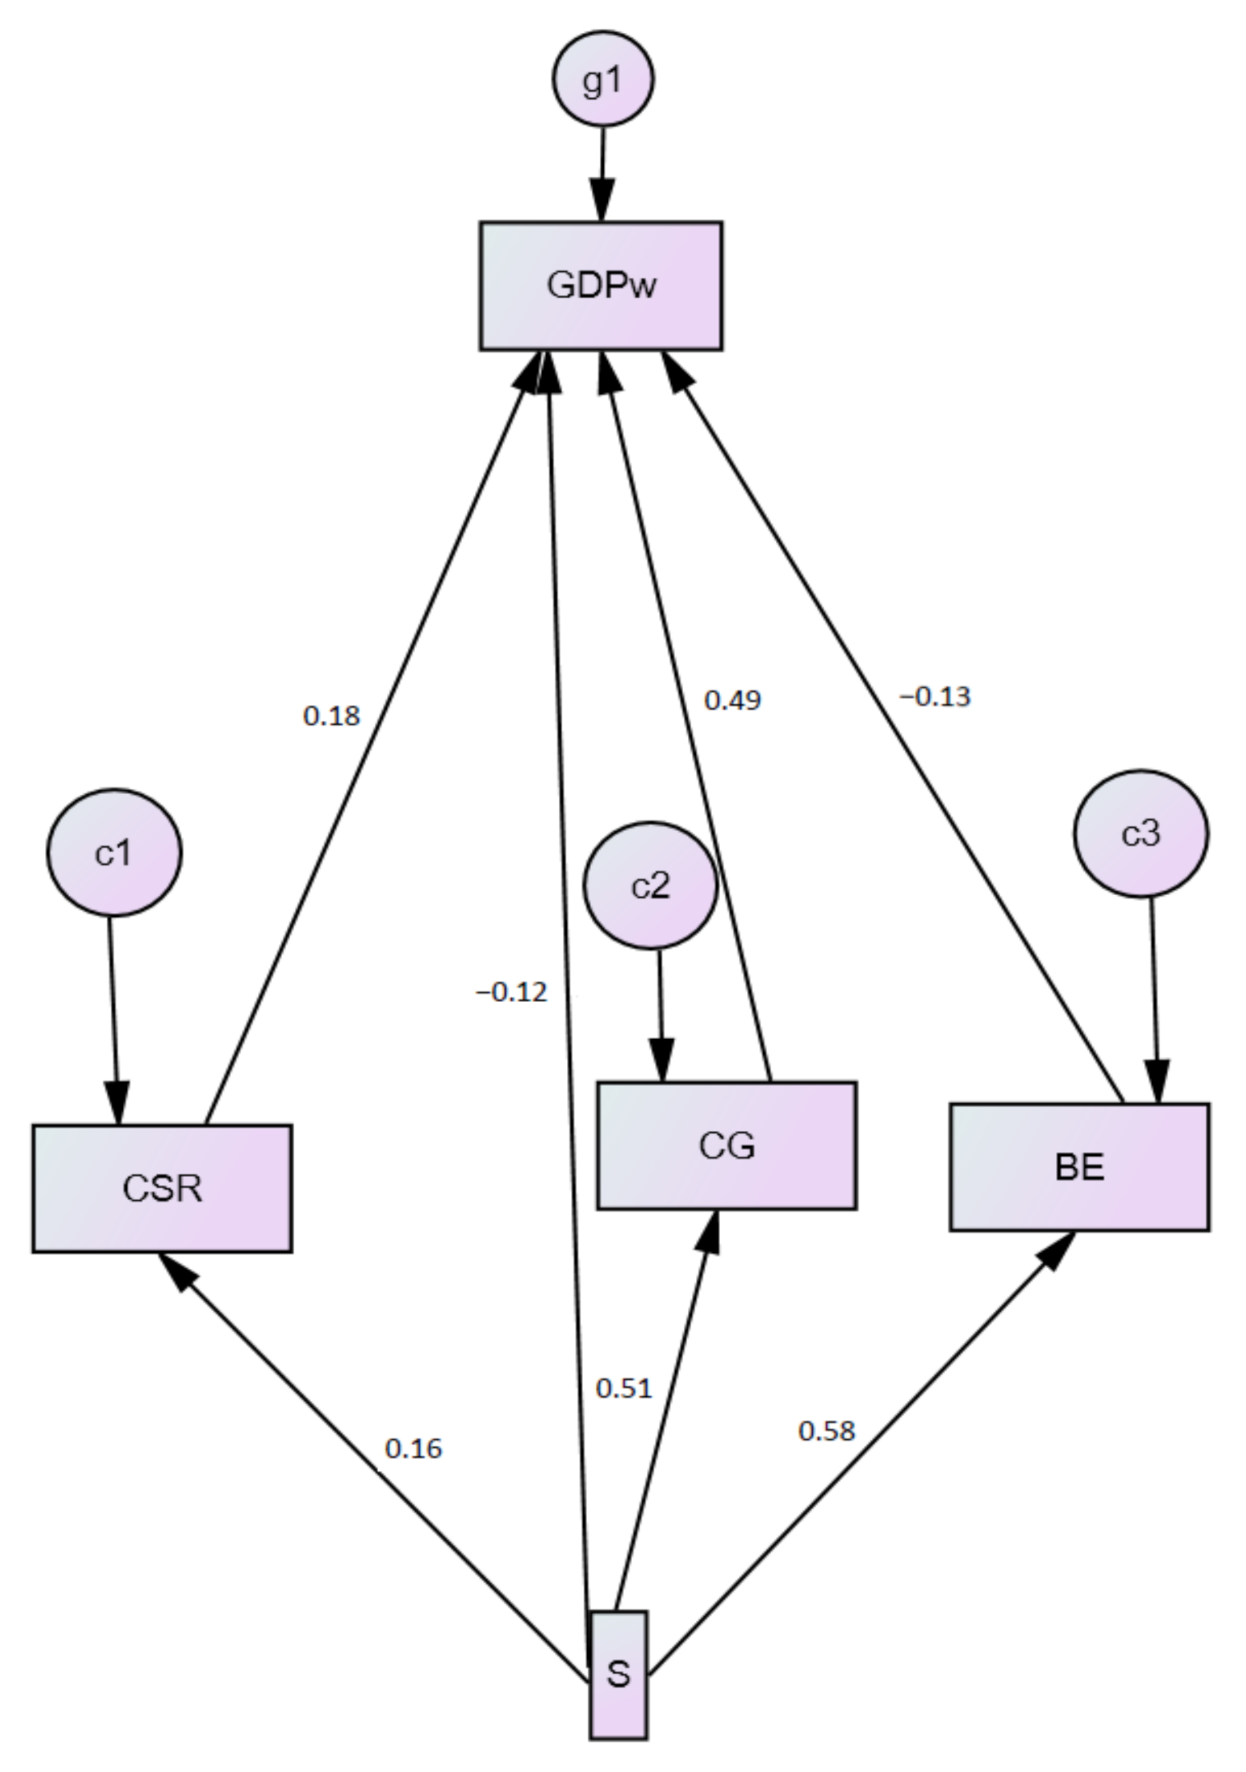
| Total Standardized Effects | Direct Standardized Effects | Indirect Standardized Effects | ||||||||||||
|---|---|---|---|---|---|---|---|---|---|---|---|---|---|---|
| S | BE | CSR | CG | S | BE | CSR | CG | S | BE | CSR | CG | |||
| BE | 0.509 | 0.000 | 0.000 | 0.000 | BE | 0.509 | 0.000 | 0.000 | 0.000 | BE | 0.000 | 0.000 | 0.000 | 0.000 |
| CSR | 0.577 | 0.000 | 0.000 | 0.000 | CSR | 0.577 | 0.000 | 0.000 | 0.000 | CSR | 0.000 | 0.000 | 0.000 | 0.000 |
| CG | 0.157 | 0.000 | 0.000 | 0.000 | CG | 0.157 | 0.000 | 0.000 | 0.000 | CG | 0.000 | 0.000 | 0.000 | 0.000 |
| GDPw | 0.084 | 0.487 | −0.126 | 0.175 | GDPw | −0.119 | 0.487 | −0.126 | 0.175 | GDPw | 0.203 | 0.000 | 0.000 | 0.000 |
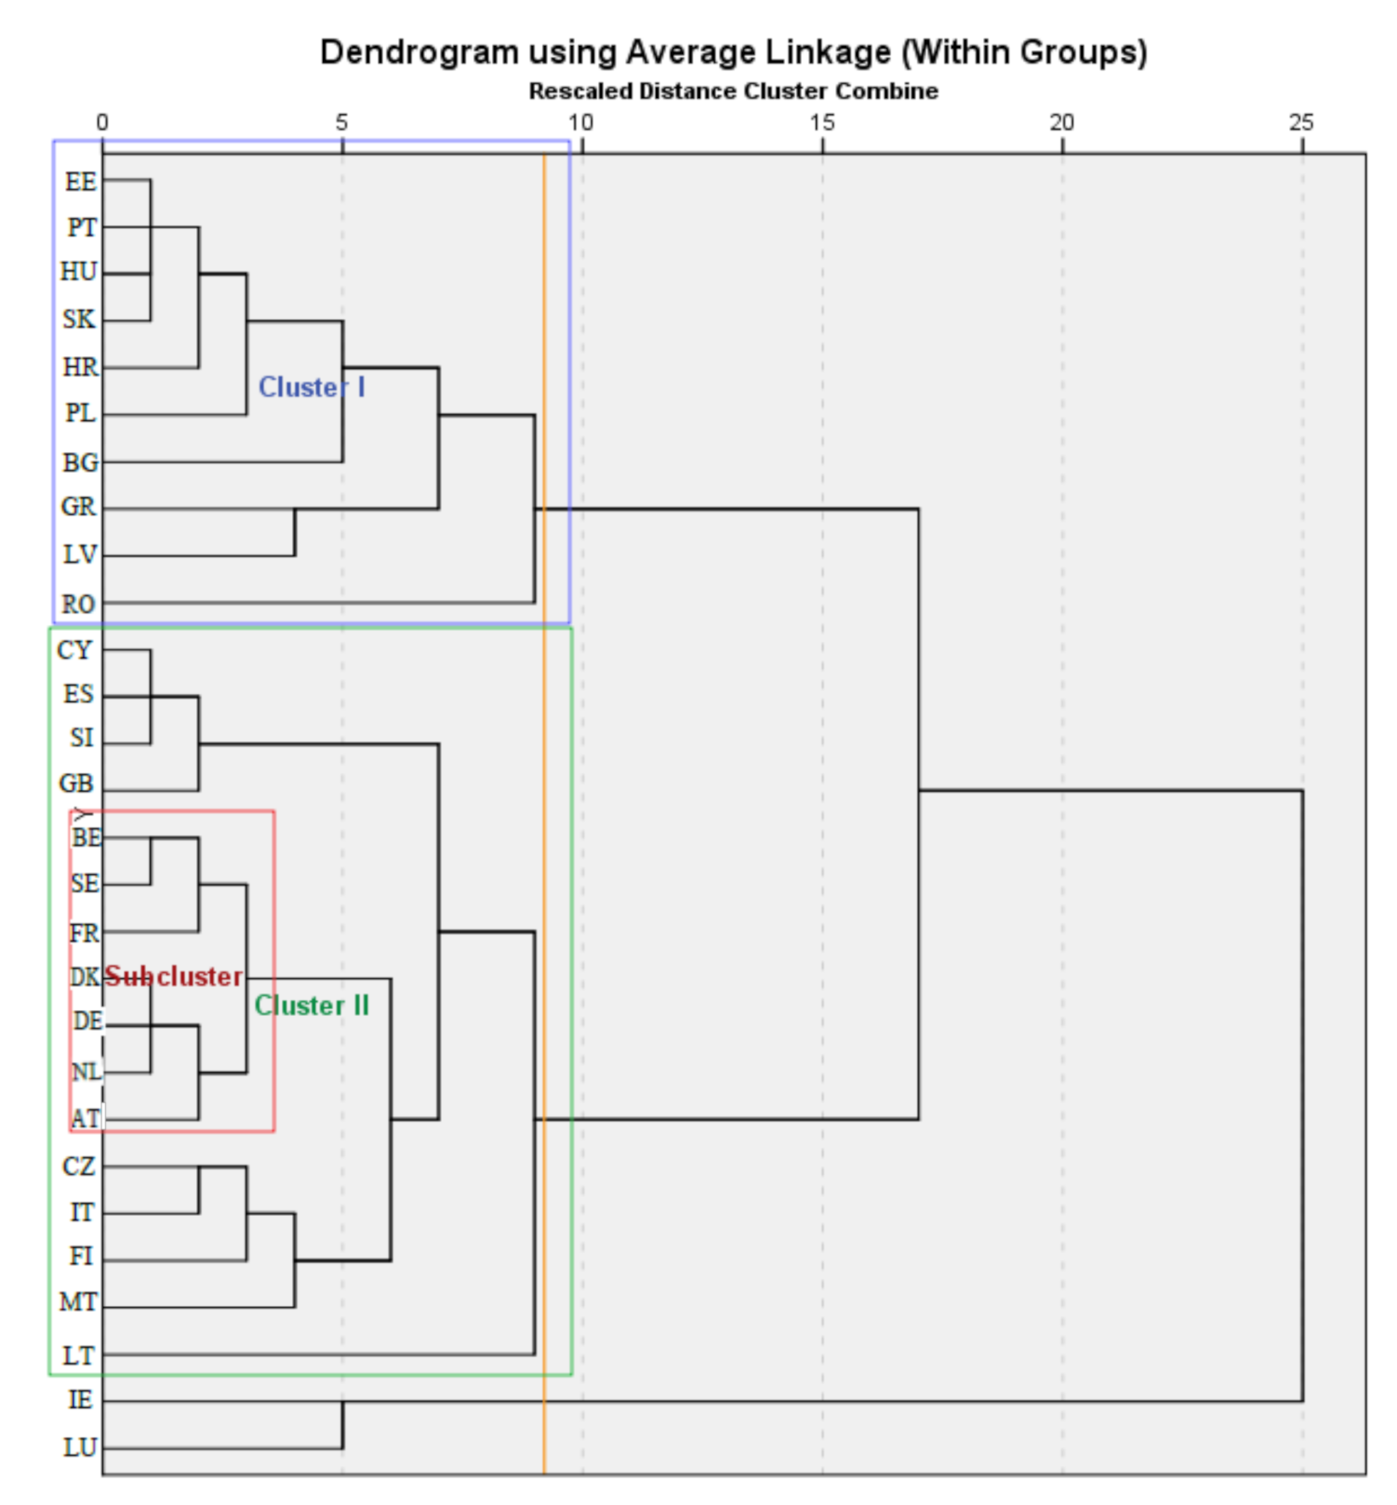
| Stage | Cluster Combined | Coefficients | Appears | Next Stage | ||
|---|---|---|---|---|---|---|
| Cluster 1 | Cluster 2 | Cluster 1 | Cluster 2 | |||
| 1 | 8 | 22 | 1.000 | 0 | 0 | 7 |
| 2 | 5 | 26 | 0.999 | 0 | 0 | 4 |
| 3 | 7 | 11 | 0.999 | 0 | 0 | 8 |
| 4 | 5 | 25 | 0.998 | 2 | 0 | 10 |
| 5 | 13 | 24 | 0.998 | 0 | 0 | 7 |
| 6 | 2 | 27 | 0.998 | 0 | 0 | 9 |
| 7 | 8 | 13 | 0.996 | 1 | 5 | 13 |
| 8 | 7 | 20 | 0.996 | 3 | 0 | 11 |
| 9 | 2 | 10 | 0.995 | 6 | 0 | 15 |
| 10 | 5 | 28 | 0.994 | 4 | 0 | 23 |
| 11 | 1 | 7 | 0.994 | 0 | 8 | 15 |
| 12 | 6 | 15 | 0.993 | 0 | 0 | 14 |
| 13 | 4 | 8 | 0.992 | 0 | 7 | 16 |
| 14 | 6 | 9 | 0.991 | 12 | 0 | 17 |
| 15 | 1 | 2 | 0.991 | 11 | 9 | 21 |
| 16 | 4 | 21 | 0.989 | 13 | 0 | 20 |
| 17 | 6 | 19 | 0.987 | 14 | 0 | 21 |
| 18 | 12 | 16 | 0.984 | 0 | 0 | 22 |
| 19 | 14 | 18 | 0.982 | 0 | 0 | 27 |
| 20 | 3 | 4 | 0.981 | 0 | 16 | 22 |
| 21 | 1 | 6 | 0.977 | 15 | 17 | 23 |
| 22 | 3 | 12 | 0.974 | 20 | 18 | 25 |
| 23 | 1 | 5 | 0.973 | 21 | 10 | 24 |
| 24 | 1 | 17 | 0.966 | 23 | 0 | 26 |
| 25 | 3 | 23 | 0.965 | 22 | 0 | 26 |
| 26 | 1 | 3 | 0.933 | 24 | 25 | 27 |
| 27 | 1 | 14 | 0.899 | 26 | 19 | 0 |
| Country | S (Score) | CSR (Score) | CG (Score) | BE (Score) | GDPg (Percentage) | GDPw (Percentage) |
|---|---|---|---|---|---|---|
| Bulgaria | 74.8 | 65.13 | 72.0 | 72.0 | 2.75 | 53 |
| Croatia | 78.4 | 66.30 | 73.6 | 73.6 | 1.48 | 65 |
| Estonia | 80.1 | 81.47 | 80.6 | 80.6 | 4.43 | 84 |
| Greece | 74.3 | 48.75 | 68.4 | 68.4 | −1.03 | 68 |
| Hungary | 77.3 | 71.86 | 73.4 | 73.4 | 3.14 | 73 |
| Latvia | 77.7 | 62.21 | 80.3 | 80.3 | 3.56 | 69 |
| Poland | 78.1 | 85.75 | 76.4 | 76.4 | 3.72 | 73 |
| Portugal | 77.6 | 77.77 | 76.5 | 76.5 | 1.01 | 79 |
| Romania | 74.8 | 93.85 | 73.3 | 73.3 | 3.78 | 69 |
| Slovakia | 77.5 | 69.22 | 75.6 | 75.6 | 2.56 | 74 |
| Mean values of cluster | 77.06 | 72.23 | 75.01 | 75.01 | 2.54 | 70.70 |
| Mean values at UE level | 78.29 | 75.42 | 75.93 | 76.48 | 2.40 | 102.11 |
| Country | S (Score) | CSR (Score) | CG (Score) | BE (Score) | GDPg (Percentage) | GDPw (Percentage) |
|---|---|---|---|---|---|---|
| Austria | 70.8 | 82.9 | 78.7 | 78.7 | 1.73 | 127 |
| Belgium | 80 | 72.62 | 75.0 | 75.0 | 1.65 | 117 |
| Cyprus | 75.2 | 61.56 | 73.4 | 73.4 | 1.63 | 89 |
| Czech Republic | 80.6 | 80.54 | 76.3 | 76.3 | 2.50 | 92 |
| Denmark | 84.6 | 86.35 | 85.3 | 85.3 | 2.02 | 129 |
| Finland | 83.8 | 86.35 | 80.2 | 80.2 | 1.46 | 111 |
| France | 81.1 | 73.77 | 76.8 | 76.8 | 1.58 | 106 |
| Germany | 80.8 | 85.62 | 79.7 | 79.7 | 1.84 | 121 |
| Italy | 77.0 | 86.8 | 72.9 | 72.9 | 0.45 | 95 |
| Lithuania | 75.0 | 77.43 | 54.3 | 81.6 | 3.72 | 82 |
| Malta | 76.0 | 87.52 | 66.1 | 66.1 | 2.87 | 99 |
| Netherlands | 80.4 | 78.56 | 76.1 | 76.1 | 1.75 | 128 |
| Slovenia | 79.8 | 66.96 | 76.5 | 76.5 | 2.04 | 88 |
| Spain | 78.1 | 65.45 | 77.9 | 77.9 | 1.55 | 91 |
| Sweden | 84.7 | 73.09 | 82.0 | 82.0 | 2.35 | 120 |
| United Kingdom | 79.8 | 77.97 | 83.5 | 83.5 | 2.01 | 105 |
| Mean values of cluster | 79.23 | 77.72 | 75.92 | 77.63 | 1.95 | 106.25 |
| Mean values at UE level | 78.29 | 75.42 | 75.93 | 76.48 | 2.40 | 102.11 |
| Country | S (Score) | CSR (Score) | CG (Score) | BE (Score) | GDPg (Percentage) | GDPw (Percentage) |
|---|---|---|---|---|---|---|
| Austria | 70.8 | 82.9 | 78.7 | 78.7 | 1.73 | 127 |
| Belgium | 80.0 | 72.62 | 75.0 | 75.0 | 1.65 | 117 |
| Denmark | 84.6 | 86.35 | 85.3 | 85.3 | 2.02 | 129 |
| France | 81.1 | 73.77 | 76.8 | 76.8 | 1.58 | 106 |
| Germany | 80.8 | 85.62 | 79.7 | 79.7 | 1.84 | 121 |
| Netherlands | 80.4 | 78.56 | 76.1 | 76.1 | 1.75 | 128 |
| Sweden | 84.7 | 73.09 | 82.0 | 82.0 | 2.35 | 120 |
| Mean values of subcluster | 80.34 | 78.99 | 79.09 | 79.09 | 1.85 | 121.14 |
| Mean values of cluster | 79.23 | 77.72 | 75.92 | 77.63 | 1.95 | 106.25 |
| Mean values at UE level | 78.29 | 75.42 | 75.93 | 76.48 | 2.40 | 102.11 |
| Domain | Tools |  Organizational sustainability implementation program | Output | Directions |
| Corporate governance | Corporate governance codes | Sustainable development | Economic vector | |
| Social responsibility of the organization | Initiatives in the area of social responsibility; Standards (ISO 26000); Tools for measuring social and environmental performance | Social vector | ||
| Business ethics | Codes of ethics; Codes of conduct | Environmental vector |
Publisher’s Note: MDPI stays neutral with regard to jurisdictional claims in published maps and institutional affiliations. |
© 2021 by the authors. Licensee MDPI, Basel, Switzerland. This article is an open access article distributed under the terms and conditions of the Creative Commons Attribution (CC BY) license (http://creativecommons.org/licenses/by/4.0/).
Share and Cite
Vărzaru, A.A.; Bocean, C.G.; Nicolescu, M.M. Rethinking Corporate Responsibility and Sustainability in Light of Economic Performance. Sustainability 2021, 13, 2660. https://doi.org/10.3390/su13052660
Vărzaru AA, Bocean CG, Nicolescu MM. Rethinking Corporate Responsibility and Sustainability in Light of Economic Performance. Sustainability. 2021; 13(5):2660. https://doi.org/10.3390/su13052660
Chicago/Turabian StyleVărzaru, Anca Antoaneta, Claudiu George Bocean, and Michael Marian Nicolescu. 2021. "Rethinking Corporate Responsibility and Sustainability in Light of Economic Performance" Sustainability 13, no. 5: 2660. https://doi.org/10.3390/su13052660
APA StyleVărzaru, A. A., Bocean, C. G., & Nicolescu, M. M. (2021). Rethinking Corporate Responsibility and Sustainability in Light of Economic Performance. Sustainability, 13(5), 2660. https://doi.org/10.3390/su13052660


