Abstract
Soil erosion in the Three-River Headwaters (TRH) region has continued to intensify in recent decades due to human activities and climate change. To reverse this situation, the Chinese central government has launched the Subsidy and Incentive System for Grassland Conservation (SISGC). As a sign of the effectiveness of SISGC implementation, the dynamic changes of soil erosion can provide timely feedback for decision makers and managers. The Revised Universal Soil Loss Equation (RUSLE) model was used to simulate the spatial distribution of soil erosion before and after SISGC implementation, and Mann–Kendall (MK) test to reveal the effect of policy implementation. The results showed that: (1) the soil erosion in the TRH was mainly mild (83.83% of the total eroded area), and the average soil erosion rate and the total erosion were 13.63 t ha−1 y−1 and 323.58 × 10⁶ t y−1 respectively before SISGC implementation; (2) SISGC implementation has curbed soil erosion. After SISGC implementation, the total soil erosion decreased by 3.80%, which showed obvious differences between grassland types; (3) The influences of SISGC were mainly because it has increased vegetation cover, further decreasing soil erosion. However, soil erosion in Alpine grassland has deteriorated, indicating direct targeted policymaking should be on the agenda. Furthermore, SISGC should be continued and grassland-type-oriented to restore the grassland ecosystem.
1. Introduction
Soil erosion is a complex process, affected by the interaction of multiple factors such as rainfall erosivity, soil texture, slope, vegetation coverage, freezing and thawing, human activity, etc. [1,2], and these factors generally have obvious spatial differences [3]. Therefore, it is vitally important to accurately simulate the intensity of soil erosion and formulate effective soil and water conservation measures. Soil erosion studies generally use the runoff plot method, isotope tracer method, and model simulation [4,5,6]. However, the runoff plot method and isotope tracing method are suitable for small-scale research such as patch scale and slope scale [2], but are inefficient and expensive for large-scale quantitative research. Therefore, the use of modeling is a critical mothed to assess soil erosion.
Several models have been developed around the world for the assessment of water erosion, ranging from physical model and empirical model. The physical models include the Water Erosion Prediction Project (WEPP) [7,8], The European Soil Erosion Model (EUROSEM) [9,10], the Limburg Soil Erosion Model (LISEM) [11], and the Soil Erosion Model for Mediterranean regions (SEMMED) models [12]. Empirical models include the Universal Soil Loss Equation (USLE) and Revised Universal Soil Loss Equation (RUSLE). The USLE was established in 1958 by American scholars [13] and improved in subsequent research works [14,15,16]. At present, the RUSLE is by far the most widely applied soil erosion prediction model globally because of its adaptable architecture and relative ease in obtaining the required data to simulate soil erosion risk [16,17,18,19]. Borrelli et al. [20] estimated the RUSLE C-factor to reflect the effect of the Common Agricultural Policy in reducing soil erosion. Olorunfemi et al. [21] successfully assessed the potential soil erosion using RUSLE model in Southwestern Nigeria. Teng et al. [2] used RUSLE to estimate both current and potential soil erosion by water on the Tibetan Plateau. Chuenchum et al. [22] used the integrated RUSLE model to evaluate soil erosion and identified the influencing factors in semi-arid regions of China. Lin et al. [23] also used the RUSLE model to estimate soil erosion in TRH regions. Therefore, RUSLE is an appropriate choice to estimate soil erosion in the TRH.
In recent decades, due to factors such as global warming and overgrazing [24], grassland degradation has become the most outstanding ecological problem in the THR region [25]. The most seriously degraded area is the secondary bare land (“black beach”) that accounts for 16.5% of the total area of degraded grassland [26]. The most serious ecological security problem caused by grassland degradation is soil erosion [25,27]. Soil erosion leads to nutrient losses, such as nitrogen, phosphorus, and potassium [28], which can not only reduce soil productivity [6], but also easily block the river and cause ecological disasters after being deposited [29,30]. To reverse the degradation and ensure the sustainable use of resources, multiple eco-environmental protection policy initiatives have been implemented in various countries [31,32,33,34]. It is worth mentioning that Chinese central government launched two phases of Subsidy and Incentive System for Grassland Conservation (SISGC) (2011–2015 and 2016–2020) in 2011, which is the subsidy and incentive policy covering the widest area in the world [30]. According to the SISGC, the grasslands were divided into grazing exclusion and livestock-forage balance areas based on their conditions [35]. The livestock-forage balance means to raise livestock based on the carrying capacity of the grassland (similarly for the grazing quota) [35]. Generally, grazing exclusion was implemented in areas where the grassland had severely degraded and were not suitable for grazing [36,37], while in the remaining grasslands livestock-forage balance was implemented. Grassland restoration is the key goal of policy evaluation [27], and soil erosion is the main indicator of grassland restoration. Therefore, the effectiveness of SISGC was evaluated by analyzing the dynamic changes of soil erosion before and after its implementation.
This paper attempts to achieve the following objectives: (1) analyzing the spatial and temporal changes of soil erosion in TRH at 1 km resolution before SISGC implementation (2001–2010); (2) analyzing changes of soil erosion in different grassland types after the SISGC implementation; and (3) identifying the key influencing factors of soil erosion and providing a data basis for SISGC implementation in TRH.
2. Materials and Methods
2.1. Study Area
The TRH region is located in the hinterland of the Qinghai-Tibet Plateau [38] and has a unique climate, geomorphology, and ecological service. It is the origin of the Yangtze, the Yellow and the Lancang Rivers, known as the “Chinese Water Tower” [39] for an extremely important ecological status in water conservation. The TRH region is located at 89°24′–102°23′ E, 31°39′–36°16′ N, covering an area of approximately 3.58 × 10⁵ km2 [40], with an elevation between 3335–6564 m (Figure 1). Having a typical plateau continental climate, the region presents a unique geographic environment and complex terrains. With alternate hot and cold, dry and wet seasons, it has a limited annual temperature range, a large daily temperature range, long days, and strong radiation [22,26]. From 2001–2018, the annual average temperature was −2.43 °C and the annual average evaporation was 730–1700 mm [38]. The annual average precipitation was 205.01–796.23 mm, concentrated from June to September. The soil types in TRH under the Chinese Genetic Soil Classification of China (GSCC) mainly include Alpine meadow soils (similar to Mattli—Cryi—Calcic Kastanozem in FAO—UNESCO) [41] and Alpine steppe soils (similar to Calcic Chernozems in FAO-UNESCO) [6,42]. The soils in this region have formed in weathered Tertiary sandstone with a sandy loam texture (13% clay, 41% silt, and 52% sand), containing 22.78 g kg−1 of organic matter. The study was based on the TRH region’s natural grassland, which covers 70% of the area, and followed by bare land (12.70%), desert (8.57%), forest and shrubland (4.71%) and cropland (0.25%) [43,44]. The grassland is composed mainly of alpine steppe grassland and alpine meadow, the latter accounting for 82.6% [45]. Dominant plant species include Kobresia pygmaea, C. B. Clarke, Kobresia humilis, C. A. Meyex Trauvt, Kobresia capillifolia C. B. Clarke, Kobresia tibetica Maximowicz, Stipa aliena, E. nutans Griseb, Potentilla multicaulis Bunge et al. [46]. Local herders make a living on traditional livestock husbandry [6,47].
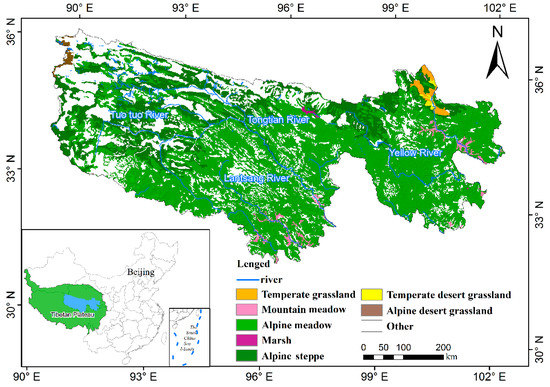
Figure 1.
Distribution of grassland types in Three-River Headwaters region.
2.2. Data Sources and Methods
2.2.1. The RUSLE Model
The RUSLE model is a linear equation to quantify soil erosion according to the following equation [13,48]:
where A is the average rate of soil erosion by water at each cell (t ha−1 y−1), R is the rainfall erosivity factor (MJ mm ha−1 h−1 y−1), K is the soil erodibility factor (t ha h ha−1 MJ−1 mm−1), LS is the slope length and slope gradient factor, C is the cover management factor, and P is the support practice factor. We describe the derivation of the factors below.
The R factor indicates the potential of precipitation to detach and transport soil particles [2,49]. The monthly precipitation data was then used to calculate R in the following formula, which has been widely used for assessing rainfall erosivity [2,50,51]. The daily observed precipitation data provided by China Meteorological Data Service Center (http://data.cma.cn) (accessed on 12 October 2019) were calculated rainfall erosivity. The daily precipitation, longitude, latitude, and altitude data of 149 meteorological stations in the TRH region from 2001–2018 were downloaded. Then, the daily precipitation data were processed into monthly data. According to the longitude and latitude of each meteorological station, Thin-Plate Smoothing Spline (ANUSPLIN, version 4.36) [52] developed by Australian National University was used to obtain the precipitation data with a spatial resolution of 1 km.
where, i represents the number of the month, pi is monthly precipitation, and p is annual precipitation.
The soil erodibility factor K was estimated according to soil texture and soil organic carbon data from China’s second national soil investigation [53].
where San is the sand content (%), Sil is the silt content (%), Cla is the clay content (%), and TOC is the total soil organic carbon content (%).
The LS factor used 90 m spatial resolution Shuttle Radar Topography Mission (SRTM) Digital Elevation Model (DEM) data to extract the slope length and slope gradient by ArcGIS 10.2.2. The calculation is as follows:
where, Li, j represents the L factor from the raster cell (i, j); Ai, j–in represents the contributing area at the inlet of the raster cell measured in m2; D represents the raster cell size, in m; xi, j = (sinαi, j + cosαi, j); αi, j represents the aspect direction for the raster cell (i, j); θ is the slope angle [53]; and m is related to the ratio β of the rill to interill erosion.
Vegetation coverage management factor C was estimated by the vegetation coverage (VC), an equation for estimating C factor using the VC was proposed [51]. VC estimated by the pixel binary model based on NDVI data. NDVI data were downloaded from MOD13A2 Version 6 product developed by NASA Earth Observation System (https://earthdata.nasa.gov/) (accessed on 16 August 2019). MOD13A2 v006 data throughout 2001 to 2018 were downloaded by Google Earth Engine [54].
where NDVImin and NDVImax are the NDVI values of a pure pixel for bare soil and a pure pixel with 100% vegetation coverage, respectively. The 0.5% and 99.5% are selected as the endmembers of the NDVI cumulative percentages, and the corresponding NDVI values of the 0.5% and 99.5% cumulative percentages are considered as the NDVImin (0.5%) and NDVImax (99.5%) values [2,55].
The support practice factor (P) reflects the effect of contouring, terraced contour farming, and buffer strips [53]. The consideration of the P factor in this study is estimated based on land use type, the P factor in grassland was 1 because human engineering activities are limited there [2]. The land use data used International Geosphere—Biosphere Programme (IGBP) classification schemes from Land Cover Type (MCD12Q1) Version 6 data (MCD12Q1 v006), which were downloaded from NASA [33], with a spatial resolution of 1 km.
Because SISGS was implemented in 2011, the research period was divided into two periods, 2001–2010 and 2011–2018. The results of the RUSLE model were classified by the Standards for Classification and Gradation of Soil Erosion from Ministry of Water Resources of the People’s Republic of China [2].
2.2.2. Trend Analysis and Mann—Kendall (MK) Test
Through Theil—Senmedian trend analysis and Mann—Kendall test, the current (2001–2018) soil erosion change trend was assessed. When the Theil—Senmedian value > 0, it reflects the increasing trend of this time series, and vice versa.
The MK method can also be used to test the aberrance of the series. The detailed calculation can be summarized as the following procedure. The soil erosion sequence order (x1, x2, … xn) and Sk as the accumulated amount of the ith sample, which is xi > xj (i ≥ j ≥ 1). The statistics was calculated as:
Then, the respective average and variance [56] of Sk were calculated to get the UF value. Meanwhile, we repeated the calculation process for the reverse of order sequence x (i.e., xn, xn−1, … x1) and set UB(k) = −UF(k) [57]. The confidence level α was set at 0.05, When the intersection within the confidence level (±1.96, with p < 0.05), i.e., UF = UB, the aberrance point of variation would be at the moment [58].
3. Results
3.1. Spatial Distribution of Soil Erosion before SISGC Implementation (2001–2010)
The average annual rainfall erosivity in the TRH region were 827.82 MJ mm ha−1 h−1 y−1 before SISGC implementation (Median, 747.15 MJ mm ha−1 h−1 y−1; SD, 233.78 MJ mm ha−1 h−1 y−1). The low R value (R value < 400 MJ mm ha−1 h−1 y−1) area was mainly distributed in the northern part of the TRH, and the highest R value (R value > 1600 MJ mm ha−1 h−1 y−1) was observed in the northwestern Sichuan Province, TRH (Figure 2a). The average K value was 0.024 t ha h ha−1 MJ−1 mm−1, and the least susceptible soil (K < 0.025 t ha h ha−1 MJ−1 mm−1) was mainly in the southeast with high vegetation coverage, high soil organic carbon content, and low soil sand content, while the most susceptible areas were mainly in the northwest where the soil organic carbon content was low, and the soil sand content was large (Figure 2b). The average LS factor value was 5.68. The lowest LS factor (<1) occurred in the east and northwest, while the highest LS factor (>8) occurred in the central area (Figure 2c). The annual average value of C factor was 0.22 before SISGC implementation (Median, 0.501; SD, 0.23), the maximum occurring in the northwest with low vegetation coverage, and the minimum occurring in the southeast with better hydrothermal conditions (Figure 2d). The P factor reflects the effect of contouring and tillage practices. However, in the TRH, the P factor in most areas was 1 because human engineering activities are limited there (Figure 2e).
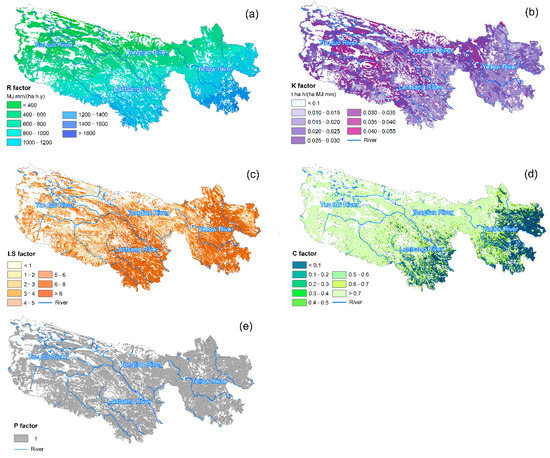
Figure 2.
Maps of (a) annual mean (2001–2018) rainfall erosivity, R factor; (b) soil erodibility, K factor; (c) slope length and steepness, LS factor; (d) cover management, C factor; and (e) support practice, P factor.
The average annual soil erosion rate was 13.63 t ha−1 y−1 (Median, 298.99 t ha−1 y−1; SD, 24.79 t ha−1 y−1), and the total erosion loss were about 323.58 × 10⁶ t y−1 before SISGC implementation. The erosion rate in the northwest was the highest, and in the southeast lower, especially in the eastern edge of the TRH (Figure 3a). The soil erosion in the TRH was mainly slight and light (83.83% of the total eroded area) before the implementation of SISGC (Figure 3b). In terms of various grassland types, the highest erosion rate of Alpine desert grassland was 25.78 t ha−1 y−1, the total soil loss was 2.57 × 10⁶ t y−1. As for the Alpine meadow, the erosion rate was 11.92 t ha−1 y−1, and the total soil loss 211.72 × 10⁶ t y−1, accounted for 65.43% of the total erosion in the TRH region. The erosion rate of the Marsh was 2.45 t ha−1 y−1, and due to its limited area in the TRH, the total erosion was minimum (0.08 × 10⁶ t y−1) among all grassland types. The soil erosion rate of the Alpine steppe was 19.80 t ha−1 y−1, and the soil erosion accounted for 32.74% of the total erosion. The erosion rates of Temperate grassland and Mountain meadow were 9.30 t ha−1 y−1 and 1.69 t ha−1 y−1 respectively. The erosion rate of Temperate desert grassland was 10.94 t ha−1 y−1 (Table 1). The area of erosion grade 1 (slight) accounted for 35.36% and the area of grade 2 (light) 48.47% of the total eroded area. Mild erosion mainly occurred in the southeast. The area of the erosion grade 6 (severe) made up 0.52% of the total eroded area, mainly distributed in the northwestern border area (Figure 3b) (Table 2).
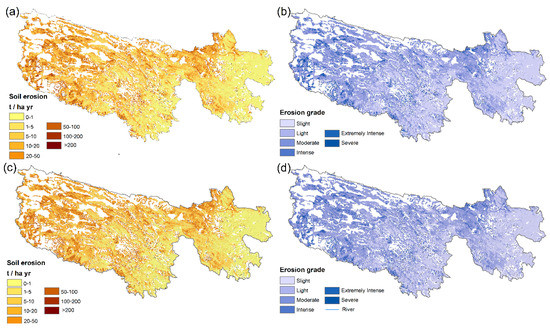
Figure 3.
The spatial distribution and erosion grade at a 1 km resolution of the soil erosion before and after the SISGC implementation; (a) modelled annual soil erosion (2001–2010); (b) soil erosion grade (2001–2010); (c) modelled annual soil erosion (2011–2018); (b) soil erosion grade (2011–2018) in the Three-River Headwaters region.

Table 1.
The mean and total soil erosion statistical description of different grassland types before (2001–2010) and after (2011–2018) the Subsidy and Incentive System for Grassland Conservation (SISGC) implementation.
Table 2.
Each erosion grade and its proportion on the Three-River Headwaters region before (2001–2010) and after (2011–2018) the SISGC implementation.
3.2. Spatial Distribution of Soil Erosion after SISGC Implementation (2011–2018)
The average annual rainfall erosivity in the TRH region were 850.34 MJ mm ha−1 h−1 y−1 after SISGC implementation (Median, 817.26 MJ mm ha−1 h−1 y−1; 256.66 MJ mm ha−1 h−1 y−1) (Figure 4a), an increase of 2.45% compared to before SISGC implementation. The annual average value of C factor was 0.21 after SISGC implementation (Median, 0.49; SD, 0.21) (Figure 4b), a decrease of 6.17% compared to before SISGC implementation. On the whole, compared to 2001–2010, the spatial distribution of soil erosion stayed consistent, but the situation of soil erosion has improved. The erosion rate in the northwest was the highest, and lower in the southeast after SISGC implementation (Figure 3c). The average annual soil erosion rate and the total erosion loss were about 13.12 t ha−1 y−1 and 311.30 × 10⁶ t y−1 (Median, 267.63 t ha−1 y−1; SD, 24.72 t ha−1 y−1) (Figure 4c). The annual soil erosion amount decreased by 3.80% compared with that before SISGC implementation. As for grassland types, the amount of soil erosion in Alpine meadow increased by 0.12%, while in other types they declined. In Temperate grassland and Alpine steppe, the declines were the largest, 15.15% and 11.34% respectively (Table 1).
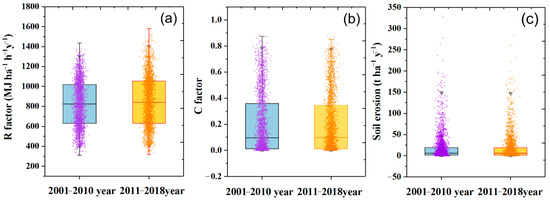
Figure 4.
Changes of R factor (a), C factor (b) and soil erosion rate (c) for the period before (2001–2010) and after (2011–2018) SISGC implementation.
3.3. Trends in Soil Erosion in TRH before and after SISGC Implementation
Overall, the MK test indicated some mutation points in the mean soil erosion trends from 2001 to 2018. As shown in Figure 5, soil erosion showed an overall decreasing trend during 2001–2018. After 2001, a mutation point was observed, and the soil erosion decreased noticeably. Moreover, the lowest value was observed in 2004. Soil erosion increased obviously during 2006–2009, which could be evidenced by the abrupt point found during 2006–2009. A mutation point appeared after 2011, implying that soil erosion showed an obvious decreasing trend after 2011.
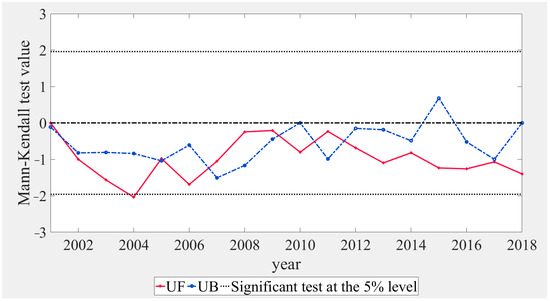
Figure 5.
Mann—Kendall mutation criterion curve of soil erosion in TRH from 2001 to 2018. Note: Under α = 0.05 as significance levels, If UF and UB intersect in the confidence area, that point is the mutation for the soil erosion change.
4. Discussion
4.1. Vegetation Recovery Is the Key Factor of Curbing Soil Erosion
The results were compared with the studies carried out in areas having similar geo-environmental and rainfall characteristics. Compared to Wang et al. [6], who assessed erosion for the source region of the Yellow River based on measurements of 137 Cs concentration, soil erosion in the alpine steppes was more serious (high cover, 23.50 t ha−1 y−1; middle cover, 25.72 t ha−1 y−1; and lower-cover, 28.35 t ha−1 y−1) than in the alpine meadows (high cover, 11.0 t ha−1 y−1; middle cover, 18.32 t ha−1 y−1; and lower-cover, 22.22 t ha−1 y−1). These results were similar to ours. Wang et al. [59] estimated the soil erosion on the TRH based on RUSLE model. According to Wang et al. the estimation was significantly linearly correlated with the observations and the correlation coefficient is 0.62 in TRH. From 2000 to 2015, the average soil erosion modulus on Alpine steppe was 21.95 t ha−1 y−1, which is similar to our results (19.35 t ha−1 y−1). Therefore, soil erosion estimated by RUSLE model is an appropriate method in TRH region.
Grassland vegetation recovery is the key factor for soil erosion alleviation. Compared with the other parameters related to RUSLE model in this paper, the R and C factors were the most variable factors during 2001–2018 (Figures S1 and S2, Electronic Supplementary Material), and their trend over the past 18 years (2001–2018) was presented in Figure 6. The annual C factor and R factor trend over the past 18 years (2001–2018) was presented in Figure 6. Through calculations of the proportions of increasing pixels to decreasing pixels, we found that the ratios of increasing pixels for C and R were 45.17% (Figure 6a) and 91.18% (Figure 6b), respectively. Meanwhile, the ratio of the stable pixels for C was 31.48%, but decreasing pixels occupied 23.36%. Obviously, multitudinous pixels of R factor show a positive tendency, except for in Alpine meadow in the southeast. The increasing rainfall erosivity will directly increase the soil erosion induced by water, but simultaneously, soil erosion in the TRH region has generally shown a modest declining trend. The ratios of decreasing pixels (50.76%) for soil erosion was larger than with increased erosion modulus (the ratios of decreasing pixels was 41.67%), and the ratios of the other 7.57% of the total eroded area remained stable. Indicating that may the C curbed soil erosion, which is directly relevant to grassland coverage, and where grassland coverage increased, soil erosion declined, vice versa (Figure 6a,c). Thus, grassland coverage increase was the main factor affecting soil erosion decline. Grassland coverage increase mainly comes from climatic factors and human activities [24,55]. In TRH, after 2011, the human activity of the largest-scale has been SISGC [25,37]. As a result, SISGC has exerted positive impacts on grassland coverage restoration and soil erosion limitation.
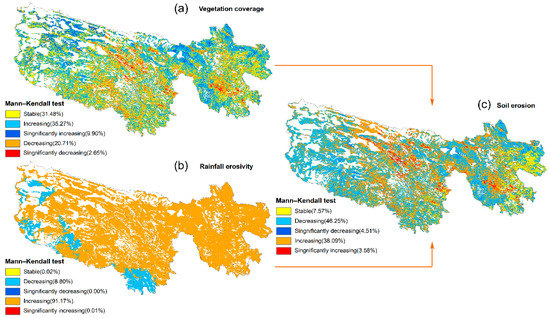
Figure 6.
Temporal trends of vegetation coverage (a), rainfall erosivity (b) and soil erosion (c) at different significance levels during 2001–2018.
The results of MK test suggested that an overall decreasing trend from 2001 to 2004 (Figure 5), which may be attributed to the implementation of the Grain to Green Program (GTGP) initiated in China since 1999. This program is one of the largest ecological programs in China, and it aims at converting croplands and livestock grazing lands in a broad range of fragile areas to forests or grasslands. As a result, the successful implementation of the GTGP is likely to reverse degradation and improve the regional soil quality. The lowest value of soil erosion was observed in 2004, which may be attributed to another vegetation restoration program, the Grazing Withdrawal Program (GWP), which was initiated in 2003 to reduce the grazing pressure on the natural grassland through forbidding grazing, employing cultivated pastures or rotational grazing. It was worth nothing that the lowest number of cattle (main local livestock species) [42] in stock was recorded in the same year (2004) [41], which further proved the above results. Based on the results of the MK test, an obvious decreasing trend (2011–2018) was observed after the Subsidy and Incentive System for Grassland Conservation (SISGS) [25,37], meaning the program has played a positive role in the development of soil erosion in THR region. Which was initiated in 2011 to reverse degradation and ensure the sustainable use of resources on grassland through granting grazing prohibition subsidies, balancing the relationship between grass and livestock or evaluating performance.
4.2. SISGC Is the Main Reason for Vegetation Recovery
Soil erosion reduction mainly came from grassland vegetation restoration. Research has already showed that SISGC has contributed significantly to grassland restoration. Liu et al. [57] estimated Net Primary Productivity (NPP) including potential NPP (PNPP), human-induced NPP (HNPP), and actual NPP (ANPP) and found that an increase in human-dominated ANPP mainly occurred in Qinghai from 2000–2013. Cai et al. [60] used SPOT NDVI-based residual trend as an indicator to explore to what extent the ecological project influenced grassland NDVI variation from 2005–2012, and the results indicated that ecological protection projects in the central Tibetan Plateau have mitigated grassland degradation and even reversed it in some areas. Yan et al. [61] assessed how significantly climatic and human factors have influenced NPP in Qinghai from 2000–2015 through quantitative methods; their results showed that human factors were dominant (contributing to 86.87%). Wei et al. [62] have proven that climate influence has been weakening while human influence has been strengthening on Tibetan pastures. Xu et al. [63] assessed the dynamics of annual NPP from 2000–2012, and found that the ecological project has aided the recovery of grassland ecosystem function by decreasing grazing pressure. In consequence, SISGC implementation has reversed grassland degradation, further decreasing soil erosion.
4.3. Implementing SISGC Based on Grassland Types Is an Important Direction
In different types of grassland, due to the differences in various attributes (such as vegetation types and coverage, soil properties, and regional climate), even if they are subjected to equivalent erosion external forces, the final results of soil degradation will differ greatly [6,64]. In order to reverse soil degradation precisely and implement SISGC efficiently, grassland types should be partitioned accurately in local grassland degradation control plans just before implementing SISGC. Besides, the key to achieve the above goals is to strengthen the correlation between restoration technology and various properties of different types of grassland. Our empirical results suggest that only the amount of soil erosion in Alpine meadow, the grassland type with the largest area in the TRH, increased slightly after the policy implementation, presenting an insignificant response to SISGC. The experimental results of the other nine grassland types were the opposite.
According to the comprehensive analysis of this paper and previous studies, it was found that there are three main reasons to explain this [24]. Firstly, alpine meadow is the main grazing grassland with the largest area in TRH [37]. As the current incentives and subsidies are insufficient to offset the economic losses caused by herders’ reduced grazing intensity, and herders are affected by the soaring prices of livestock products and poverty, the number of livestock has not significantly decreased. Consequently, the restoration of grassland coverage has been limited and soil erosion has been exacerbating [35,65]. Secondly, this may be because the differences between productivity and ecological service functions of different grassland types have been ignored [45,66], as the policy was exerted according to administrative divisions [67]. Thirdly, these areas were distributed in remote regions with weak supervision, leading to limited effects. Therefore, compensation and supervision should both be strengthened in Alpine grassland. As a result, in TRH, a both ecologically fragile and necessary area, SISGC should be strengthened and grassland-type-oriented to match different ecological services.
Our study has several limitations. Initially, only the annual values of the R and C factors are used to calculate the soil erosion, while the K factor has adopted a constant value for the past 18 years. However, the total soil organic carbon needed for K factor was changing over the years [68,69], that constant value might have an effect on the accuracy of their calculations on the soil erosion rate. Hence, it is significant to estimate the dynamic total soil organic, which is a topic that needs further research. Additionally, our analysis only included the eight years after the implementation of SISGC, and its longer-term effectiveness was not analyzed. Because the SISGC implementation policy is still ongoing, we will continue to investigate the effectiveness of the policy.
5. Conclusions
Before the SISGC implementation, the average soil erosion rate and the total erosion were 13.63 t ha−1 y−1 and 323.58 × 10⁶ t y−1 respectively; after implementation, the total soil erosion decreased by 3.80%, indicating that SISGC has been successful in preventing grassland degradation. However, this response has obvious differences between grassland types. The amount of soil erosion in Alpine meadow increased 0.12%, while in other types they declined. In Temperate grassland and Alpine steppe, the declines were the largest, 15.15% and 11.34% respectively. The mechanism of how SISGC worked was that it has increased vegetation cover, then curbing soil erosion. However, soil erosion in Alpine grassland has worsened, indicating direct targeted policy should be proposed. There were differences among grassland types, which may be caused by the lack of consideration on the differences among types during the policy implementation. We suggest that SISGC should be grassland-type-oriented to match different features during grassland recovery. This study will help promote rational grassland utilization and establish a protection strategy in the TRH region and the Qinghai-Tibetan Plateau.
Supplementary Materials
The following are available online at https://www.mdpi.com/2071-1050/13/5/2702/s1, Figure S1: Spatial distribution of rainfall erosivity factor in 2001–2018, Figure S2: Spatial distribution of coverage management factor in 2001–2018.
Author Contributions
Conceptualization, H.L. and Y.Z.; methodology, Y.Z. and R.T.; software, Y.Z. and R.T.; validation, Y.Z.; formal analysis, Y.Z.; investigation and Y.P., Y.Z.; resources, Y.Z.; data curation, Y.Z.; writing—original draft preparation, Y.Z. and Y.P.; writing—review and editing, Y.Z. and Y.P.; visualization, Y.Z.; supervision, H.L.; project administration, H.L.; funding acquisition, H.L. All authors have read and agreed to the published version of the manuscript.
Funding
This research was funded by the National Natural Science Foundation of China (31772666), the National Key Research and Development Plan (2016YFC0501906), the Key consulting project of the Chinese Academy of Engineering [2020-XZ-29], and the Fundamental Research Funds for the Central Universities (lzujbky-2018-it10).
Institutional Review Board Statement
Not applicable.
Informed Consent Statement
Not applicable.
Data Availability Statement
Not applicable.
Conflicts of Interest
The authors declare no conflict of interest.
References
- Luo, D.; Jin, H.; Bense, V.F.; Jin, X.; Li, X. Hydrothermal processes of near-surface warm permafrost in response to strong precipitation events in the Headwater Area of the Yellow River, Tibetan Plateau. Geoderma 2020, 376, 114531. [Google Scholar] [CrossRef]
- Teng, H.; Liang, Z.; Chen, S.; Liu, Y.; Viscarra Rossel, R.A.; Chappell, A.; Yu, W.; Shi, Z. Current and future assessments of soil erosion by water on the Tibetan Plateau based on RUSLE and CMIP5 climate models. Sci. Total Environ. 2018, 635, 673–686. [Google Scholar] [CrossRef]
- Vanwalleghem, T.; Gómez, J.A.; Infante Amate, J.; González de Molina, M.; Vanderlinden, K.; Guzmán, G.; Laguna, A.; Giráldez, J.V. Impact of historical land use and soil management change on soil erosion and agricultural sustainability during the Anthropocene. Anthropocene 2017, 17, 13–29. [Google Scholar] [CrossRef]
- Yue, L.; Juying, J.; Bingzhe, T.; Binting, C.; Hang, L. Response of runoff and soil erosion to erosive rainstorm events and vegetation restoration on abandoned slope farmland in the Loess Plateau region, China. J. Hydrol. 2020, 584, 124694. [Google Scholar] [CrossRef]
- Xiaojun, N.; Xiaodan, W.; Suzhen, L.; Shixian, G.; Haijun, L. (137)Cs tracing dynamics of soil erosion, organic carbon and nitrogen in sloping farmland converted from original grassland in Tibetan plateau. Appl. Radiat. Isot. Incl. DataInstrum. Methods Use Agric. Ind. Med. 2010, 68, 1650–1655. [Google Scholar] [CrossRef]
- Wang, Y.; Niu, F.; Wu, Q.; Gao, Z. Assessing soil erosion and control factors by radiometric technique in the source region of the Yellow River, Tibetan Plateau. Quat. Res. 2017, 81, 538–544. [Google Scholar] [CrossRef]
- Revuelta-Acosta, J.D.; Flanagan, D.C.; Engel, B.A.; King, K.W. Improvement of the Water Erosion Prediction Project (WEPP) model for quantifying field scale subsurface drainage discharge. Agric. Water Manag. 2021, 244, 106597. [Google Scholar] [CrossRef]
- Gronsten, H.A.; Lundekvam, H. Prediction of surface runoff and soil loss in southeastern Norway using the WEPP Hillslope model. Soil Tillage Res. 2006, 85, 186–199. [Google Scholar] [CrossRef]
- Khaleghpanah, N.; Shorafa, M.; Asadi, H.; Gorji, M.; Davari, M. Modeling soil loss at plot scale with EUROSEM and RUSLE2 at stony soils of Khamesan watershed, Iran. Catena 2016, 147, 773–788. [Google Scholar] [CrossRef]
- Smets, T.; Borselli, L.; Poesen, J.; Torri, D. Evaluation of the EUROSEM model for predicting the effects of erosion-control blankets on runoff and interrill soil erosion by water. Geotext. Geomembr. 2011, 29, 285–297. [Google Scholar] [CrossRef]
- Starkloff, T.; Stolte, J. Applied comparison of the erosion risk models EROSION 3D and LISEM for a small catchment in Norway. Catena 2014, 118, 154–167. [Google Scholar] [CrossRef]
- De Jong, S.M.; Paracchini, M.L.; Bertolo, F.; Folving, S.; Megier, J.; De Roo, A.P.J. Regional assessment of soil erosion using the distributed model SEMMED and remotely sensed data. Catena 1999, 37, 291–308. [Google Scholar] [CrossRef]
- Wischmeier, W.H.; Smith, D.D. Rainfall Energy and Its Relationship to Soil Loss. Trans. Am. Geophys. Union 1958, 3, 285–291. [Google Scholar] [CrossRef]
- Wischmeier, W.H.; Smith, D.D. Predicting Rainfall Erosion Losses: A Guide to Conservation Planning; No. 537; Department of Agriculture, Science and Education Administration: Washington, DC, USA, 1978.
- Prasannakumar, V.; Vijith, H.; Abinod, S.; Geetha, N. Estimation of soil erosion risk within a small mountainous sub-watershed in Kerala, India, using Revised Universal Soil Loss Equation (RUSLE) and geo-information technology. Geosci. Front. 2012, 3, 209–215. [Google Scholar] [CrossRef]
- Alewell, C.; Borrelli, P.; Meusburger, K.; Panagos, P. Using the USLE: Chances, challenges and limitations of soil erosion modelling. Int. Soil Water Conserv. Res. 2019, 7, 203–225. [Google Scholar] [CrossRef]
- Phinzi, K.; Ngetar, N.S. The assessment of water-borne erosion at catchment level using GIS-based RUSLE and remote sensing: A review. Int. Soil Water Conserv. Res. 2019, 7, 27–46. [Google Scholar] [CrossRef]
- Biddoccu, M.; Guzmán, G.; Capello, G.; Thielke, T.; Strauss, P.; Winter, S.; Zaller, J.G.; Nicolai, A.; Cluzeau, D.; Popescu, D.; et al. Evaluation of soil erosion risk and identification of soil cover and management factor (C) for RUSLE in European vineyards with different soil management. Int. Soil Water Conserv. Res. 2020, 8, 337–353. [Google Scholar] [CrossRef]
- Fernández, C.; Vega, J.A. Evaluation of RUSLE and PESERA models for predicting soil erosion losses in the first year after wildfire in NW Spain. Geoderma 2016, 273, 64–72. [Google Scholar] [CrossRef]
- Borrelli, P.; Panagos, P. An indicator to reflect the mitigating effect of Common Agricultural Policy on soil erosion. Land Use Policy 2020, 92, 104467. [Google Scholar] [CrossRef]
- Olorunfemi, I.E.; Komolafe, A.A.; Fasinmirin, J.T.; Olufayo, A.A.; Akande, S.O. A GIS-based assessment of the potential soil erosion and flood hazard zones in Ekiti State, Southwestern Nigeria using integrated RUSLE and HAND models. Catena 2020, 194, 104725. [Google Scholar] [CrossRef]
- Chuenchum, P.; Xu, M.; Tang, W. Predicted trends of soil erosion and sediment yield from future land use and climate change scenarios in the Lancang–Mekong River by using the modified RUSLE model. Int. Soil Water Conserv. Res. 2020, 8, 213–227. [Google Scholar] [CrossRef]
- Lin, H.; Zheng, S.; Wang, X. Soil erosion assessment based on the RUSLE model inthe Three-Rivers Headwaters area, Qinghai-Tibetan Plateau, China. Acta Prataculturae Sin. 2017, 26, 11–12. [Google Scholar]
- Wang, S.; Fan, J.; Li, Y.; Wu, D.; Zhang, Y.; Huang, L. Dynamic response of water retention to grazing activity on grassland over the Three River Headwaters region. Agric. Ecosyst. Environ. 2019, 286, 106662. [Google Scholar] [CrossRef]
- Li, C.; de Jong, R.; Schmid, B.; Wulf, H.; Schaepman, M.E. Changes in grassland cover and in its spatial heterogeneity indicate degradation on the Qinghai-Tibetan Plateau. Ecol. Indic. 2020, 119, 106641. [Google Scholar] [CrossRef]
- Gao, X.; Dong, S.; Xu, Y.; Wu, S.; Wu, X.; Zhang, X.; Zhi, Y.; Li, S.; Liu, S.; Li, Y.; et al. Resilience of revegetated grassland for restoring severely degraded alpine meadows is driven by plant and soil quality along recovery time: A case study from the Three-river Headwater Area of Qinghai-Tibetan Plateau. Agric. Ecosyst. Environ. 2019, 279, 169–177. [Google Scholar] [CrossRef]
- Liu, Y.F.; Dunkerley, D.; Lopez-Vicente, M.; Shi, Z.H.; Wu, G.L. Trade-off between surface runoff and soil erosion during the implementation of ecological restoration programs in semiarid regions: A meta-analysis. Sci. Total Environ. 2020, 712, 136477. [Google Scholar] [CrossRef]
- Gispert, M.; Pardini, G.; Colldecarrera, M.; Emran, M.; Doni, S. Water erosion and soil properties patterns along selected rainfall events in cultivated and abandoned terraced fields under renaturalisation. Catena 2017, 155, 114–126. [Google Scholar] [CrossRef]
- Xinbao, Z.; Higgitt, D.L.; Walling, D.E. A preliminary assessment of the potential for using caesium-137 to estimate rates of soil erosion in the Loess Plateau of China. Hydrol. Sci. J. 1990, 35, 243–252. [Google Scholar] [CrossRef]
- Alcon, F.; Marín-Miñano, C.; Zabala, J.A.; de-Miguel, M.-D.; Martínez-Paz, J.M. Valuing diversification benefits through intercropping in Mediterranean agroecosystems: A choice experiment approach. Ecol. Econ. 2020, 171, 106593. [Google Scholar] [CrossRef]
- Ridding, L.E.; Redhead, J.W.; Pywell, R.F. Fate of semi-natural grassland in England between 1960 and 2013: A test of national conservation policy. Glob. Ecol. Conserv. 2015, 4, 516–525. [Google Scholar] [CrossRef]
- Lark, T.J. Protecting our prairies: Research and policy actions for conserving America’s grasslands. Land Use Policy 2020, 97, 104727. [Google Scholar] [CrossRef]
- Souchère, V.; King, C.; Dubreuil, N.; Lecomte-Morel, V.; Le Bissonnais, Y.; Chalat, M. Grassland and crop trends: Role of the European Union Common Agricultural Policy and consequences for runoff and soil erosion. Environ. Sci. Policy 2003, 6, 7–16. [Google Scholar] [CrossRef]
- Liu, Y.-F.; Liu, Y.; Shi, Z.-H.; López-Vicente, M.; Wu, G.-L. Effectiveness of re-vegetated forest and grassland on soil erosion control in the semi-arid Loess Plateau. Catena 2020, 195, 104787. [Google Scholar] [CrossRef]
- Liu, M.; Dries, L.; Huang, J.; Min, S.; Tang, J. The impacts of the eco-environmental policy on grassland degradation and livestock production in Inner Mongolia, China: An empirical analysis based on the simultaneous equation model. Land Use Policy 2019, 88, 104167. [Google Scholar] [CrossRef]
- Zhang, J.; Brown, C.; Qiao, G.; Zhang, B. Effect of Eco-compensation Schemes on Household Income Structures and Herder Satisfaction: Lessons From the Grassland Ecosystem Subsidy and Award Scheme in Inner Mongolia. Ecol. Econ. 2019, 159, 46–53. [Google Scholar] [CrossRef]
- Hu, Y.; Huang, J.; Hou, L. Impacts of the Grassland Ecological Compensation Policy on Household Livestock Production in China: An Empirical Study in Inner Mongolia. Ecol. Econ. 2019, 161, 248–256. [Google Scholar] [CrossRef]
- Zheng, D.; Wang, Y.; Hao, S.; Xu, W.; Lv, L.; Yu, S. Spatial-temporal variation and tradeoffs/synergies analysis on multiple ecosystem services: A case study in the Three-River Headwaters region of China. Ecol. Indic. 2020, 116, 106494. [Google Scholar] [CrossRef]
- Jiang, C.; Zhang, L. Ecosystem change assessment in the Three-river Headwater Region, China: Patterns, causes, and implications. Ecol. Eng. 2016, 93, 24–36. [Google Scholar] [CrossRef]
- Feng, S.; Guo, L.; Li, D.; Huang, Q. Spatial patterns of landscape change in the Three Rivers Headwaters Region of China, 1987–2015. Acta Ecol. Sin. 2018, 38, 76–80. [Google Scholar] [CrossRef]
- Lu, L.; Yang, Z.; Lin, Z.; Li, N. Investigation report on cattle and sheep production in Qinghai Province. Qinghai Agric. Anim. Husb. 2011, 3, 8–10. [Google Scholar]
- Hou, S.; Xie, Z. Development status and Countermeasures of animal husbandry in Guoluo Prefecture. Mod. Agric. Sci. Technol. 2010, 9, 368. [Google Scholar]
- Chu, H.; Wei, J.; Qiu, J.; Li, Q.; Wang, G. Identification of the impact of climate change and human activities on rainfall-runoff relationship variation in the Three-River Headwaters region. Ecol. Indic. 2019, 106, 105516. [Google Scholar] [CrossRef]
- Yang, S.; Feng, Q.; Liang, T.; Liu, B.; Zhang, W.; Xie, H. Modeling grassland above-ground biomass based on artificial neural network and remote sensing in the Three-River Headwaters Region. Remote Sens. Environ. 2018, 204, 448–455. [Google Scholar] [CrossRef]
- Cao, Y.; Wu, J.; Zhang, X.; Niu, B.; Li, M.; Zhang, Y.; Wang, X.; Wang, Z. Dynamic forage-livestock balance analysis in alpine grasslands on the Northern Tibetan Plateau. J. Environ. Manag. 2019, 238, 352–359. [Google Scholar] [CrossRef]
- Yang, Y.; Wang, G.; Klanderud, K.; Yang, L. Responses in leaf functional traits and resource allocation of a dominant alpine sedge (Kobresia pygmaea) to climate warming in the Qinghai-Tibetan Plateau permafrost region. Plant Soil 2011, 349, 377–387. [Google Scholar] [CrossRef]
- Shen, R.; Xu, M.; Li, R.; Zhao, F.; Sheng, Q. Spatial variability of soil microbial biomass and its relationships with edaphic, vegetational and climatic factors in the Three-River Headwaters region on Qinghai-Tibetan Plateau. Appl. Soil Ecol. 2015, 95, 191–203. [Google Scholar] [CrossRef]
- Renard, K.G.; Foster, G.R.; Weesies, G.A.; McCool, D.K.; Yoder, D.C. Predicting Soil Erosion by Water: A Guide to Conservation Planning wif the Revised Universal Soil Loss Equation (RUSLE); No. 703; Department of Agriculture, Agricultural Research Service: Washington, DC, USA, 1997.
- Chen, Y.; Xu, M.; Wang, Z.; Gao, P.; Lai, C. Applicability of two satellite-based precipitation products for assessing rainfall erosivity in China. Sci. Total Environ. 2020, 757, 143975. [Google Scholar] [CrossRef]
- Liu, Y.; Zhao, W.; Liu, Y.; Pereira, P. Global rainfall erosivity changes between 1980 and 2017 based on an erosivity model using daily precipitation data. Catena 2020, 194, 104768. [Google Scholar] [CrossRef]
- Liu, B.; Xie, Y.; Li, Z.; Liang, Y.; Zhang, W.; Fu, S.; Yin, S.; Wei, X.; Zhang, K.; Wang, Z.; et al. The assessment of soil loss by water erosion in China. Int. Soil Water Conserv. Res. 2020, 8, 430–439. [Google Scholar] [CrossRef]
- Hancock, P.; Hutchinson, M.F. Spatial interpolation of large climate data sets using bivariate thin plate smoothing splines. Environ. Model. Softw. 2006, 21, 1684–1694. [Google Scholar] [CrossRef]
- Teng, H.-f.; Hu, J.; Zhou, Y.; Zhou, L.-q.; Shi, Z. Modelling and mapping soil erosion potential in China. J. Integr. Agric. 2019, 18, 251–264. [Google Scholar] [CrossRef]
- Li, Y.Y.; Dong, S.K.; Wen, L.; Wang, X.X.; Wu, Y. Three-Dimensional Framework of Vigor, Organization, and Resilience (VOR) for Assessing Rangeland Health: A Case Study from the Alpine Meadow of the Qinghai-Tibetan Plateau, China. EcoHealth 2013, 10, 423–433. [Google Scholar] [CrossRef] [PubMed]
- Ge, J.; Meng, B.; Liang, T.; Feng, Q.; Gao, J.; Yang, S.; Huang, X.; Xie, H. Modeling alpine grassland cover based on MODIS data and support vector machine regression in the headwater region of the Huanghe River, China. Remote Sens. Environ. 2018, 218, 162–173. [Google Scholar] [CrossRef]
- Wang, H.; Chen, A.; Wang, Q.; He, B. Drought dynamics and impacts on vegetation in China from 1982 to 2011. Ecol. Eng. 2015, 75, 303–307. [Google Scholar] [CrossRef]
- Liu, Y.; Wang, Q.; Zhang, Z.; Tong, L.; Wang, Z.; Li, J. Grassland dynamics in responses to climate variation and human activities in China from 2000 to 2013. Sci. Total Environ. 2019, 690, 27–39. [Google Scholar] [CrossRef] [PubMed]
- Lu, S.; Tian, F. Spatiotemporal variations of agricultural water use efficiency and its response to the Grain to Green Program during 1982–2015 in the Chinese Loess Plateau. Phys. Chem. EarthParts A/B/C 2021, 121, 102975. [Google Scholar] [CrossRef]
- Wang, Z.; Wang, J. Changes of Soil Erosion and Possible Impacts from Ecosystem Recovery in the Three-River Headwaters Region, Qinghai, China from 2000 to 2015. J. Resour. Ecol. 2019, 10, 461. [Google Scholar] [CrossRef]
- Cai, H.; Yang, X.; Xu, X. Human-induced grassland degradation/restoration in the central Tibetan Plateau: The effects of ecological protection and restoration projects. Ecol. Eng. 2015, 83, 112–119. [Google Scholar] [CrossRef]
- Yan, Y.; Liu, X.; Wen, Y.; Ou, J. Quantitative analysis of the contributions of climatic and human factors to grassland productivity in northern China. Ecol. Indic. 2019, 103, 542–553. [Google Scholar] [CrossRef]
- Wei, D.; Zhao, H.; Zhang, J.; Qi, Y.; Wang, X. Human activities alter response of alpine grasslands on Tibetan Plateau to climate change. J. Environ. Manag. 2020, 262, 110335. [Google Scholar] [CrossRef]
- Xu, H.-j.; Wang, X.-p.; Zhang, X.-x. Alpine grasslands response to climatic factors and anthropogenic activities on the Tibetan Plateau from 2000 to 2012. Ecol. Eng. 2016, 92, 251–259. [Google Scholar] [CrossRef]
- Wang, Y.; Sun, Y.; Niu, F.; Wu, Q. Using 137Cs measurements to investigate the impact of soil erosion on soil nutrients in alpine meadows within the Yangtze River region, China. Cold Reg. Sci. Technol. 2017, 135, 28–33. [Google Scholar] [CrossRef]
- Shen, X.; An, R.; Feng, L.; Ye, N.; Zhu, L.; Li, M. Vegetation changes in the Three-River Headwaters Region of the Tibetan Plateau of China. Ecol. Indic. 2018, 93, 804–812. [Google Scholar] [CrossRef]
- Yu, C.; Zhang, X.; Zhang, J.; Li, S.; Song, C.; Fang, Y.; Wurst, S.; Wu, J. Grazing Exclusion to Recover Degraded Alpine Pastures Needs Scientific Assessments across the Northern Tibetan Plateau. Sustainability 2016, 8, 1162. [Google Scholar] [CrossRef]
- Lan, X.; Zhang, Q.; Xue, H.; Liang, H.; Wang, B.; Wang, W. Linking sustainable livelihoods with sustainable grassland use and conservation: A case study from rural households in a semi-arid grassland area, China. Land Use Policy 2020, 101, 105186. [Google Scholar] [CrossRef]
- Peng, F.; Xue, X.; You, Q.; Huang, C.; Dong, S.; Liao, J.; Duan, H.; Tsunekawa, A.; Wang, T. Changes of soil properties regulate the soil organic carbon loss with grassland degradation on the Qinghai-Tibet Plateau. Ecol. Indic. 2018, 93, 572–580. [Google Scholar] [CrossRef]
- Li, J.; Shao, X.; Huang, D.; Shang, J.; Liu, K.; Zhang, Q.; Yang, X.; Li, H.; He, Y. The addition of organic carbon and nitrogen accelerates the restoration of soil system of degraded alpine grassland in Qinghai-Tibet Plateau. Ecol. Eng. 2020, 158, 106084. [Google Scholar] [CrossRef]


Publisher’s Note: MDPI stays neutral with regard to jurisdictional claims in published maps and institutional affiliations. |
© 2021 by the authors. Licensee MDPI, Basel, Switzerland. This article is an open access article distributed under the terms and conditions of the Creative Commons Attribution (CC BY) license (http://creativecommons.org/licenses/by/4.0/).