Article

Pacing in Time-Limited Ultramarathons from 6 to 24 Hours—The Aspects of Age, Sex and Performance Level

by
Hagen Deusch
1,
Pantelis T. Nikolaidis
2,
José Ramón Alvero-Cruz
3,
Thomas Rosemann
1 and
Beat Knechtle
1,4,*
1
Institute of Primary Care, University of Zurich, 8091 Zurich, Switzerland
2
Faculty of Health and Caring Sciences, University of West Attica, 12243 Egaleo, Greece
3
Faculty of Medicine, University of Málaga-Andalucía TECH, 29071 Málaga, Spain
4
Medbase St. Gallen Am Vadianplatz, 9001 St. Gallen, Switzerland
*
Author to whom correspondence should be addressed.
Sustainability 2021, 13(5), 2705; https://doi.org/10.3390/su13052705
Submission received: 19 January 2021 / Revised: 25 February 2021 / Accepted: 26 February 2021 / Published: 3 March 2021

Abstract

:
(1) Background: Compared with marathon races, pacing in time-limited ultramarathons has only been poorly discussed in the literature. The aim of the present study was to analyze the interaction of performance level, age and sex with pacing during 6 h, 12 h or 24 h time-limited ultramarathons. (2) Methods: Participants (n = 937, age 48.62 ± 11.80 years) were the finishers in 6 h (n = 40, 17 women and 23 men), 12 h (n = 232, 77 women and 155 men) and 24 h (n = 665, 166 women and 409 men) ultramarathons. The coefficient of variation (CV), calculated as SD/mean, was used to described pacing. Low scores of CV denoted a more even pacing, and vice versa. A two-way analysis of variance examined the main effects and interactions of sex and race duration on age, race speed and pacing. (3) Results: More men participated in the longer race distances than in the shorter ones and men were older and faster than women. Comparing the 6 h, 12 h and 24 h races, the finishers in the 6 h were the fastest, the finishers in the 12 h were the oldest and the finishers in the 24 h showed the most variable pacing. Furthermore, the faster running speed in the 12 h (women, r = −0.64; men, r = −0.49, p < 0.001) and the 24 h (r = −0.47 in women and men, p < 0.001) was related to less variable pacing. (4) Conclusions: These data might help runners and coaches to choose the the proper duration of a race and training programs for their athletes.

1. Introduction

Athletes strive in competitions for their optimum performance. It is mandatory to choose an optimal pacing strategy in order to resist fatigue [1]. Pacing in endurance performance such as running describes how athletes distribute their energy during a race, measured by the time they need for a certain distance [2]. A runner may strategize to maintain a constant or variable pace to either complete a marathon successfully or improve race performance [3]. Choosing the optimal pacing strategy seems to be a key factor, among other parameters such as training or nutritional preparation, to finish a race among the top athletes [4,5]. Fernández-Ozcorta and Santos-Concejero reported recently that a pacing strategy with very little changes in running speed during a race could be the best during marathon running [6]. In general, races are either held as distance-limited races (e.g., in meters, in kilometers, in miles) or time-limited races (e.g., in hours, in days). An ultramarathon goes beyond the classical marathon distance of 42.195 km (26.2 miles). Time-limited ultramarathon races can last from specified time-periods of 6 h, 12 h or 24 h, up to 6 days (144 h) and 10 days (240 h). The popularity of these time-limited ultra-endurance running events has noticeably increased over the past few years [7,8].
The pacing strategy during a race is influenced by various factors, including the individual age [9], the performance [9] and the sex [10] of the athletes, and external factors such as race duration, environmental impacts and course geography.
An important aspect in pacing is the sex difference [11]. In marathon running, Santos-Lozano et al. found a significant variation between women and men in the pace in all splits [12]. In 100 km ultramarathoners, women showed lower relative starting running speeds and higher finishing running speeds than men [13]. Regarding performance level, faster finishers showed fewer variations in running speed and also slowed down less than weaker runners [14]. Breen et al. noticed that high-performing athletes used more controlled pacing strategies during a competitive marathon than weaker runners, independent of age and sex [15]. Considering age, actual studies investigating pacing in age group marathoners showed differences in pacing between younger and older runners. Older runners were found to show slower running times than younger runners in the “New York City Marathon” [5,16]. Nikolaidis and Knechtle found that within runners with a similar race time, athletes in the younger age groups showed larger changes in running speed during a marathon than the runners in the older age groups [9].
Based upon these findings, we have no knowledge about the influence of age, sex, and performance level on pacing in time-limited ultramarathons of different durations. Therefore, the aims of the present study were (i) to examine the effects of age, sex and performance level on pacing in female and male ultramarathoners competing in 6 h, 12 h, and 24 h time-limited ultramarathons, (ii) to identify differences in pacing strategies due to age and sex, and (iii) to provide information on how the endurance of a time-limited ultramarathon has an influence on the pacing behavior of the athletes. Based on the existing knowledge on marathons, we hypothesized that the level of performance would be the most important factor in pacing during a time-limited ultramarathon.

2. Materials and Methods

2.1. Ethical Approval

The Institutional Review Board of Ethikkommission St. Gallen approved all procedures used in the study with a waiver of the requirement for informed consent of the participants given the fact that the study involved the analysis of publicly available data (EKSG 01-10-2010). The study was conducted in accordance with recognized ethical standards according to the Declaration of Helsinki adopted in 1964 and revised in 2013.

2.2. Methodology

We were looking for time-limited ultramarathons from 6 to 24 h, where every lap was electronically recorded. Data were extracted directly from the internet pages of the 24 h running events held in Athens, Greece, in 2018 (https://www.dayrunners.gr/ accessed 3 March 2021) and in Timișoara, Romania, held in 2018 (https://my4.raceresult.com/ accessed 3 March 2021), and the 6 h, 12 h and 24 h running events held in Brugg and Basel, Switzerland, between 2009 and 2018 (https://my4.raceresult.com/ accessed 3 March 2021). Only runners who completed the full time of the race were considered for data analysis. At the time of race evaluations, these races were the only time-limited ultramarathons we found in Europe where all split times from all participants were available on the websites in electronic form. One of the authors was competing in several of these competitions. All races were held on asphalt where the laps were completely flat with no elevations. The time for each lap was recorded in the race results and running speed was calculated with distance and time for each lap.

2.3. Subjects

The study included 677 men (age 49.30 ± 11.52 years) and 260 women (46.83 ± 12.33 years) finishers in time-limited races held from 2009 to 2018. For the purpose of the study, the term finishers refers to finishes, since there were subjects partaking in more than one finished race.

2.4. The Races

The ages of the athletes, and the distances (in kilometers) during the 6 h, 12 h or 24 h time-limited ultramarathons, for both the male and female finishers were analyzed. Primary data included the time per lap (in minutes and in seconds) and the number of laps of each athlete. Information of the year, race, distance of one lap in m, duration of the laps, name of the athlete, age, sex, country and number of completed laps had to be available. Runners with an age younger than 18 years were excluded from this study.

2.5. Statistical Analysis

Data are presented as means and standard deviations (SD). A chi-square test (χ2) examined the association between sex and race duration, i.e., whether the men-to-women ratio (MWR)—which has been widely used as an index of participation of each sex in sport events—varied by race duration. The coefficient of variation (CV), calculated as SD/mean, was used to described pacing. CV was selected as a measure of pacing considering the different characteristics of races in term of duration and round distance. Low scores of CV denoted a more even pacing and vice versa. A two-way analysis of variance examined the main effects and interactions of sex and race duration on age, race speed and pacing. The magnitude of these effects was evaluated using eta squared (η2). The Pearson correlation coefficient r examined the relationship between CV and race speed. The alpha level was set at 0.05.

3. Results

3.1. Participation, Age and Performance by Sex and Race Duration

A sex × race duration association (χ2 = 9.924, p = 0.007, φ = 0.103) was observed with the MWR varying by race duration (1.35 in 6 h, 2.01 in 12 h and 3.01 in 24 h) (Table 1 and Table 2). A trivial main effect of sex on age was shown (p = 0.014, η2 = 0.006) with men being older than women by 2.47 years (49.30 ± 11.52 and 46.83 ± 12.33 years, respectively) (Figure 1). Particularly, the sex difference in age was statistically significant in 24 h races (difference 2.55 years, p = 0.009), but not in 6 h (6.19 years, p = 0.101) and 12 h races (1.35 years, p = 0.466). A small main effect of race duration on age was found (p < 0.001, η2 = 0.021), with finishers in 24 h races (48.33 ± 11.12 years) being older than those in 6 h races (42.15 ± 11.78 years) and younger than those in 12 h races (50.47 ± 13.20 years). No sex × race duration interaction effect on age was observed (p = 0.455, η2 = 0.002).
A small main effect of sex on running speed was shown (p < 0.001, η2 = 0.014) with men being faster than women by 0.40 km·h−1 (8.11 ± 1.66 and 7.71 ± 1.57 km·h−1, respectively) (Figure 2). Particularly, the sex difference effects on race speed were statistically significant in 6 h (difference 1.13 km·h−1, p = 0.019) and 12 h races (difference 0.74 km·h−1, p = 0.002), but not in 24 h races (difference 0.26 km·h−1, p = 0.060). A small main effect of race duration on running speed was found (p < 0.001, η2 = 0.034) with finishers in 6 h races (9.32 ± 1.54 km·h−1) being faster than those in 12 h (7.77 ± 1.72 km·h−1) and in 24 h races (8.00 ± 1.58 km·h−1). No sex × race duration interaction effect on running speed was observed (p = 0.066, η2 = 0.006).

3.2. Pacing by Sex, Race Duration and Performance

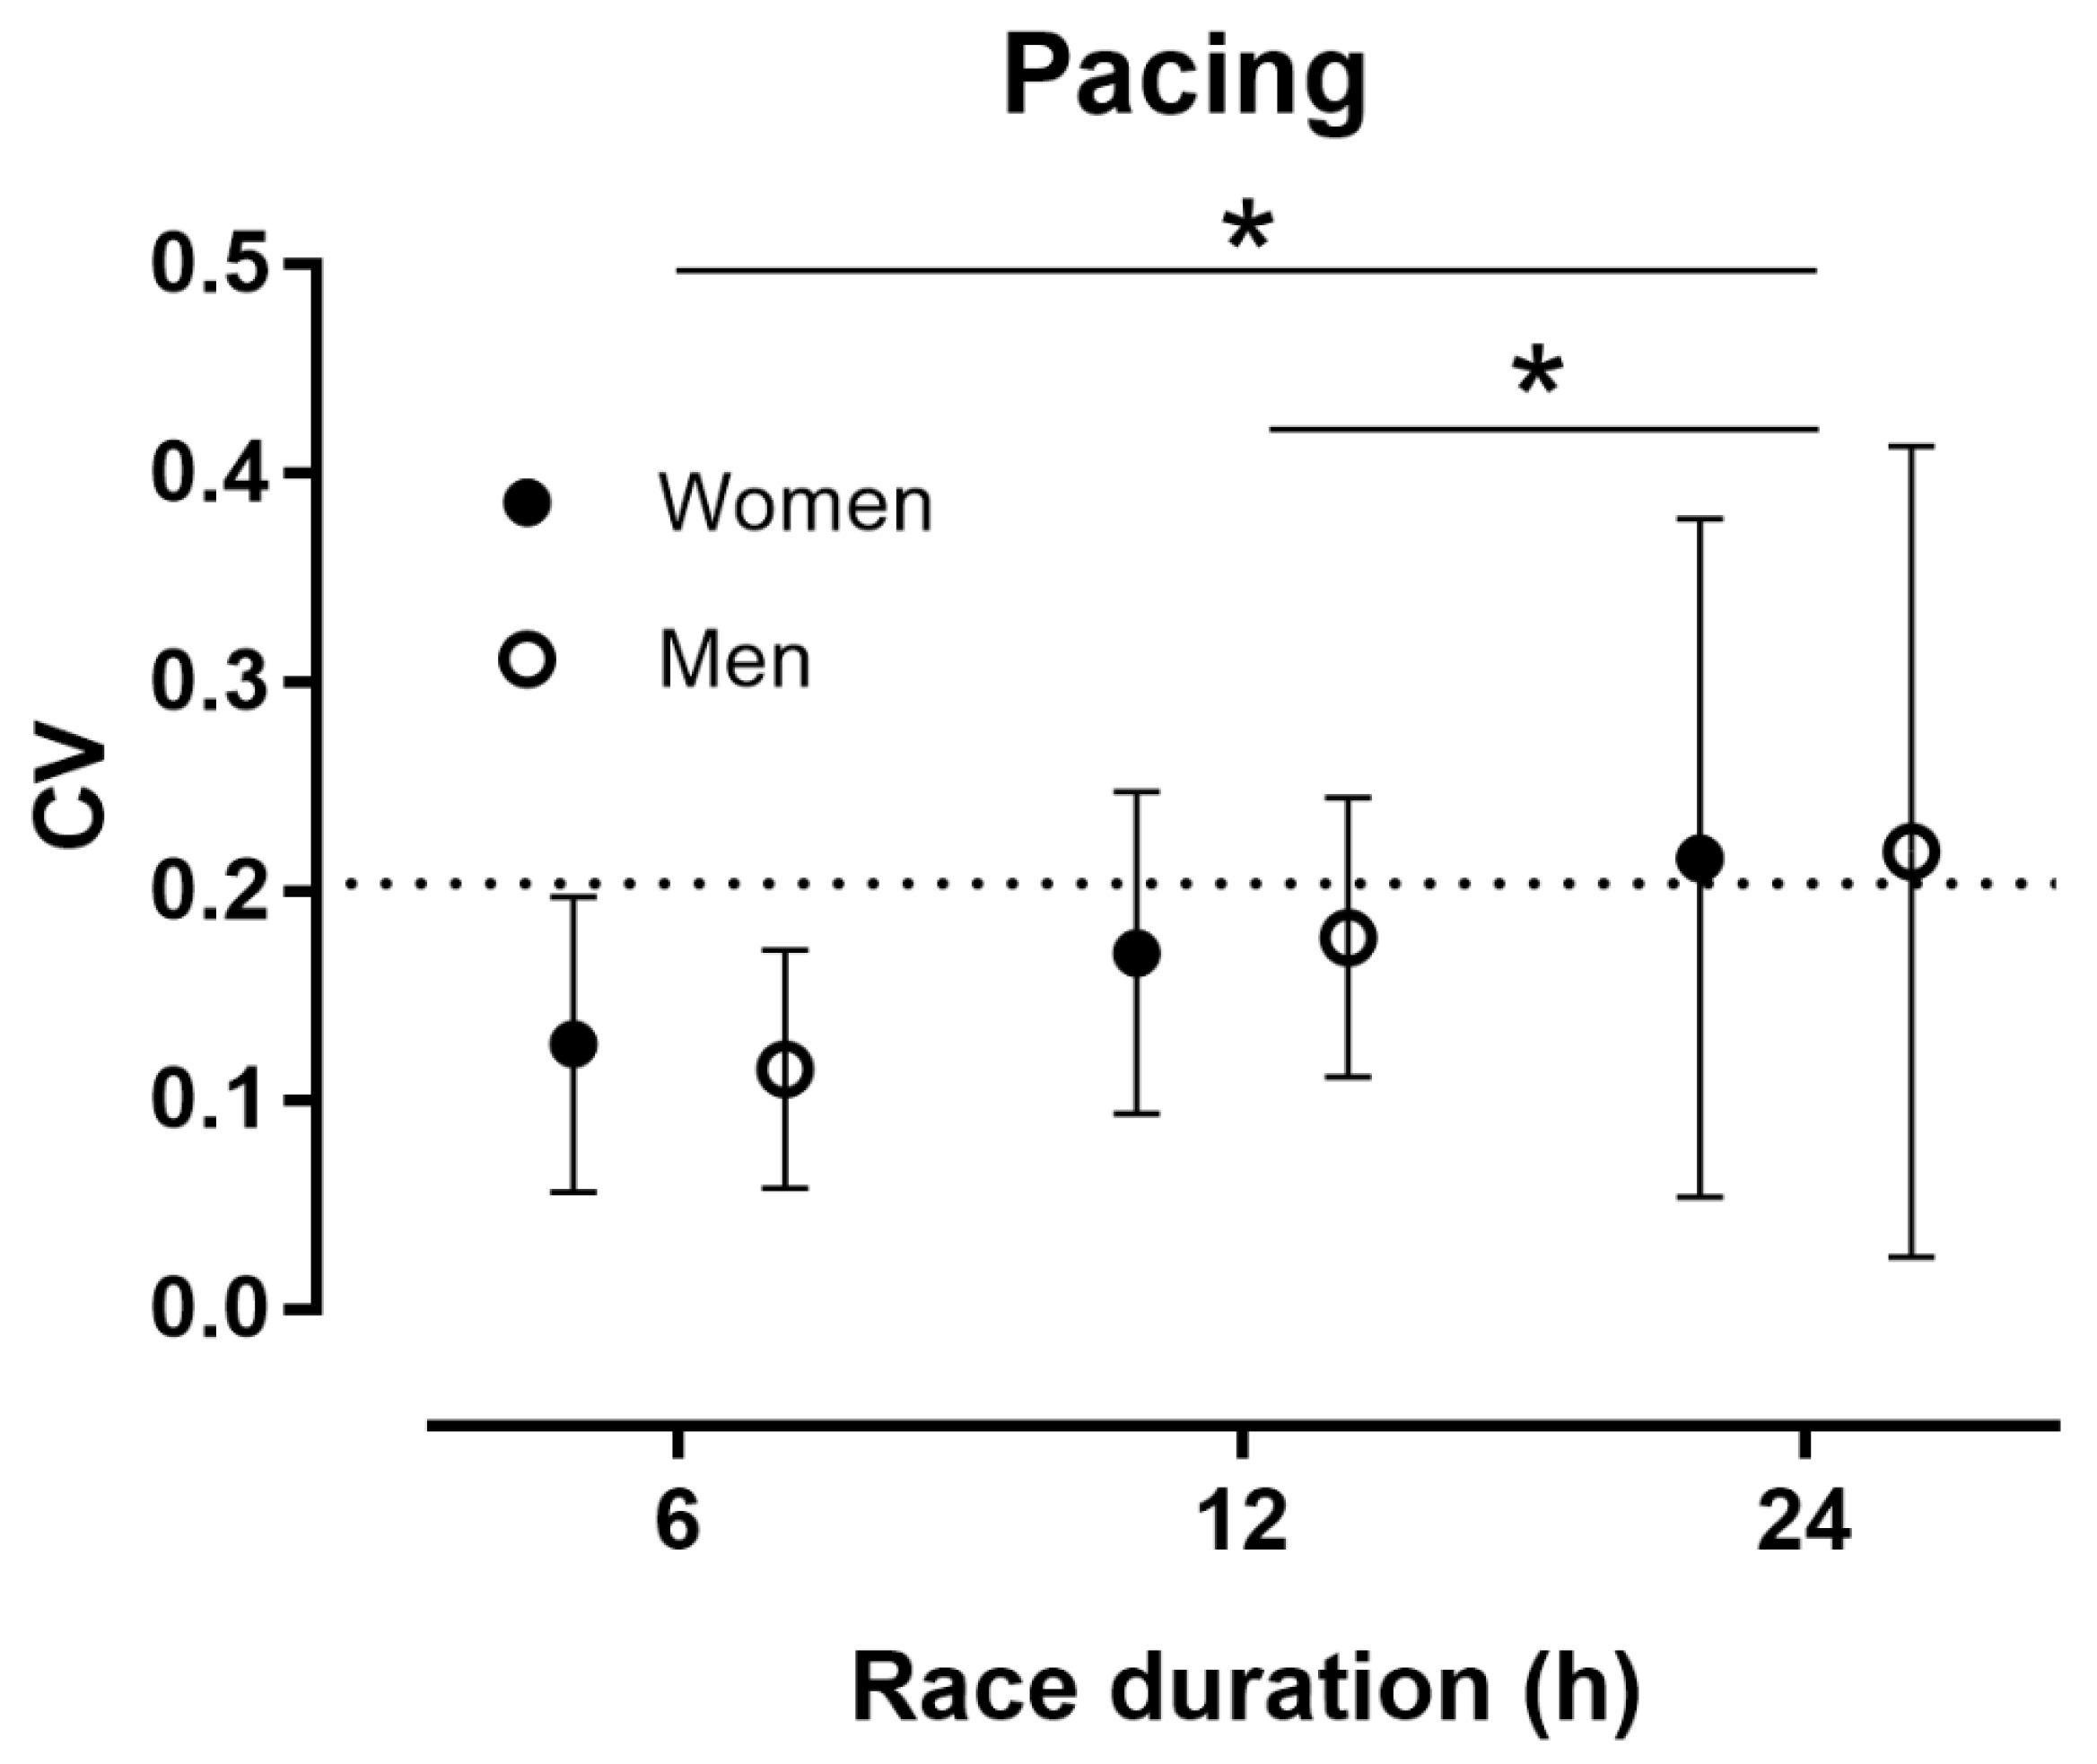
No main effect of sex on pacing was observed (p = 0.982, η2 < 0.001). A small main effect of race duration on pacing was shown (p < 0.001, η2 = 0.021), with finishers in 24 h races (0.218 ± 0.186) presenting a larger CV than those in 6 h (0.120 ± 0.062) and 12 h races (0.176 ± 0.070) (Figure 3).
No sex × race duration interaction effect on pacing was found (p = 0.943, η2 < 0.001). CV correlated moderately to largely, and inversely, with running speed in 12 h (women, r = −0.64; men, r = −0.49, p < 0.001) and 24 h races (r = −0.47 in women and men, p < 0.001), but not in 6 h races (p ≥ 0.164) (Figure 4, Figure 5 and Figure 6).

4. Discussion

This study investigated performance trends in three different time-limited ultramarathon races (6 h, 12 h and 24 h) to examine the effects of age, sex and fitness level on pacing in both female and male ultramarathoners. The main findings of this study were as follows: (i) more men participated in the longer race distances than in the shorter ones; (ii) men were older and faster than women; (iii) finishers in the 6 h races were the fastest, finishers in the 12 h races were the oldest and finishers in the 24 h races showed the most variable pacing; (iv) the faster running speeds in the 12 h and 24 h races were related to less variable pacing.
A first observation was that more men than women participated in time-limited ultramarathon races. Additionally, a relatively larger number of men participated in the longer race distances than in the shorter ones compared to women (MWR: 1.35 (6 h races), 2.01 (12 h races) and 3.01 (24 h races)). These results are in accordance with former data, as it has already been shown that more men than women take part in ultramarathons, whereby the proportion of women is increasing nowadays [17]. This sex ratio in participation can, among other things, be attributed to historical barriers [18]. Furthermore, regarding the race distance, a relatively larger number of women participate in half-marathons than in marathons [19]. Our finding that the MWR increases with the race duration and thus with the distance continues the already observed trend of relatively less women taking part in marathons than half-marathons and ultramarathons. We found that the relative number of female participants declines dramatically with the increase in race duration. Explanations for this may have biological origins. Success in distance running is determined by aerobic capacity and muscular strength [20]. As women show both lower aerobic capacity and less muscular strength [20], they may tend to prefer participation in the shorter time-limited ultramarathon running events. Our results agree with former studies and confirm that less women than men take part in time-limited ultramarathon races.
A further finding was that men were older than women by 2.47 years and finishers in 12 h races were older than those in 6 h races and 24 h races. Waldvogel et al. showed that as age increases, the performance difference between women and men decreases and also becomes lower with longer distances [21]. Our findings comply with these data, as we found that the age difference between men and women decreases from the 6 h to the 12 h or 24 h races. This phenomenon could be explained by the age-related decline in sex-specific hormones that affects men with increasing age, and it might play a role in the difference between men and women with increasing race length [22]. The observation that finishers in the 12 h races were older than those in 6 h and 24 h races was unexpected, as we hypothesized that the finishers in the 6 h races would be the oldest. We expected that, related to the decline in physiological correlatives of performance and the decrease in overall endurance performance, older athletes would prefer the shorter races given the benefits of endurance exercise for health, e.g., lower risk for cardiovascular diseases, diabetes or depression [23], without the risk of physical exhaustion. A potential explanation could be that master athletes may have more available time to train for these events [24].
A further important finding was that men were faster than woman by 0.40 km·h−1. The faster running speed in men than in women confirms previous studies on sex differences in endurance and ultramarathon running [17,22,25]. An explanation for men being faster than women might originate from differences in sex physiology and performance determinants, such as oxygen uptake. For instance, men marathon runners show a higher VO2max than female athletes [26]. The finding that finishers in the 6 h race were faster than those in the 12 h and the 24 h races is explained by the fact that with the increasing duration of a race, the fatigue of the athletes increases. It is easier to maintain a steady and fast speed during the 6 h than during the 12 h or the 24 h races. It has already been shown that the relative running speed of the athletes decreases with the duration of an ultra-endurance event [13].
A further observation was that finishers in the 24 h races demonstrated a more variable pacing than those in the 6 h races and the 12 h races. As we already showed, finishers in the 6 h races were the ones with the fastest race speed. We expected them to show less variable pacing, as it has already been reported that faster finishers showed fewer variations in running [14]. This finding is in accordance with our expectations and the literature. It has already been observed that half-marathon runners keep more even pacing than marathon runners. This trend can also be observed here, as pacing is more even in the shorter (6 h, 12 h) than in the longer (24 h) endurance events. Changes in running speed may be a consequence of fatigue during a prolonged exercise competition. Physical exhaustion naturally plays a larger role in longer running events, therefore resulting in more variable pacing during the 24 h races than during the 6 h races or the 12 h races [27]. This point still needs further investigation in the future.
An important finding during this study was that the faster running speed in the 12 h and the 24 h races was related to less variable pacing. This is what we expected, and is in accordance with the published data, wherein the fastest times were associated with fewer changes in running speed during a race [28]. Coaches could use these findings to advise novice runners to pay particular attention to optimizing their pacing strategies and running speed (i.e., overexertion in the first half, two-thirds, etc., of a race leads to a variable pacing in the remainder of the race, and can therefore greatly hinder performance times) across an endurance running event to obtain the best possible results.
A limitation is that we found only a few races with all lap times available to perform an analysis. Future studies might analyze more races and also longer durations, such as 48 h, 72 h and 6 days. In order to achieve a relatively large sample in all durations due to the low sample in 6 h races, we had to collect data from several different races where logistical and environmental conditions such as race course and weather differ. In the present study, we summarized races from several years and several countries held under different weather conditions (e.g., races held in winter in Greece, in spring in Switzerland and Romania, and in autumn again in Switzerland). Different environmental conditions were not controlled, and consequently caution must be taken for an extrapolation to other races under other circumstances. It is well-known that environmental conditions such as high ambient temperature and wind speed have an effect on running performance [29]. In addition, the findings should be considered with caution due to the relatively small sample size of finishers in the 6 h races.

5. Conclusions

In conclusion, in this study we determined factors that correlate with pacing in time-limited ultramarathon races, such as sex, age or running speed, which provide a basis for further investigations into pacing in time-limited ultramarathon races. Regarding pacing, finishers in the 24 h races showed the most variable pacing, and the faster running speed in the 12 h and 24 h races was related to less variable pacing. Further studies should also examine the influence of experience on pacing. Starting with the observation of this study, it would be interesting to gain more insight into the phenomenon that finishers in the 12 h races were older than those in the 6 h and the 24 h races. Altogether, coaches should consider not only the sex and age of their athletes, but also their pacing behavior, in order to choose the perfect time-limited ultramarathon event for the best performance outcome. The data of this study might help coaches to choose the proper duration of a race for their athletes and design the training programs accordingly. It would be of great benefit for the coaching of athletes to find out if the pacing strategy in the beginning of the 24 h races is more even and becomes more variable at the end of the race due to additional fatigue, or if the pacing is more variable right from the beginning. Further investigation is needed into this point to confirm the observed effect of race duration on the ages of the athletes. Future studies might examine whether the older finishers in the 12 h running events have longer running experience or are just beginning to participate in ultramarathons.

Author Contributions

Conceptualization, H.D. and B.K.; methodology, P.T.N.; software, P.T.N.; validation, P.T.N.; formal analysis, P.T.N.; investigation, B.K.; data curation, H.D.; writing—original draft preparation, H.D., P.T.N., B.K.; writing—review and editing, J.R.A.-C., T.R. All authors have read and agreed to the published version of the manuscript.

Funding

This research received no external funding.

Institutional Review Board Statement

Not applicable.

Informed Consent Statement

Not applicable.

Data Availability Statement

The data used to support the findings of this study are available from the corresponding author by request.

Conflicts of Interest

The authors declare no conflict of interest.

References

  1. Abbiss, C.R.; Laursen, P.B. Describing and understanding pacing strategies during athletic competition. Sports Med. 2008, 38, 239–252. [Google Scholar] [CrossRef]
  2. Micklewright, D.; Parry, D.; Robinson, T.; Deacon, G.; Renfree, A.; Gibson, A.S.C.; Matthews, W.J. Risk perception influences athletic pacing strategy. Med. Sci. Sports Exerc. 2015, 47, 1026–1037. [Google Scholar] [CrossRef] [Green Version]
  3. Haney, T.A., Jr.; Mercer, J.A. A description of variability of pacing in marathon distance running. Int. J. Exerc. Sci. 2001, 4, 133–140. [Google Scholar]
  4. Angus, S.D. Did recent world record marathon runners employ optimal pacing strategies? J. Sports Sci. 2014, 32, 31–45. [Google Scholar] [CrossRef] [PubMed]
  5. Nikolaidis, P.T.; Knechtle, B. Pacing in age group marathoners in the “New York City Marathon”. Res. Sports Med. 2018, 26, 86–99. [Google Scholar] [CrossRef] [PubMed] [Green Version]
  6. Fernández-Ozcorta, E.J.; Santos-Concejero, J. The influence of pacing strategy on marathon world records AU—Díaz, José Joaquín. Eur. J. Sport Sci. 2018, 18, 781–786. [Google Scholar] [CrossRef]
  7. Rüst, C.A.; Knechtle, B.; Rosemann, T.; Lepers, R. Analysis of performance and age of the fastest 100-mile ultra-marathoners worldwide. Clinics (Sao Paulo Braz.) 2013, 68, 605–611. [Google Scholar] [CrossRef]
  8. Zingg, M.; Rüst, C.A.; Lepers, R.; Rosemann, T.; Knechtle, B. Master runners dominate 24-h ultramarathons worldwide-a retrospective data analysis from 1998 to 2011. Extrem. Physiol. Med. 2013, 2, 21. [Google Scholar] [CrossRef] [PubMed] [Green Version]
  9. Nikolaidis, P.T.; Knechtle, B. Effect of age and performance on pacing of marathon runners. Open Access J. Sports Med. 2017, 8, 171–180. [Google Scholar] [CrossRef] [PubMed] [Green Version]
  10. March, D.S.; Vanderburgh, P.M.; Titlebaum, P.J.; Hoops, M.L. Age, sex, and finish time as determinants of pacing in the marathon. J. Strength Cond. Res. 2011, 25, 386–391. [Google Scholar] [CrossRef] [Green Version]
  11. Trubee, N.W.; Vanderburgh, P.M.; Diestelkamp, W.S.; Jackson, K.J. Effects of heat stress and sex on pacing in marathon runners. J. Strength Cond. Res. 2014, 28, 1673–1678. [Google Scholar] [CrossRef]
  12. Santos-Lozano, A.; Collado, P.S.; Foster, C.; Lucia, A.; Garatachea, N. Influence of sex and level on marathon pacing strategy. Insights from the New York City Race. Int. J. Sports Med. 2014, 35, 933–938. [Google Scholar] [CrossRef]
  13. Renfree, A.; Crivoi do Carmo, E.; Martin, L. The influence of performance level, age and gender on pacing strategy during a 100-km ultramarathon. Eur. J. Sport Sci. 2016, 16, 409–415. [Google Scholar] [CrossRef]
  14. Tan, P.L.S.; Tan, F.H.Y.; Bosch, A.N. Similarities and differences in pacing patterns in a 161-km and 101-km ultra-distance road race. J. Strength Cond. Res. 2016, 30, 2145–2155. [Google Scholar] [CrossRef] [PubMed]
  15. Breen, D.; Norris, M.; Healy, R.; Anderson, R. Marathon pace control in mastersathletes. Int. J. Sports Physiol. Perform. 2018, 13, 332–338. [Google Scholar] [CrossRef] [PubMed] [Green Version]
  16. Nikolaidis, P.T.; Knechtle, B. Do fast older runners pace differently from fast younger runners in the ‘New York City Marathon’? J. Strength Cond. Res. 2019, 33, 3423–3430. [Google Scholar] [CrossRef] [PubMed] [Green Version]
  17. Nikolaidis, P.T.; Knechtle, B. Age of peak performance in 50-km ultramarathoners—Is it older than in marathoners? Open Access J. Sports Med. 2018, 9, 37–45. [Google Scholar] [CrossRef] [PubMed] [Green Version]
  18. Joyner, M.J. Physiological limits to endurance exercise performance: Influence of sex. J. Physiol. 2017, 595, 2949–2954. [Google Scholar] [CrossRef] [Green Version]
  19. Cribari, M.; Rüst, C.A.; Rosemann, T.; Onywera, V.; Lepers, R.; Knechtle, B. Participation and performance trends of East-African runners in Swiss half-marathons and marathons held between 2000 and 2010. BMC Sports Sci. Med. Rehabil. 2013, 5, 24. [Google Scholar] [CrossRef]
  20. Cheuvront, S.N.; Carter, R.; DeRuisseau, K.C.; Moffatt, R.J. Running performance differences between men and women. Sports Med. 2005, 35, 1017–1024. [Google Scholar] [CrossRef] [PubMed]
  21. Waldvogel, K.J.; Nikolaidis, P.T.; Di Gangi, S.; Rosemann, T.; Knechtle, B. Women reduce the performance difference to men with increasing age in ultra-marathon running. Int. J. Environ. Res. Public Health 2019, 16, 2377. [Google Scholar] [CrossRef] [PubMed] [Green Version]
  22. Sousa, C.V.; da Silva Aguiar, S.; Rosemann, T.; Nikolaidis, P.T.; Knechtle, B. American Masters road running records—The performance gap between female and male age group runners from 5 km to 6 days running. Int. J. Environ. Res. Public Health 2019, 16, 2310. [Google Scholar] [CrossRef] [PubMed] [Green Version]
  23. Marzetti, E.; Calvani, R.; Tosato, M.; Cesari, M.; Di Bari, M.; Cherubini, A.; Broccatelli, M.; Savera, G.; D’Elia, M.; Pahor, M.; et al. Physical activity and exercise as countermeasures to physical frailty and sarcopenia. Aging Clin. Exp. Res. 2017, 29, 35–42. [Google Scholar] [CrossRef] [PubMed]
  24. Lepers, R.; Stapley, P.J. Master athletes are extending the limits of human endurance. Front. Physiol. 2016, 7, 613. [Google Scholar] [CrossRef] [PubMed] [Green Version]
  25. Nikolaidis, P.T.; Onywera, V.O.; Knechtle, B. Running performance, nationality, sex, and age in the 10-km, half-marathon, marathon, and the 100-km ultramarathon IAAF 1999–2015. J. Strength Cond. Res. 2017, 31, 2189–2207. [Google Scholar] [CrossRef]
  26. Nikolaidis, P.T.; Knechtle, B. Pacing strategies in the ‘Athens Classic Marathon’: Physiological and psychological aspects. Front. Physiol. 2018, 9, 1539. [Google Scholar] [CrossRef]
  27. Del Coso, J.; Fernández de Velasco, D.; Abián-Vicen, J.; Salinero, J.J.; González-Millán, C.; Areces, F.; Ruiz, D.; Gallo, C.; Calleja-González, J.; Pérez-González, B. Running pace decrease during a marathon is positively related to blood markers of muscle damage. PLoS ONE 2013, 8, e57602. [Google Scholar] [CrossRef]
  28. El Helou, N.; Tafflet, M.; Berthelot, G.; Tolaini, J.; Marc, A.; Guillaume, M.; Hausswirth, C.; Toussaint, J.F. Impact of environmental parameters on marathon running performance. PLoS ONE 2012, 7, e37407. [Google Scholar] [CrossRef] [Green Version]
  29. Nikolaidis, P.T.; Di Gangi, S.; Chtourou, H.; Rüst, C.A.; Rosemann, T.; Knechtle, B. The role of environmental conditions on marathon running performance in men competing in Boston Marathon from 1897 to 2018. Int. J. Environ. Res. Public Health 2019, 16, 614. [Google Scholar] [CrossRef] [Green Version]
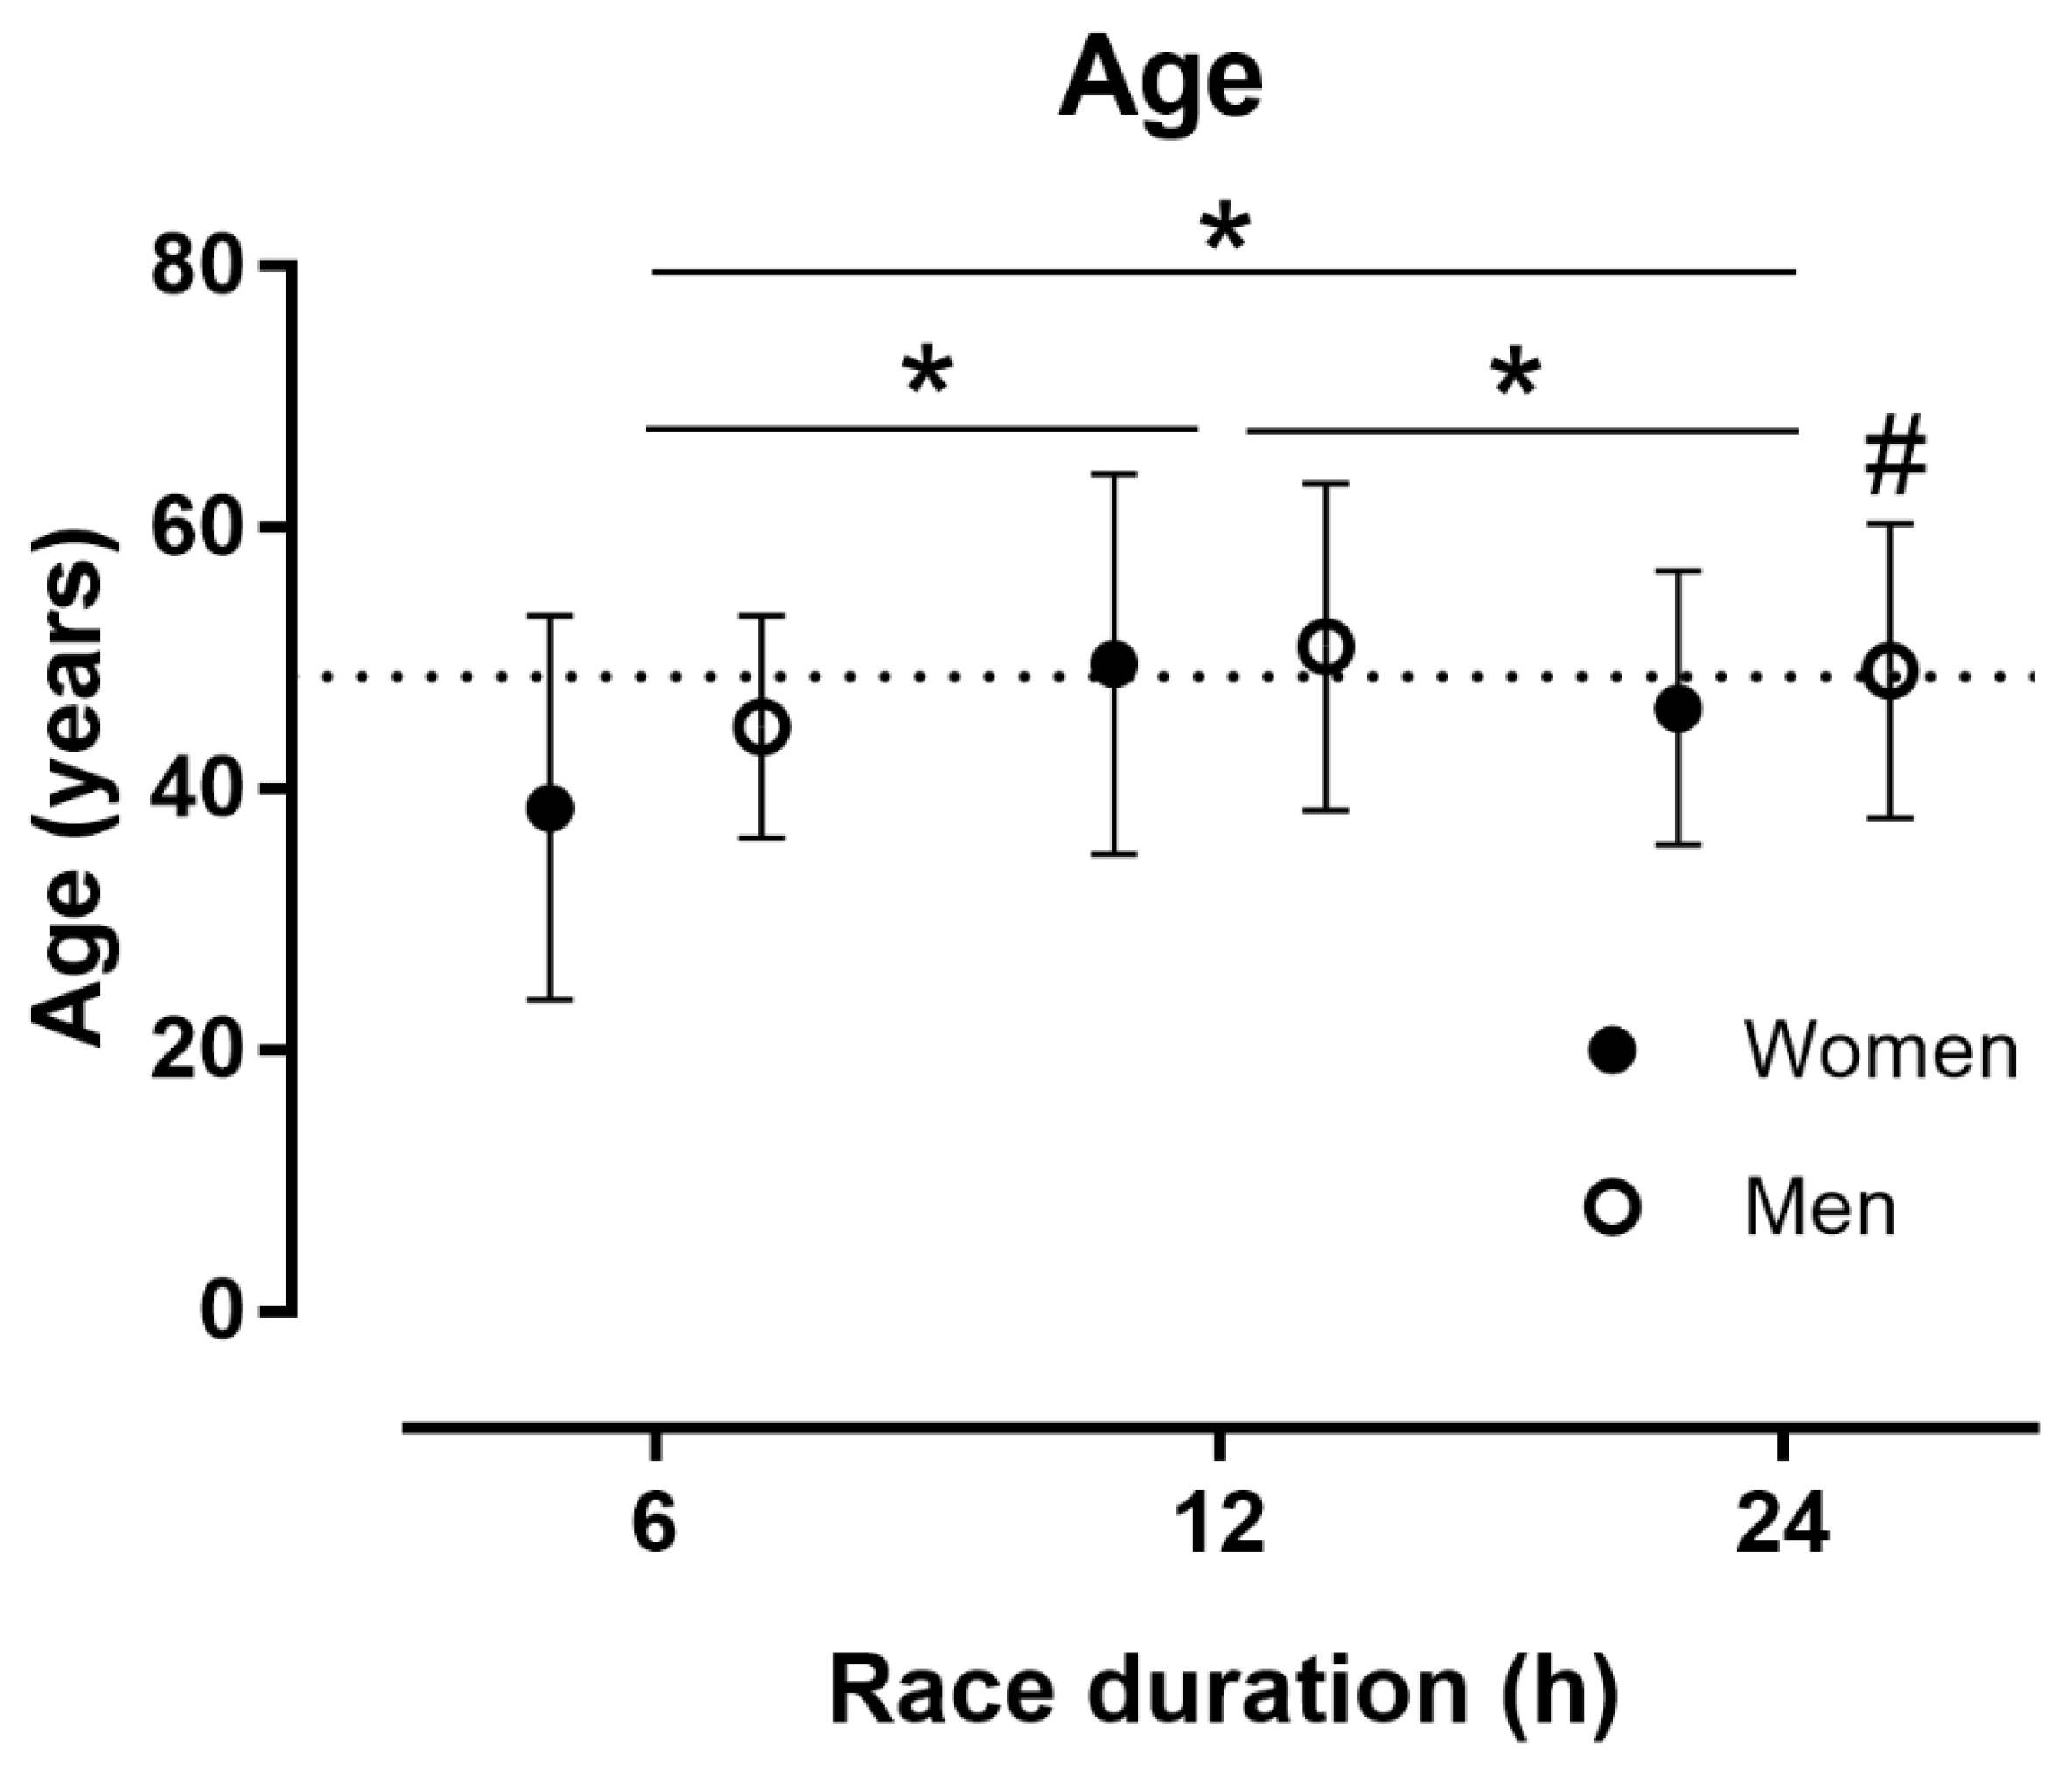
Figure 1. Age by race duration and sex. Error bars represent standard deviations; dashed lines represent the mean scores of all participants; * differences among race durations at p < 0.05; # sex differences at p < 0.05.
Sustainability 13 02705 g001
Figure 2. Speed by race duration and sex. Error bars represent standard deviations; dashed lines represent the mean scores of all participants; * differences among race durations at p < 0.05; # sex differences at p < 0.05.
Sustainability 13 02705 g002
Figure 3. Pacing by race duration and sex. Error bars represent standard deviations; dashed lines represent the mean scores of all participants; * differences among race durations at p < 0.05. CV = coefficient of variation.
Sustainability 13 02705 g003
Figure 4. Relationship between race speed and pacing in 6 h races. R2 = coefficient of determination; error bars represent 95% confidence intervals. ●, W = women, ◯, M = men. CV = coefficient of variation.
Sustainability 13 02705 g004
Figure 5. Relationship between race speed and pacing in 12 h races. R2 = coefficient of determination; error bars represent 95% confidence intervals. ●, W = women, ◯, M = men. CV = coefficient of variation.
Sustainability 13 02705 g005
Figure 6. Relationship between race speed and pacing in 24 h races. R2 = coefficient of determination; error bars represent 95% confidence intervals. ●, W = women, ◯, M = men. CV = coefficient of variation.
Sustainability 13 02705 g006
Table 1. Finishers by sex and race duration.
FinishersRace Duration
6 h12 h24 h
Women (n)1777166
Men (n)23155499
Total (n)40232665
MWR1.352.013.01
MWR = men-to-women ratio.
Table 2. Finishers by sex and race duration in the single races.
RaceRace Duration
6 h (w/m)12 h (w/m)24 h (w/m)
2009 (Switzerland)-/-3/104/34
2010 (Switzerland)-/-5/85/33
2011 (Switzerland)-/-7/146/25
2012 (Switzerland)3/34/74/24
2013 (Switzerland)1/75/55/26
2014 (Switzerland)6/56/132/20
2015 (Switzerland)2/41/96/25
2016 (Switzerland)4/515/3338/118
2017 (Switzerland)-/-19/2511/41
2018 (Switzerland)-/-12/3110/39
2018 (Rumania)-/--/-72/100
2018 (Greece)-/--/-5/18
w = women, m = men.
Publisher’s Note: MDPI stays neutral with regard to jurisdictional claims in published maps and institutional affiliations.