Article

Reliability of Relative Permeability Measurements for Heterogeneous Rocks Using Horizontal Core Flood Experiments

1
Center for Advanced Model Research Development and Applications, College of Earth Sciences, National Central University, Taoyuan 320317, Taiwan
2
Department of Energy Resources Engineering, Stanford University, Green Earth Sciences Bldg., 367 Panama Street, Stanford, CA 94305, USA
*
Author to whom correspondence should be addressed.
Sustainability 2021, 13(5), 2744; https://doi.org/10.3390/su13052744
Submission received: 19 December 2020 / Revised: 21 February 2021 / Accepted: 23 February 2021 / Published: 3 March 2021

Abstract

:
New guidelines and suggestions for taking reliable effective relative permeability measurements in heterogeneous rocks are presented. The results are based on a combination of high resolution of 3D core-flooding simulations and semi-analytical solutions for the heterogeneous cores. Synthetic “data sets” are generated using TOUGH2 and are subsequently used to calculate effective relative permeability curves. A comparison between the input relative permeability curves and “calculated” relative permeability is used to assess the accuracy of the “measured” values. The results show that, for a capillary number (Ncv = kLpc*A/H2μCO2qt) smaller than a critical value, flows are viscous dominated. Under these conditions, saturation depends only on the fractional flow as well as capillary heterogeneity, and is independent of flow rate, gravity, permeability, core length, and interfacial tension. Accurate whole-core effective relative permeability measurements can be obtained regardless of the orientation of the core and for a high degree of heterogeneity under a range of relevant and practical conditions. Importantly, the transition from the viscous to gravity/capillary dominated flow regimes occurs at much higher flow rates for heterogeneous rocks. For the capillary numbers larger than the critical value, saturation gradients develop along the length of the core and accurate relative permeability measurements are not obtained using traditional steady-state methods. However, if capillary pressure measurements at the end of the core are available or can be estimated from independently measured capillary pressure curves and the measured saturation at the inlet and outlet of the core, accurate effective relative permeability measurements can be obtained even when there is a small saturation gradient across the core.

1. Introduction

1.1. Literature Review

Saline aquifers have the largest potential capacity to store CO2 [1]. However, compared with oil and gas reservoirs, where a century of experience exists regarding multiphase displacement processes, our understanding of the fate and transport of CO2 and brine in saline aquifers is still limited. When CO2 migrates through a saline aquifer, the interplay between viscous, capillary, and buoyancy forces, as well as structural heterogeneities, will determine how far and how fast the plume will move, how much CO2 will dissolve, and how much will be immobilized by residual trapping [2,3]. Figure 1 illustrates the conceptual CO2 migration in deep saline aquifers. Three physical forces dominate CO2 flow behavior in different flow regimes. Characterizing different flow regimes by two transition points is important and very useful for upscaling. Scaling from one system (core scale) to another (field scale) is possible by using a dimensionless group to study the multiphase flow system. The relative permeability of CO2/brine systems is an essential element to determine CO2 injectivity and migration, as well as to assess the safety of potential CO2 sequestration sites. Multiphase flow parameters (relative permeability) are best understood in the viscous dominated regime.
An increasing number of studies based on numerical simulations at both the reservoir [4,5,6,7] and core scale [8,9,10,11] are being widely applied to describe and quantify these processes: critical input parameters to any simulation are the multiphase flow properties for the CO2/brine/rock system, such as the capillary pressure and the relative permeability curves. The latter, specifically the drainage relative permeability, is the main subject of the literature review below.
There are two main categories of laboratory techniques to measure relative permeability curves: steady-state methods [12,13,14,15,16,17] and unsteady-state methods [18,19,20,21]. In the unsteady-state method, only a single phase is injected into the core to displace in situ fluids. Saturation equilibrium is not attained and thus it can significantly reduce the time needed to measure the relative permeability curves. In the steady-state method, two fluid phases are injected simultaneously at a fixed volumetric ratio and constant rate until saturation and differential pressure along the core become constant. Although the attainment of equilibrium for steady-state method might be time consuming, the data can be interpreted directly with the multiphase flow extension of Darcy’s law using the measured saturation and pressure drop [15,22]. In this review, we focus on the steady-state relative permeability measurement technique.
Currently, there are limited laboratory data on CO2–brine relative permeability [16,23,24,25,26,27,28,29,30]. However, the reliability of such published relative permeability is directly affected by the quality of the measured relative permeability curves, as recently highlighted in reviews of published relative permeability measurements [31,32,33]. In particular, factors that could affect these measurements are (a) the core heterogeneity that may be responsible for flow rate dependency and incomplete fluid displacement; (b) capillary end effects that are not properly accounted for; and (c) gravity segregation that may occur when relatively long cores are used in a horizontal core-flooding system. In the following, the above mentioned issues are discussed in more detail.
One of the biggest concerns about relative permeability measurements is the capillary end effect [34]. Whenever a capillary pressure gradient exists along the porous medium, traditional approaches to calculate the relative permeability are insufficient. One of the standard techniques used to minimize the capillary end effect is injecting a high flow rate as the capillary forces are small compared with viscous forces at high flow rates. The influence of the end effect on relative permeability becomes significant at low rates or for low pressure gradients as saturation gradients increase with the decreasing flow rate [13,14,34,35,36,37]. On this basis, early studies have argued that relative permeability should be independent of flow rates and that, if flow rate dependency is observed, this should be attributed to the boundary effect [14,38,39]. However, there are a number of research papers in the literature suggesting that relative permeability does depend on the flow rate even when the end effect is carefully avoided [22,35,40,41,42]. Flow rate dependent relative permeability curves are attributed not only to inadequacy of the multiphase extension of Darcy’s law for transient flow, but also upscaling (volume averaging) of heterogeneous rocks with capillary heterogeneity [42,43,44,45,46,47,48,49].
Another method to minimize the capillary end effect is to increase the length of the core. However, experiments carried out with long cores in a horizontal core-flooding set-up may encounter the issue of gravity segregation [50]. Gravity segregation needs to be considered when working with a fluid pair characterized by a significant density difference, such as the oil/gas or supercritical CO2/brine system [2,51,52,53], as the large density difference can lead to gravity override based on the high Bond number, and hence causes both horizontal and vertical saturation gradients. Although using vertical experiments to measure relative permeability can avoid gravity segregation [54], the use of a vertical arrangement would make the use of X-ray CT (Computed Tomography) scanning to observe fluid saturation quite challenging without purpose-designed equipment.
In addition, spatial variation of rock properties affects both the capillary pressure and relative permeability–saturation relations [44,55,56], but it also influences the spatial distribution of saturation [8,10,16,57]. Various degrees of heterogeneity affect CO2 trapping capacity [58] and may cause flow rate dependency, high residual water saturation, and low end-point relative permeabilities observed from the CO2/brine core flood experiment [16,23,29,30,59,60,61]. It has been shown that including heterogeneity characteristics in numerical simulator grid blocks can improve the accuracy of simulation prediction and enable reliable relative permeability measurements [8,9,42,44].
Based on this literature review, the following conclusions can be drawn:
  • Although there is an increasing number of measurements of multi-phase flow of CO2 and brine in reservoir rocks [16,17,23,24,59,62], given the emerging importance of this topic, studies are needed to develop a strong scientific foundation to support sequestration in saline aquifers;
  • The large body of multiphase flow studies, particularly relative permeability in oil/water and gas/liquid systems, provides a good starting point for understanding CO2/brine systems;
  • As the fluid properties of the CO2/water system are very different from those of the oil/water system, and because of the fundamentally empirical nature of the relative permeability concept, studies are needed to establish similarities and differences between multiphase flow oil/water and CO2/brine systems;
  • Potential and unresolved influences of flow rate, capillary number, and small-scale heterogeneity on relative permeability in CO2/brine systems need to be investigated;
  • The end effect is an important factor that could lead experimental error. If we want to investigate the flow rate dependence on relative permeability curves, the end effect must be carefully understood and compensated for;
  • Based on recent studies of heterogeneity, the effect of heterogeneity may be the reason for the observed dependence of relative permeability on flow rate;
  • As the experiments to measure the influence of heterogeneity on relative permeability are time consuming, numerical simulations can be used to simulate, understand, and interpret laboratory experiments of multiphase flow in typical reservoir rocks.
Motivated by the previous multiphase flow literature regarding CO2/brine core flood experiments, the issues described above are addressed in this paper. This work builds on two studies of the influence of flow rate, gravity, and capillarity on brine displacement efficiency in homogeneous porous medium [11] and heterogeneous porous media [60]. 3D numerical modeling and 2D theoretical analysis were perfomed to understand and predict the combined influences of viscous, gravity, and capillary forces in heterogeneous rocks over the range of conditions relevant to storage of CO2 in deep underground geological formations (Figure 2). The proposed 2D semi-analytical technique predicts the brine displacement efficiency for 3D two-phase flow simulations very well when the Bond number ranges from 0.02 to 0.2 and the degree of heterogeneity σlnk/ln(kmean) is smaller than 0.5. The system considered in this series of work is supercritical CO2/water and, most significantly, drainage displacements.

1.2. Summary of the Previous Work

A new criterion to identify different flow regimes at the core scale was developed. Ninety-five percent fractional flow of CO2 and five percent brine injected simultaneously into a simulated core at a wide range of flow rates (around 0.001 mL/min to 24 mL/min) were performed. Average CO2 saturations for homogeneous and heterogeneous cores (only the high contrast model is shown here) over a wide range of flow rates are analyzed in terms of gravity number Ngv (LHS of Figure 3) and capillary number Ncv (RHS of Figure 3), respectively. It was shown that, when the effect of gravity is important for the multiphase flow system, we should use the gravity number Ngv (Equation (1)) to analyze the saturation data, for example, for the homogeneous and mildly heterogeneous cores [11]. On the other hand, when the capillary heterogeneity is taken into account, the impact of gravity is much smaller and the capillary number Ncv (Equation (2)) is a better dimensionless number to characterize our system [60]. The advantage of using appropriate dimensionless numbers can be easily seen from Figure 3. The balance of viscous, gravity, and capillary forces can be properly captured through these dimensionless numbers and flow regimes can be characterized by two critical numbers.
g r a v i t y   n u m b e r   N gv   = Δ ρ gk eff L H μ CO 2 A q t   ,    
c a p i l l a r y   n u m b e r   N cv   = k eff Lp c * H 2 μ CO 2 A q t   ,    
B o n d   n u m b e r   N B = Δ ρ gH p c * ,
where Δρ is the density difference between CO2 and brine; g is acceleration; qt is the total volumetric flow rate; keff is the effective permeability of the core; μ CO 2 is CO2 viscosity; L is the core length; H is the core height; and A is the core area. pc* is the characteristic capillary pressure of the medium, chosen as a so-called displacement capillary pressure. The displacement capillary pressure is a capillary pressure value at the brine saturation Sw equal to 1, and it is tangent to the major part of the capillary pressure data. The pc* value for our core is about 3000 Pa, shown in Figure 4.

1.3. General Rule of Thumb for Reliable Relative Permeability Measurements

According to the previous 2D semi-analytical and 3D numerical results, a “rule of thumb” is established in this paper for identifying the region in which the viscous dominated regime persists, and accurate effective relative permeability curves can be obtained from steady-state experiments. Figure 3 illustrates that, when the capillary number Ncv is small enough (below the critical value, N cv , c 1 Hete ), viscous forces dominate and the gravity impact can be neglected in this regime even with horizontal core flooding.
N cv   N cv , c 1 Hete   ,
The concept of first critical capillary number, N cv , c 1 Hete , is the most important factor to define the viscous-dominated regime for the heterogeneous cores. In principle, we can calculate the first critical number based on the previous results [60]:
N cv , c 1 Hete = 1 τ N B f CO 2 R l k rCO 2 ( S BL Hete )
where τ is a dimensionless variable that represents permeability heterogeneity; SBLHete is defined as the average CO2 saturation of the heterogeneous core in the viscous-dominated regime, which is the Buckley–Leverett saturationtaking into account heterogeneity (shown in Figure 3); k rCO 2 ( S BL Hete ) is the CO2 relative permeability evaluated at S BL Hete ; R l is the aspect ratio (L/H); and fCO2 is the fractional flow of CO2. Because the critical capillary number N cv , c 1 Hete depends on the rock heterogeneity, the higher the degree of heterogeneity in the core, the smaller the capillary number Ncv required reaching the viscous-dominated regime.
Based on all the sensitivity studies for the homogeneous and heterogeneous models (two porosity-based permeability cores and four random log-normal distribution permeability cores) performed before [60], the critical capillary number N cv , c 1 Hete is chosen to be around 10, which would result in relatively uniform saturation profiles for most types of heterogeneity cores (σlnk’ < 2.5).
N cv   = k eff Lp c * H 2 μ CO 2 A q t     N cv , c 1 Hete 1 τ N B f CO 2 R l k rCO 2 ( S BL Hete ) 10   ,    
Note that this value could be larger if the core is known to be more homogeneous. Rearranging Equation (6), we can obtain the critical injection flow rate for most types of cores (Equation (7)). Further discussion will been shown later in the “Discussion” section.
q t q critical Hete k eff Lp c * H 2 μ CO 2 A N cv , c 1 Hete   in   [ m 3 s ] = 60 × 10 6 × k eff Lp c * H 2 μ CO 2 A N cv , c 1 Hete   in   [ ml min ] .
In this so-called viscous-dominated regime where the average saturation of the core is independent of the capillary or gravity number, heterogeneity results in spatially varying and lower average CO2 saturation as compared with that expected for a uniform core (Figure 3). Consequently, the effective relative permeability for the whole core is different from the intrinsic relative permeability of each individual voxel in the core. Saturations in this “viscous-dominated regime” vary spatially in response to the establishment of gravity-capillary equilibrium in the core, which is shown at the LHS of Figure 5.
On the other hand, if we continue to increase flow rates up to 100 mL/min or 200 mL/min, the saturation ultimately becomes constant throughout the core and the corresponding capillary pressure varies spatially (the RHS of Figure 5). Under these conditions, the effective relative permeability of the core and the intrinsic relative permeability of the core are the same because the saturation is uniform throughout the core [59,63]. However, in order to reach this extreme viscous-dominated regime, flow rates are required to be unreasonably high and are not expected to occur in the field [9]. Therefore, for practical interest, the concept of effective relative permeability for heterogeneous rocks is used in this paper, and the viscous-dominated regime is referred to as the “capillary equilibrium viscous-dominated regime” or the “quasi viscous dominated regime” in this work.
The objective here is to investigate systematically which parameters have a significant impact on reliable drainage relative permeability measurements on the laboratory scale. In particular, 3D high resolution core-scale simulations are conducted to study the independent as well as the combined effect of flow rate, capillary pressure, gravity, and rock heterogeneity, thus allowing identification of the operational regimes under which reliable measurements of relative permeability can be obtained using steady-state horizontal core flood experiments. In addition, we would like to support the conclusion that the effective relative permeability of a core can be measured accurately in the viscous-dominated regime or even in the transition (complex interplay) regime.

2. Materials and Methods
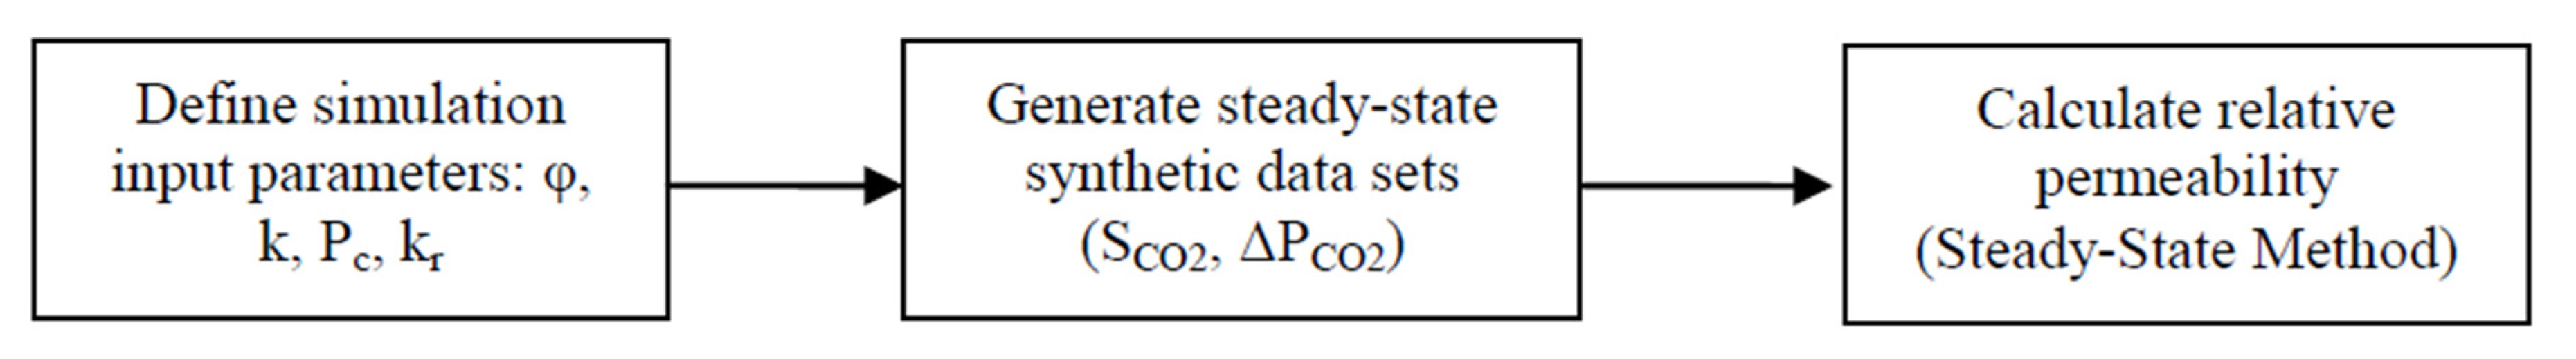
The overall methodology for this study is illustrated in Figure 6. First, we define a set of properties for the core, including the spatial distribution of permeability (k), porosity (φ), capillary pressure curves (Pc), and relative permeability curves (kr). These are then used as input for simulations using TOUGH2/ECO2N [64,65] that mimic the core-flooding procedures for making steady-state relative permeability measurements. Outputs from the simulation are used as synthetic “data sets” for calculating the relative permeability of the core. The influence of flowrate, rock heterogeneity, core length, gravity, and interfacial tension on the accuracy of the calculated relative permeability curves are systematically studied by varying these parameters over a wide range of values. Based on the comparison between the input (intrinsic) and calculated (effective) relative permeability curves, we draw conclusions about the important sources of error for these calculations as well as the conditions over which accurate measurements can be obtained. Simulations are repeated at a number of fractional flows to construct the full relative permeability curve.

2.1. Simulation

As this work builds on previous studies [9,11,60], all the simulation settings are the same as before. We will highlight some important features relevant for this study. First, the simulations for a real rock carried out in this study are based on the rock properties of a typical Berea Sandstone. As a starting point, we provide illustrative data from the actual experiments on this rock sample. For example, the CO2 saturation distribution resulting from co-injection of 5% brine and 95% CO2 is shown in Figure 7 [16,66]. The experiment is modeled by a three-dimensional roughly cylindrical core (Figure 8). A total of 31 slices are used in the flow direction, including 29 rock slices, an “inlet” slice at the upstream end of the core, and an “outlet” slice at the downstream end. All of the simulations are carried out by co-injecting known quantities of CO2 and brine at a constant flow rate into the inlet end of the core (Figure 7). The laboratory conditions and core properties are selected to replicate the laboratory experiments. All the TOUGH2 simulations are conducted at 50 °C temperature and 12.4 MPa initial pore pressure.
Three different degrees of heterogeneity are considered: for reference, a homogeneous model; a low contrast model (Kozeny–Carman); and a high contrast model. The three-dimensional porosity map, which is from X-ray CT scans of the core prior to injection [9], is used to generate the corresponding permeability map with the porosity–permeability relationships as shown in Table 1. The Kozeny–Carman (KC) equation generates the low contrast permeability map, while the exponential function of the porosity–permeability relation generates a higher degree of heterogeneity, called the high contrast model. The equations for the models as well as their normalized standard deviations in σlnk’ are shown in Table 1. The permeability of each grid element is assumed to be isotropic. These two heterogeneous models are compared to a homogeneous one to study the effect of heterogeneity on the multiphase flow system. Note that the capillary pressure and the relative permeability functions are the same in as the previous studies.

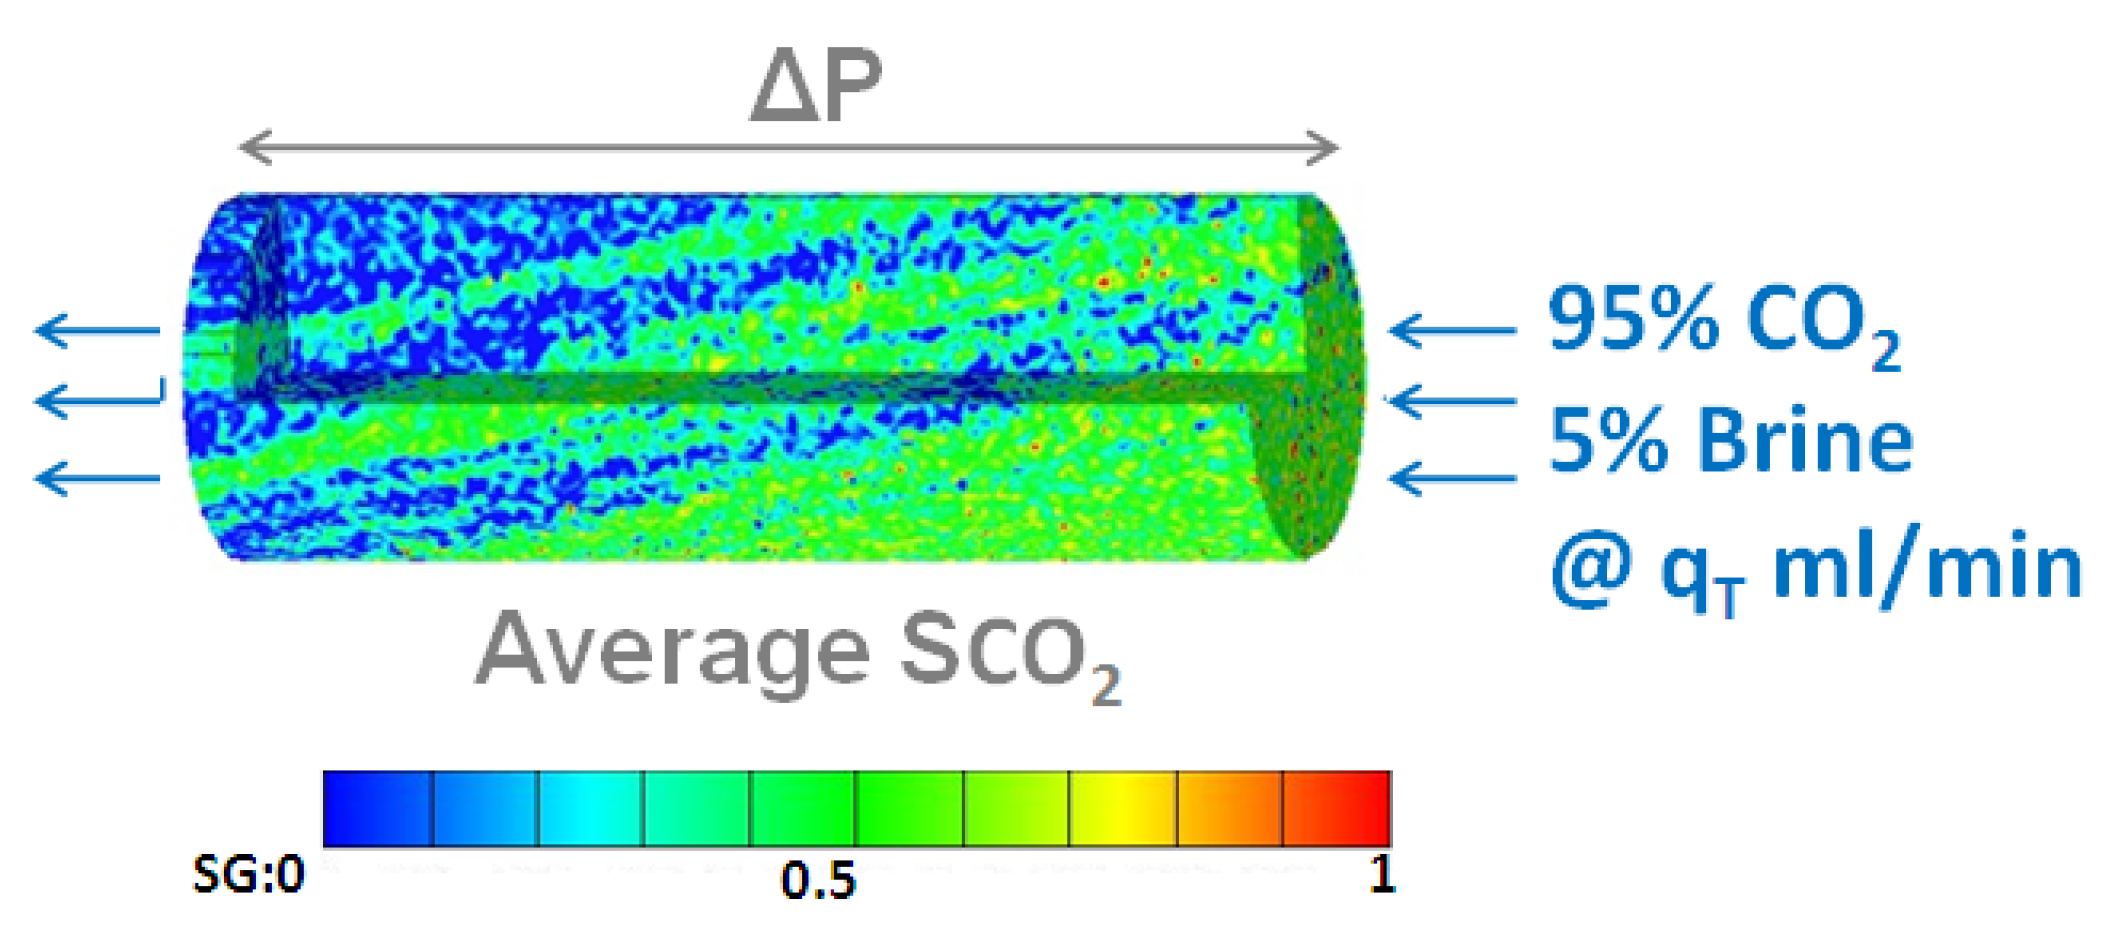
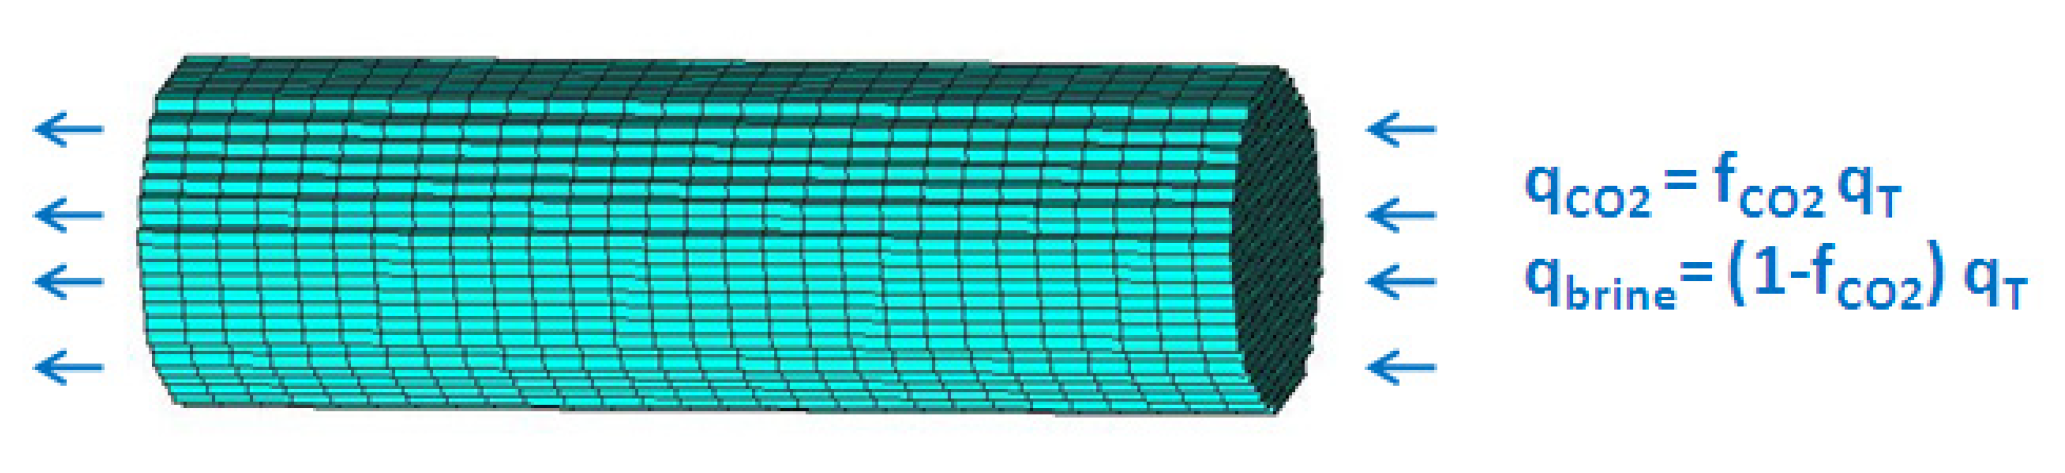
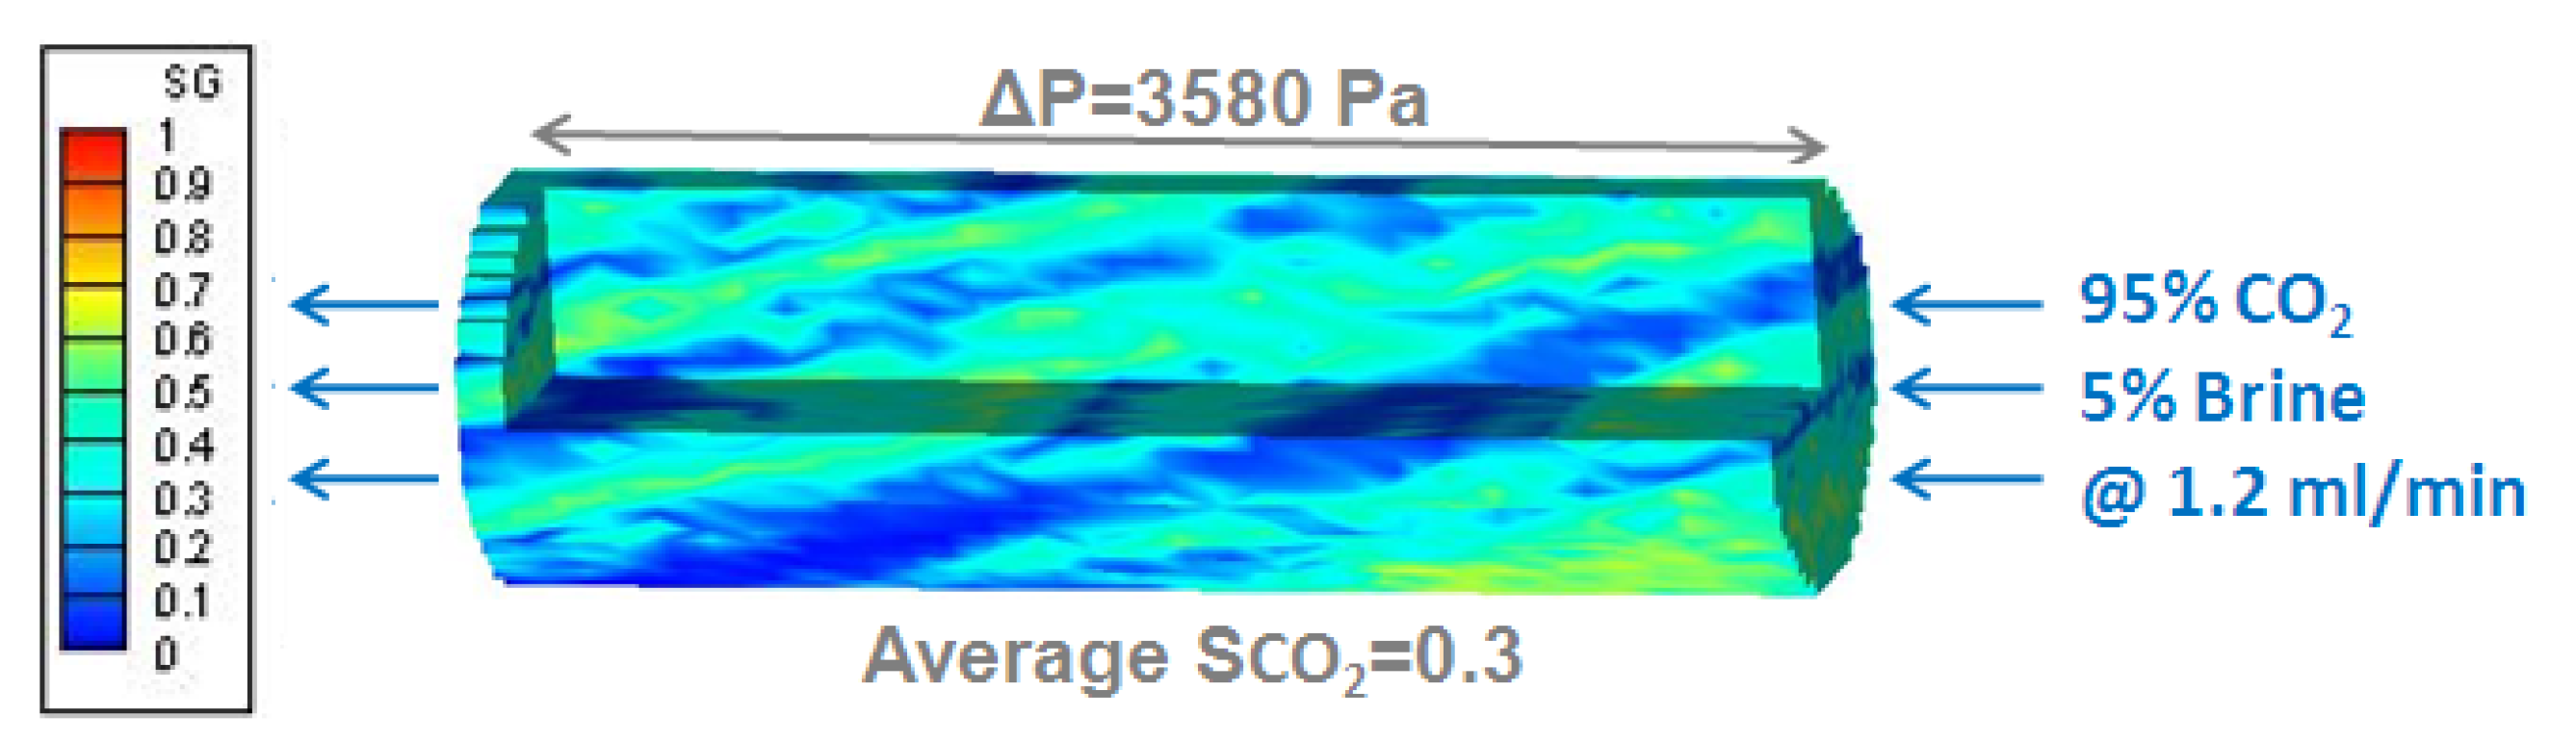
2.2. Boundary Conditions

The boundary conditions used in this study are selected to replicate the core flooding experiments [16,30,62,66]. In the experiments, CO2 and brine are mixed and co-injected through a tube and enter into a diffuser plate to distribute evenly before entering into the upstream end of the core. To avoid dry-out, carbon dioxide and water are pre-equilibrated at a high pressure and temperature (in this case, 50 °C and 12.4 MPa) prior to starting the experiment. The amounts of CO2 and brine that enter each pixel are controlled by the relative mobility of CO2 and brine (Equation (8)) such that the total rate is equal to the injection rate of each phase (Equation (9)):
q β , i Δ y Δ z = ( kk r β μ β Δ P β Δ x ) i =   ( kk r β μ β P β , inlet - P β , 1 Δ x ) i   where   β   =   w ,   CO 2 .
i q i = q t   where   q i =   q w , i + q CO 2 , i .
To replicate the inlet boundary condition with the simulator, anisotropic permeability is implemented in the inlet slice (used to mimic the diffuser) such that the injected fluids are free to spread out over the cross section area evenly and enter each cell in accordance with its mobility.
In the experiment conducted by Perrin and Benson (2010) [16], the downstream end of the core is maintained at a constant pressure by a back-pressure pump. Under this situation, it is not apparent which boundary conditions will most closely replicate the experimental measurements. Therefore, we test two numerical boundary conditions to determine which one would most closely replicate the saturation distributions observed at the outlet of the core (Figure 9a). Both test cases have imposed a time-independent Dirichlet boundary condition: the primary thermodynamic variables (for example, P and T) remain unchanged in the outlet. One boundary condition sets the capillary pressure to zero in the outlet slice of the core (Figure 9b):
Pc|outlet = 0.
The other boundary condition imposes the case where there is no capillary pressure gradient between the last rock slice and the outlet slice of the model (Figure 9c):
(dPc/dx)|outlet = 0.
An example of the measured saturation distribution along the core for different fractional flows of CO2 at a total injection rate of 2.6 mL/min flow rate is shown in Figure 9a [67]. Similar saturation distributions have been measured for other rocks as described by Krevor et al. (2012) [30]. A relatively uniform saturation profile is observed over the whole core; in particular, there is no large saturation gradient at the outlet, and different fractional flows of CO2 have different values at the end. If the boundary condition with Pc = 0 at the downstream end is imposed, a large saturation gradient occurs and every fractional flow of CO2 have zero saturation at the outlet, which is not observed in the experiments (Figure 9b). The Dirichlet boundary condition with the added constraint that dPc/dx = 0 between the last slice in the core and the outlet provides a much better match to the data at the outlet (Figure 9c). Consequently, we use this boundary condition in the rest of the simulations. Specifications for the boundary conditions are listed in Table 2.

2.3. Simulated Synthetic Relative Permeability Data Sets

For a given flow rate, simulations of co-injection of CO2 and brine are run until the pressure drop and core-averaged saturation stabilize. All of the simulations were confirmed to run for long enough (more than 10 pore volumes injected) to reach steady-state. Important output parameters include grid-cell CO2 saturations, CO2 pressures, and capillary pressures. Briefly speaking, we only analyze the core-averaged saturation in the previous study, but now, the slice-averaged quantities along the length of the core such as saturation profiles (SCO2), pressure in the CO2 phase (PCO2), and capillary pressure profiles (Pc) are evaluated in this study. Figure 10 shows a typical simulation result, including the CO2 saturation distribution, pressure drop across the core, and core-averaged CO2 saturation.
The pressure drops across the core are defined as the difference between the average inlet and the outlet slice values:
ΔPCO2= PCO2,inlet – PCO2,outlet,
ΔPw= Pw,inlet – Pw,outlet.
If the correct pressure drop in one of the phases can be measured, ΔPCO2, for example, then the water pressure drop can be rewritten in terms of the two output parameters ΔPCO2 and ΔPc:
ΔPw= (PCO2,inlet − PCO2,outlet) − (Pc,inlet − Pc,outlet)= ΔPCO2 − ΔPc.
Note that the terms Pc,inlet and Pc,outlet do not refer to the capillary pressure in the endcap, but inside the rock, just downstream or upstream of the endcaps. When Pc is the same in the first and last slice of the core, the pressure gradient drop across the core is the same in both phases. The pressure drops in each phase are used to calculate the corresponding relative permeability values based on the simplified Darcy’s equation, shown later in Equation (15).

3. Results

For horizontal, 1D, immiscible, two-phase flow in homogeneous and isotropic porous media at core scale, Darcy’s law neglecting the gravity effect takes the following form:
q w = kk rw μ w A Δ P w L     and   q CO 2 = kk rCO 2 μ CO 2 A Δ P CO 2 L .  
In this paper, Equation (15) is used to calculate the effective relative permeability as a function of the average saturation in the core, as the core average saturation and the pressure drop profiles are known. Darcy’s law is valid once the saturation and the pressure gradients along the core are constants.
For horizontal, 1D, immiscible, two-phase flow in heterogeneous cores, Equation (15) is still valid, but the relative permeability will be effective properties representing the whole core (different from the intrinsic curves). The measured relative permeability will be reliable for modeling flow under the conditions in which the experiment was conducted.

3.1. Relative Permeability Calculated When ΔPw = ΔPCO2

It is often assumed that the pressure drops in both phases are equal [22,68], which requires that the capillary pressure is constant along the length of the core. Moreover, it is assumed that the measured pressure drop accurately reflects the pressure drop in at least one of the phases. For the TOUGH2 simulations, the pressure in the non-wetting phase is treated as the primary variable. Therefore, PCO2 is the used as the “proxy” for the measured variable ΔP in the experiments. In this case, the effective relative permeability can be rearranged and calculated from Equation (15) based on the assumption that ΔPw = ΔPCO2:
k rw = q w μ w kA L Δ P CO 2 ,   k rCO 2 = q CO 2 μ CO 2 kA L Δ P CO 2 .
In the subsequent discussion, for simplicity, the results are presented for a range of flow rates and for two different degrees of heterogeneity (σlnk’ = 0 and 0.96).

3.1.1. Homogeneous Cores (σlnk’ = 0)

For homogeneous cores, the effect of flow rate on brine displacement efficiency has been shown in Kuo and Benson (2013) [11]. Figure 11 illustrates CO2 saturation as a function of the distance from the inlet at a 95% fractional flow of CO2 over a large range of flow rates (0.1 mL/min–6 mL/min). The saturation is uniform across the core at high flow rates where no saturation gradient exists, and hence there is no capillary pressure gradient along the core. Decreasing the flow rate below this regime leads to a saturation gradient in the flow direction. Based on the simulation results, the critical flow rate for the homogeneous core is around 0.3 mL/min, or equal to the flow velocity (u) of 0.25 m/day.
As mentioned in Section 2.2, the flow rate dependence shown in Figure 11 is not due to the traditional capillary end effect because the outlet boundary condition does not force the two fluids to have the same pressure. The observed saturation gradients existing at low flow rates are because gravity and capillary pressure are included in the simulation. Gravity causes some small amount of flow in the vertical direction and, consequently, the saturation of CO2 is higher near the top of the core. This in turn creates higher-than-average factional flow of CO2 near the top of the core as the fluid moves away from the inlet boundary. The net effect is to cause a saturation gradient along the length of the core.
To study the flow rate effect on relative permeability, five different injection rates are picked to obtain the corresponding relative permeability curves. Figure 12 compares the input (intrinsic) relative permeability curve with the effective relative permeability calculated based on Equation (16). As shown, they are identical when the flow rates are close or in the viscous-dominated regime (q > qcritical ~0.3 mL/min), which corresponds to the negligible saturation gradients observed in Figure 11. On the other hand, a roughly 15% saturation gradient along the flow direction results in a significant deviation of wetting phase relative permeability (0.1 mL/min). Equation (16) is no longer valid for the wetting phase as pressure drops for the two fluids are different once saturation gradients occur. Using the pressure gradient in the CO2 phase overestimates the pressure drop in the water phase, leading to underestimation of the water-phase relative permeability.

3.1.2. Heterogeneous Core (High Contrast Model, σlnk’ = 0.96)

The flow rate effect on brine displacement efficiency for the high contrast model has been shown in Kuo and Benson (2015) [60]. Figure 13 compares the average CO2 saturation along the length of the core between the homogeneous and heterogeneous cores at the same flow rates. The general trends observed in the homogeneous core can apply to the heterogeneous one. First, the slice-averaged saturation is relatively uniform in the high flowrate regime (q > 1.2 mL/min or u > 1 m/day). The source of saturation variation along the core is a combination of capillary, gravity, and heterogeneity effects. Given the constant capillary pressure curve and no gravity effects, we would get constant saturation even with the most heterogeneous core. Similar patterns can also be observed in the experiments [30,66]. Second, a large saturation gradient across the core starts to occur once the flow rate is below the limit for establishing the quasi-viscous-dominated regime. Comparing the homogeneous and the heterogeneous cores, it is clear that the capillary heterogeneity will enhance the flow rate dependency, decrease the average saturation, and increase the saturation gradient.
As mentioned before, although the constant Buckley–Leverett saturation or the intrinsic relative permeability of heterogeneous cores can be obtained once we have reached an extreme high flow rate (q > 100 mL/min or flow velocity u > 84 m/day), it is unrealistic to use such high flow rates in the core flood experiments. Therefore, the effective relative permeability of the heterogeneous cores is used to compare with the homogeneous results.
Similar to the homogeneous results, when saturation gradients are small (q > qcritical), the effective relative permeability is independent of the flowrate, which demonstrates that the relatively uniform slice-averaged saturation results in the rate-independent effective relative permeability values (Figure 14). In addition, once large saturation gradients develop (q < qcritical), the wetting phase relative permeability is reduced significantly as it is an effective property that incorporated the capillary heterogeneity effects [56,66,69,70]. In this case, the assumption of ΔPw = ΔPCO2 would also contribute to this deviation. For the same flow rate, the heterogeneous core results in larger saturation gradients compared with the homogeneous core. In general, the rate-independent drainage effective relative permeability can be obtained even with the highly heterogeneous core once the flow rate is high enough to eliminate saturation gradients from one end of the core to the other. It is not required that saturation gradients are eliminated in the middle of the core, as these result from the capillary heterogeneity of the rock.
On the other hand, even in the quasi-viscous-dominated regime, the effective CO2 relative permeability is higher than the input value. This non-intrinsic effective CO2 relative permeability occurs when the heterogeneities are aligned parallel to the direction of the flow field, a well-known phenomenon as described by Corey and Rathjens (1956) and Honarpour et al. (1994) [71,72]. Permeability distribution for the high contrast model indeed has some channels across the core diagonally (Table 1) leading to the effective relative permeability for the non-wetting phase of the heterogeneous core higher than for a homogeneous core.

3.2. Relative Permeability Calculated by Using Corrected Pressure Drops

Because the pressure drops of the water phase along the flow direction can be determined accurately based on Equation (14), we can use this true pressure drop ( Δ P w = Δ P CO 2 Δ P c ) to calculate krw (Figure 15). Once the true pressure drop of the wetting phase is known and used in the calculation, the wetting phase relative permeability is identical or close to the intrinsic values even with a 15% saturation gradient along the core (0.1 mL/min for the homogeneous core and 0.5 mL/min for the high contrast model).
Any relative permeability measurements that deviate from the intrinsic curves are referred to as inaccurate or unreliable. There are two types of impacts on relative permeability measurements. Gravity effects and capillary end effects in steady-state core flooding can be considered as leading to inaccuracies in relative permeability, because we use Darcy’s law without gravity (Equation (15)) and we assume that end effects are absent in larger scale flows. However, reservoirs are subjected to capillary and heterogeneity effects and, therefore, the relative permeabilities that include such effects may represent the core more accurately than the intrinsic curves.
As shown above, to obtain more accurate effective relative permeability at lower flow rates, capillary pressure gradient (ΔPc) needs to be included in the calculation. This concept may apply to core flood experiments and give us a more reliable relative permeability. However, capillary pressure gradients in general are not measured in the experiment. It is possible to estimate capillary pressure gradients based on the average saturation values at the inlet and outlet slices of the core. Once saturations at the ends of the core are measured (e.g., using X-ray CT scanning), the corresponding capillary pressure values can be estimated from independently measured capillary pressure curves:
Pc,inlet = Pc(Sinlet), Pc,outlet = Pc(Soutlet).
Therefore,
ΔPc = Pc(Sinlet) − Pc(Soutlet).
Compared with the effective relative permeability calculated using the same pressure drop for both fluids, it is observed that, including this corrected capillary pressure drop in the pressure drop of water, the accuracy of effective relative permeability to water for the heterogeneous core at 1.2, 0.5, and 0.1 mL/min flowrates can be increased (Figure 16). Once the saturations at the ends of the core are known, the application of this methodology can improve the accuracy of the measured relative permeability curves even at lower flowrates and in the presence of saturation gradients.

3.3. Sensitivity Studies for Different Core Properties

In the rest of this paper, we provide support for the conclusion that the effective relative permeability of a core can be measured accurately in the viscous-dominated regime or even in the transition regime, if the correct pressure gradients are used in each phase.

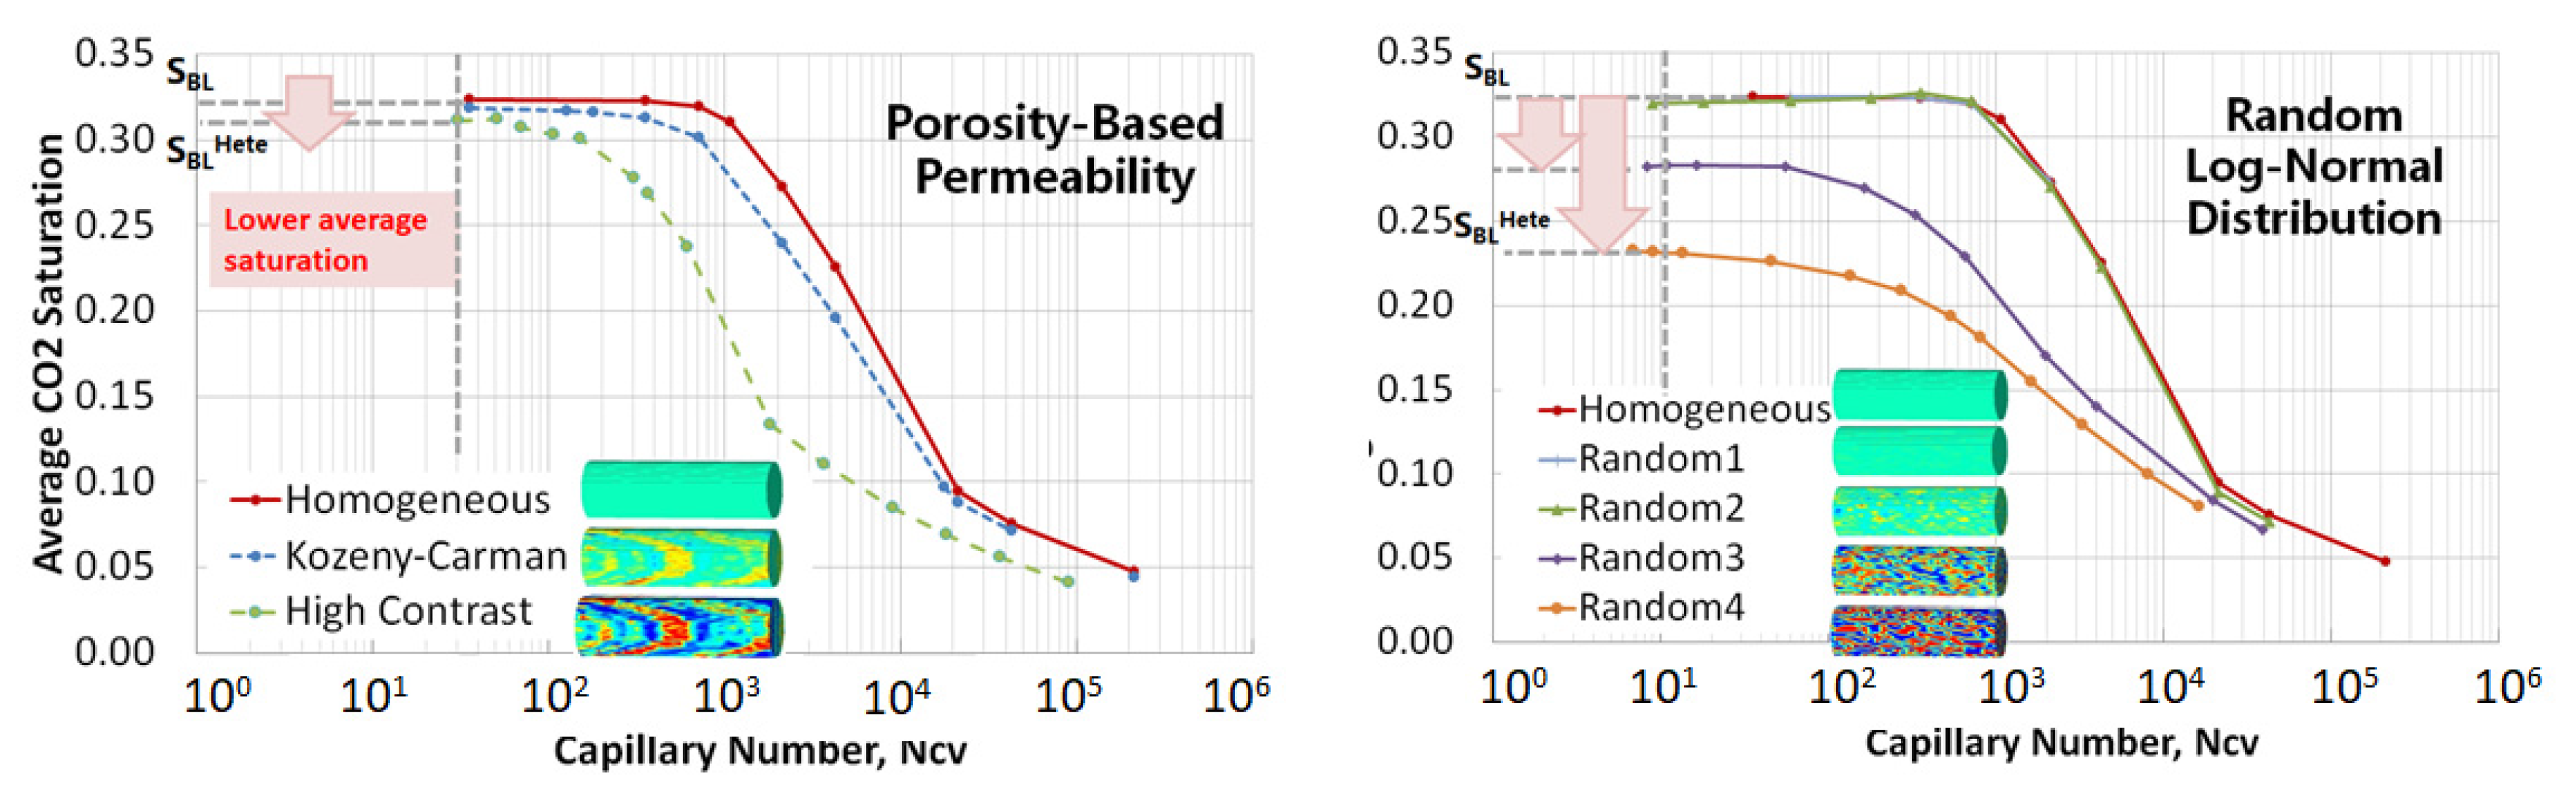
3.3.1. Effects of Heterogeneity

The core-averaged saturations with different degrees of heterogeneity have already been illustrated in Kuo and Benson (2015) [60] with capillary numbers Ncv ranging from 10 to 105. Based on the previous results, it is reasonable to hypothesize that reliable relative permeability curves can be obtained as long as the saturation is relatively uniform. To validate this conclusion, we use the homogeneous core and the four heterogeneous models to obtain the relative permeability curves calculated based on the true pressure drops in each phase (Figure 17). The permeability heterogeneity of Random 2 and Random 3 models are generated based on a random log-normal distribution with a standard deviation of σlnk’ = 0.254 and 1.42, respectively. Kozeny–Carman (KC) and high contrast (HC) models are the other type of heterogeneity distribution generated using a porosity-based approach, which has already been described earlier. The injection flow rates are chosen to be higher than the minimum flow rates for these five cases to make sure the system reaches the viscous-dominated regime (Table 3). The higher degree of heterogeneity results in higher minimum rates.
The simulation results show that the effective relative permeability depends on the degree of heterogeneity. For example, the effective relative permeability to the gas phase is larger for more heterogeneous cores, while the effective water relative permeability is smaller for the largest degree of heterogeneity (Random 3). The water relative permeability krw is almost identical when the heterogeneity factor σlnk’ < 1.42, which implies that the effective relative permeability to water krw is not as sensitive as the krg to the small-scale heterogeneity.
Relative permeability curves are almost identical for Random 2 and KC models as their heterogeneity factors σlnk’ are very close (0.254 and 0.275, respectively).

3.3.2. Effects of Core Length (15.24–45.72 cm)

In order to assess whether or not the flow rate dependency observed in the previous results depends on the length of the core, the average CO2 saturations as a function of capillary numbers for the three different core lengths (L, 2L, and 3L) are shown in the LHS of Figure 18. The aspect ratios Rl are 3.14, 6.29, and 9.43, respectively. The starred points at the LHS represent 0.1 mL/min injection flow rate, while the RHS illustrates the corresponding relative permeability. The simulation results show that, even with up to 15% saturation gradient, we can still obtain the intrinsic relative permeability for different lengths of homogeneous cores.

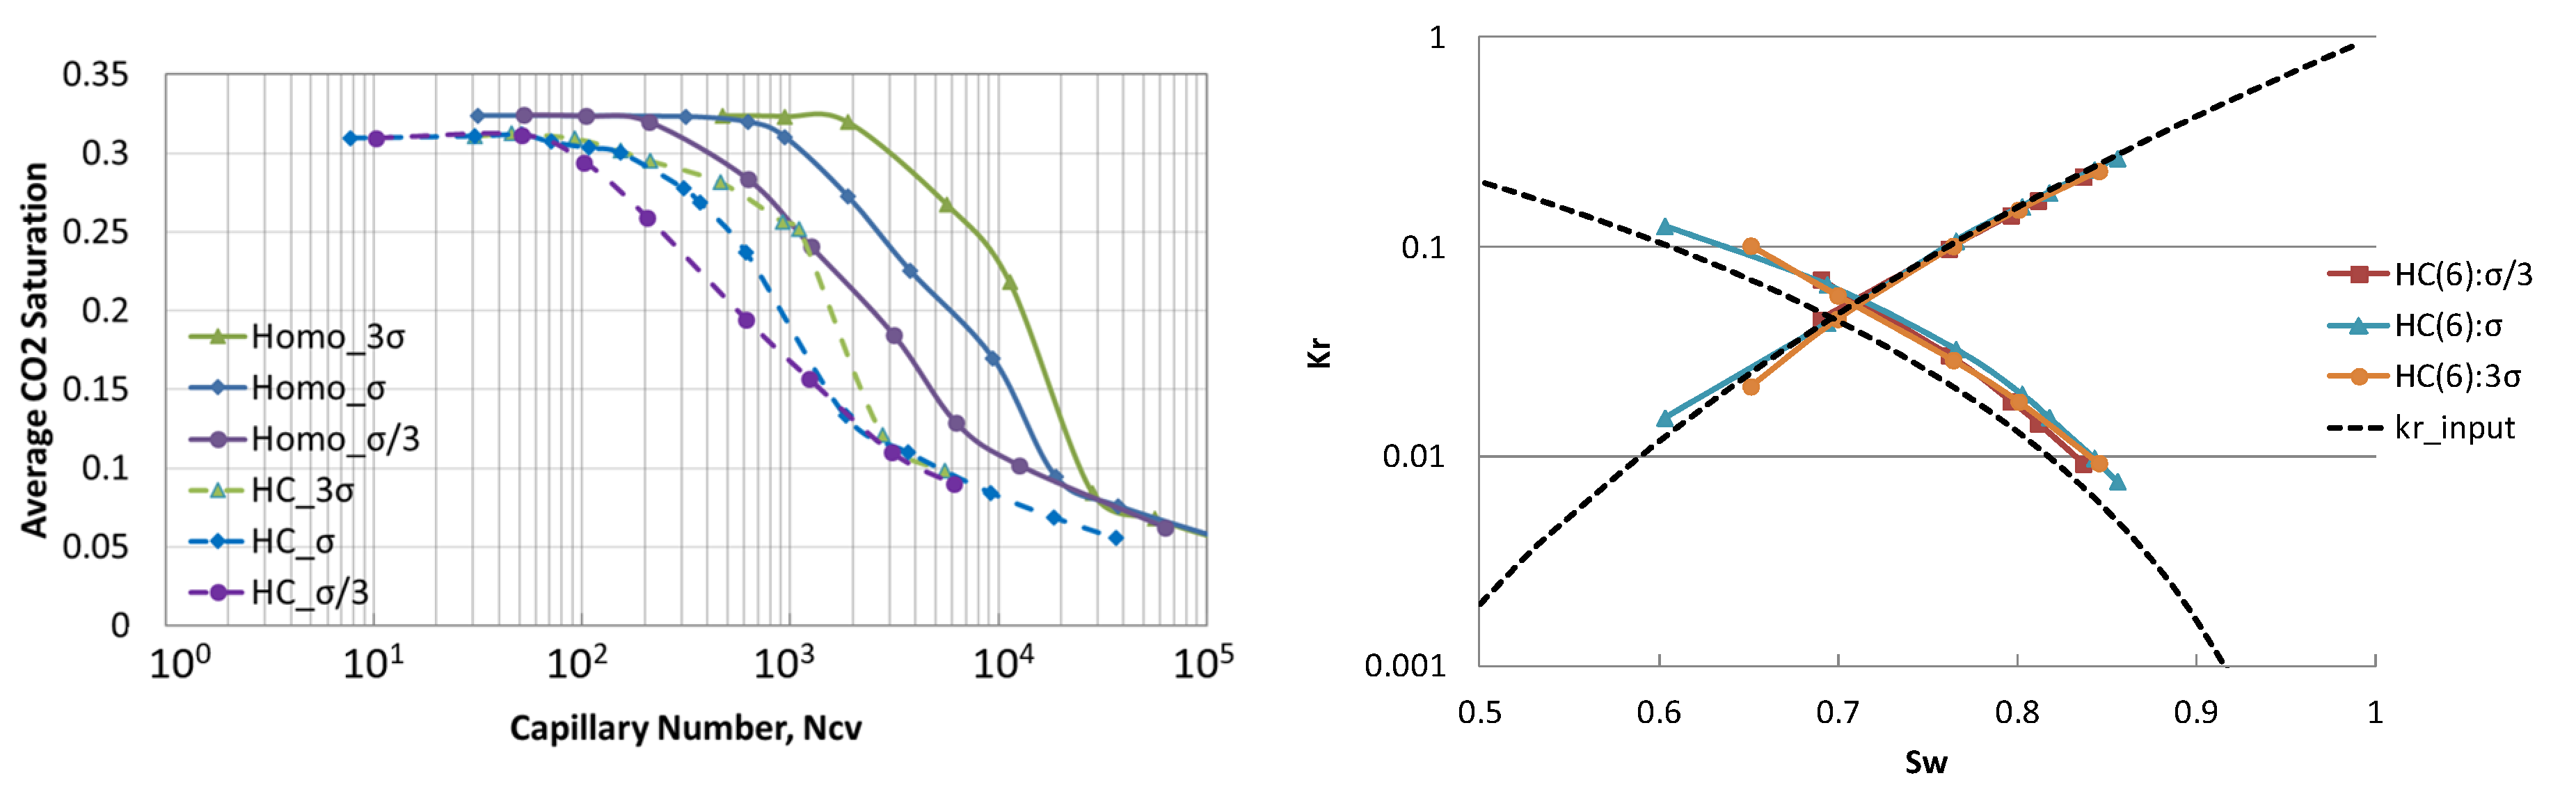
3.3.3. Effects of Interfacial Tension (7.49–67.41 mN/m)

Different pressure, temperature, and water salinity will result in different interfacial tension. Conflicting information about the effects of interfacial tension on relative permeability of CO2/brine systems has been reported in the literature [28,33,39]. Simulations covering a wide range of interfacial tension (IFT) values, which are purely hypothetical, are used solely to explore the sensitivity of relative permeability measurements to IFT values.
Figure 19 compares the average saturation of three different interfacial tensions (7.49, 22.47, and 67.41 mN/m) between the homogeneous and the high contrast model as well as the three corresponding relative permeability curves calculated based on the true pressure drops at 6 mL/min flow rate for the high contrast model. This flow rate was chosen to make sure the systems are in the viscous-dominated regime.
It is observed that there is no IFT effect on the saturations and relative permeability measurements once the system is in the viscous-dominated regime. Reliable relative permeability data are again obtained even for the heterogeneous cores with a wide range of IFT values once the displacement is within or near the viscous-dominated regime.
The LHS of Figure 19 illustrates that the range of interfacial tension effects only affect the average saturation in the transition regime. The heterogeneity not only increases the flow rate dependency, but also reduces the sensitivity of average saturation on interfacial tension. The same conclusions can also apply to a wide range of permeability cases (31.8–3180 md). Note that, based on Equation (2), a smaller capillary number Ncv corresponds to smaller IFT values, as smaller IFT values reduce capillary pressure, and hence reduce displacement capillary pressure pc*.

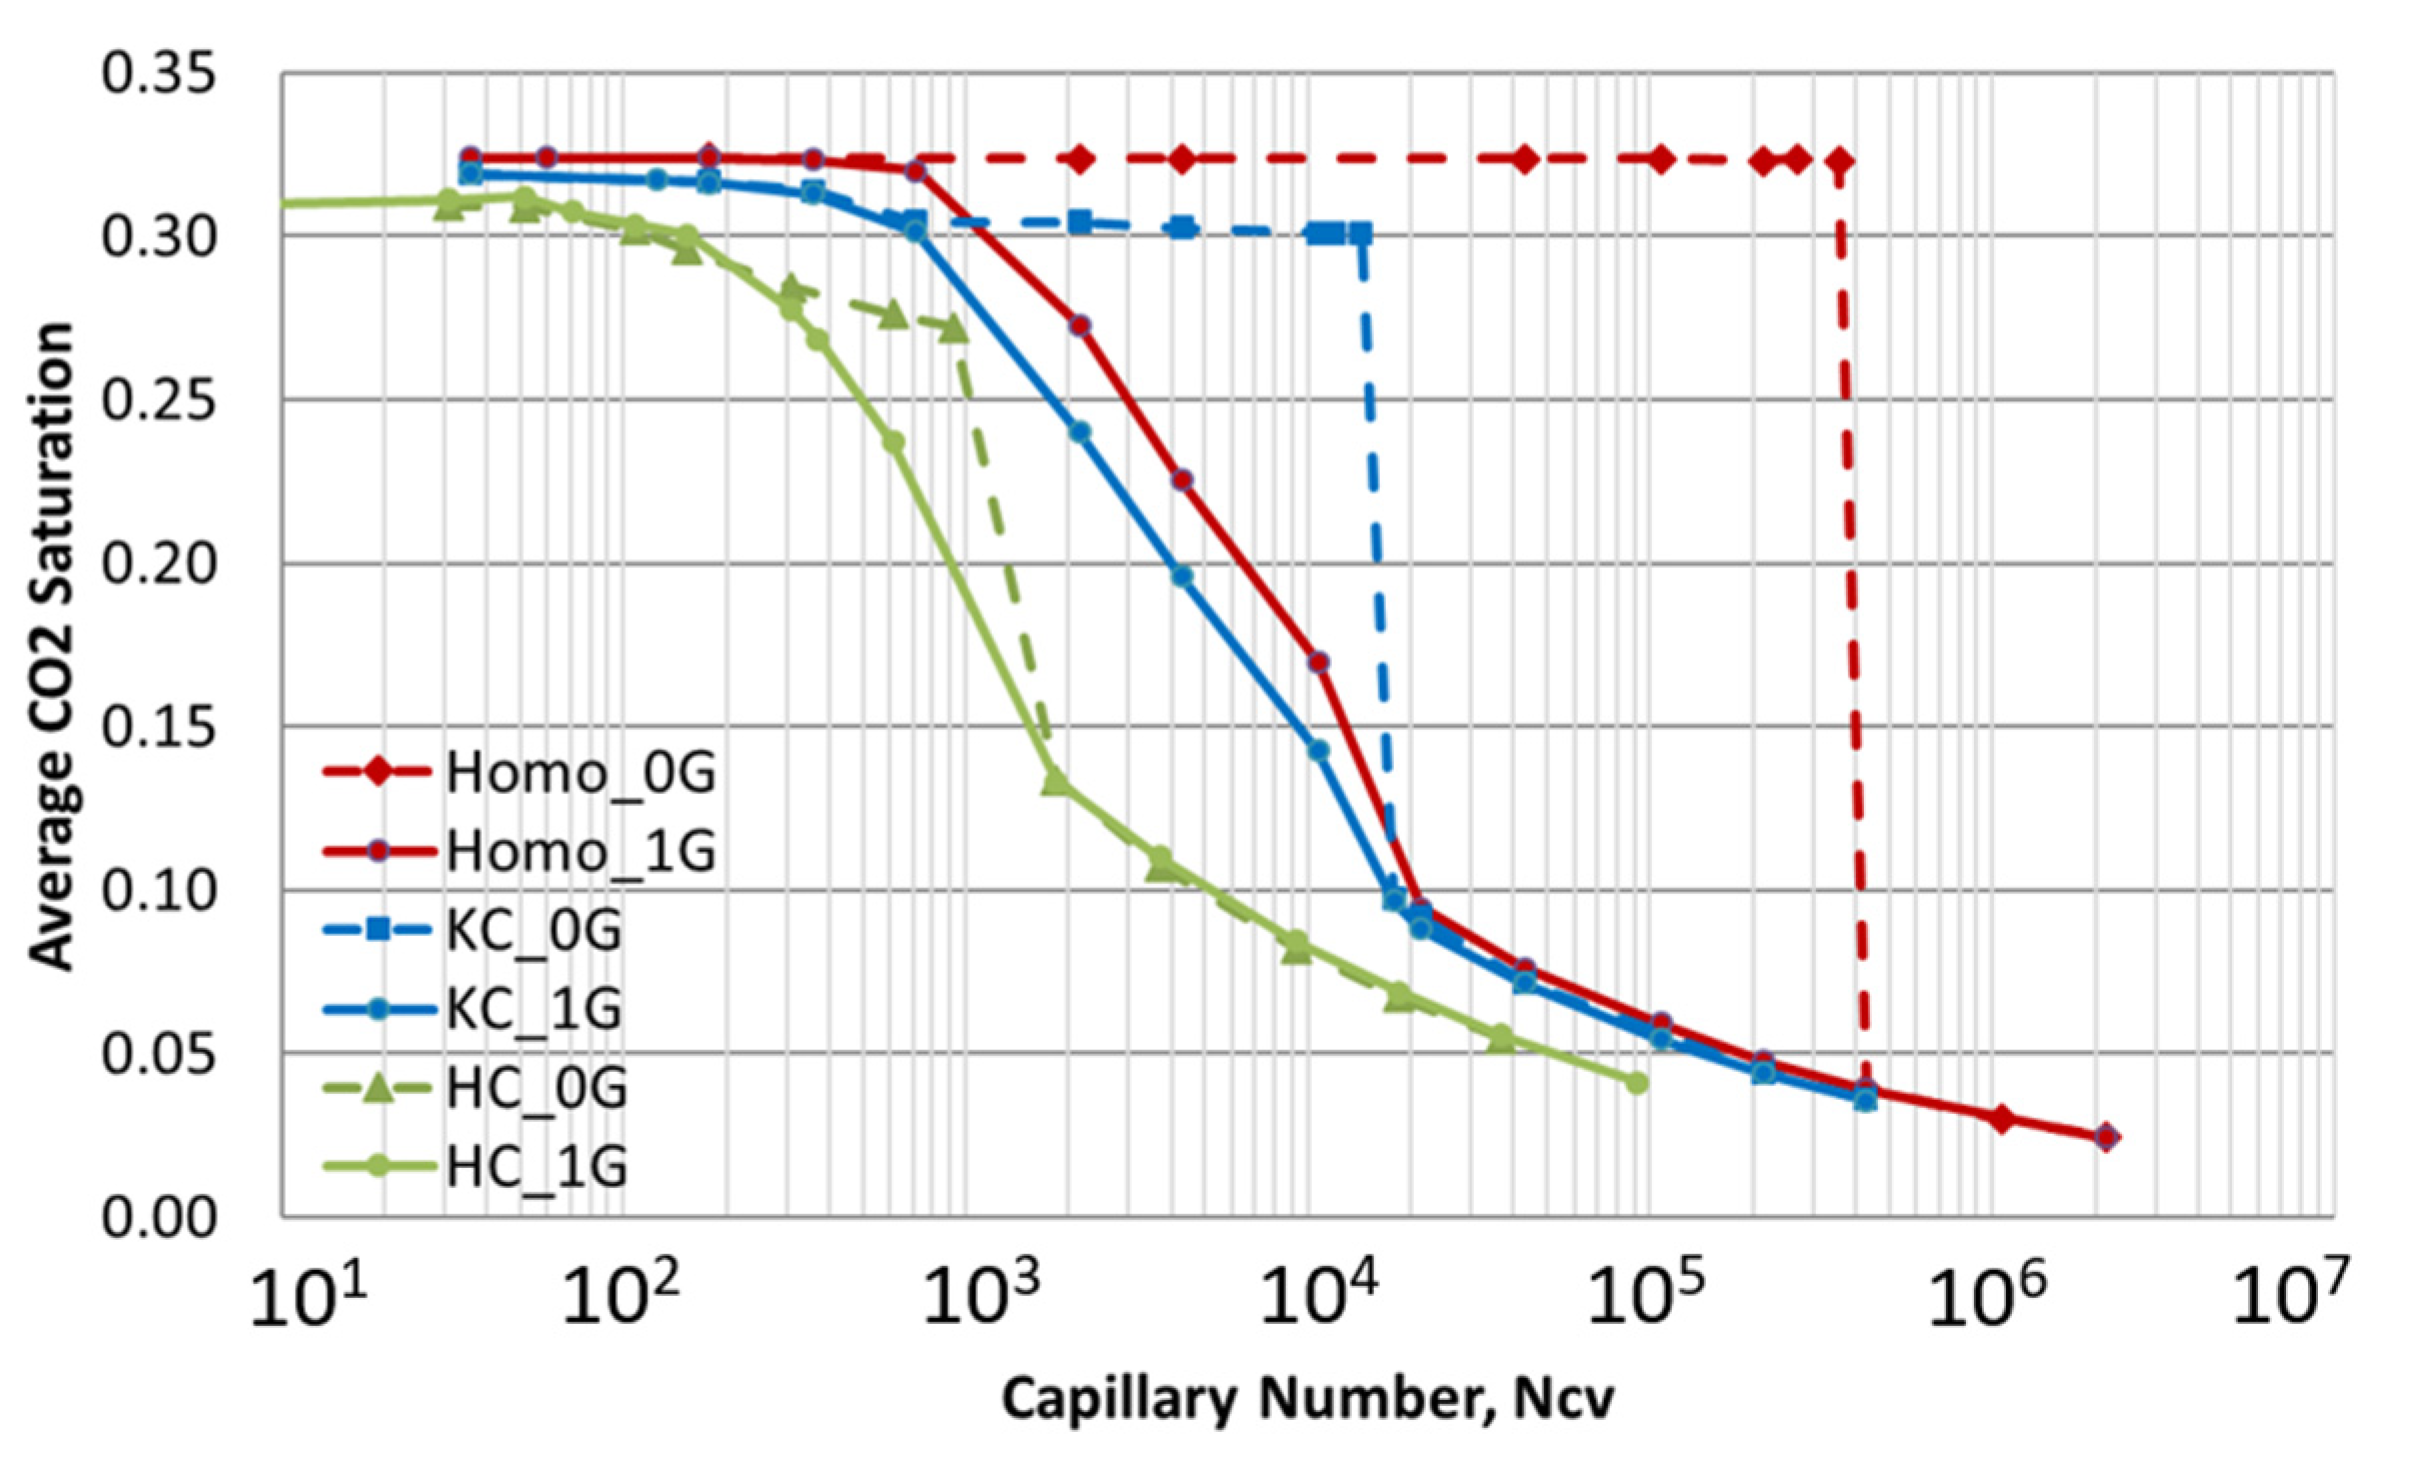
3.3.4. Effects of Gravity

Figure 20 shows a sensitivity study on the effect of gravity for the homogeneous and the two heterogeneous cores. The dashed lines represent simulations without considering gravity (setting g = 0), while the solid lines represent the simulations with gravity (setting g = 9.8 m/s2).
It is shown that gravity override is eliminated even with horizontal displacements when the capillary numbers Ncv are smaller than the critical values. It is verified that the effect of gravity due to the density difference between two fluids and the long core is small in the viscous-dominated regime, as mentioned before. However, even without considering gravity in the simulation, flow rate dependency is observed in the heterogeneous cores.
In the condition when gravity is considered, there are three physical forces (gravity force, viscous force, and the capillary forces) competing with each other in the multiphase flow system. Once gravity is removed, only capillary forces and viscous forces are competing in the system. Therefore, the transition for different types of cores (homogeneous, Kozeny–Carman, and the high contrast models) is much more abrupt when gravity is not included (Figure 20).
Furthermore, there is only one capillary pressure curve applied for the homogeneous core. However, a unique capillary pressure curve is assigned to every grid for the heterogeneous cores in order to replicate experimental core flood saturation distributions [60]. Therefore, the large degree of heterogeneity results in a wide range of capillary pressures (Pc,min < Pc < Pc,max). This could explain why the flow rate dependency is still observed in the heterogeneous cores even without considering gravity in the simulation.

4. Discussion

4.1. Observations from the Numerical and Semi-Analytical Models

Numerical simulations and semi-analytical studies of brine displacement efficiency in homogeneous and heterogeneous cores have been presented in Kuo and Benson (2013) [11] and (2015) [60], respectively. The critical capillary numbers define the transitions between flow regimes, first from the viscous dominated regime to complex interplay regime, and next from the complex interplay regime to capillary dominated regime (Figure 3). The different flow regimes are observed for both the homogeneous and heterogeneous models.
In the transition regime, buoyancy of CO2 causes lower displacement efficiency and results in a vertical saturation gradient, which leads to the deviations of relative permeability values observed in Figure 12 and Figure 14. In this regime, gravity not only causes the inaccuracy of relative permeability values, but also results in large flow rate dependency. The average saturation over a wide range of injection rates for the homogeneous and two porosity-based permeability cores as well as four random log-normal distribution permeability cores are shown in Figure 21. The simulation results show that capillary heterogeneity will increase this flow rate dependency in the transition regime, and reduce the average saturation in the viscous dominated regime.
The simulation results show that, when the capillary number is below the critical value, N cv <   N cv , c 1 Hete , the viscous force becomes greater than the gravity and capillary forces. Consequently, the calculated effective relative permeability is independent of flow rate, gravity, and Bond number in this regime.
For the cores with high permeability, low interfacial tension, or a smaller degree of heterogeneity, the two-phase flow displacement will encounter a stronger gravity effect, while the gravity effect is irrelevant for the cores with low permeability, high interfacial tension, or a larger degree of heterogeneity. In addition, the highly heterogeneous cores require the smaller Ncv to reach the viscous-dominated regime, and hence to obtain the reliable relative permeability data (Figure 21).
This is consistent with previous studies indicating that, once a saturation gradient develops along the core, the relative permeability calculated based on a one-dimensional form of Darcy’s law is no longer valid [22]. However, there are several methods to obtain the reliable effective relative permeability. First, we can increase flow rates to minimize the saturation gradients. Second, we can use true pressure drops for two fluids to get more reliable relative permeability values even with 15% saturation gradient. Finally, if the saturations at the inlet and outlet are known, we can increase the accuracy of effective relative permeability to water by including the corresponding capillary pressure drop.

4.2. Conditions for Reliable Effective Relative Permeability Measurements

In summary, the accurate whole-core effective relative permeability measurements can be achieved once we satisfy the conditions below.
(i)
If the core is known as relatively homogeneous (τ ~ 1 and SBLHete ~ SBL)
The first critical number in heterogeneous cases can be simplified into that in homogeneous cases [11]:
N cv     N cv , c 1 = 1 N B f CO 2 R l k rCO 2 ( S BL ) .  
As Ngv = NcvNB (Equations (1)–(3)), Equation (19) can also be presented as follows:
N gv     N gv , c 1 = f CO 2 R l k rCO 2 ( S BL ) .
Using the definition of N gv (Equation (1)), and rearranging Equation (20), we can obtain the total rate needed to be greater than or equal to the critical flow rate qcritical (Equations (21) and (22)) in order to enter the viscous-dominated regime:
q t q critical Δ ρ gk eff L H μ CO 2 A N gv , c 1 .  
q t q critical k eff μ CO 2 Δ ρ g f CO 2 A q c , max k rCO 2 ( S BL ) = q c , max k rCO 2 ( S BL ) .  
Because we can predict the relative permeability for the homogeneous cores quite well in the viscous-dominated regime (Figure 15) based on the 1D simplified Darcy’s equation (Equation (15)):
f CO 2 q t = q CO 2 = k eff k rCO 2 ( S BL ) μ CO 2 A Δ P CO 2 L .  
Replacing Equation (23) into Equation (22), we can obtain the following:
k eff k rCO 2 ( S BL ) f CO 2 μ CO 2 A ( Δ P CO 2 ) critical L = q critical = k eff μ CO 2 Δ ρ g f CO 2 Ak rCO 2 ( S BL ) .  
( Δ P CO 2 ) critical Δ ρ gL = 1 .  
Equation (25) implies that the first transition point occurs when   ( Δ P CO 2 ) critical = Δ ρ gL for the homogeneous cores, which is quite consistent with the simulation data shown in this study where ( Δ P CO 2 ) critical Δ ρ gL = 574   Pa . In addition, it is also in agreement with the theory provided in Kuo and Benson (2013) [11] that the first critical number is derived when the buoyancy pressure gradient equals the viscous pressure gradient.
(ii)
If the core is very heterogeneous,
N cv     N cv , c 1 Hete = 1 τ N B f CO 2 R l k rCO 2 ( S BL Hete )   .  
Using the definition of N cv (Equation (2)) and rearranging Equation (26), we can also obtain the condition for entering the viscous-dominated regime:
q t q critical Hete k eff Lp c * H 2 μ CO 2 A N cv , c 1 Hete .  
On the other hand, from the definition of N cv , c 1 Hete (Equation (5)), Equation (27) can also be presented as follows:
q t q critical Hete = k eff μ CO 2 Δ ρ g f CO 2 A k rCO 2 ( S BL Hete ) τ .  
Similarly, the effective relative permeability for the heterogeneous core is invariant in the viscous-dominated regime (Figure 15) based on the 1D simplified Darcy’s equation (Equation (15)):
f CO 2 q t = q CO 2 = k eff k rCO 2 ( S BL Hete ) μ CO 2 A Δ P CO 2 L .  
Replacing Equation (29) into Equation (28), and we can obtain Equations (30) and (31) for the heterogeneous core:
k eff k rCO 2 ( S BL Hete ) f CO 2 μ CO 2 A ( Δ P CO 2 ) critical Hete L = q critical Hete = k eff μ CO 2 Δ ρ g f CO 2 Ak rCO 2 ( S BL Hete ) τ .  
( Δ P CO 2 ) critical Hete Δ ρ gL = τ .  
where ( Δ P CO 2 ) critical Hete is the CO2 pressure drop across the core. Equation (31) implies that the first transition point occurs when   ( Δ P CO 2 ) critical Hete = Δ ρ gL τ for the heterogeneous cores. It is very important as it provides the theoretical basis that the dimensionless parameter τ could be quantified from the known properties and the experimental measurement.

4.3. Permeability Heterogeneity Parameter τ

For practical interest, the relation of permeability heterogeneity parameter τ, which illustrates the total degree of permeability heterogeneity according to Kuo and Benson (2015) [60], can be established in terms of other dimensionless heterogeneity factors and correlation lengths [61], or the normalized standard deviation σlnk’:
τ   =   1   +   f ( σ lnk ) 1  
where σlnk’ is the standard deviation of ln(ki/kmean). For the homogeneous core, σlnk’ = 0 and we should obtain τ = 1, which will be consistent with the previous work [60]. In this study, the function f ( σ lnk ) is assumed to only be dependent on σlnk’, which requires detailed information on the rock (but could be estimated based on the lithology and stratigraphy). However, we can expect that weak (but highly correlated) heterogeneities have an equally strong (if not stronger) influence as strong (but randomly oriented) heterogeneity. Therefore, the permeability heterogeneity parameter τ should be a function of the strength of heterogeneity as well as the spatial correlation. Further investigation (by means of, e.g., variograms in each spatial direction or the correlation structure of the permeability) should be attempted to discuss how the length scale of these heterogeneities may affect the permeability heterogeneity parameter τ. In addition, sensitivity studies for different degrees of heterogeneity will be required to generalize the results to a wide range of conditions.

4.4. Initial Guess of Critical Flow Rate

Based on Equations (20) and (22), almost all the parameters can be measured during the core-flood experiment, except the relative permeability evaluated at SBL, krCO2(SBL). SBL is a constant saturation, derived from the Buckley–Leverett theory, which neglects gravity and capillary effects.
Although krCO2(SBL) is unavailable before we perform the relative permeability measurements, we know krCO2 (SBL) is always smaller than or equal to 1; therefore, Equations (33) and (34) provides the upper bounds and the lower bounds of first critical number and injection flow rate for the homogeneous core, which is also useful for the design of core flood experiments.
N gv , min = f CO 2 R l N gv , c 1   f CO 2 R l k rCO 2 ( S BL ) .
q c , max q critical q c , max k rCO 2 ( S BL ) .  
q c , max = k eff μ CO 2 Δ ρ g f CO 2 A .  
In addition, Equation (28) can also be presented as follows:
q critical Hete = q c , max k rCO 2 ( S BL Hete ) τ .  
Note that Equation (36) shows that the injection flow rates required for the cores to reach the viscous dominated regime depending on the degree and nature of heterogeneity, and they are independent of the aspect ratio Rl. The more information we know about the core, the larger the Ncv (Equation (19)) (and hence the smaller the injection flow rate (Equation (22)) that can be tolerated to obtain reliable relative permeability data. The upper bound qc,max calculated based on Equation (35) is about 3.52 mL/min, which is indeed larger than the q critical = 0.3 for homogeneous cores and 1.2 for the high contrast model (Table 4). Therefore, the upper bound of the critical flow rate q c , max for the homogeneous core would probably be a good initial guess of critical flow rates for the very heterogeneous core.

4.5. Practical Application

Equations (25), (31), and (34) provide a very useful method to determine the critical flow rate in which the viscous dominated regime is reached for the core flood experiments. The basic idea could be as follows:
  • Conduct steady-state drainage core-flooding experiment with initial injection rate qc,max (Equation (35)).
  • Δ ρ gL can be calculated based on the design of experiment.
  • Equation (25) would give the lower bound of Δ P CO 2   =   Δ ρ gL .
  • Change the initial rate up and down, and measure the corresponding core pressure drop of CO2 ( Δ P CO 2 ) and average CO2 saturation for each injection rate.
  • ( Δ P CO 2 ) critical Hete could be obtained once saturation becomes constant.
  • The permeability heterogeneity parameter τ could be obtained based on Equation (31).
The method provided here could avoid performing many experiments in order to find out the viscous-dominated regime.

5. Conclusions

Potential applications of the analytical results include establishing the bounds over which relative permeability can be accurately measured in horizontal core-flood experiments. In this work, we investigated sensitivity studies on volume-averaged (up-scaled) relative permeability that accounts for the role of sub-core scale heterogeneity on multi-phase flow in CO2/brine systems. We now summarize this part of the work:
  • Despite the presence of heterogeneity, it is possible to obtain the accurate effective relative permeability measurements for heterogeneous cores. The incomplete fluid displacement is primarily due to the heterogeneity and unfavorable mobility ratio, not gravity segregation, but with a sufficiently high flow rate, these effects can be overcome.
  • The critical flowrate for making these accurate measurements was identified based on the properties of the core, and most notably on heterogeneity (Equations (22) and (28)). Increasing the flow rate results in minimizing the saturation gradient caused by the combined effects of capillary, viscous, and gravity forces; hence, the relative permeability approaches the maximum value asymptotically and stabilizes when the uniform saturation is achieved.
  • The simulation results shown here indicate that the flow-rate dependent saturation occurs not only in the heterogeneous core, but also in homogeneous cores. In addition, we show that the capillary heterogeneity will increase the flow-rate dependency.
The conclusions drawn from the relative permeability studies should apply to unsteady-state relative permeability measurements, but further studies are needed to confirm this. The presented observations and suggestions can be most likely extended to any gas/liquid system, but not for the imbibition conditions, because the latter are very relevant to geological CO2 scenarios (particularly in the post-injection phase). In addition, as no chemical reactions were considered in the simulation or the theoretical analysis, the results drawn from here may not apply to carbonate systems, which have significant chemical reactions between the fluids and rock.

Author Contributions

C.-W.K. developed the theoretical formalism, performed the analytic derivations, and performed the numerical simulations. Both C.-W.K. and S.M.B. contributed to the final version of the manuscript. All authors have read and agreed to the published version of the manuscript.

Funding

This research was funded by Global Climate and Energy Project (GCEP) at Stanford University.

Institutional Review Board Statement

Not applicable.

Informed Consent Statement

Not applicable.

Data Availability Statement

The data presented in this study are available on request from the corresponding author.

Acknowledgments

The authors would like to gratefully acknowledge the financial support of the Global Climate and Energy Project (GCEP) at Stanford University for supporting this research.

Conflicts of Interest

The authors declare no conflict of interest.

Nomenclature

Across-section area of the core [m2]ffractional flow
Hheight of the core [m]gacceleration [m/s2]
Llength of the core [m]kaverage permeability [md]
Rlaspect ratio, L/Hkrrelative permeability
NBBond number, ΔρgH/pc*qvolumetric flow rate [mL/min]
Ncvcapillary number, k eff nLpc*/H2μg utppressure [Pa]
Ngvgravity number, Δρg k eff L/Hμg utpc*characteristic capillary pressure [Pa]
Δρdensity difference between CO2 and brine [kg/m3]uDarcy velocity [m/s]
μviscosity [cp]θcontact angle, 0°
φporosityτheterogeneity parameter
σCO2–brine interfacial tension [N/m] or standard deviation
ΔPpressure difference between the average inlet and the outlet slice values

References

  1. The Intergovernmental Panel on Climate Change (IPCC). IPCC Special Report on Carbon Dioxide Capture and Storage; Metz, B., Davidson, O., de Coninck, H.C., Loos, M., Meyer, L.A., Eds.; Cambridge University Press: Cambridge, UK; New York, NY, USA, 2005. [Google Scholar]
  2. Ide, S.T.; Jessen, K.; Orr, F.M., Jr. Storage of CO2 in saline aquifers: Effects of gravity, viscous, and capillary forces on amount and timing of trapping. J. Greenh. Gas Control. 2007, 1, 481–491. [Google Scholar]
  3. Kopp, A.; Class, H.; Helmig, R. Investigations on CO2 storage capacity in saline aquifers—Part 1: Dimensional analysis of flow processes and reservoir characteristics. Int. J. Greenh. Gas Control 2009, 3, 263–276. [Google Scholar] [CrossRef]
  4. Bryant, S.L.; Lakshiminarasimhan, S.; Pope, G.A. Buoyancy-dominated multiphase flow and its impact on geological sequestration of CO2. In Proceedings of the SPE/DOE Symposium on Improved Oil Recovery, Tulsa, OK, USA, 22–26 April 2006. [Google Scholar]
  5. Juanes, R.; Spiteri, E.J.; Orr, F.M., Jr.; Blunt, M.J. Impact of relative permeability hysteresis on geological CO2 storage. Water Resour Res. 2006, 42, W12418. [Google Scholar] [CrossRef]
  6. Flett, M.; Gurton, R.; Weir, G. Heterogeneous saline formations for carbon dioxide disposal: Impact of varying heterogeneity on containment and trapping. J. Pet. Sci. Eng. 2007, 57, 106–118. [Google Scholar] [CrossRef]
  7. Han, W.S.; Kim, K.Y.; Esser, R.P.; Park, E.; McPherson, B.J. Sensitivity Study of Simulation Parameters Controlling CO2 Trapping Mechanisms in Saline Formations. Transp. Porous Med. 2011, 90, 807–829. [Google Scholar] [CrossRef]
  8. Krause, M.H.; Perrin, J.C.; Benson, S.M. Modeling Permeability Distributions in a Sandstone Core for History Matching Coreflood Experiments. SPE J. 2011, 16, 768–777. [Google Scholar] [CrossRef]
  9. Kuo, C.W.; Perrin, J.C.; Benson, S.M. Effect of gravity, flow Rate, and small scale heterogeneity on multiphase flow of CO2 and brine. In Proceedings of the SPE Western Regional Meeting, Anaheim, CA, USA, 27–29 May 2010. [Google Scholar]
  10. Shi, J.Q.; Xue, Z.; Durucan, S. Supercritical CO2 core flooding and imbibition in Tako sandstone—Influence of sub-core scale heterogeneity. Int. J. Greenh. Gas Control 2011, 5, 75–87. [Google Scholar] [CrossRef]
  11. Kuo, C.W.; Benson, S.M. Analytical Study of Effects of Flow Rate, Capillarity, and Gravity on CO2/Brine Multiphase-Flow System in Horizontal Corefloods. SPE J. 2013, 18, 708–720. [Google Scholar] [CrossRef]
  12. Muskat, M. The Flow of Homogeneous Fluids through Porous Media; McGraw-Hill Book Company: New York, NY, USA; London, UK, 1937. [Google Scholar]
  13. Morse, R.A.; Terwilliger, P.K.; Yuster, S.T. Relative permeability measurements on small core samples. Oil Gas J. 1947, 46, 109–125. [Google Scholar]
  14. Osoba, J.S.; Richardson, J.G.; Kerver, J.K.; Hafford, J.A.; Blair, P.M. Laboratory measurements of relative permeability. J. Pet. Technol. 1951, 3, 47–56. [Google Scholar] [CrossRef]
  15. Abaci, S.; Edwards, J.S.; Whittaker, B.N. Relative permeability measurements for two phase flow in unconsolidated sands. Mine Water Environ. 1992, 11, 11–16. [Google Scholar] [CrossRef]
  16. Perrin, J.C.; Benson, S. An experimental study on the influence of sub-core scale heterogeneities on CO2 distribution in reservoir rocks. Transp. Porous Media 2010, 82, 93–109. [Google Scholar] [CrossRef]
  17. Krevor, S.C.M.; Pini, R.; Li, B.; Benson, S.M. Capillary heterogeneity trapping of CO2 in a sandstone rock at reservoir conditions. Geophys. Res. Lett. 2011, 38, L15401. [Google Scholar] [CrossRef]
  18. Welge, H.J. A simplified method for computing oil recovery by gas or water drive. Trans. AIME 1952, 195, 91–98. [Google Scholar] [CrossRef]
  19. Johnson, E.F.; Bossler, D.P.; Naumann, V.O. Calculation of relative permeability from displacement experiments. Trans. AIME 1959, 216, 370–372. [Google Scholar] [CrossRef]
  20. Bennion, D.B.; Bachu, S. Dependence on temperature, pressure, and salinity of the IFT and relative permeability displacement characteristics of CO2 injected in deep saline aquifers. In Proceedings of the SPE Annual Technical Conference and Exhibition, San Antonio, TX, USA, 24–27 September 2006. [Google Scholar]
  21. Chalbaud, C.A.; Lombard, J.M.N.; Martin, F.; Robin, M.; Bertin, H.J.; Egermann, P. Two Phase Flow Properties of Brine-CO2 Systems in a Carbonate Core: Influence of Wettability on P c and k r. In Proceedings of the SPE/EAGE Reservoir Characterization and Simulation Conference, Abu Dhabi, UAE, 28–31 October 2007. [Google Scholar]
  22. Avraam, D.G.; Payatakes, A.C. Generalized relative permeability coefficients during steady-state two-phase flow in porous media, and correlation with the flow mechanisms. Transp. Porous Media 1995, 20, 135–168. [Google Scholar] [CrossRef]
  23. Bennion, B.; Bachu, S. Relative Permeability Characteristics for Supercritical CO2 Displacing Water in a Variety of Potential Sequestration Zones. In Proceedings of the SPE Annual Technical Conference and Exhibition, Dallas, TX, USA, 9–12 October 2005. [Google Scholar]
  24. Bennion, D.B.; Bachu, S. The impact of interfacial tension and pore size distribution/capillary pressure character on CO2 relative permeability at reservoir conditions in CO2-Brine systems. In Proceedings of the SPE/DOE Symposium on Improved Oil Recovery, Tulsa, OK, USA, 22–26 April 2006. [Google Scholar]
  25. Bennion, D.B.; Bachu, S. Permeability and relative permeability measurements at reservoir conditions for CO2-Water systems in ultra low permeability confining caprocks. In Proceedings of the EUROPEC/EAGE Conference and Exhibition, London, UK, 11–14 June 2007. [Google Scholar]
  26. Bennion, B.; Bachu, S. Drainage and imbibition relative permeability relations for supercritical CO2/brine and H2S/brine systems in intergranular sandstone, carbonate, shale, and anhydrite rocks. SPE Reserv. Eval. Eng. 2008, 11, 487–496. [Google Scholar] [CrossRef]
  27. Bennion, D.B.; Bachu, S. Drainage and imbibition CO2/Brine relative permeability curves at reservoir conditions for high-permeability carbonate rocks. In Proceedings of the SPE Annual Technical Conference and Exhibition, Florence, Italy, 19–22 September 2010. [Google Scholar]
  28. Bachu, S.; Bennion, B. Effects of in-situ conditions on relative permeability characteristics of CO2–brine systems. Environ. Geol. 2007, 54, 1707–1722. [Google Scholar] [CrossRef]
  29. Akbarabadi, M.; Piri, M. Relative permeability hysteresis and capillary trapping characteristics of supercritical CO2/brine systems: An experimental study at reservoir conditions. Adv. Water Resour. 2013, 52, 190–206. [Google Scholar] [CrossRef]
  30. Krevor, S.C.M.; Pini, R.; Zuo, L.; Benson, S.M. Relative permeability and trapping of CO2 and water in sandstone rocks at reservoir conditions. Water Resour. Res. 2012, 48, W02532. [Google Scholar] [CrossRef]
  31. Müller, N. Supercritical CO2-brine relative permeability experiments in Reservoir Rocks—Literature Review and Recommendations. Transp. Porous Med. 2011, 87, 367–383. [Google Scholar] [CrossRef]
  32. Benson, S.; Pini, R.; Reynolds, C.; Krevor, S. Relative Permeability Analysis to Describe Multi-Phase Flow in CO2 Storage Reservoirs; Global CCS Institute Targeted Report No. 2; Global CCS Institute: Melbourne, Australia, 2013. [Google Scholar]
  33. Benson, S.M.; Hingerl, F.; Zuo, L.; Krevor, S.; Pini, R.; Reynolds, C.; Niu, B.; Calvo, R.; Niemi, A. Relative Permeability for Multi-Phase Flow in CO2 Storage Reservoirs: Part II. Resolving Fundamental Issues and Resolving Data Gaps. Global CCS Institute Targeted Report; Stanford University: Stanford, CA, USA, 2015. [Google Scholar]
  34. Leverett, M.C. Capillary behavior in porous solids. Trans. AIME 1941, 142, 152–169. [Google Scholar] [CrossRef]
  35. Caudle, B.H.; Slobod, R.L.; Brownscombe, E.R. Further developments in the laboratory determination of relative permeability. Trans. AIME 1951, 192, 145–150. [Google Scholar] [CrossRef]
  36. Kyte, J.R.; Rapoport, L.A. Linear waterflood behavior and end effects in water-wet porous media. Trans. AIME 1958, 213, 423–426. [Google Scholar] [CrossRef]
  37. Henderson, G.D.; Danesh, A.; Tehrani, D.H.; Peden, J.M. The effect of velocity and interfacial tension on relative permeability of gas condensate fluids in the wellbore region. J. Pet. Sci. Eng. 1997, 17, 265–273. [Google Scholar] [CrossRef]
  38. Sandberg, C.R.; Gournay, L.S.; Sippel, R.F. The effect of fluid-flow rate and viscosity on laboratory determinations of oil-water relative permeabilities. Trans. AIME 1958, 213, 36–43. [Google Scholar] [CrossRef]
  39. Fulcher, R.A.; Ertekin, T.; Stahl, C.D. Effect of capillary number and its constituents on two-phase relative permeability curves. J. Petrol. Technol. 1985, 37, 249–260. [Google Scholar] [CrossRef]
  40. Henderson, J.H.; Yuster, S.T. Studies in relative permeability. World Oil 1948, 3, 139–144. [Google Scholar]
  41. Skauge, A.; Hydro, N.; Poulsen, S. Rate effects on centrifuge drainage relative permeability. In Proceedings of the SPE Annual Technical Conference and Exhibition, Dallas, TX, USA, 1–4 October 2000. [Google Scholar]
  42. Virnovsky, G.A.; Friis, H.A.; Lohne, A. A steady-state upscaling approach for immiscible two-phase flow. Transp. Porous Media 2004, 54, 167–192. [Google Scholar] [CrossRef]
  43. Ringrose, P.S.; Sorbie, K.S.; Corbett, P.W.M.; Jensen, J.L. Immiscible flow behavior in laminated and cross-bedded sandstones. J. Pet. Sci. Eng. 1993, 9, 103–124. [Google Scholar] [CrossRef]
  44. Honarpour, M.M.; Cullick, A.S.; Saad, N.; Humphreys, N.V. Effect of Rock Heterogeneity on Relative Permeability: Implications for Scale-up. J. Pet. Technol. 1995, 47, 980–986. [Google Scholar] [CrossRef]
  45. Dale, M.; Ekrann, S.; Mykkeltveit, J.; Virnovsky, G. Effective relative permeability and capillary pressure for one-dimensional heterogeneous media. Transp. Porous Media 1997, 26, 229–260. [Google Scholar] [CrossRef]
  46. Pickup, G.E.; Stephen, K.D. An assessment of steady-state scale-up for small-scale geological models. Pet. Geosci. 2000, 6, 203–210. [Google Scholar] [CrossRef]
  47. Pickup, G.; Ringrose, P.S.; Sharif, A. Steady-state upscaling: From lamina-scale to full-field model. SPE J. 2000, 5, 208–217. [Google Scholar] [CrossRef]
  48. Lohne, A.; Virnovsky, G.A.; Durlofsky, L.J. Two-stage upscaling of two-phase flow: From core to simulation scale. SPE J. 2006, 11, 304–316. [Google Scholar] [CrossRef]
  49. Jonoud, S.; Jackson, M.D. New criteria for the validity of steady-state upscaling. Transp. Porous Media 2008, 71, 53–73. [Google Scholar] [CrossRef]
  50. Skauge, A.; Haskjold, G.; Thorsen, T.; Aarra, M. Accuracy of gas-oil relative permeability from two-phase flow experiments. Soc. Core Anal. 1997, 9707. Available online: http://www.jgmaas.com/SCA/1997/SCA1997-07.pdf (accessed on 4 February 2021).
  51. Chang, Y.B.; Lim, M.T.; Pope, G.A.; Sepehrnoori, K. CO2 flow patterns under multiphase flow: Heterogeneous field-scale conditions. SPE Reserv. Eng. 1994, 9, 208–216. [Google Scholar] [CrossRef]
  52. Rossen, W.R.; van Duijn, C.J. Gravity segregation in steady-state horizontal flow in homogeneous reservoirs. J. Pet. Sci. Eng. 2004, 43, 99–111. [Google Scholar] [CrossRef] [Green Version]
  53. Hesse, M.A.; Orr, F.M., Jr.; Tchelepi, H.A. Gravity currents with residual trapping. J. Fluid Mech. 2008, 611, 35–60. [Google Scholar] [CrossRef]
  54. Cinar, Y.; Jessen, K.; Berenblyum, R.; Juanes, R.; Orr, F.M., Jr. An experimental and numerical investigation of crossflow effects in two-phase displacements. SPE J. 2006, 11, 216–226. [Google Scholar] [CrossRef] [Green Version]
  55. Hamon, G.; Roy, C. Influence of heterogeneity, wettability and coreflood design on relative permeability curves. In Proceedings of the 2000 International Symposium of the Society of Core Analysts, Dallas, TX, USA, 4–7 June 2000. [Google Scholar]
  56. Ataie-Ashtiani, B.; Hassanizadeh, S.M.; Celia, M.A. Effects of heterogeneities on capillary pressure-saturation-relative permeability relationships. J. Contam. Hydrol. 2002, 56, 175–192. [Google Scholar] [CrossRef]
  57. Chaouche, M.; Rakotomalala, N.; Salin, D.; Xu, B.; Yortsos, Y.C. Capillary effects in drainage in heterogeneous porous media: Continuum modelling, experiments and pore network simulations. Chem. Eng. Sci. 1994, 49, 2447–2466. [Google Scholar] [CrossRef]
  58. Oloruntobi, O.S.; LaForce, T. Effect of aquifer heterogeneity on CO2 sequestration. In Proceedings of the EUROPEC/EAGE Conference and Exhibition, Amsterdam, The Netherlands, 8–11 June 2009. [Google Scholar]
  59. Jackson, S.J.; Agada, S.; Reynolds, C.A.; Krevor, S. Characterizing drainage multiphase flow in heterogeneous sandstones. Water Resour. Res. 2018, 54, 3139–3161. [Google Scholar] [CrossRef]
  60. Kuo, C.W.; Benson, S.M. Numerical and Analytical Study of Effects of Small Scale Heterogeneity on CO2/Brine Multiphase Flow System in Horizontal Corefloods. Adv. Water Resour. 2015, 79, 1–17. [Google Scholar] [CrossRef]
  61. Li, B.; Benson, S.M. Influence of small-scale heterogeneity on upward CO2 plume migration in storage aquifers. Adv. Water Resour. 2015, 83, 389–404. [Google Scholar] [CrossRef]
  62. Pini, R.; Krevor, S.C.M.; Benson, S.M. Capillary pressure and heterogeneity for the CO2/water system in sandstone rocks at reservoir conditions. Adv. Water Resour. 2012, 38, 48–59. [Google Scholar] [CrossRef]
  63. Rabinovich, A.; Darkwah, E.A.; Mishra, A.M. Determining characteristic relative permeability from coreflooding experiments: A simplified model approach. Water Resour. Res. 2019, 55, 8666–8690. [Google Scholar] [CrossRef]
  64. Pruess, K.; Oldenburg, C.; Moridis, G. TOUGH2 User’s Guide V.2.0; Lawrence Berkeley National Laboratory Report LBNL-43134: Berkeley, CA, USA, 1999.
  65. Pruess, K. ECO2N: A TOUGH2 Fluid Property Module for Mixtures of Water, NaCl, and CO2; Lawrence Berkeley National Laboratory Report LBNL-57952: Berkeley, CA, USA, 2005.
  66. Perrin, J.C.; Krause, M.; Kuo, C.W.; Miljkovic, L.; Charob, E.; Benson, S.M. Core-scale experimental study of relative permeability properties of CO2 and brine in reservoir rocks. Energy Procedia 2009, 1, 3515–3522. [Google Scholar] [CrossRef] [Green Version]
  67. Benson, S.M.; Perrin, J.-C.; Krause, M.; Kuo, C.-W.; Miljkovic, L. Experimental Investigations of Multiphase Flow and Trapping in Saline Aquifer—Annual Report 2007; Stanford University: Stanford, CA, USA, 2008. [Google Scholar]
  68. Geffen, T.M.; Owens, W.W.; Parrish, D.R.; Morse, R.D. Experimental investigation of factors affecting laboratory relative permeability measurements. Trans. AIME 1951, 192, 99–110. [Google Scholar] [CrossRef]
  69. Huppler, J.D. Numerical Investigation of the Effects of Core Heterogeneities on Waterflood Relative Permeabilities. SPE J. 1970, 10, 381–392. [Google Scholar] [CrossRef]
  70. Rabinovich, A. Analytical Corrections to Core Relative Permeability for Low-Flow-Rate Simulation. SPE J. 2018, 23, 1851–1865. [Google Scholar] [CrossRef]
  71. Corey, A.T.; Rathjens, C.H. Effect of stratification on relative permeability. J. Pet. Technol. 1956, 8, 69–71. [Google Scholar] [CrossRef] [Green Version]
  72. Honarpour, M.M.; Cullick, A.S.; Saad, N. Influence of Small-Scale Rock Laminations on Core Plug Oil/Water Relative Permeability and Capillary Pressure. In Proceedings of the University of Tulsa Centennial Petroleum Engineering Symposium, Tulsa, OK, USA, 29–31 August 1994. [Google Scholar]
Figure 1. Physical behavior of stored CO2 in saline aquifer.
Sustainability 13 02744 g001
Figure 2. 3D numerical modeling and 2D theoretical analysis for homogeneous and heterogeneous models.
Sustainability 13 02744 g002
Figure 3. Average CO2 saturation as a function of gravity number Ngv (LHS (left hand side)) and capillary number Ncv (RHS (right hand side)) for homogeneous and high contrast models, respectively, for different Bond numbers.
Sustainability 13 02744 g003
Figure 4. Laboratory capillary pressure data. (pc*—characteristic capillary pressure [Pa]).
Sustainability 13 02744 g004
Figure 5. Capillary pressure and saturation distributions for the high contrast model at an extremely high flow rate (200 mL/min) and high flow rate (6 mL/min), respectively.
Sustainability 13 02744 g005
Figure 6. Overview of technical approach.
Sustainability 13 02744 g006
Figure 7. The experimental steady-state three-dimensional views of CO2 saturation in the core for a given fractional flow of CO2 at a given flow rate. The fluids were injected from right to left [16].
Sustainability 13 02744 g007
Figure 8. Simulation core of 25 × 25 × 31 grid blocks of uniform size.
Sustainability 13 02744 g008
Figure 9. CO2 saturation along the Berea Sandstone core for different fractional flows of CO2 at a total injection flow rate 2.6 mL/min: (a) experimental results [67]; (b) high contrast model with boundary condition Pc = 0; and (c) high contrast model with boundary condition dPc/dx = 0.
Sustainability 13 02744 g009
Figure 10. CO2 saturation distribution at steady state for 95% fractional flow of CO2 at a total injection flow rate 1.2 mL/min.
Sustainability 13 02744 g010
Figure 11. Flow rate effect on CO2 saturation along the homogeneous core at a 95% fractional flow of CO2 with flow rates ranging from 0.1 mL/min to 6 mL/min.
Sustainability 13 02744 g011
Figure 12. Relative permeability calculated by the same pressure drop (ΔPw = ΔPCO2) for the homogeneous core with 430 md permeability at different flow rates.
Sustainability 13 02744 g012
Figure 13. The effect of heterogeneity on CO2 saturation along the core at a fractional flow of 95% over a wide range of flow rates.
Sustainability 13 02744 g013
Figure 14. Relative permeability calculated by the same pressure drop (ΔPw = ΔPCO2) for the high contrast model (σlnk’ = 0.96) with 318 md permeability at different flow rates; (RHS) the same relative permeability curves at log scale.
Sustainability 13 02744 g014
Figure 15. Flow rate effect on relative permeability calculated by the true pressure drops ( Δ P w = Δ P CO 2 Δ P c ) for the homogeneous and heterogeneous core at various flow rates.
Sustainability 13 02744 g015
Figure 16. The experimental data and relative permeability calculated by the corrected pressure drops for high contrast models at various flow rates; (RHS) the same relative permeability curves at log scale.
Sustainability 13 02744 g016
Figure 17. Relative permeability calculated by the true pressure drops for five different heterogeneous cores in the viscous-dominated regimes: homogeneous and the Random 2 cores, Kozeny–Carman models, high contrast models, the Random 3 cores, and the input relative permeability curves.
Sustainability 13 02744 g017
Figure 18. (LHS) Brine displacement efficiencies for three different lengths of homogeneous core with capillary number ranging from 10 to 107; (RHS) relative permeability calculated by the true pressure drops for homogeneous cores at 0.1 mL/min flow rates.
Sustainability 13 02744 g018
Figure 19. (LHS) Average CO2 saturation as a function of capillary number Ncv for the homogeneous and high contrast models with three different values of interfacial tensions; (RHS) interfacial tension effects on relative permeability calculated in the true pressure drops for heterogeneous core (high contrast model) at 6 mL/min flow rates.
Sustainability 13 02744 g019
Figure 20. Average CO2 saturation as a function of capillary number Ncv for the homogeneous, Kozeny–Carman (KC) (small heterogeneity), and high contrast (HC) (large heterogeneity) models with and without gravity (1G/0G).
Sustainability 13 02744 g020
Figure 21. Average CO2 saturation as a function of capillary number Ncv for homogeneous and different heterogeneous models.
Sustainability 13 02744 g021
Table 1. Synthetic input parameters for every grid in the simulations for three different models.
σlnk’PorosityPermeability (md)Capillary Pressure (Pa)Input Relative Permeability
Homogeneous Model0φi = φmean Sustainability 13 02744 i001ki = kmean Sustainability 13 02744 i002Measured Pc Curvepower-law functions
Kozeny–Carman Model0.27φi
Sustainability 13 02744 i003
k i φi3/(1 − φi)2 Sustainability 13 02744 i004 P c , i   φ i / k i power-law functions
High Contrast Model0.96φi
Sustainability 13 02744 i005
k i   exp(64φi4) Sustainability 13 02744 i006 P c , i   φ i / k i power-law functions
Table 2. Summary of boundary conditions.
Inlet SliceRock Slices (29 Slices)Outlet Slice
φmean,φi,φmean,
kmean: Anisotropicki: Isotropickmean: Isotropic
(kz = ky = 100kx) P c , i   φ i / k i Dirichlet boundary condition
Pc = Pc,mean dPc/dx = 0
Table 3. Summary of different flow rates for different heterogeneous cores: homogeneous, Random 2, Kozeny–Carman (KC), high contrast (HC), and Random 3 models.
Degree of Heterogeneity
σlnk’
Injection Flow Rate
q, mL/min
qcritical, mL/minRegime
Homo00.50.24Viscous-dominated
Random 20.2540.50.25Viscous-dominated
KC0.2751.20.37Viscous-dominated
HC0.962.60.97Viscous-dominated
Random 31.4261.19Viscous-dominated
Table 4. Summary of output simulation parameters in this study.
SBL/
SBLHete
krCO2(SBL)/
krCO2(SBLHete)
qcritical [mL/min] from the Simulation Results
Homogeneous core0.3240.0554around 0.3
High contrast model0.300.0483around 1.2
Publisher’s Note: MDPI stays neutral with regard to jurisdictional claims in published maps and institutional affiliations.

