Article

International Comparison of the Efficiency of Agricultural Science, Technology, and Innovation: A Case Study of G20 Countries

1
College of Economics and Management, Northeast Agricultural University, Harbin 150030, China
2
School of Economics, Harbin Normal University, Harbin 150025, China
*
Author to whom correspondence should be addressed.
Sustainability 2021, 13(5), 2769; https://doi.org/10.3390/su13052769
Submission received: 29 January 2021 / Revised: 25 February 2021 / Accepted: 28 February 2021 / Published: 4 March 2021
(This article belongs to the Special Issue Agricultural Innovation and Sustainable Development)

Abstract

:
An efficiency-oriented innovation analysis will enhance the understanding of the operational quality related to the transformation process of limited innovation investments for improving innovation outputs. The purpose of this study was to measure the static-dynamic efficiency of agricultural science, technology, and innovation (ASTI) and identify the efficiency determinants across the Group of Twenty (G20) countries. First, the static comprehensive efficiency of ASTI was measured employing the Data Envelopment Analysis (DEA)-BCC model, and some of the binding constraints to higher efficiency were investigated. Then, we applied the DEA-Malmquist index model to calculate the efficiency change of ASTI in certain periods and decomposed the sources of efficiency change. Finally, the G20 countries were classified into four-level clusters based on the rankings of efficiency measurement and capability evaluation of ASTI to locate the type of ASTI level and identify the type change in both the efficiency and capability. The empirical results indicate the following. (1) The efficiency range of the G20 developing countries was relatively larger than the G20 developed countries. The G20 developed countries showed a fluctuating downward trend, while the G20 developing countries showed an upward trend from the perspective of efficient proportion. The R&D expenditure redundancy and the agricultural journal papers deficiency were the main binding constraints to the higher efficiency of ASTI. (2) The total factor productivity change (TFPC) of ASTI showed an alternating trend of “decline–growth–continuous decline–growth recovery”, where the G20 developed countries experienced “growth–decline–growth” and the G20 developing countries underwent a fluctuating upward trend. The TFPC of ASTI in most G20 countries was primarily due to technological change. (3) The G20 developed countries usually had advantages in capacity, while the G20 developing countries performed better in efficiency.

1. Introduction

The challenge of sustainable agriculture development in light of population growth, resource shortage, ecological deterioration, and climate change has led many governments to support agricultural science, technology, and innovation (ASTI). The investment of the United States government in agricultural research projects reached 3.03 billion dollars in 2018, 130 million dollars more than in 2017 [1]. The European Union has invested 10 billion euros in ASTI activities such as agriculture and forestry ecosystem restoration for the “Rural Development Project (2014–2020)” [2]. The UK adopted the “UK agricultural science and technology strategy” in 2013. In 2014, Germany’s agricultural research funds reached 10% of the budget of the Federal Ministry of Food and Agriculture [3]. China issued the “Agricultural Science and Technology Development Plan (2006–2020)” [4] and “the National Agricultural Science, Technology and Innovation Capacity Building Plan (2012–2016)” [5].
However, the innovation performance is dependent not only on the available innovation resources but also and maybe most importantly on their efficient and productive use [6]. Innovation efficiency, which is “the ability to translate inputs into innovation outputs” by definition, has become very important and attractive to scholars and governments [7,8]. Because of the unique advantages in the efficiency evaluation of multi-input and multi-output [9], the Data Envelopment Analysis (DEA) has been widely used to measure the relative efficiency of Decision-Making Units (DMUs) by estimating the ratio of outputs to inputs [10,11,12]. Many studies investigated innovation efficiency at the national [13,14,15], regional [10,16,17], and institutional levels [18,19,20] by means of DEA. Several studies have been conducted to measure the efficiency of ASTI [21,22,23,24,25,26,27]. Most of these studies assess a particular nation [21,22,27] or a region [24,25,26], and very few studies attempt cross country comparisons for ASTI efficiency [23]. Moreover, the integration of static and dynamic ASTI efficiency analyses has been usually disregarded.
The limited attention to innovation efficiency at the national level could be a potentially significant omission from a policy-oriented perspective [28,29], since measuring the ASTI efficiency helps to both identify the best innovation practitioners for benchmarking and propose ways to improve efficiency by pinpointing areas of weakness [15]. The G20 countries account for 60% of global arable land and 80% of global agricultural trade [30]. Therefore, “G20 agriculture” has a significant effect on global agriculture development. In this context, this paper aims to address this gap by estimating the static-dynamic efficiency of ASTI for the G20 countries at the national level.
This paper proceeds as follows. Section 2 presents the DEA-BCC model and the DEA-Malmquist index model, as well as the input–output indicators and data sources. Section 3 shows the empirical results, including the static comprehensive efficiency and dynamic total factor productivity. In addition, we further classify the ASTI level of G20 countries through the results of efficiency measurement and capability evaluation. Section 4 is reserved for conclusions and implications.

2. Methodology

2.1. Definition of Efficiency of ASTI

According to Schumpeter’s innovation theory, innovation is not only a technology and scientific research activity but also an economic activity [31]. In this paper, ASTI is defined as a complex innovation process in which a series of innovative actors transform input (personnel and expenditure) into output (new knowledge, new varieties, or new technologies) through cooperation and interaction to obtain economic benefits. Therefore, the efficiency of ASTI is the ability of transforming input into output in the above complex innovation process. The innovation efficiency reflects the effectiveness of innovation process from input to output. The maximum efficiency of ASTI is mainly reflected in the maximum innovation output at the given innovation input.

2.2. Data Envelopment Analysis

DEA is a non-parametric method proposed by Farrell [32] and developed by Charnes, Cooper, and Rhodes [33]. There are many unique advantages in the efficiency evaluation of multi-input and multi-output: First, the functional relationship between input and output indicators does not require a priori assumption [34]. Second, multi-input and multi-output are allowed to be processed simultaneously, without any input and output indicators dimensionless processing. Moreover, DEA does not need to verify in advance which input and output indicators are the most important in efficiency evaluation [35].
The CCR model and the BCC model are two basic DEA models. Both models are named after the author’s initials. In 1978, Charnes, Cooper, and Rhodes created the first DEA model, which was named the CCR model [33]. Similarly, in 1984, Banker, Charnes, and Cooper proposed a new DEA model, which was named the BCC model [36]. The difference between BCC model and CCR model lies in the assumptions. The CCR model assumes that returns to scale are constant, while the BCC model assumes that returns to scale are variable. According to the efficiency measurement, the two models can be divided into input-oriented and output-oriented [37]. Input orientation emphasizes the degree to which the various input factors should be reduced to achieve technical efficiency without reducing output. In contrast, output orientation focuses on the extent to which all kinds of output should be increased for the purpose of achieving technical efficiency without increasing input. In practice, the ASTI in most countries is not in the optimal scale state, and ASTI will produce scale efficiency with the increasing input. This means that the measurement of the efficiency of ASTI meets the assumption of BCC model, that is, variable returns to scale. The fundamental purpose of increasing the input of ASTI is to expect more output, which is consistent with the output-oriented model. Therefore, we carried out the output-oriented BCC model to measure the comprehensive efficiency of ASTI in G20 countries. The linear form of the output-oriented BCC model is as follows:
B 2 C O max θ ε e ^ t   s + e t s + , s . t . j = 1 k x jl λ j + s = x l n , j = 1 k y jm λ j s + = θ y l n , j = 1 k λ j = 1 , s 0 , s + 0 , λ j 0 , j = 1 , 2 , k .
e ^ t = 1 , 1 , , 1 E m , e t = 1 , 1 , , 1 E s ; x jl represents the l th inputs of the j th DMU ; y jm represents the m th outputs of the j th DMU ; ε is the non-Archimedes infinitesimal; λ j is the weighting factor; s represents the relaxation variables; s + is the residual variable; and θ represents the relative efficiency of DMU.
If θ < 1 , DMU is inefficient.
If θ = 1 , e ^ t s + e t s + > 0 , DMU is weakly efficient.
If θ = 1 , e ^ t s + e t s + = 0 , DMU is efficient.
The BCC model can only use the cross-section data to reflect the efficiency value of DMU at a certain time statically. To show the dynamic changes of DMU   in a specific time series, we need to use the DEA-Malmquist index model [38] to calculate the total factor productivity change (TFPC). The TFPC can be decomposed into the technical efficiency change (TEC) and technological change (TC) in two periods [39]. TEC can also be decomposed into the pure efficiency change (PEC) and scale efficiency change (SEC). The model is as follows:
TFPC = m 0 x t + 1 , y t + 1 ; x t , y t
  = d 0 t x t + 1 , y t + 1 d 0 t x t , y t × d 0 t + 1 x t + 1 , y t + 1 d 0 t + 1 x t , y t 1 2
  = TEC x t + 1 , y t + 1 ; x t , y t × TC x t + 1 , y t + 1 ; x t , y t
= SEC x t + 1 , y t + 1 ; x t , y t × PEC x t + 1 , y t + 1 ; x t , y t × TC x t + 1 , y t + 1 ; x t , y t
where d 0 refers to the input and output matrix and   x t , x t + 1 represent the input vectors of the t and   t + 1 periods, respectively. The relationship between variables satisfies the following conditions: TFPC = TEC × TC ,   EC = SEC × PEC . Thus, TFPC = SEC × PEC × TC .

2.3. Indicators Selection

The discriminatory power of DEA would be decreased when many input–output indicators are introduced [40]; the principle is as follows:
d 3 m + n
where d represents the number of DMUs , m represents the number of input indicators, and n represents the number of output indicators.
Following this restriction, only a few critical indicators can be selected. In this study, the number of DMUs is 19; therefore, the total number of indicators cannot be greater than 6.
As shown in Table 1, based on previous research experience [19,20,24,26,41,42,43], the definition of efficiency of ASTI and data availability, the input and output indicators are selected as follows.
Input indicators: The innovation inputs mainly include the research and development (R&D) personnel and expenditure [9,19,20,44,45,46]. The R&D personnel served as the inputs in the brainwork for the upstream technological creation process in an innovation system, representing a basic element for the realization of the technological creation process. As a proxy for this indicator, we employ the number of agricultural researchers to measure R&D personnel [22,24,26,46]. As a supporting input, R&D expenditure is also needed, which is used to complete various R&D activities [47], including the payment of R&D employees’ wages and the purchase of R&D equipment and facilities [48]. Percentage shares of R&D expenditure in agricultural value added is used as a proxy indicator to measure R&D expenditure.
Output indicators: The output indicators could be divided into two general categories: (1) scientific and technological output; and (2) economic performance. The scientific and technological output captured the extent to which a country produced some type of scientific and technological output. The commonly accepted measures of this are the number of agricultural journal papers [9,49] and the number of agricultural patents [19,25,47]. The agricultural value added (annual percent growth) is an appropriate proxy for economic performance generated by ASTI [49].

2.4. Data Sources

The study was limited to G20 countries and covered the period between 2008 and 2017. The G20 countries include Argentina, Australia, Brazil, Canada, China, France, Germany, India, Indonesia, Italy, Japan, the Republic of Korea, Mexico, the Russian Federation, Saudi Arabia, South Africa, Turkey, the United Kingdom, and the United States (note: the European Union (EU) is a political and economic union, and its major member states are already within the G20, so the EU was not included in this empirical analysis). The specific sources of each indicator are shown in Table 2 and its notes. The descriptive statistics of the input and output indicators are shown in Table 3.
The empirical research framework of this paper is shown as Figure 1.

3. Empirical Results and Discussion

This section analyzes and discusses the efficiency results of ASTI from the static and dynamic perspective. In addition, we further classify the ASTI level of the G20 countries through the results of efficiency measurement and capability evaluation. All of the computations were performed with the help of DEAP2.1.

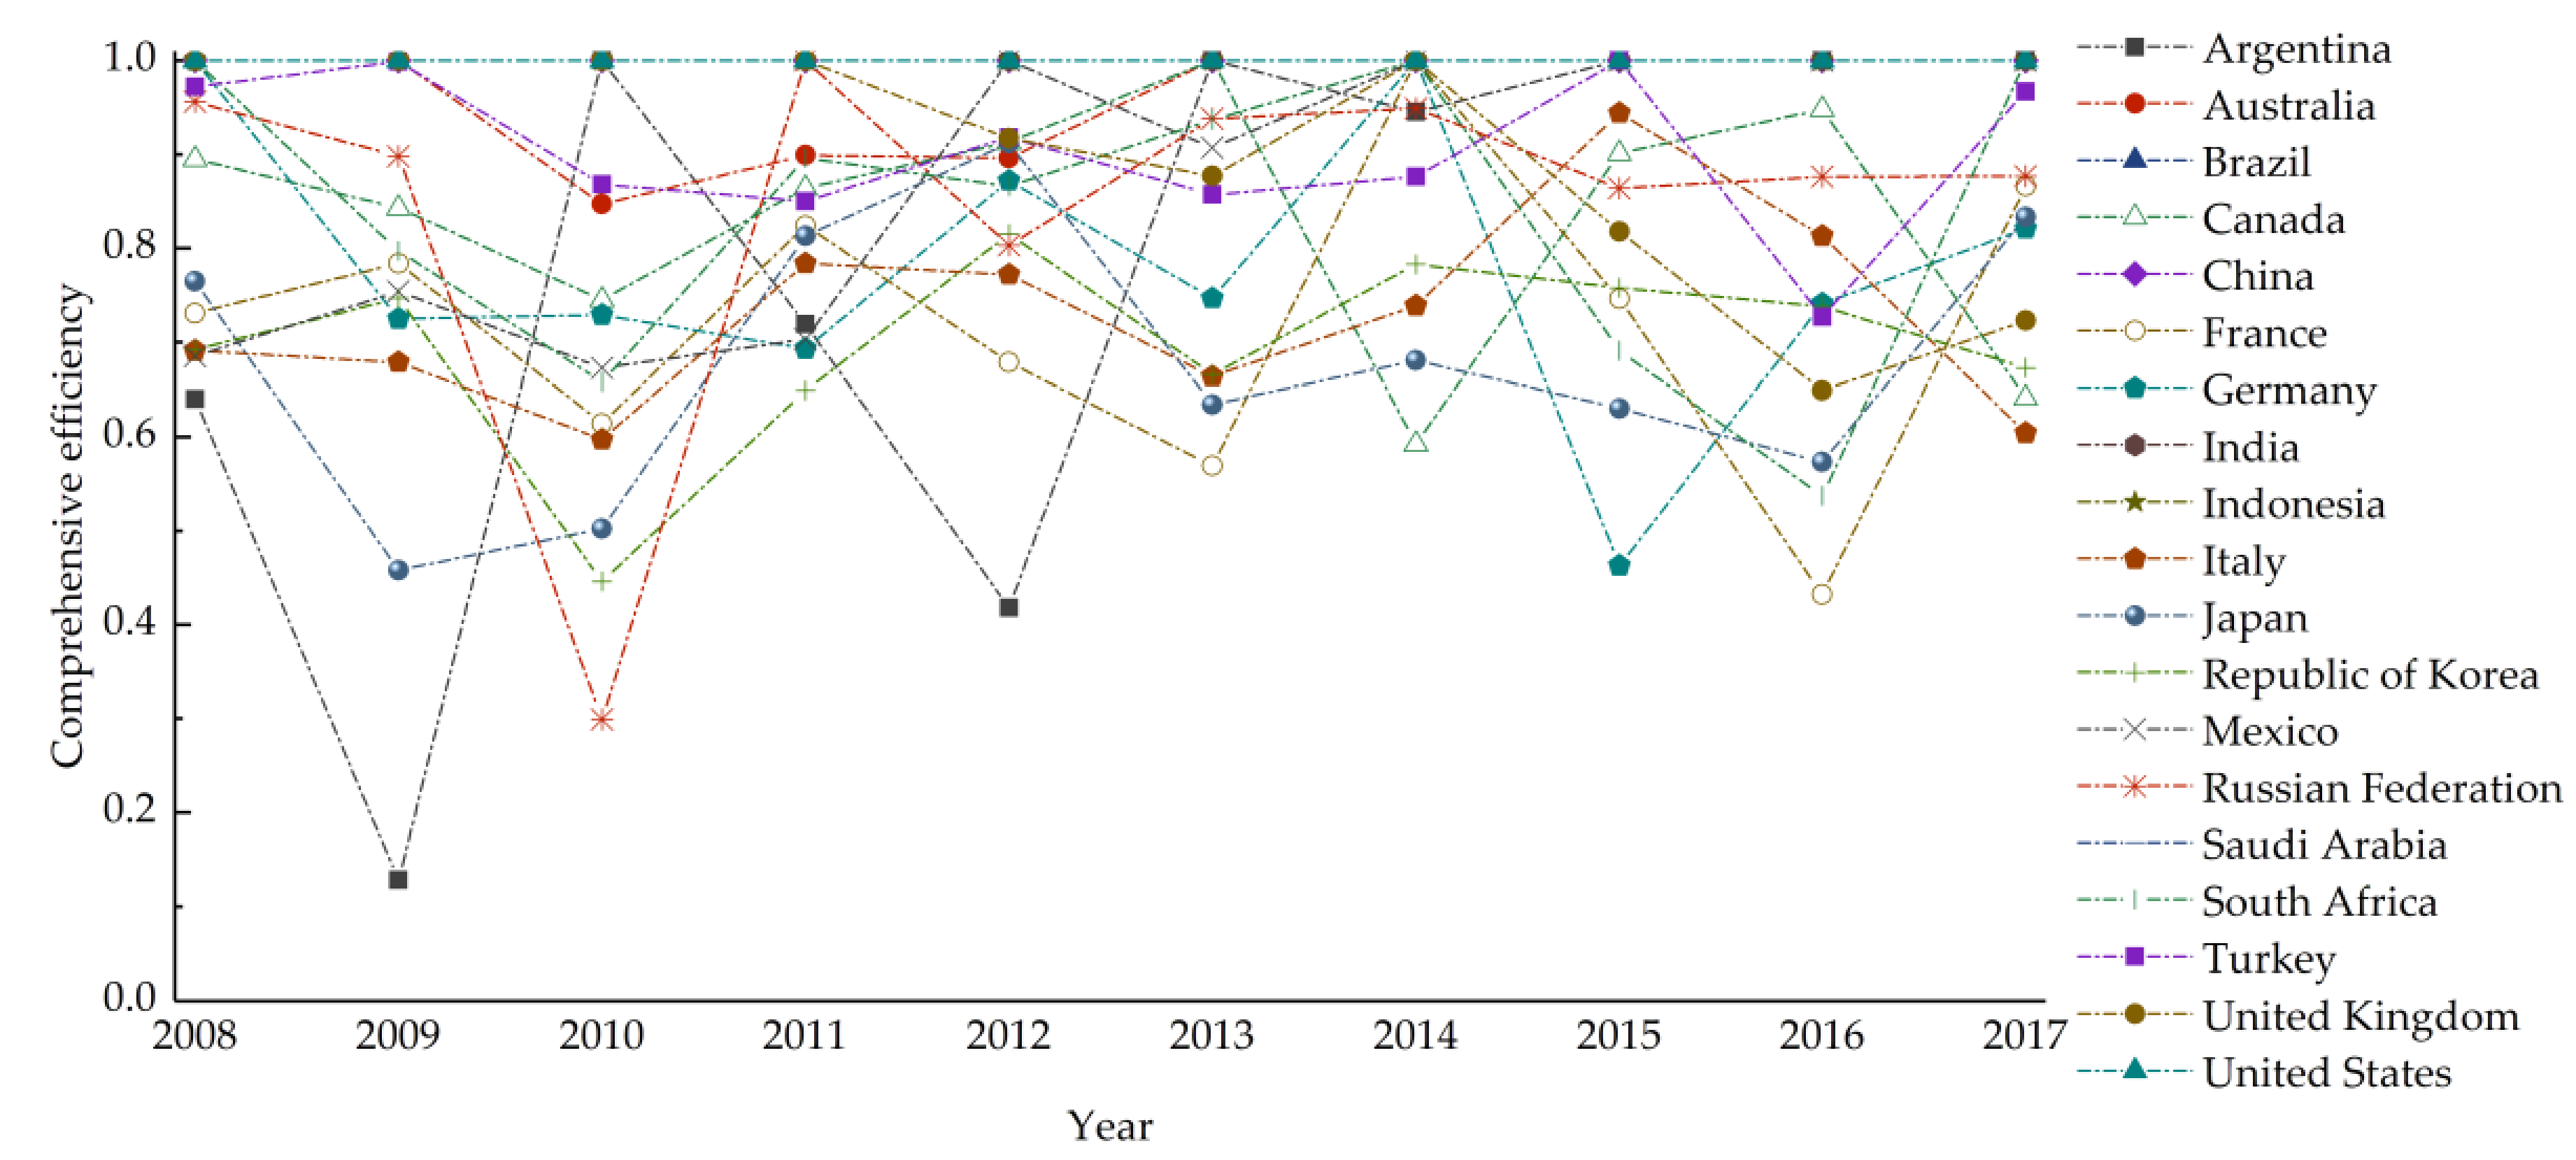
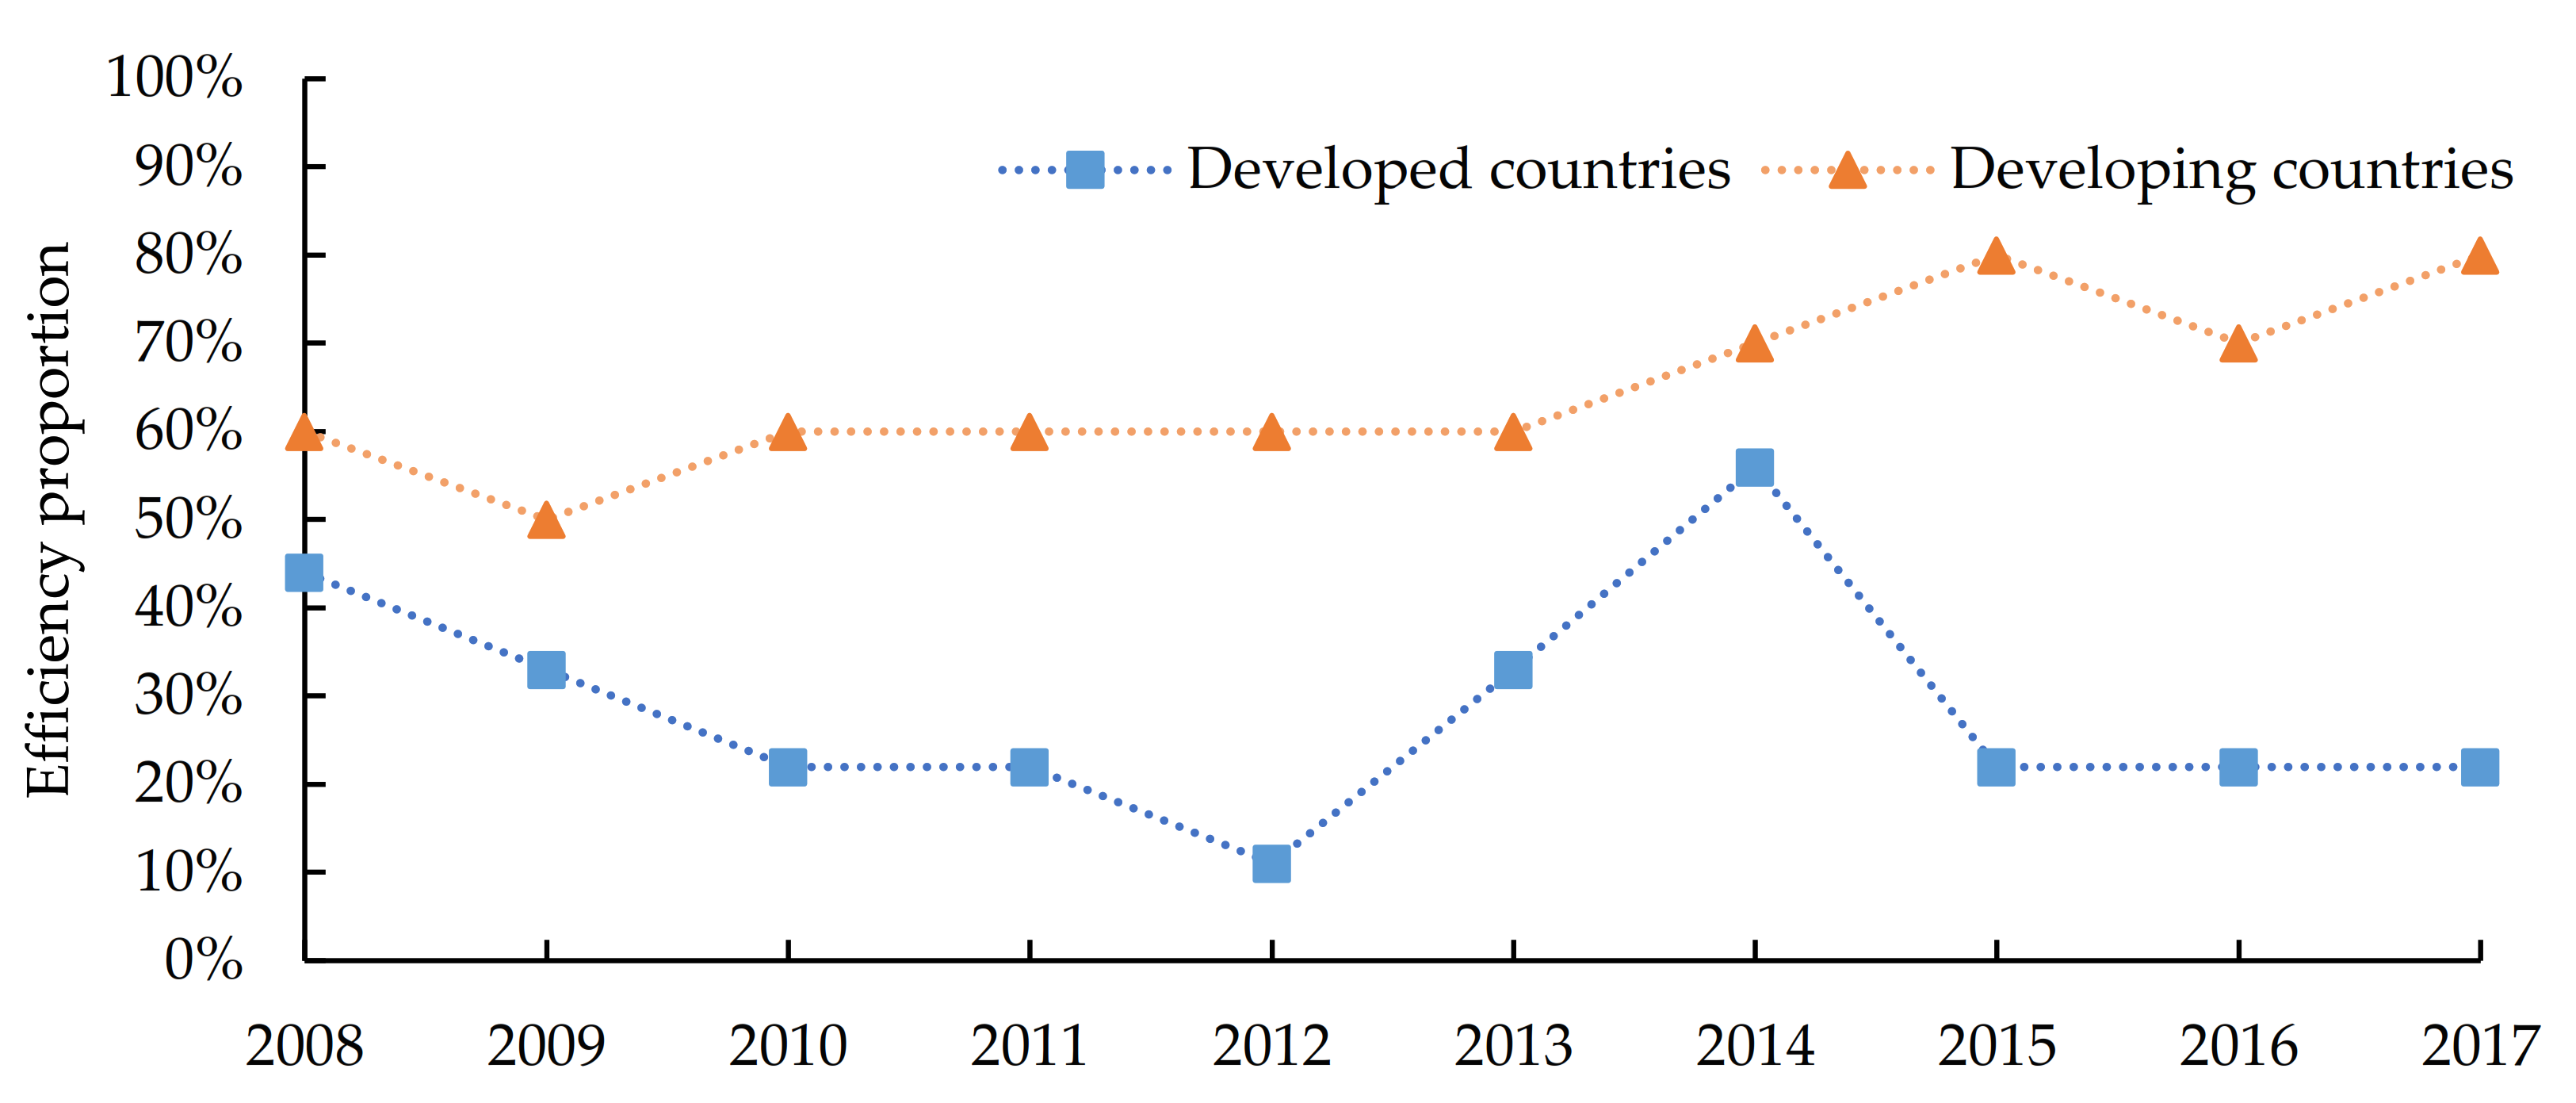
3.1. Comprehensive Efficiency Analysis of ASTI

3.1.1. Overall Analysis of the Comprehensive Efficiency of ASTI

Figure 2 shows the measurement results for the static comprehensive efficiency of ASTI in the G20 countries from 2008 to 2017. A value equal to 1 represents that the ASTI of a country is efficient, while smaller values mean it is more inefficient. Brazil, China, India, Indonesia, Saudi Arabia, and the United States were all efficient from 2008 to 2017, while Italy, Japan, and the Republic of Korea were inefficient during those 10 years. The other 10 countries (Argentina, Australia, Canada, France, Germany, Mexico, the Russian Federation, South Africa, Turkey, and the United Kingdom) changed alternately between efficiency and inefficiency. It is worth noting that the countries that have been efficient during the 10 years include both developed countries (the United States) and developing countries (Brazil, China, India, Indonesia, and Saudi Arabia). This means that innovation efficiency is dependent not only on more innovation investments. Optimized translation from inputs into outputs will lead to high innovation efficiency.
Due to the different levels of economic development and agricultural development, there are obvious differences in ASTI inputs between the G20 developed countries (Australia, Canada, France, Germany, Italy, Japan, the Republic of Korea, the United Kingdom, and the United States) and the G20 developing countries (Argentina, Brazil, China, India, Indonesia, Mexico, the Russian Federation, Saudi Arabia, South Africa, and Turkey). Figure 3 and Figure 4 describe the efficiency range and efficient proportion of ASTI in the G20 developed countries and the G20 developing countries from 2008 to 2017.
The efficiency range refers to the difference value between the maximum and minimum values of the comprehensive efficiency, which is used to reflect the balance of the comprehensive efficiency development. The efficiency range of the G20 developed countries stabilized within 0.3–0.5, with no obvious change, reaching the highest value of 0.568 in 2016. The efficiency range of the G20 developing countries was relatively large (0.1–0.9), reaching the highest value of 0.872 in 2009. The above shows that, compared with developed countries, the development of comprehensive efficiency in developing countries is unbalanced. This is because developed countries generally attach importance to ASTI, while developing countries pay more or less attention to it.
The efficient proportion represents the proportion of the number of countries that were efficient to the total number of countries, which is used to reflect the overall development level of the comprehensive efficiency. It could be seen that the G20 developed countries showed a fluctuating downward trend, with the highest proportion of 56% in 2014 and the lowest proportion of 11% in 2012. The G20 developing countries showed an upward trend, from the lowest proportion of 50% in 2009 to the highest proportion of 80% in 2015 and 2017. The reason for this result is that the investment of ASTI in developed countries has been at a high level for a long time. When the increase of inputs is lower than the increase of outputs, the efficiency will decline. However, with the emphasis on ASTI in developing countries, the output increases rapidly with the increasing input, which promotes the improvement of efficiency.

3.1.2. Input Redundancy and Output Deficiency of ASTI

If R&D resources are not used effectively, additional investment may be of little help in stimulating scientific and technological progress [29]. In this section, we analyze the input redundancy and output deficiency to investigate the binding constraints to higher efficiency. Table 4 shows the input redundancy frequency and output deficiency frequency of ASTI for 13 countries (Argentina, Australia, Canada, France, Germany, Italy, Japan, the Republic of Korea, Mexico, the Russian Federation, South Africa, Turkey, and the United Kingdom) during 2008–2017. Brazil, China, India, Indonesia, Saudi Arabia, and the United States all achieved efficiency in ASTI from 2008 to 2017, so there was no input redundancy and output deficiency. A frequency of 0 means that there is no input redundancy or output deficiency in the country during these 10 years; a frequency of 1–4 means that input redundancy or output deficiency happens occasionally; and a frequency of 5–10 means that input redundancy or output deficiency happens frequently.
There are input redundancy and output deficiency in both the G20 developed and developing countries. From the perspective of input indicators redundancy, R&D personnel redundancy occurred frequently (5–10) in Japan and the Russian Federation, while R&D expenditure redundancy occurred frequently (5–10) in Canada, France, Italy, the Republic of Korea, South Africa, and the United Kingdom. The output deficiency mainly focuses on the scientific and technological output, while the economic performance performs well. The countries with a higher frequency (5–10) of agricultural journal papers deficiency include Germany, Japan, the Republic of Korea, the Russian Federation, and Turkey. The countries with a higher frequency (5–10) of agricultural patents deficiency include Argentina, South Africa, and Turkey.
We further investigated the factors reducing the static comprehensive efficiency of the inefficient countries over the years 2008–2017. Taking 2017 as an example (see Table 5), there are nine inefficient countries: Canada, France, Germany, Italy, Japan, the Republic of Korea, the Russian Federation, Turkey, and the United Kingdom. In terms of the input redundancy, France (0.30), Germany (0.13), the Republic of Korea (0.16), the Russian Federation (0.63), and Turkey (0.09) have R&D personnel redundancy; Canada (0.21), France (0.05), Italy (0.16), the Republic of Korea (0.26), and the United Kingdom (0.06) have R&D expenditure redundancy; therefore, these countries can appropriately reduce related R&D investments. In terms of the output deficiency, Germany (0.51), Japan (3.09), the Republic of Korea (0.11), the Russian Federation (7.00), and Turkey (2.46) are deficient in agricultural journal papers; the Russian Federation (2.90) and Turkey (0.88) are deficient in agricultural patents; therefore, these countries should pay more attention to the two scientific and technological outputs. In addition, 0.00 represents no input redundancy or output deficiency, which means these inputs and outputs of the country have already been optimized.

3.2. Total Factor Productivity Analysis of ASTI

This section applies the DEA-Malmquist index model to calculate the dynamic total factor productivity change (TFPC) of ASTI for G20 countries from 2008 to 2017 and decomposes TFPC of ASTI under time dimension and spatial dimension to investigate the sources of efficiency change.

3.2.1. TFPC Decomposition of ASTI under Time Dimension

Table 6 shows the TFPC decomposition of ASTI for G20 countries at different stages. A value of less (more) than 1 represents decline (growth), and a value equal to 1 shows no change. The mean value of TFPC for G20 countries is 0.981 in the period 2008–2017, a 1.9% decline in the Total Factor Productivity (TFP). The mean value of technological change (TC) is 0.974, while the mean value of Technical Efficiency Change (TEC) is 1.008, indicating that the decline of Total Factor Productivity (TFP) of ASTI was caused by the decline of TC greater than the growth of Technical Efficiency (TE). The mean value of Pure Efficiency Change (PEC) is 1.000, that is, pure efficiency (PE) kept unchanged. Thus, a 0.8% increase in Scale Efficiency (SE) improves the TE of ASTI in G20 countries.
The TFPC of ASTI in 2008–2017 could be divided into four stages. The first stage (2008–2009) was the decline stage: the TFP of ASTI fell by 17.4%, which was caused by the decline in TE (falling by 12.9%) and TC (falling by 5.1%) simultaneously. The second stage (2009–2011) is the growth stage with a 21.7% growth from 2009 to 2010 and a 1.7% growth from 2010 to 2011. The growth of TFP of ASTI during 2009–2010 was driven by the synchronous growth of TE (increasing 6.3%) and TC (increasing 14.4%), while it was driven by TC (increasing 14.4%) during 2010–2011. The third stage (2011–2016) was the continuous decline stage: the TFP of ASTI declined by 5.5%, 6.3%, 11%, 4.2%, and 2.4%, respectively. It was mainly caused by the decline in TC. The fourth stage (2016–2017) is to resume growth. Due to the simultaneous growth of TE (increasing by 7.9%) and TC (increasing by 3.5%), the TFP of ASTI for G20 countries rose by 11.7%. The above alternating trend of “decline–growth–continuous decline–growth recovery” of TFPC decomposition indicates that the efficiency of ASTI for G20 countries was in a period of constant adjustment.
The TFPC decomposition of ASTI in G20 developed and developing countries is presented in Table 7. The G20 developed countries experienced an increment during 2009–2012, a decline during 2013–2015, and an increment again during 2015–2017. The G20 developing countries showed a fluctuating upward trend of TFPC.

3.2.2. TFPC Decomposition of ASTI under Spatial Dimension

As shown in Table 8, seven G20 countries (Saudi Arabia, Japan, China, Mexico, the Republic of Korea, the Russian Federation, and Argentina) (37%) have shown growth in TFP of ASTI (TFPC > 1) during 2008–2017. Among them, Saudi Arabia, Japan, and China saw the larger growth, with increases of 11.4%, 7.5%, and 6.6% respectively; Mexico and the Republic of Korea saw growth of 3.9% and 2.8%, respectively; and the Russian Federation and Argentina saw smaller growth, with increases of 0.6% and 0.4% respectively. The TFP of ASTI for 12 countries (Australia, Turkey, the United States, South Africa, France, Indonesia, India, Italy, Germany, Brazil, the United Kingdom, and Canada) (63%) declined from 2008 to 2017 (TFPC < 1). Australia, Turkey, the United States, South Africa, and Indonesia fell 0–5%; India, Italy, Germany, and Brazil fell 5–10%; and the United Kingdom and Canada fell by more than 10%.
The influencing factors of TFPC of ASTI were identified, as shown in Table 9 and Table 10. As shown in Table 8, the growth for China and Saudi Arabia in TFP of ASTI was due to the improvement in TC (TC > 1, TEC ≤ 1). The growth for Japan, Mexico, the Republic of Korea, the Russian Federation, and Argentina was attributed to the improvement in TE (TEC > 1, TC ≤ 1), where two countries (the Republic of Korea and the Russian Federation) were driven by SE (SEC > 1) only and three countries (Japan, Mexico, and Argentina) by the synchronous improvements of SE and PE (SEC > 1, PEC > 1).
The sources for decline of TFP of ASTI is shown in Table 10. Eight countries (Australia, Turkey, the United States, France, Indonesia, India, Italy, and Brazil) were because of the decrease in TC (TC < 1, TEC ≥ 1), while four countries (South Africa, Germany, the United Kingdom, and Canada) were attributed to the synchronous decrease in TE and TC (TC < 1, TEC < 1). Among them, the source for decline in South Africa is SE (SEC < 1), Germany is PE (PEC < 1), and the United Kingdom and Canada showed declines due to the decrease of SE and PE (PEC < 1, SEC < 1).

3.3. Classification and Change Analysis of National ASTI level

The innovation efficiency and innovation capability are two important aspects of national ASTI level [50,51]. The efficiency of ASTI focuses on the relationship of transformation from input to output, that is, whether more output can be obtained under the given input or less input can be invested under the given output. The capability of ASTI is a comprehensive performance from the joint influence of input and output [46]. The efficiency of ASTI concentrates on innovation quality, while the capability of ASTI focuses on innovation quantity. This study integrated the analysis of the efficiency and capability of ASTI to locate the type of ASTI level and identify the type change for each G20 country, from both the innovation “quality” and “quantity” aspects.
According to the rankings of efficiency measurement of ASTI, countries ranked 1–10 are called “efficiency superior” and countries ranked 11–19 are called “efficiency inferior”. Similarly, based on to the rankings of capability evaluation of ASTI for G20 countries, countries ranked 1–10 are called “capability superior “ and countries ranked 11–19 are called “capability inferior “. Combining the rankings of the efficiency and capability of ASTI, the ASTI level of G20 countries is divided into four categories: “double superior type” (“efficiency superior” and “capability superior”), “efficiency single-superior type” (“efficiency superior” and “capability inferior”), “capability single-superior type” (“efficiency inferior” and “capability superior”), and “double inferior type” (“efficiency inferior” and “capability inferior”).
This study used the evaluation system and calculation model, which were referred from Wang’s methodology [46], to evaluate the capabilities of ASTI for G20 countries. For the details of the efficiency measurement, please refer to Figure 2.
As shown in Figure 5, in 2017, Australia, China, and the United States with outstanding efficiency and capability of ASTI simultaneously belong to the double superior type; Brazil, India, Indonesia, Mexico, Saudi Arabia, and South Africa are efficiency single-superior type, indicating that the capabilities of ASTI for these six countries need to be improved; the capacity single-superior type included Canada, France, Italy, Japan, and the Republic of Korea, which means that these five countries are weak in the efficiency of ASTI; and the Russian Federation and Turkey are weak in both capability and efficiency of ASTI, so they fell in the double-inferior type.
Compared with 2008, in 2017, the types of ASTI levels in 15 countries, including Australia, Brazil, Canada, China, France, India, Indonesia, Italy, Japan, the Republic of Korea, the Russian Federation, Saudi Arabia, South Africa, Turkey, and the United States, remained unchanged. There were only four countries (Argentina, Germany, Mexico, and the United Kingdom) whose types of ASTI levels changed. Argentina and Mexico changed from the double inferior type to the efficiency single-superior type due to efficiency improvement. On the contrary, the ASTI types of Germany and the United Kingdom transformed from the double superior type to capacity single-superior type caused by a drop in efficiency. The results indicate that the ASTI levels of G20 countries were in a stable status on the whole during the period 2008–2017.

4. Conclusions and Implications

In this study, we estimated the static-dynamic efficiency of ASTI and identified the efficiency determinants across the G20 countries. First, we measured the static comprehensive efficiency of ASTI by means of the DEA-BCC model. The results show that one developed country (the United States) and five developing countries (Brazil, China, India, Indonesia, and Saudi Arabia) have been efficient in the period 2008–2017. The values of the G20 developing countries were relatively larger than the G20 developed countries from the perspective of efficiency range. The G20 developed countries showed a fluctuating downward trend, while the G20 developing countries showed an upward trend from the perspective of efficient proportion. The major binding constraints to the higher efficiency of ASTI included the R&D expenditure redundancy and the agricultural journal papers deficiency. Second, we applied the DEA-Malmquist index model to calculate the dynamic total factor productivity change (TFPC) of ASTI in the periods 2008–2017. The TFPC of ASTI for G20 countries showed “decline–growth–continuous decline–growth recovery” trend, where the G20 developed countries showed a “growth–decline–growth” trend, while the G20 developing countries experienced a fluctuating upward trend. The technological change (TC) was the main cause of the TFTC of ASTI in most G20 countries. Finally, we further classified the ASTI level of G20 countries based on efficiency and capability. The G20 developed countries usually had higher capacity, while the G20 developing countries had advantages in efficiency.
The theoretical contributions of this study are as follows. First, although measuring innovation efficiency is not a novel concept, the empirical evidence in ASTI is limited and most studies have taken a cross-sectional sample of one region or one country. In this study, we went beyond the range of single-country studies. We collected the G20 countries data during a 10-year period (2008–2017) and performed a comparative study of countries at different stages of development. Our second contribution is the integration of static and dynamic ASTI efficiency analyses, contrary to the previous studies only conducting static or dynamic efficiency analyses. Here, we investigated the efficiency determinants from static and dynamic perspectives. Third, this study is pioneering in classification and change analysis of the national ASTI level based on the rankings of efficiency measurement and capability evaluation of ASTI.
This study has important implications for the design and implementation of agricultural innovation strategies for policymakers. Firstly, developed countries should optimize the investment structure of ASTI, while developing countries should pay more attention to the scale of investment. The ASTI in developed countries started earlier, but most developed countries in G20 had R&D personnel and R&D expenditure investment redundancy during 2008–2017. Thus, policymakers in developed countries should pay more attention to the optimization of investment structure of ASTI, instead of focusing only on inputs. Although the efficiency of ASTI of developing countries is higher than that of developed countries on the whole, this is mainly based on the premise of low input–low output in ASTI of developing countries. Policymakers in developing countries should appropriately expand the scale of investment in ASTI while maintaining current efficiency. Secondly, the role of technological progress in promoting the efficiency of ASTI must be taken seriously. The empirical results show that the reason for the decline in the TFP of ASTI in G20 countries from 2008 to 2017 was that the decline in technological progress was greater than the increase in technological efficiency. All countries should strengthen the development and transformation of agricultural technology continuously. Finally, in 2008, there were four “double superior type” countries of G20 but only three in 2017. Therefore, the efficiency and capability of ASTI should be taken into consideration when implementing different policies simultaneously.
This research is not free of limitations and these could be addressed in future research. First, a national agriculture innovation system is a complex system, including various input and output indicators. Concerning the future work, it would be interesting and valuable to investigate more detailed indicators for a better simulation of the national agriculture innovation system, which can more effectively reflect the real process of ASTI activities at the national level. Second, due to the lack of data, our empirical research was not able to include more countries. Hence, a direction for our future research is to conduct comparative studies between more countries.

Author Contributions

Conceptualization, D.W., X.G., and C.D.; methodology, D.W., X.G., C.D., and X.D.; validation, D.W.; formal analysis, D.W.; investigation, D.W., C.D., X.D., J.L., and B.W.; writing—original draft preparation, D.W. and C.D.; writing—review and editing, D.W.; supervision, X.G.; and funding acquisition, D.W. All authors have read and agreed to the published version of the manuscript.

Funding

This research was funded by the Chinese Postdoctoral Science Foundation (2017M621239) and the Postdoctoral Science Foundation of Heilongjiang Province (LBH-Z17007).

Institutional Review Board Statement

Not applicable.

Informed Consent Statement

Not applicable.

Acknowledgments

We are grateful for the helpful insights and suggestions from the editor of this journal, as well as the anonymous referees.

Conflicts of Interest

The authors declare no conflict of interest.

References

  1. Chen, Z.H.; Sun, T.T. American Agricultural Product: Analyzing Its International Competitiveness. Acad. Exc. 2019, 10, 99–113. [Google Scholar]
  2. Ma, H.K.; Mao, S.P. Green-Ecological Transformation of EU Common Agricultural Policy: Policy Evolution, Reform Trend and Its Enlightenment. Issues Agric. Econ. 2019, 9, 134–144. [Google Scholar]
  3. Gong, Y.T.; Sun, L.X.; Mao, S.P. Agricultural R&D policies in the UK and their implications to China. Res. Agric. Modern. 2018, 39, 559–566. [Google Scholar]
  4. Ministry of Agriculture and Rural Affairs of the People’s Republic of China: Notice of Ministry of Agriculture on Printing and Distributing “Agricultural Science and Technology Development Plan (2006–2020)”. Available online: http://www.moa.gov.cn/nybgb/2007/dqq/201806/t20180614_6151989.htm (accessed on 16 November 2020).
  5. Ministry of Agriculture and Rural Affairs of the People’s Republic of China: Notice of the Ministry of Agriculture on Printing and Distributing “The National Plan for the Construction of Agricultural Science and Technology Innovation Capacity (2012–2016)”. Available online: http://www.moa.gov.cn/nybgb/2013/dliuq/201805/t20180509_6141642.htm (accessed on 16 November 2020).
  6. Wennekers, S.; Thurik, R. Linking entrepreneurship and economic growth. Small Bus. Econ. Group 1999, 13, 27–56. [Google Scholar] [CrossRef]
  7. Hollanders, H.; Celikel-Esser, F. Measuring Innovation Efficiency; European Commission: Brussels, Belgium, 2007. [Google Scholar]
  8. Liu, Z.Y.; Chen, X.F.; Chu, J.F.; Zhu, Q.Y. Industrial development environment and innovation efficiency of high-tech industry: Analysis based on the framework of innovation systems. Technol. Anal. Strateg. Manag. 2018, 30, 434–446. [Google Scholar] [CrossRef]
  9. Guan, J.C.; Chen, K.H. Modeling macro-R&D production frontier performance: An application to Chinese province-level R&D. Scientometrics 2010, 82, 165–173. [Google Scholar]
  10. Zuo, K.R.; Guan, J.C. Measuring the R&D efficiency of regions by a parallel DEA game model. Scientometrics 2017, 112, 175–194. [Google Scholar]
  11. Perović, S.; Radovanović, S.; Sikimić, V.; Berber, A. Optimal research team composition: Data envelopment analysis of Fermilab experiments. Scientometrics 2016, 108, 83–111. [Google Scholar] [CrossRef]
  12. Campisi, D.; Mancuso, P.; Mastrodonato, S.L.; Morea, D. Efficiency assessment of knowledge intensive business services industry in Italy: Data envelopment analysis (DEA) and financial ratio analysis. Meas. Bus. Excell. 2019, 23, 484–495. [Google Scholar] [CrossRef]
  13. Rousseau, S.; Rousseau, R. The scientific wealth of European nations: Taking effectiveness into account. Scientometrics 1998, 42, 75–87. [Google Scholar] [CrossRef]
  14. Pan, T.W.; Hung, S.W.; Lu, W.M. DEA performance measurement of the national innovation system in Asia and Europe. Asia Pac. J. Oper. Res. 2010, 27, 369–392. [Google Scholar] [CrossRef]
  15. Guan, J.C.; Chen, K.H. Modeling the relative efficiency of national innovation systems. Res. Policy 2012, 41, 102–115. [Google Scholar] [CrossRef]
  16. Broekel, T.; Rogge, N.; Brenner, T. The innovation efficiency of German regions-A shared-input DEA approach. Rev. Reg. Res. 2018, 38, 77–109. [Google Scholar] [CrossRef] [Green Version]
  17. Zemtsov, S.; Kotsemir, M. An assessment of regional innovation system efficiency in Russia: The application of the DEA approach. Scientometrics 2019, 120, 375–404. [Google Scholar] [CrossRef]
  18. Wang, D.; Zhao, X.L.; Zhang, Z.Z. The time lags effects of innovation input on output in national innovation systems: The case of China. Discrete Dyn. Nat. Soc. 2016, 8, 1–12. [Google Scholar] [CrossRef]
  19. Shin, J.; Kim, C.; Yang, H. The Effect of Sustainability as Innovation Objectives on Innovation Efficiency. Sustainability 2018, 10, 1966. [Google Scholar] [CrossRef] [Green Version]
  20. Park, J.H. Open innovation of small and medium-sized enterprises and innovation efficiency. Asian J. Technol. Innov. 2018, 26, 115–145. [Google Scholar] [CrossRef]
  21. Zhang, J.; Zhang, B.W. The empirical analysis of the innovation efficiency of Agricultural science and technology parks in China based on Malmquist index method. Sci. Technol. Pro. Policy 2011, 28, 129–133. [Google Scholar]
  22. Du, J. Analysis of the Input-output Efficiency of Agriculture Science and Technology Innovation in China Based on Data Envelopment Analysis. Sci. Technol. Pro. Policy 2013, 30, 82–85. [Google Scholar]
  23. Mekonnen, D.K.; Spielman, D.J.; Fonsah, E.G.; Dorfman, J.H. Innovation Systems and Technical Efficiency in Developing-Country Agriculture. Agric. Econ. 2015, 46, 689–702. [Google Scholar] [CrossRef] [Green Version]
  24. Chen, Z.; Zheng, R.; Li, P.H.; Huang, S. Evaluation and analysis of agricultural science and technology innovation efficiency in Henan Province. J. Henan Agric. Univ. 2018, 52, 464–469. [Google Scholar]
  25. Li, Y.H.; Bai, L.P. Study on Resource Allocation Efficiency and Influencing Factors of Agricultural Science and Technological Innovation in Yunnan Province. Chin. J. Agri. Resour. Region. Plan 2019, 40, 63–69. [Google Scholar]
  26. Guo, X.Y.; Du, X.; Wang, D. Evaluation and comparative analysis of the efficiency of provincial agricultural science, technology and innovation in China. Stud. Explor. 2020, 42, 141–147. [Google Scholar]
  27. Dong, M.T. A Study on Allocation Efficiency and Influencing Factors of Agricultural Science and Technology Innovation Resources in China. East Chin. Econ. Manag. 2014, 28, 53–58. [Google Scholar]
  28. Wang, E.C. R&D efficiency and economic performance: A cross-country analysis using the stochastic frontier approach. J. Policy Model 2007, 29, 345–360. [Google Scholar]
  29. Wang, E.; Huang, W. Relative efficiency of R&D activities: A cross-country study accounting for environmental factors in the DEA approach. Res. Policy 2007, 36, 260–273. [Google Scholar]
  30. Wang, D.; Du, X.; Sun, J.; Guo, X.Y.; Chen, Y. Synergy of national agricultural innovation systems. Sustainability 2018, 10, 3385. [Google Scholar] [CrossRef] [Green Version]
  31. Bloch, H.; Metcalfe, S. Innovation, creative destruction, and price theory. Ind. Corp. Chang. 2018, 27, 1–13. [Google Scholar] [CrossRef]
  32. Farrell, M.J. The Measurement of Productive Efficiency. J. R. Stat. Soc. 1957, 120, 253–290. [Google Scholar] [CrossRef]
  33. Charnes, A.; Cooper, W.W.; Rhodes, E. Measuring the efficiency of decision-making units. Eur. J. Oper. Res. 1978, 2, 429–444. [Google Scholar] [CrossRef]
  34. Alirezaee, M.R.; Howland, M.; van de Panne, C. Sampling Size and Efficiency Bias in Data Envelopment Analysis. J. Appl. Math. Decis. Sci. 1998, 2, 51–64. [Google Scholar] [CrossRef] [Green Version]
  35. Wober, K.W. Data Envelopment Analysis. J. Travel. Tour. Mark. 2007, 21, 91–108. [Google Scholar] [CrossRef]
  36. Banker, R.D.; Charnes, A.; Cooper, W.W. Some Models for Estimating Technical and Scale Inefficiencies in Data Envelopment Analysis. Manag. Sci. 1984, 30, 1078–1092. [Google Scholar] [CrossRef] [Green Version]
  37. Xu, K.; Bossink, B.; Chen, Q. Efficiency Evaluation of Regional Sustainable Innovation in China: A Slack-Based Measure (SBM) Model with Undesirable Outputs. Sustainability 2020, 12, 31. [Google Scholar] [CrossRef] [Green Version]
  38. Fare, R.; Grosskopf, S.; Norris, M.; Zhang, Z.Y. Productivity growth, technical progress, and efficiency change in industrialized countries. Am. Econ. Rev. 1994, 84, 66–83. [Google Scholar]
  39. Fare, R.; Grosskopf, S.; Kokkelenberg, E.C. Measuring Plant Capacity, Utilization and Technical Change: A Nonparametric Approach. Int. Econ. Rev. 1989, 30, 655–666. [Google Scholar] [CrossRef]
  40. Ouenniche, J.; Carrales, S. Assessing efficiency profiles of UK commercial banks: A DEA analysis with regression-based feedback. Ann. Oper. Res. 2018, 266, 551–587. [Google Scholar] [CrossRef] [Green Version]
  41. Zhang, C.; Wang, X.J. The influence of ICT-driven innovation: A comparative study on national innovation efficiency between developed and emerging countries. Behav. Inf. Technol. 2019, 38, 876–886. [Google Scholar] [CrossRef]
  42. Fang, S.R.; Xue, X.S.; Yin, G. Evaluation and Improvement of Technological Innovation Efficiency of New Energy Vehicle Enterprises in China Based on DEA-Tobit Model. Sustainability 2020, 12, 7509. [Google Scholar] [CrossRef]
  43. Lin, Y.Y.; Deng, N.Q.; Gao, H.L. Research on Technological Innovation Efficiency of Tourist Equipment Manufacturing Enterprises. Sustainability 2018, 10, 4826. [Google Scholar] [CrossRef] [Green Version]
  44. Cruz-Cázares, C.; Bayona-Sáez, C.; García-Marco, T. You can’t manage right what you can’t measure well: Technological innovation efficiency. Res. Policy 2013, 42, 1239–1250. [Google Scholar] [CrossRef]
  45. Suh, Y.; Kim, M.S. A taxonomy of service innovations based on the innovative activity efficiency of service firms: A DEA approach. Int. J. Serv. Technol. Manag. 2014, 20, 267–289. [Google Scholar] [CrossRef]
  46. Wang, D.; Zhao, X.L.; Guo, X.Y.; Hu, Y.; Du, X. Theoretical framework and capability evaluation for the national agricultural science, technology and innovation—An empirical study based on the group of twenty. Chin. Soft. Sci. 2018, 3, 18–35. [Google Scholar]
  47. Brown, M.G.; Svenson, R.A. Measuring R&D productivity. Res. Technol. Manag. 1998, 41, 30–35. [Google Scholar]
  48. Kaihua, C.; Mingting, K. Staged efficiency and its determinants of regional innovation systems: A two-step analytical procedure. Ann. Regional. Sci. 2014, 52, 627–657. [Google Scholar] [CrossRef]
  49. Wang, Q.W.; Hang, Y.; Sun, L.C.; Zhao, Z.Y. Two-stage innovation efficiency of new energy enterprises in China: A non-radial DEA approach. Technol. Forecast. Soc. Chang. 2016, 112, 254–261. [Google Scholar] [CrossRef]
  50. Sun, H.; Yu, H.X. Research on Technology Innovation Efficiency and Innovation Capacity of Pharmaceutical Industry in Hebei Province. Sci. Technol. Manage. Res. 2012, 32, 85–90. [Google Scholar]
  51. Zhang, Y.; Tang, L.B.; Jin, P.Z. Study on the Measurement and Influencing Factors of the BRICs’ Innovation Capability. Chin. Soft. Sci. 2015, 6, 148–157. [Google Scholar]
Figure 1. Empirical research framework.
Sustainability 13 02769 g001
Figure 2. Comprehensive efficiency of ASTI in the period 2008–2017.
Sustainability 13 02769 g002
Figure 3. Efficiency range of ASTI.
Sustainability 13 02769 g003
Figure 4. Efficient proportion of ASTI.
Sustainability 13 02769 g004
Figure 5. Classification for the national ASTI level for G20 countries.
Sustainability 13 02769 g005
Table 1. List of the innovation efficiency evaluation studies using DEA met.
Authors and TitleDEA ModelInput IndicatorsOutput Indicators
Chen, Z.; Zheng, R. et al. (2018) [24]
Evaluation and analysis of agricultural science and technology innovation efficiency in Henan Province
CCRAgricultural R&D expenditure; Agricultural R&D researchers; Total power of agricultural machineryNumber of agricultural journal papers; Total output value of Agriculture
Guo, X.Y.; Du, X. et al. (2020) [26]
Evaluation and comparative analysis of the efficiency of provincial agricultural science, technology and innovation in China
BCCAgricultural R&D expenditure; Agricultural R&D researchersNumber of agricultural patents; Number of new plant varieties; Added value of agriculture
Park, J.H. (2018) [20]
Open innovation of small and medium-sized enterprises and innovation efficiency
BCCThe value of R&D expenditure divided by the total sales; The share of R&D staff in total employmentThe percentage of sales from R&D activities
Shin, J.; Kim, C. (2018) [19]
The Effect of Sustainability as Innovation Objectives on Innovation Efficiency
SBMR&D Employee; R&D ExpensePatent Application; Innovation Sales
Zhang, C.; Wang, X.J. (2019) [41]
The influence of ICT-driven innovation: a comparative study on national innovation efficiency between developed and emerging countries
BCCGross Domestic Expenditure on R&D; Total ResearcherTriadic Patent Families; Science & Engineering Articles; Value Added of Knowledge and Technology Intensive
Industries
Fang, S.R.; Xue, X.S.; Yin, G. (2020) [42]
Evaluation and Improvement of Technological Innovation Efficiency of New Energy Vehicle Enterprises in China Based on DEA-Tobit Model
two-stage DEATotal assets R&D expenditure; Total number of employees; Technical asset rateNumber of patents; Operating income Net profit
Lin, Y.Y.; Deng, N.Q.; Gao, H.L. (2018) [43]
Research on Technological Innovation Efficiency of Tourist Equipment Manufacturing Enterprises
DEA-MalmquistIntensity of R & D personnel; Intensity of R & D expenditureNumber of patent applications; Profit ratio of sales; Total labor productivity
Table 2. Index system for measuring ASTI efficiency.
IndexSub-IndexIndicatorData Sources
InputR&D personnel X 1 : Number of agricultural researchersUNESCO-UIS
R&D expenditure X 2 : Percentage shares of R&D expenditure in agricultural value addedUNESCO-UIS, FAO
OutputScientific and technological output Y 1 : Number of agricultural journal papersWOS
Y 2 : Number of agricultural patentsWIPO
Economic performance Y 3 : Agricultural value added (annual % growth)WB
Notes: United Nations Educational, Scientific and Cultural Organization-Institute for Statistics (UNESCO-UIS): http://uis.unesco.org/ (accessed on 10 September 2020); The Food and Agriculture Organization (FAO): http://www.fao.org/home/en/ (accessed on 10 September 2020); World Intellectual Property Organization (WIPO): https://www3.wipo.int/ipstats/index.htm?lang=en (accessed on 10 September 2020); Web of Science (WOS): http://apps.webofknowledge.com/RAMore.do?product=WOS&search_mode=AdvancedSearch&SID=5BeAM2moXj26NR13wVH&qid=13&ra_mode=more&ra_name=CountryTerritory&colName=WOS&viewType=raMore (accessed on 10 September 2020); World Bank (WB): https://data.worldbank.org/indicator/NV.AGR.TOTL.ZS?view=chart (accessed on 10 September 2020).
Table 3. Descriptive statistics of the input and output indicators.
IndicatorMeanStd. Dev.MinMax
X114.8119.480.1295.92
X242.1727.395.9289.94
Y110.9911.430.1149.47
Y211.8919.070.01100.00
Y339.789.950.1092.87
Table 4. Input redundancy frequency and output deficiency frequency of ASTI in the period 2008–2017.
FrequencyR&D PersonnelR&D ExpenditureAgricultural Journal PapersAgricultural PatentsEconomic Performance
0Argentina, Australia, Canada, Mexico, South Africa, United KingdomGermany, United KingdomArgentina, Canada, Italy, Japan, Republic of Korea, Mexico, Russian Federation, South Africa, Turkey
1–4France, Germany, Italy, Republic of Korea, TurkeyArgentina, Australia, Germany, Japan, Mexico, Russian Federation, TurkeyArgentina, Australia, Canada, France, Italy, Mexico, South Africa, United KingdomAustralia, Canada, France, Italy, Japan, Republic of Korea, Mexico, the Russian FederationAustralia, France, Germany, United Kingdom
5–10Japan, Russian FederationCanada, France, Italy, Republic of Korea, South Africa, United KingdomGermany, Japan, Republic of Korea, Russian Federation, TurkeyArgentina, South Africa, Turkey
Table 5. Input redundancy and output deficiency of ASTI in G20 countries in 2017.
CountryR&D
Personnel
R&D
Expenditure
Agricultural Journal
Papers
Agricultural PatentsEconomic Performance
Canada0.000.210.000.000.00
France0.300.050.000.000.00
Germany0.130.000.510.000.00
Italy0.000.160.000.000.00
Japan0.000.003.090.000.00
Republic of Korea0.160.260.110.000.00
Russian Federation0.630.007.002.900.00
Turkey0.090.002.460.880.00
United Kingdom0.000.060.000.000.00
Table 6. TFPC decomposition of ASTI in the period 2008–2017 under time dimension.
Period Total Factor Productivity Change (TFPC)Technical Efficiency Change (TEC)Technological Change (TC)Pure Efficiency Change (PEC)Scale Efficiency Change (SEC)
Efficiency
2008–20090.8260.8710.9490.8750.995
2009–20101.2171.0631.1440.9701.096
2010–20111.0170.8891.1441.1580.768
2011–20120.9450.9730.9710.9980.975
2012–20130.9371.3510.6941.0031.347
2013–20140.8900.9640.9231.0510.917
2014–20150.9580.9311.0300.9500.980
2015–20160.9761.0230.9540.9441.083
2016–20171.1171.0791.0351.0771.002
Mean Value0.9811.0080.9741.0001.008
Table 7. TFPC decomposition of ASTI in G20 developed and developing countries under time dimension.
G20 Developed CountriesG20 Developing Countries
TFPCTECTCPECSECTFPCTECTCPECSEC
2008–20090.917 0.957 0.958 0.919 1.042 0.752 0.800 0.940 0.837 0.955
2009–20101.080 0.951 1.136 0.887 1.073 1.354 1.176 1.152 1.052 1.117
2010–20111.001 0.770 1.301 1.192 0.645 1.032 1.013 1.018 1.128 0.898
2011–20121.014 1.043 0.972 1.037 1.005 0.888 0.915 0.971 0.964 0.949
2012–20130.851 1.563 0.544 0.906 1.726 1.022 1.184 0.863 1.098 1.078
2013–20140.867 0.928 0.934 1.093 0.849 0.911 0.997 0.914 1.014 0.983
2014–20150.859 0.868 0.990 0.924 0.939 1.058 0.991 1.067 0.973 1.019
2015–20161.025 1.073 0.955 0.943 1.138 0.933 0.980 0.952 0.946 1.036
2016–20171.092 1.047 1.043 1.057 0.990 1.140 1.109 1.028 1.095 1.013
Table 8. TFPC decomposition of ASTI in the period 2008–2017 under spatial dimension.
CountryTFPCTECTCPECSEC
Saudi Arabia1.1141.0001.1141.0001.000
Japan1.0751.1110.9671.0091.100
China1.0661.0001.0661.0001.000
Mexico1.0391.0540.9861.0431.011
Republic of Korea1.0281.0770.9550.9971.080
Russian Federation1.0061.0061.0000.9901.016
Argentina1.0041.0780.9311.0511.026
Australia0.9941.0000.9941.0001.000
Turkey0.9761.0080.9690.9991.009
United States0.9761.0030.9731.0001.003
South Africa0.9600.9640.9951.0000.964
France0.9581.0140.9451.0190.995
Indonesia0.9551.0000.9551.0001.000
India0.9481.0000.9481.0001.000
Italy0.9451.0060.9390.9851.022
Germany0.9290.9830.9460.9781.004
Brazil0.9231.0090.9151.0001.009
United Kingdom0.8970.9320.9630.9650.966
Canada0.8820.9220.9570.9640.957
Table 9. Sources for growth of TFPC of ASTI.
SourceCountry
TFPC > 1TEC > 1, TC ≤ 1Argentina, Japan, Republic of Korea, Mexico, the Russian FederationSEC > 1 (Republic of Korea, the Russian Federation)
PEC > 1, SEC > 1 (Japan, Mexico, Argentina)
TC > 1, TEC ≤ 1China, Saudi Arabia
Table 10. Sources for decline of TFPC of ASTI.
SourceCountry
TFPC < 1TC < 1, TEC < 1South Africa, Germany, United Kingdom, CanadaSEC < 1 (South Africa)
PEC < 1 (Germany)
SEC < 1, PEC < 1 (United Kingdom, Canada)
TC < 1, TEC ≥ 1Australia, Turkey, United States, France, Indonesia, India,
Italy, Brazil
Publisher’s Note: MDPI stays neutral with regard to jurisdictional claims in published maps and institutional affiliations.

