Abstract
The benefits of having a Bike Sharing System (BSS) in a city are numerous. Among other advantages, it promotes a cleaner environment with less traffic and pollution. One major problem the users of such services encounter is that of full or empty stations, causing user dissatisfaction. The objective of this work is to propose a new user-based incentive method to enhance BSS performance. The proposed method relies on a spatial outlier detection algorithm. It consists of adapting the departure and arrival stations of the users to the BSS state by stimulating the users to change their journeys in view of minimizing the number of full and empty stations. Experiments are carried out to compare our proposed method to some existing methods for enhancing the resource availability of BSSs, and they are performed on a real dataset issued from a well-known BSS called Velib. The results show that the proposed strategy improves the availability of BSS resources, even when the collaboration of users is partial.
1. Introduction
The idea of a Bike Sharing System (BSS) emerged in the twentieth century. The first few projects were not very successful, mainly due to the theft of the bicycles [1]. To overcome this problem, smart technology was integrated into the bike-sharing projects that followed in Europe and the United States [2]. Nowadays, hundreds of major cities around the world have a bike-sharing program [3]. Implementing a BSS in a city has several advantages, such as traffic congestion reduction, a healthier transport system where citizens can exercise, and a less polluted environment. It also offers a hassle-free service to users who do not have to worry about the regular maintenance of their bikes or risk the theft of their assets [4].
In this paper, we turn our attention to a docked biking system where a user is free to borrow a bike from a station and then return it to another station. This service is available around the clock. It complements the public transport network in a city that may comprise buses, trams, and subways. Users of such a system complain mainly about empty stations (i.e., they do not find any bicycle to borrow) and also about full stations (i.e., there is no place to dock their bicycles when they reach their destination).
We already tackled this problem in the Paris BSS that was launched by Velib in 2007. Their current network comprises 1800 stations and is used by over 100,000 citizens during weekdays [5]. We defined an outlier as a full or empty station when all of the surrounding stations are balanced. After analyzing the data provided by Velib, we noticed that the average distance between two stations is approximately 216 m. Since the walking distance from an outlier to an adjacent (and balanced) station is very short, it was natural to incentivize the customer to avoid outliers by heading to a neighboring station to pick up or drop a bike. This would improve the performance of Velib’s service without the extra cost of moving some bikes (e.g., by truck) to rebalance the stations. Using a modified version of the Moran scatterplot, we were able to show that most of the stations were locally heterogeneous [6]. In other words, most of the outliers were surrounded by balanced stations. This observation reinforces our hypothesis that a small change in the users’ journeys (i.e., a biker has only to walk an average of 216 m) minimizes the number of outliers in the whole network. We believe that the same strategy could be applied to other cities with BSS [7] or even to cities that use a car-sharing system [8].
Detecting outliers is a fundamental step towards enhancing the performance of many systems. It can be applied to a wide variety of fields, such as spotting disease outbreaks [9], healthcare [10,11], detecting soil pollution [12], detecting abnormal traffic [13], and analyzing a network’s abnormal and suspicious activities [14,15].
In this paper, we propose a new user-based strategy to enhance the resource availability in BSSs. The proposed method improves the overall BSS performance by minimizing the number of abnormal stations, also called spatial outliers stations. This paper extends our earlier work in which we analyzed the data provided by Velib and suggested two methods to enhance the performance of the Paris’ BSS [6]. When analyzing the data, we took into account the spatial attributes of a station (i.e., latitude), its non-spatial attributes (i.e., capacity), and its dynamic attributes for different timestamps t (i.e., the number of available bikes). In the first method, we proposed to the user to take the bike from the busiest station surrounding his/her initial station. Similarly, we assumed that the user goes to the emptiest station instead of his/her actual destination. In the second method, we applied the first method but only during rush hours. In our previous work, the users’ journeys were updated based on the full and empty stations surrounding the initial stations. In addition, spatial outlier detection algorithms were applied to only estimate the number of isolated problematic stations in order to gain a good understanding of the system and the real users’ needs and, eventually, to motivate the incentive methods that we propose. However, a full or empty station can also be surrounded by other full or empty stations. In this case, changing users’ journeys will not significantly improve the availability of BSS resources, while users are still paid for their collaboration. To deal with this issue, we propose in this paper to identify spatial outlier stations and then change the users’ journeys accordingly. That is, the users’ journeys are modified based on two factors: (1) the actual state of the initial departure and/or arrival station, and (2) the actual state of the surrounding stations. The modification of a journey is made if and only if there is a difference between the actual state of the initial station and the actual state of the surrounding stations.
Our main contributions in this paper are as follows:
- Implementing and comparing existing spatial outlier detection algorithms for detecting outlier stations and testing them against three different scenarios. More specifically, we implemented the iterative r algorithm, the iterative z algorithm, the Median algorithm, the Z-score algorithm, the Moran scatterplot, and the Modified Moran scatterplot. These algorithms are compared in terms of their ability to enhance the BSS status.
- Developing a new user-based incentive method to enhance the BSS performance. The proposed method improves the resource availability of the BSS by adapting the departure and arrival stations of the users’ to the BSS state.
- Assessing the effectiveness of the new strategy using a real dataset issued from a well-known BSS called Velib.
The remainder of this paper is organized as follows. Section 2 gives an overview of the related work. Section 3 defines the problem of this work and describes the dataset used in our study. Section 4 illustrates the proposed strategy to rebalance the Velib bikes network. Section 5 discusses the experiments and the obtained results. Finally, Section 6 concludes our work.
2. Related Work
Many studies, such as [16,17,18], have elaborated on the performance of BSSs, shown the weakness of these systems in meeting customers’ needs, and proposed various user-based strategies to enhance the efficiency of these systems.
Bike operators in major cities allow real-time access to their data. Several researchers emphasized the importance of analyzing and interpreting these data [19,20,21]. Early work focused on finding the behavior patterns of BSS users to improve urban transportation policies. Comparative studies between different cities were conducted [22], as well as in a single city, where Borgnat et al. [23] used statistical modeling and data mining techniques to analyze the movements of bikes in Lyon. Gast et al. [24] proposed a new metric that guarantees that a user will be able to make their journey with a very high probability. Etienne et al. [17] developed a model-based clustering strategy to analyze the trip data and usage statistics issued from BSSs. The proposed model can be used as a preliminary step towards BSSs management and improvement. Morton et al. [25] provided a guide to use in attracting new customers to use BSSs and retaining existing customers. The results are based on a case study evaluation of existing members’ experiences with the London Bicycle Sharing Scheme. Nikitas [26] investigated the BSS acceptability in a Greek city through a quantitative survey. Their results showed that residents were in favor of a self-service bicycle system considering its benefit to the environment, people’s health, residents who need a means of transport at a low cost, and the reduction in the traffic congestion of the city. Bakogiannis et al. [27] presented an empirical and theoretical study of the Dockless Bike Sharing System (DBSS). The authors analyzed the BSS models using real users’ trip data, explored the reasons why residents did not use the system, and studied the main users’ perceptions relating to their use of the BSS. The ultimate goal of their research was to guide and help BSS operators to improve their dockless fleets. Nikitas et al. [28] provided policy and business advices to guide and help BSS operators manage them effectively. The recommendations and conclusions provided by this work are based on data from two studies in Sweden and Greece. The authors concluded that there is a need to adapt the BSS design and expansion based on the cities’ needs, to make the infrastructure and legislation of the BSS more user-friendly, to have anti-abuse measures, to use a realistic profit strategy, etc. Eren et al. [29] studied the factors that affect travel demands in order to assess the performance of Bike-Sharing Programs (BSPs). Their results can be used as an estimate for BSPs planners or policymakers to understand the key factors contributing to the demand for self-service bicycles, and as a guide for BSPs planners and researchers to enhance the performance of BSPs.
Different strategies have been developed in the literature to enhance the performance of BSSs. With the user-based rebalancing approaches, some incentives in the form of a price discount and extra time are offered to users to encourage them to change their departure/arrival stations. In [30], the authors developed a new simulation system to study the impact of the users’ participation in rebalancing the BSS. Various parameters such as the number of incentives, the users’ collaboration rate, and extra walking distances were considered to test the effectiveness of the proposed system. Singla et al. [31] developed a new strategy to incentivize BSS users to change their departure/arrival stations. The proposed approach uses an optimal pricing policy based on the regret minimization approach in online learning. Chen et al. [32] proposed a new method to rebalance large-scale BSSs. The method employs a fine-grained prediction model to predict the future demand of users, and then compute the rebalance intervals. In [33], the authors proposed a new spatial optimization model based on a region decomposition approach to optimize the bike rebalancing in station-free bike-sharing systems. Freund et al. [34] presented various models used to reduce the number of dissatisfied BSS users and the number of users who are not able to access the BSS. Ren et al. [35] proposed a Markov Decision Process (MDP) model with a Deep Deterministic Policy Gradient to solve the balancing problems faced by BSSs. Chemla et al. [36] tried to settle the static rebalancing problem by using a branch-and-cut algorithm to solve a relaxed instance of the initial problem, then applied a tabu search to determine an upper bound for finding the optimal solution. A 3-step mathematical heuristic was implemented to address the static repositioning problem [37]. Dell Amico et al. [38] based their solution on stochastic scenarios, where they represented the demand at each station by a random variable. Chiariotti et al. [39] proposed a new BSS rebalancing strategy that leverages historical user trip data to predict BSS status and take action when necessary. The new strategy is based on the Birth–Death process and graph theory. The Birth–Death process has been used to describe stations’ occupancy and decide when the redistribution of bikes is needed, while graph theory has been used to choose the rebalancing path and which stations are affected by the redistribution process. The authors validated their proposed strategy using a real dataset issued from the New York City bike-sharing system. Faghih et al. [40] developed a linear model-based framework to estimate the impact of BSS infrastructure, socio-demographic characteristics, and land use features on the arrivals and departures of BSSs’ clients. The proposed framework also identifies the rebalancing periods and the amount of rebalancing that needs to be performed. This study was conducted using real data issued from the BSSs of Barcelona and Seville. Luo et al. [41] developed a framework for achieving the optimum bicycle fleet size and a rebalancing strategy to reduce the system’s life cycle GHG emissions. The authors used a simulation model to estimate the size of the fleet, an optimization model to rebalance the bicycles, and a life cycle analysis (LCA) model to quantify the GHG emission rate of the system. Cruz et al. [42] proposed a hybrid Iterated Local Search (ILS) algorithm designed to solve a challenging single-vehicle Static Bike Rebalancing Problem (SBRP) variant, in which only one vehicle is available. The goal is to predict the number of bikes to be collected or delivered at each station.
Recently, some researchers suggested incentives to users of the BSS to resolve the problem of empty and full stations. For example, Fricker et al. [18] proposed a stochastic model where a simple incentive such as returning a bike to the least-loaded station amongst two stations drastically improved the overall performance of the BSS. In another scheme, Haider et al. [43] came up with the idea of an optimized price vector to persuade users to take their bikes from (or return them to) a neighboring station. A dynamic reward pricing scheme was suggested to improve London’s Cycle Hire system [44]. The authors used a model-based heuristic to periodically recompute routes that help the user reach under-used stations. The first dynamic incentive applied to a real-case model was proposed by Singla et al. [31], where they presented a crowdsourcing mechanism that engages the users in the bike repositioning process. Legros et al. [45] developed a decision-support tool based on a Markov decision approach to help the BSSs operators to decide which stations should be involved in the bikes’ redistribution process and how many bikes should be added or removed from each station. The objective of this study is to reduce the percentage of users who find their station empty or full without the intervention of the users.
Researchers have developed different algorithms for detecting spatial outliers. These algorithms are of two main categories. The first one includes graphical-based strategies that help to visually represent points and their neighbors in a plane, such as variograms and scatterplots. The former is a fundamental geostatistics estimation technique that was thoroughly studied by Cressie [46,47] and other researchers in the field [48]. This mathematical model is used to illustrate the interdependence of adjacent spatial objects. A variogram cloud is used to detect outliers by plotting the squared differences of points in a set of data against the distance separating the observables of these points. Hence, outliers can be identified as the pairs of points that are spatially close to each other and having a large difference regarding their observable measurements.
An exhaustive study of graph-based anomaly detection can be found in [49], where the authors propose real-life applications of the existing methods to detect anomalies in areas such as computer networks, information systems, biology, social sciences, and finance. The underlying idea is that, in most cases, data objects cannot be represented as independent points in a multi-dimensional space. Therefore, they suggest using graphs to capture their inter-dependencies. Scatterplots represent data in a two-dimensional plane where, for instance, the observable of each object is plotted against the observables of its neighbors. A Moran scatterplot [50] makes a regression line [51] to divide a two-dimensional plane into four quadrants, thus enabling to spot the outliers from the remaining elements of the data set.
The second category uses quantitative-based methods to detect outliers. Some of the most well-known statistical tests are the median algorithm, the r algorithm, and the z algorithm. In their paper, Shekhar et al. [52] propose a Z-statistic spatial method to detect outliers in Minnesota’s traffic management center’s sensor network. A sensor is compared to its neighbors using the following mathematical function:
where x (i.e., spatial attribute) is the location of the sensor, is its non-spatial attribute (e.g., the volume of traffic detected by the node), is the set of its neighbors, and is the average attribute of the neighbors of x.
The Z-statistic method used to detect the outliers is given by the following equation:
where is the difference between the attribute of the sensor located at x and the mean value of the attributes of its neighbors, is the average value of , and is the standard deviation of across the network’s nodes.
In their paper [53], Lu et al. proposed three algorithms to help them reduce the number of false positive outliers—namely, the iterative r and iterative z algorithms and the median algorithm. A false positive outlier represents the state where an actual value is not an outlier but is detected by the algorithm as an outlier. They experimentally showed that their algorithms yield more accurate results than the standard z algorithm (without iterations), the Scatterplot, and the Moran Scatterplot algorithms, which falsely identify some objects as being outliers.
3. Study Area and Problem Definition
Since the launch of Velib, several cities around the world have implemented a similar model due to the increased benefits of having a BSS available to their citizens, such as reducing pollution and energy consumption, which positively impact the environment and the economy [12,54]. BSS users complain about empty stations and full stations. According to an annual survey conducted by Velib, almost half of the users faced such an awkward situation, especially during peak times of day [5,55]. Despite all the efforts made by Velib to manage these issues (i.e., by moving the bikes around by trucks), many people find themselves unable to hire a bike because a station is empty or, on the other hand, they cannot dock their bikes since a station is full. The failure of a BSS is mainly related to the strong attractiveness of certain stations due to their location near a train station, a monument, or a business district. These stations are most often almost empty, with no bikes available, or full, with no docks available to park a bike. These stations are said to be unbalanced and problematic. Despite the regulation carried out by the BSS consisting of moving some bikes to balance the stations, the system remains unbalanced. Daily commuting between residential and industrial areas boosts this bottleneck, ultimately causing user dissatisfaction.
To encourage collaboration with researchers, various types of data related to the Velib BSS have been made available to scientists. We use these data in all the experiments carried out in this work. Velib data are either static or dynamic. Static data characterize the stations and include the following information: latitude and longitude, id, and capacity of each station in the BSS. Dynamic data provide, in real-time, two types of information: (1) the number of bikes and docks available in each station during the day, and (2) users journeys, where each journey is described by a start time, end time, departure station, and arrival station.
The analysis of Velib data shows a very high periodicity in users’ journeys. Journeys are either performed during the working days or the weekends. In this work, we perform experiments based on users’ journeys. during the working days. In particular, we use the journeys made during a whole working day, 31 October 2013, which corresponds to 24 h. This duration comprehends 121,709 journeys and involves 1397 stations. All the journeys related to bike maintenance and bike regulation are not considered. The stations are visualized in Figure 1. The red circles represent the stations, and the numbers represent the number of stations. Table 1 provides some statistical information about the used dataset.
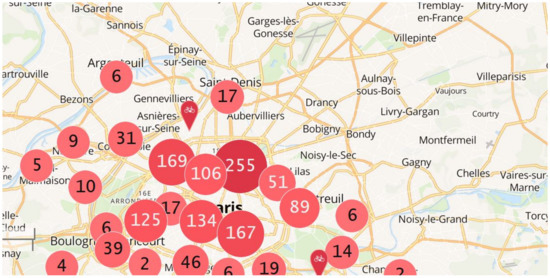
Figure 1.
Map of the Velib BSS.

Table 1.
Dataset details.
Using the dataset presented above, Figure 2 shows the evolution of the number of user journeys during a working day. Two peaks can be identified: the first at around 8:00 a.m. and the second at around 6:00 p.m. To overcome this situation, JCDecaux proceeds to the bike regulation. This involves taking bikes from the stations where there are too many and moving them to other stations where there are not enough. The goal is that each station will be full. This regulation is mostly performed during the night (there is less traffic). Because of the limited number of journeys, stations tend to be full which is the worst for the users, and during the night, users are not ready to spend more time looking for a station to return a bike. As shown in Figure 3, despite the regulation made by Velib the number of unbalanced BSS stations remains high.
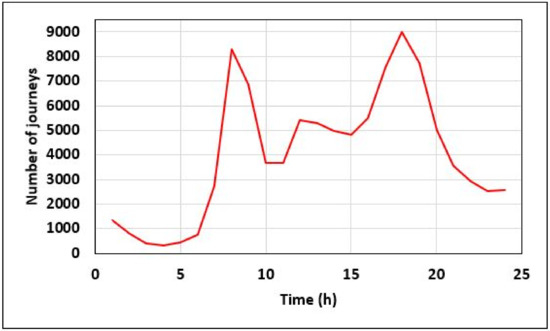
Figure 2.
Evolution of the number of journeys during the day.
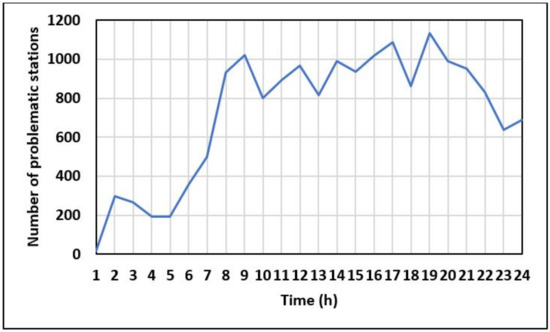
Figure 3.
Evolution of the number of unbalanced stations during the day.
The unbalanced stations, said to be problematic, decrease the overall performance of the BSS and lead to user dissatisfaction. Let the filling rate of a station, at a given time t, be computed as follows:
A station at a time [1 h, 24 h] is considered unbalanced if it satisfies one of the following conditions: it is almost empty (filling rate ) or almost full (filling rate ).
4. Rebalancing the Velib System
In this section, we propose a new user-based strategy based on a regulation performed by users. The objective is to balance the stations and, thus, enhance the conformity of the BSS by modifying the users’ journeys causing the system to be unbalanced. Recall that an unbalanced station is a station satisfying the following condition:
The filling rate is <10% or >90% at a given time [1 h, 24 h]. A spatial outlier station also said to be isolated is a station with a filling rate different from the filling rates of its neighbors at a given time t. Our new incentive user-based strategy improves the homogeneity of the BSS in terms of the occupancy ratio of the stations by modifying some of the users’ journeys. Journeys modifications involve modifying the departure and/or arrival stations of a trip. The surrounding of a station is defined in a distance m. When a user chooses to rent a bike from a station or to park a bike in the station at time t, the system will incentivize the user to change the station and to rent/park the bike from/to an optimal station in the surrounding of the original station if and only if the original station is not in an optimal state: the station is isolated. The application of this modification will help the original station to become closer to its neighbors in terms of filling rate. Reducing the number of isolated stations will reduce finally the number of problematic (unbalanced stations). Figure 4 shows the distribution of the number of neighbors for Velib stations. The surrounding of a station is defined in a distance equal to 400 and 500 m. These two values are reasonable as for a distance equal to 400 m, a station has an average of 5 neighbors, and or a distance equal to 500 m, only of the stations have no neighbors.
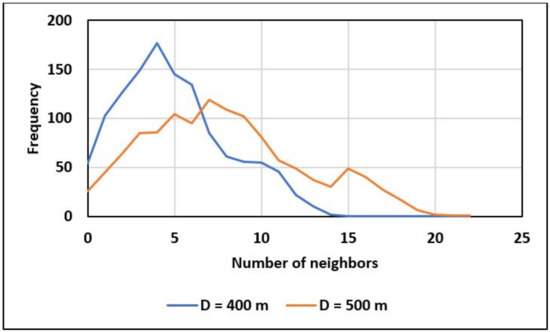
Figure 4.
Distribution of neighbors.
The key idea behind this new strategy is to reduce the number of isolated stations as much as possible. Reducing the number will decrease the number of unbalanced stations, and thus will improve the overall system performance. In more details, we propose to alter the users’ journeys as follows:
- Let A be the departure station of a journey, and B the arrival station of the journey. When a user chooses a station to rent or park a bike, the BSS application offers the user an incentive to relocate to other stations. When using the application, the user must specify if he is about to rent or park a bike, and the distance d that he is willing to walk to rent/park the bike m. This distance will be used to determine the neighbors of the original station chosen by the user.
- Then, the application checks whether the original station (A or B) is currently an isolated station. This is done by using a spatial outlier algorithm. Then, the application will propose to pay an incentive for the user if he accepts to modify his original station.
- The modification of the original station is carried out as follows: If the original station is A, the station will be substituted by the busiest station in the surrounding of A determined based on the d value, if and only if A is an isolated station. If the original station is B, the station will be substituted by the emptiest station in the surrounding of B determined according to the d value, if and only if B is an isolated station.
To determine if a station is isolated, a spatial outlier detection algorithm will be used. Recall that an isolated station satisfies the following condition: its status is significantly different from the state of the neighboring stations in terms of the filling rate at a given time t. Thus, isolated stations are considered spatial outliers. Six spatial algorithms will be considered in this paper: Iterative r [53], Iterative z [53], Median [53], Z-score [52], Moran Scatterplot [50], and Modified Moran Scatterplot [6].
The application can be easily used on mobile devices, where the user starts by entering his source and destination stations, called A and B, respectively. Then, the program applies a spatial outlier detection algorithm to check if each of the stations A and B is an outlier (isolated station). If a station is an outlier, an alternative journey that allows the user to save a given amount of money will be proposed. The new departure/arrival stations will be determined in a real-time manner as this depends on the current status of the BSS: the isolated stations and the state of their neighbors. As explained above, the surrounding of a station is defined in a distance value m. Thus, the user needs to walk for at most 500 meters to modify his original departure/arrival station. This value is suitable to have a sufficient number of neighbors for a given station.
To compare the extra walk distance (500 m) to the trip’s length, we show in Figure 5 the distribution of the journey lengths of the users. The obtained average journey length is 1917 m, therefore, an extra walk distance of 500 m is reasonable. Our proposed strategy is inspired by Velib+. Velib+ proposes to offer the user extra time when he accepts to park the bike in a high altitude station. The difference between our strategy and Velib+ is that, in Velib+, the substitute stations are predefined and constant over time. However, in our strategy the substituting stations (busiest and emptiest stations) change over time according to their states and the states of their neighbors.
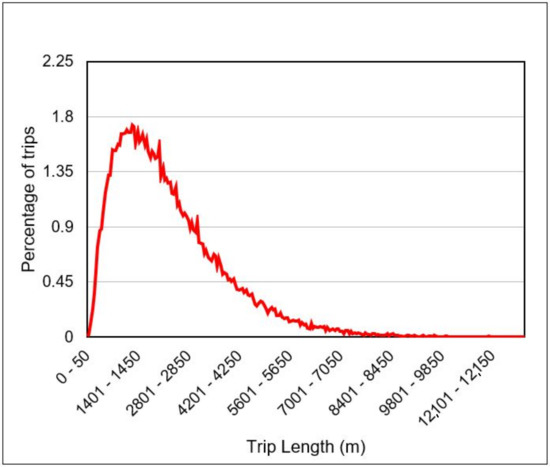
Figure 5.
Journeys lengths.
5. Experiments and Results
In the following, we study the impact of the new user-based strategy on the bike distribution in the BSS stations. More in detail, we demonstrate its effect on the evolution of the number of unbalanced and isolated stations during the day. The smaller these numbers, the more satisfied the users are with the system. The metrics we use to assess the efficiency of the proposed BSS rebalancing strategy are the following:
- Number of unbalanced (problematic) stations: This is the number of stations having a filling rate <10% or >90%, and thus, need to be balanced.
- Number of isolated stations: This describes the number of spatial outliers stations at a given time t .
- Mean cumulative duration of station invalidity: This represents the amount of time during which the stations have no available bikes to rent or docks to use. The shorter the duration, the lower the probability of not meeting users’ needs.
To assess the efficiency of our proposed strategy, we compare it with the following three scenarios: (1) no rebalancing strategy is applied, (2) the static rebalancing strategy [5] is used, and (3) the rebalancing strategy based on the rush hours is performed [6].
- When there is no rebalancing strategy applied, we operate the BSS without any modification of the journeys.
- When the static rebalancing strategy is applied, the user gives his source and destination stations, respectively called A and B. Then, an alternative journey will be proposed for the user in which the new departure station is the busiest station around A and the new arrival station is the emptiest station around B [5]. With this strategy, A and B are always modified regardless of their states and the states of their neighbors.
- When the rebalancing strategy based on the rush hours is used, the same static rebalancing method described previously will be applied, but only during rush hours [6].
We compare in Figure 6 the performance of the new user-based strategy in rebalancing the BSS according to the number of unbalanced stations. The results show that, whatever is the spatial outlier detection algorithm used to determine the isolated stations to be replaced, the number of unbalanced stations decreases throughout the day, and is always less than the number of unbalanced stations obtained with the first, second, and third scenarios. Especially, the average number of unbalanced stations decreases from 724 in original journeys to 112 when the proposed strategy with the Z-score outlier detection algorithm is used. The results also show that the best BSS performance in terms of the number of unbalanced stations is achieved when using the Z-score algorithm to detect the isolated stations to be substituted. Recall that for all the compared strategies, no new journeys are added or lost. The real users’ journeys are just locally altered. The results obtained confirm our intuition that the overall availability of BSS resources can be greatly improved by locally modifying certain journeys.
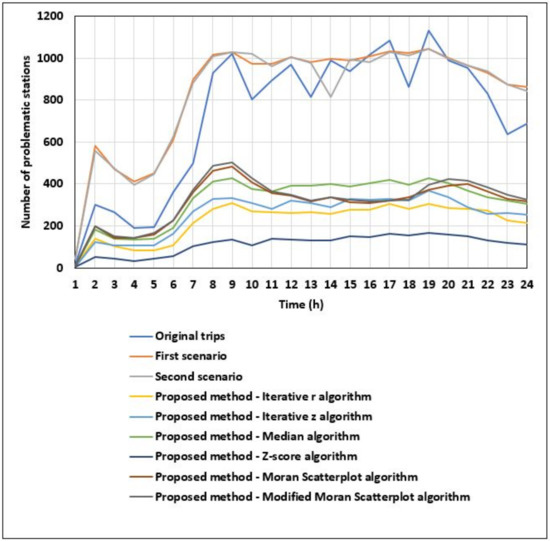
Figure 6.
Comparison of the number of unbalanced stations during the day.
We evaluate in Figure 7, Figure 8, Figure 9, Figure 10, Figure 11 and Figure 12 the efficiency of the new user-based strategy in terms of the number of isolated stations in the BSS. For all the scenarios and the proposed strategy, different spatial outlier detection algorithms were applied to detect the isolated stations. Besides, the spatial outlier detection algorithms were used to determine the stations to be replaced when our proposed strategy is applied to rebalance the BSS. For instance, in Figure 7, the iterative r algorithm is used to determine the number of isolated stations in the three scenarios and when the proposed strategy is applied. The same algorithm is also used to determine the stations to be replaced when our proposed strategy is used to rebalance the BSS. One can notice that when the proposed rebalancing strategy is used and whatever is the spatial outlier algorithm used to select the stations to be substituted, the number of isolated stations decreases significantly, which improves the overall status and performance of the BSS. The results in Figure 13 also show that the best BSS performance in terms of the number of isolated stations is obtained when using the Z-score algorithm to select the isolated stations to be substituted.
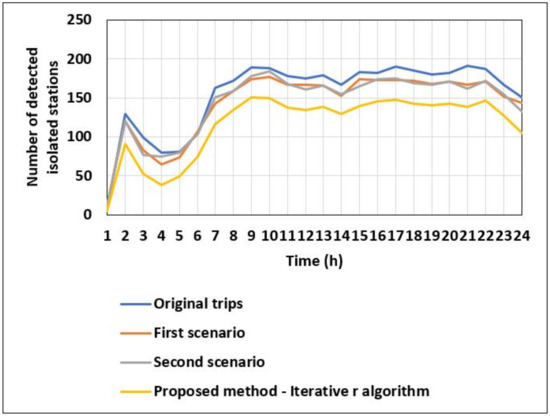
Figure 7.
Comparison of the number of isolated stations during the day for all the tested scenarios. Isolated stations are detected using the iterative r algorithm. The same algorithm is used to determine the stations to be replaced when the proposed rebalancing strategy is performed.
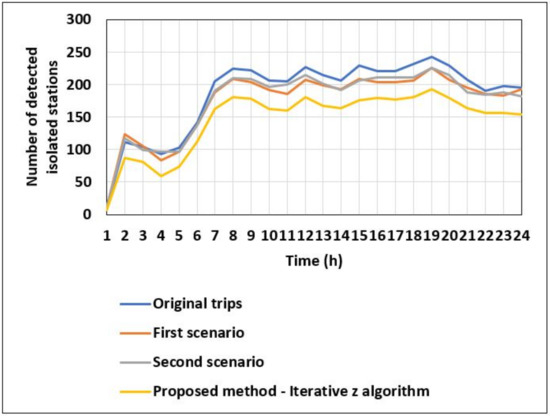
Figure 8.
Comparison of the number of isolated stations during the day for all the tested scenarios. Isolated stations are detected using the iterative z algorithm. The same algorithm is used to determine the stations to be replaced when the proposed rebalancing strategy is performed.
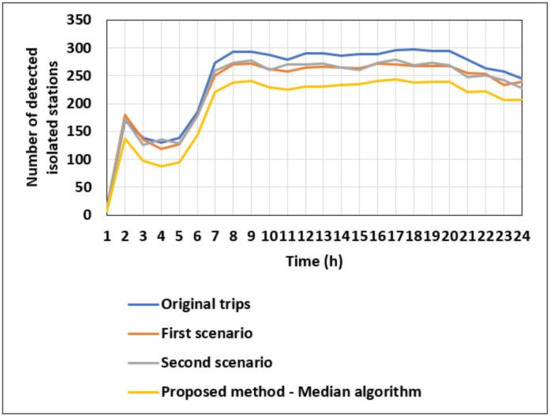
Figure 9.
Comparison of the number of isolated stations during the day for all the tested scenarios. Isolated stations are detected using the Median algorithm. The same algorithm is used to determine the stations to be replaced when the proposed rebalancing strategy is performed.
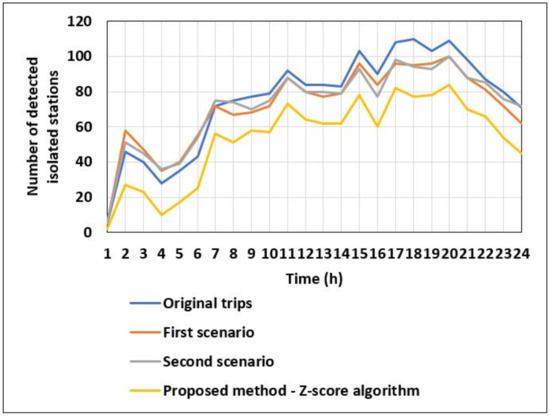
Figure 10.
Comparison of the number of isolated stations during the day for all the tested scenarios. Isolated stations are detected using the Z-score algorithm. The same algorithm is used to determine the stations to be replaced when the proposed rebalancing strategy is performed.
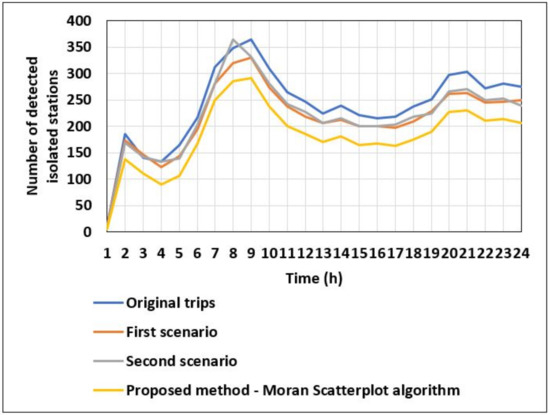
Figure 11.
Comparison of the number of isolated stations during the day for all the tested scenarios. Isolated stations are detected using the Moran Scatterplot algorithm. The same algorithm is used to determine the stations to be replaced when the proposed rebalancing strategy is performed.
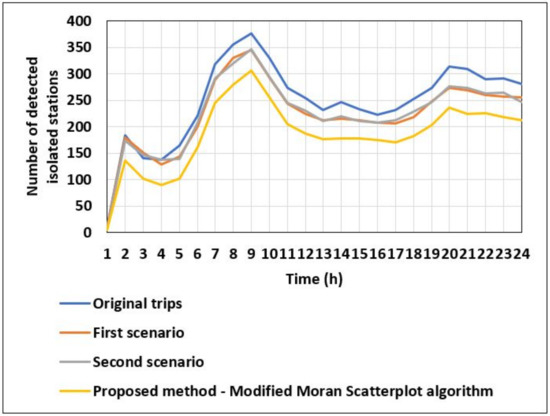
Figure 12.
Comparison of the number of isolated stations during the day for all the tested scenarios. Isolated stations are detected using the Modified Moran Scatterplot algorithm. The same algorithm is used to determine the stations to be replaced when the proposed rebalancing strategy is performed.
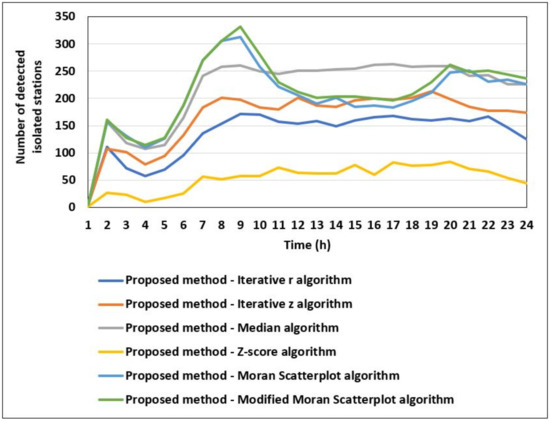
Figure 13.
Comparison of the number of isolated stations during the day according to the used spatial outlier detection algorithm, when the proposed rebalancing strategy is used.
Since the users can accept or decline to modify their departure and/or arrival stations, the users’ collaboration rate can be changed and will affect the BSS performance. To simulate such a real-world scenario, we evaluate in Figure 14 the average number of unbalanced stations during the day based on the participation rate of the users. The results show that the decrease in the average number of unbalanced stations during the day is fast. This is an excellent result, as it is not realistic to expect that all the users will accept collaborating and changing their journeys.
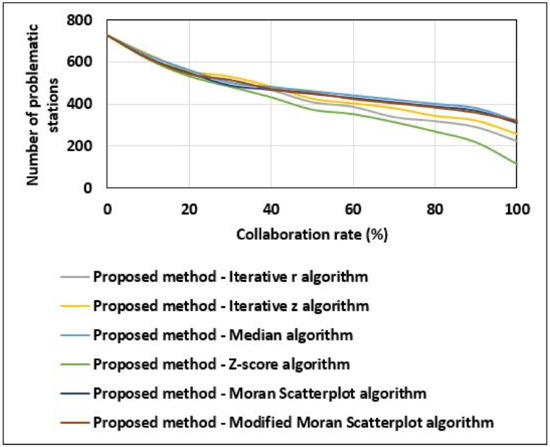
Figure 14.
Evolution of the average number of unbalanced stations during the day according to the collaboration rate of the users.
Finally, Figure 15 depicts the average cumulative duration of station invalidity during the day. The three scenarios described previously and the proposed rebalancing strategy are considered. Results show that the mean cumulative duration of stations’ invalidity during the day has been significantly improved. This duration has largely decreased after applying the proposed rebalancing strategy. For instance, the mean cumulative duration of stations invalidity decreases from 201 min to 133 min using the proposed strategy with the Z-score spatial outlier detection algorithm at the end of the day.
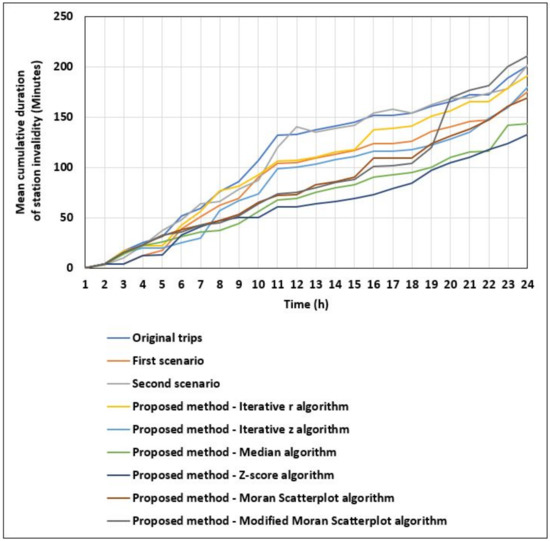
Figure 15.
Comparison of the mean cumulative duration of stations invalidity during the day.
As described earlier, we evaluated using the original trips the number of isolated stations detected using several spatial outlier detection algorithms. The results are shown in the Figure 7, Figure 8, Figure 9, Figure 10, Figure 11 and Figure 12. The results show that before applying any rebalancing strategy, the lowest number of isolated stations were detected by the z-score algorithm, with an average equal to 75.08 stations per day. While the average number of isolated stations detected by the other algorithms was equal to 154.5, 184.9, 244.5, 239.04, and 247.7 with the iterative r, iterative z, Median, Moran Scatterplot, and Modified algorithms Moran Scatterplot, respectively. These results prove that rebalancing the BSS by modifying a high number of stations will not lead to a better performance and stability. This also explains the high performance of our new rebalancing strategy compared to the static rebalancing strategy [5] (scenario 1) and the rebalancing strategy based on peak hours [6] (scenario 2), since in these two scenarios all stations were involved in the rebalancing process.
6. Conclusions
In this paper, we have proposed a new user-based strategy based on the detection of spatial outliers to balance stations in BSS and we have chosen as a use case the bike-sharing system of Paris (Velib). A BSS station is a spatial outlier if it is isolated: almost full or empty while its neighbors are balanced. The isolated stations are caused by the problem of the heterogeneity of the BSS. They cause the unavailability of resources and lead to user dissatisfaction. To detect these isolated stations, we implemented several spatial outlier detection algorithms and proposed replacing these stations with their balanced neighbors. The proposed strategy improves the allocation of resources among the stations of the BSS and thus improves the overall status and performance of the BSS. The experiments and results have shown that the new user-based strategy increases the homogeneity of the BSS by minimizing the number of unbalanced and isolated stations, as well as the average cumulative downtime of stations during the day. These improvements will ultimately lead to an increase in the level of user satisfaction.
The results we obtained in this work prove that our proposed rebalancing strategy is realistic and feasible. The new strategy improves the performance of the Velib bike-sharing system by minimizing the number of problematic stations during the weekdays, especially during peak hours, which makes the BSS perform better. This encourages us to apply and test our strategy to other BSSs where user’s behavior and BSS usage patterns may be different from those of Velib. The approach would also be tested using data from weekends. The cost of the rebalancing process, in terms of the time required to rebalance the system, and the additional walking distance for users will also be assessed in our future work to fully evaluate our proposed strategy. Our current work can also be extended by classifying stations into clusters based on users’ demands in those stations, the similarity of users’ departure/arrival stations, etc., and then applying the rebalancing strategy only within an associated cluster when needed. In our future research on bike-sharing systems, we also plan to work on estimating users’ requests, as the actual data sets do not provide any information on trips that did not take place due to a lack of resources (no bikes available).
Author Contributions
Conceptualization and methodology, R.E.S. and J.B.A.; validation, K.C. and J.D.; writing—original draft preparation, R.E.S. and K.C.; writing—review and editing, J.B.A. and J.D. All authors have read and agreed to the published version of the manuscript.
Funding
This research received no external funding.
Institutional Review Board Statement
Not applicable.
Informed Consent Statement
Not applicable.
Data Availability Statement
The data presented in this study are openly available in https://opendata.paris.fr/explore/dataset/velib-disponibilite-en-temps-reel/export/?disjunctive.name&disjunctive.is_installed&disjunctive.is_renting&disjunctive.is_returning&disjunctive.nom_arrondissement_communes (accessed on 2 January 2021).
Conflicts of Interest
The authors declare no conflict of interest.
References
- Furness, Z. One Less Car: Bicycling and the Politics of Automobility; Temple University Press: Philadelphia, PA, USA, 2010; pp. 55–59. [Google Scholar]
- DeMaio, P.; Gifford, J. Will Smart Bikes Succeed as Public Transportation in the United States. J. Public Transp. 2004, 7, 1–15. [Google Scholar] [CrossRef]
- Fishman, E. Bikeshare: A Review of Recent Literature. Transp. Rev. 2016, 36, 92–113. [Google Scholar] [CrossRef]
- Zhang, Y.; Mi, Z. Environmental benefits of bike sharing: A big data-based analysis. Appl. Energy 2018, 220, 296–301. [Google Scholar] [CrossRef]
- El Sibai, R.; Chabchoub, Y.; Fricker, C. Using spatial outliers detection to assess balancing mechanisms in bike sharing systems. In Proceedings of the 2018 IEEE 32nd International Conference on Advanced Information Networking and Applications (AINA), Krakow, Poland, 16–18 May 2018; IEEE: Piscataway, NJ, USA, 2018; pp. 988–995. [Google Scholar]
- Chabchoub, Y.; El Sibai, R.; Fricker, C. Bike sharing systems: A new incentive rebalancing method based on spatial outliers detection. Int. J. Space Based Situated Comput. 2019, 9, 99–108. [Google Scholar] [CrossRef]
- Ait-Ouahmed, A.; Josselin, D.; Zhou, F. Relocation optimization of electric cars in one-way car-sharing systems: Modeling, exact solving and heuristics algorithms. Int. J. Geogr. Inf. Sci. 2018, 32, 367–398. [Google Scholar] [CrossRef]
- Illgen, S.; Höck, M. Literature review of the vehicle relocation problem in one-way car sharing networks. Transp. Res. Part B Methodol. 2018, 120, 193–204. [Google Scholar] [CrossRef]
- Wong, W.K.; Moore, A.; Cooper, G.; Wagner, M. Rule-based anomaly pattern detection for detecting disease outbreaks. In Proceedings of the AAAI/IAAI, Edmonton, AB, Canada, 28 July—1 August 2002; pp. 217–223. [Google Scholar]
- Boudargham, N.; Abdo, J.B.; Demerjian, J.; Guyeux, C.; Atechian, T. Efficient cluster-based routing algorithm for body sensor networks. In Proceedings of the 2018 IEEE Middle East and North Africa Communications Conference (MENACOMM), Jounieh, Lebanon, 18–20 April 2018; IEEE: Piscataway, NJ, USA, 2018; pp. 1–6. [Google Scholar]
- Boudargham, N.; El Sibai, R.; Abdo, J.B.; Demerjian, J.; Guyeux, C.; Makhoul, A. Toward fast and accurate emergency cases detection in BSNs. IET Wirel. Sens. Syst. 2019, 10, 47–60. [Google Scholar] [CrossRef]
- Zhang, C.; Luo, L.; Xu, W.; Ledwith, V. Use of local Moran’s I and GIS to identify pollution hotspots of Pb in urban soils of Galway, Ireland. Sci. Total. Environ. 2008, 398, 212–221. [Google Scholar] [CrossRef]
- Shekhar, S.; Lu, C.T.; Zhang, P. Detecting graph-based spatial outliers: Algorithms and applications (a summary of results). In Proceedings of the Seventh ACM SIGKDD International Conference on Knowledge Discovery and Data Mining, San Francisco, CA, USA, 26–29 August 2001; ACM: New York, NY, USA, 2001; pp. 371–376. [Google Scholar]
- Chandola, V.; Banerjee, A.; Kumar, V. Anomaly detection: A survey. ACM Comput. Surv. 2009, 41, 15. [Google Scholar] [CrossRef]
- El Sibai, R.; Bou Abdo, J.; Abou Jaoude, C.; Demerjian, J.; Assaker, J.; Makhoul, A. Efficient anomaly detection on sampled data streams with contaminated phase I data. Int. Technol. Lett. 2020, 3, e205. [Google Scholar] [CrossRef]
- Chabchoub, Y.; Fricker, C. Classification of the vélib stations using Kmeans, Dynamic Time Wraping and DBA averaging method. In Proceedings of the 2014 International Workshop on Computational Intelligence for Multimedia Understanding (IWCIM), Paris, France, 1–2 November 2014; IEEE: Piscataway, NJ, USA, 2014; pp. 1–5. [Google Scholar]
- Etienne, C.; Latifa, O. Model-based count series clustering for bike sharing system usage mining: A case study with the Vélib’system of Paris. ACM Trans. Intell. Syst. Technol. 2014, 5, 1–21. [Google Scholar] [CrossRef]
- Fricker, C.; Gast, N. Incentives and redistribution in homogeneous bike-sharing systems with stations of finite capacity. Eur. J. Transp. Logist. 2016, 5, 261–291. [Google Scholar] [CrossRef]
- Froehlich, J.; Neumann, J.; Oliver, N. Sensing and predicting the pulse of the city through shared bicycling. IJCAI 2009, 9, 1420–1426. [Google Scholar]
- Vogel, P.; Greiser, T.; Mattfeld, D.C. Understanding bike-sharing systems using data mining: Exploring activity patterns. Procedia Soc. Behav. Sci. 2011, 20, 514–523. [Google Scholar] [CrossRef]
- Yi, P.; Huang, F.; Peng, J. A Rebalancing Strategy for the Imbalance Problem in Bike-Sharing Systems. Energies 2019, 12, 2578. [Google Scholar] [CrossRef]
- Austwick, M.Z.; O’Brien, O.; Strano, E.; Viana, M. The structure of spatial networks and communities in bicycle sharing systems. PLoS ONE 2013, 8, 1–17. [Google Scholar]
- Borgnat, P.; Abry, P.; Flandrin, P.; Robardet, C.; Rouquier, J.B.; Fleury, E. Shared bicycles in a city: A signal processing and data analysis perspective. Adv. Complex Syst. 2011, 14, 415–438. [Google Scholar] [CrossRef]
- Gast, N.; Massonnet, G.; Reijsbergen, D.; Tribastone, M. Probabilistic forecasts of bike-sharing systems for journey planning. In Proceedings of the 24th ACM International Conference on Information and Knowledge Management, Melbourne, Australia, 19–23 October 2015; ACM: New York, NY, USA, 2015; pp. 703–712. [Google Scholar]
- Morton, C. Appraising the market for bicycle sharing schemes: Perceived service quality, satisfaction, and behavioural intention in London. Case Stud. Transp. Policy 2018, 6, 102–111. [Google Scholar] [CrossRef]
- Nikitas, A. Understanding bike-sharing acceptability and expected usage patterns in the context of a small city novel to the concept: A story of ‘Greek Drama’. Transp. Res. Part F Traffic Psychol. Behav. 2018, 56, 306–321. [Google Scholar] [CrossRef]
- Bakogiannis, E.; Siti, M.; Tsigdinos, S.; Vassi, A.; Nikitas, A. Monitoring the first dockless bike sharing system in Greece: Understanding user perceptions, usage patterns and adoption barriers. Res. Transp. Bus. Manag. 2019, 33, 100432. [Google Scholar] [CrossRef]
- Nikitas, A. How to save bike-sharing: An evidence-based survival toolkit for policy-makers and mobility providers. Sustainability 2019, 11, 3206. [Google Scholar] [CrossRef]
- Eren, E.; Uz, V.E. A review on bike-sharing: The factors affecting bike-sharing demand. Sustain. Cities Soc. 2020, 54, 101882. [Google Scholar] [CrossRef]
- Ban, S.; Hyun, K.H. Designing a user participation-based bike rebalancing service. Sustainability 2019, 11, 2396. [Google Scholar] [CrossRef]
- Singla, A.; Santoni, M.; Bartók, G.; Mukerji, P.; Meenen, M.; Krause, A. Incentivizing Users for Balancing Bike Sharing Systems. In Proceedings of the Twenty-Ninth AAAI Conference on Artificial Intelligence (AAAI 2015), Austin, TX, USA, 25–30 January 2015; pp. 723–729. [Google Scholar]
- Chen, J.; Yang, Z.; Shu, Y.; Cheng, P. Rebalance Bike-Sharing System With Deep Sequential Learning. IEEE Intell. Transp. Syst. Mag. 2020, 1–7. [Google Scholar] [CrossRef]
- Jin, X.; Tong, D. Station-Free Bike Rebalancing Analysis: Scale, Modeling, and Computational Challenges. ISPRS Int. J. Geo Inf. 2020, 9, 691. [Google Scholar] [CrossRef]
- Freund, D.; Norouzi-Fard, A.; Paul, A.; Wang, C.; Henderson, S.G.; Shmoys, D.B. Data-driven rebalancing methods for bike-share systems. In Analytics for the Sharing Economy: Mathematics, Engineering and Business Perspectives; Springer: Berlin/Heidelberg, Germany, 2020; pp. 255–278. [Google Scholar]
- Ren, C.; An, L.; Gu, Z.; Wang, Y.; Gao, Y. Rebalancing the car-sharing system with reinforcement learning. World Wide Web 2020, 23, 2491–2511. [Google Scholar] [CrossRef]
- Chemla, D.; Meunier, F.; Calvo, R.W. Bike sharing systems: Solving the static rebalancing problem. Discret. Optim. 2013, 10, 120–146. [Google Scholar] [CrossRef]
- Forma, I.A.; Raviv, T.; Tzur, M. A 3-step math heuristic for the static repositioning problem in bike-sharing systems. Transp. Res. Part B Methodol. 2015, 71, 230–247. [Google Scholar] [CrossRef]
- Dell’Amico, M.; Iori, M.; Novellani, S.; Subramanian, A. The bike sharing rebalancing problem with stochastic demands. Transp. Res. Part B Methodol. 2018, 118, 362–380. [Google Scholar] [CrossRef]
- Chiariotti, F.; Pielli, C.; Zanella, A.; Zorzi, M. A dynamic approach to rebalancing bike-sharing systems. Sensors 2018, 18, 512. [Google Scholar] [CrossRef]
- Faghih-Imani, A.; Hampshire, R.; Marla, L.; Eluru, N. An empirical analysis of bike sharing usage and rebalancing: Evidence from Barcelona and Seville. Transp. Res. Part A Policy Pract. 2017, 97, 177–191. [Google Scholar] [CrossRef]
- Luo, H.; Zhao, F.; Chen, W.Q.; Cai, H. Optimizing bike sharing systems from the life cycle greenhouse gas emissions perspective. Transp. Res. Part C Emerg. Technol. 2020, 117, 102705. [Google Scholar] [CrossRef]
- Cruz, F.; Subramanian, A.; Bruck, B.P.; Iori, M. A heuristic algorithm for a single vehicle static bike sharing rebalancing problem. Comput. Oper. Res. 2017, 79, 19–33. [Google Scholar] [CrossRef]
- Haider, Z.; Nikolaev, A.; Kang, J.E.; Kwon, C. Inventory rebalancing through pricing in public bike sharing systems. Eur. J. Oper. Res. 2018, 270, 103–117. [Google Scholar] [CrossRef]
- Pfrommer, J.; Warrington, J.; Schildbach, G.; Morari, M. Dynamic vehicle redistribution and online price incentives in shared mobility systems. arXiv 2013, arXiv:1304.3949. [Google Scholar] [CrossRef]
- Legros, B. Dynamic repositioning strategy in a bike-sharing system; how to prioritize and how to rebalance a bike station. Eur. J. Oper. Res. 2019, 272, 740–753. [Google Scholar] [CrossRef]
- Cressie, N. Straight line fitting and variogram estimation (with discussion). Bull. Int. Stat. Inst. 1979, 48, 573–582. [Google Scholar]
- Cressie, N. Fitting variogram models by weighted least squares. J. Int. Assoc. Math. Geol. 1985, 17, 563–586. [Google Scholar] [CrossRef]
- Haslett, J.; Bradley, R.; Craig, P.; Unwin, A.; Wills, G. Dynamic graphics for exploring spatial data with application to locating global and local anomalies. Am. Stat. 1991, 45, 234–242. [Google Scholar]
- Akoglu, L.; Tong, H.; Koutra, D. Graph based Anomaly Detection and Description: A Survey. Data Min. Knowl. Discov. 2015, 29, 626–688. [Google Scholar] [CrossRef]
- Anselin, L. The Moran Scatterplot as an ESDA Tool to Assess Local Instability in Spatial Association; Regional Research Institute, West Virginia University: Morgantown, WV, USA, 1993. [Google Scholar]
- Haining, R. Spatial Data Analysis in the Social and Environmental Sciences; Cambridge University Press: Cambridge, UK, 1993. [Google Scholar]
- Shekhar, S.; Lu, C.T.; Zhang, P. A unified approach to detecting spatial outliers. GeoInformatica 2003, 7, 139–166. [Google Scholar] [CrossRef]
- Lu, C.T.; Chen, D.; Kou, Y. Algorithms for spatial outlier detection. In Proceedings of the Third IEEE International Conference on Data Mining, Melbourne, FL, USA, 22–22 November 2003; IEEE: Piscataway, NJ, USA, 2003; pp. 597–600. [Google Scholar]
- Qiu, L.Y.; He, L.Y. Bike Sharing and the Economy, the Environment, and Health-Related Externalities. Sustainability 2018, 10, 1145. [Google Scholar] [CrossRef]
- Tout sur Vélib. 2014. Available online: http://blog.velib.paris.fr/blog/2014/07/15/7-ans-de-velib-des-records-de-frequentation-et-dabonnements/ (accessed on 2 January 2021).


Publisher’s Note: MDPI stays neutral with regard to jurisdictional claims in published maps and institutional affiliations. |
© 2021 by the authors. Licensee MDPI, Basel, Switzerland. This article is an open access article distributed under the terms and conditions of the Creative Commons Attribution (CC BY) license (http://creativecommons.org/licenses/by/4.0/).