Article

Waste to Wealth: Value Recovery from Bakery Wastes

by
Mugilan Govindaraju
1,2,
Kathiresan V. Sathasivam
1,* and
Kasi Marimuthu
1
1
Department of Biotechnology, Faculty of Applied Sciences, AIMST University, Batu 3 1/2, Bukit Air Nasi, Jalan Bedong-Semeling, Bedong 08100, Kedah, Malaysia
2
Fairy Food Industries Sdn Bhd, Plot 6491, Jalan Ayam Didik 2/2, Kawasan Perindustrian Ringan Taman Ria Jaya, Sungai Petani 08000, Kedah, Malaysia
*
Author to whom correspondence should be addressed.
Sustainability 2021, 13(5), 2835; https://doi.org/10.3390/su13052835
Submission received: 11 February 2021 / Revised: 28 February 2021 / Accepted: 1 March 2021 / Published: 5 March 2021
(This article belongs to the Section Environmental Sustainability and Applications)

Abstract

:
Compost is considered a soil-amending product that can be used for soil improvement and to increase the productivity of organic vegetable crops. Composting can be an alternative solution for solid waste management. In this research, the efficacy of various bakery wastes and bulking agents, such as cow dung, to produce compost were studied. The bin composting method was applied in this research. Commercial effective microorganism was used to study its effectiveness in composting bakery waste compared to common ways of composting. Six compost trials were designed by using different ratios of feedstocks such as creamy and non-creamy bakery waste, paper boxes, eggshells, cow dung, dry leaves, and effective microorganism (EM). For the assessment of the maturity, stability, and quality of the compost, various physical and chemical parameters were routinely monitored, including temperature, pH, electrical conductivity (EC), moisture content, water holding capacity (WHC), phytotoxicity and color intensity of water extract, total organic carbon (TOC), total nitrogen (N), phosphorus (P), potassium (K), and C/N ratio. All six compost trials reached the four important phases of temperature, which are the mesophilic phase, thermophilic phase, second mesophilic phase (cooling phase), and maturation phase. The pH, EC, N, P, and K of every compost trial complied with standard compost requirements. Phytotoxicity study proved that all the compost trials were phytotoxic-free when tested with Phaseolus vulgaris (green bean). The water holding capacity of all six trials ranged from 2.18 to 4.30 g water/g dry material. Various compost trials achieved C/N ratios ranging from 12.01 to 14.48, which is considered within the satisfactory limit. The results showed that bakery waste can be turned into compost, with its quality complying with standard requirement.

1. Introduction

Food waste is a biodegradable discharge from various sources, which eventually affects the environment, population health, and sustainable development [1]. According to FAO, nearly 1.6 billion tonnes of food—including fresh vegetables, fruits, meat, bakery, and dairy products—are lost along the food supply chain. This amounts to a loss of an estimated USD 2.6 trillion [2]. The amount of food waste has been projected to increase in the next 25 years due to economic and population growth, mainly in the Asian countries. In Asia alone, food waste could rise from 278 to 416 million tonnes from 2005 to 2025 [3]. Annually, 28% of the world’s agricultural lands are used to produce food that is lost or wasted. Apart from these resource wastages, the carbon footprint of food waste contributes 3.3 billion tonnes of greenhouse gas, namely CO2, into the atmosphere per year [4]. Traditionally, food wastes are either incinerated or dumped in open areas. This undoubtedly causes severe health and environmental issues. Incineration of food waste results in the release of dioxins [5], which are highly toxic and will lead to several other environmental problems. Hence, suitable techniques need to be in place to manage food waste [6].
The bakery industry is among the world’s major food industries, with various production scales and processes. Traditionally, bakery wastes are a coalescence of different types of wastes, and thus have varied composition [7]. In 2009, it was reported that nearly 800,000 tonnes of bakery waste is disposed of in the UK annually [8]. Bakery wastes are rich in nutrients that can be utilized in other industries but end up in dumping grounds. Several works to convert bakery waste into useful products have been reported. Zhang et al. [9] have demonstrated the novel use of bakery waste as a generic feedstock for the sustainable production of succinic acid as a platform chemical in food waste biorefinery. Han et al. [10] developed a bioconversion method of turning bakery waste into value-added products in a sustainable way.
Compost is produced through a bio-oxidative process involving the mineralization and partial humification of the organic matter. The final product will be stable, free of phytotoxicity, free of pathogens, and with certain humic properties [11]. Compost can be applied as a soil conditioner or organic fertilizer since it is rich in nutrients for the soil. Moreover, compost rich in microbial communities such as bacteria, fungi, and worms can also stabilize the degradable organic matter [12]. Studies reported that a large variety of mesophilic, thermos-tolerant, and thermophilic aerobic microorganisms, including bacteria, actinomycetes, yeasts, and various other fungi, have been extensively found in composts and other self-heating organic materials [13]. Compost has most of its essential nutrients in the organic forms. Hence, they are released slowly, and leaching issues are less likely to occur compared to inorganic fertilizer. This is one of the supportive criteria of compost, which enable it to become a choice of organic vegetable farmers [14].
Our sponsor claims that over one ton of bakery wastes are being disposed of monthly in their plant. Large amounts of dairy-product-based wastes may lead to serious consequences such as pest issues, strong garbage smells, and high maintenance and storage costs. Those bakery wastes are rich in nutrients, which can be utilized in other industries but end up in dumping grounds. Wastes such as cake and bread wastes are good carbon and nitrogen sources, which can be composted into organic fertilizer using bulking agents such as cow manure. Therefore, composting can be an alternative solution for solid waste management. Increase of waste can be controlled through composting, where useful products can be produced from waste [12]. Wet and odorous organic waste can also be transformed into an aesthetically acceptable, drier, decomposed, and reusable product if the composting is conducted in the correct way [15]. Maintenance costs can be reduced if those wastes are converted into something reusable.
The conversion of bakery waste into compost, to the best of our knowledge, has never been reported. We are of the opinion that the high variedness of bakery waste is probably the reason why there is limited research in this area.
As such, we attempt to add value to these bakery wastes instead of disposing them into the environment. Here, we have described and explored several parameters including the physiochemical properties, temperature, pH, EC, moisture, and water holding capacity. The framework of this study also included determination of nutrient content of the final product and phytotoxicity studies.

2. Materials and Methods

2.1. Collection of Feedstocks

Bakery waste consisting of cake skins, cake waste, and expired breads and cakes was collected separately from Fairy Food Industries Sdn. Bhd., in Sungai Petani, Kedah. The bakery waste was crushed into smaller parts (less than 2 cm) and mixed to improve uniformity [11]. Non-biodegradable materials such as plastics, foil, and wrappers were removed from the bakery waste. Paper boxes were collected from a recycling items storage area on the Fairy premise. Only plain paper boxes without coloured inks were chosen for composting. The boxes were shredded into smaller pieces, less than 5 cm, and stored in a plastic bag. Cow dung was collected from a nearby dairy farm located in Sungai Petani. Fresh cow dung was dried in shed for 7 days [16]. Dry leaves were collected from AIMST University and Fairy’s surrounding compounds and stockpiled in plastic bags. Eggshells left after the egg-cracking process were collected from Fairy Food Industries Sdn. Bhd.’s manufacturing site. After the collection, the eggshells were cleaned with tap water to remove albumen, dirt, or any impurities found on the eggshells [11,16,17,18].

2.2. Characteristics of the Feedstock

All the feedstock used for the composting determined its pH, electrical conductivity, moisture content, total organic carbon (TOC), nitrogen, phosphorus, potassium and C/N ratio. Nitrogen was determined by using the Kjeldahl method [18]. Phosphorus and potassium were determined using ICP-OES [19]. The TOC was determined using a total organic carbon analyzer. The results of TOC and nitrogen were used to determine the C/N ratio of each type of feedstock [20].

2.3. Composting Bin

Eighteen-liter (18 L) plastic bins of similar types, with dimensions 38 cm × 31 cm, were collected from a recycling items storage area at Fairy Food Industries Sdn. Bhd. Holes of 4 mm were drilled surrounding the pails in similar order to facilitate the aeration process. The number of holes and the distance between every hole were kept the same for all the composting bins.

2.4. Preparation of Microbial Inoculant

Commercial effective microorganism (EM) and molasses were purchased from EMRO Malaysia Sdn. Bhd. For the activation, one part EM microbial inoculants and one part molasses were mixed with 18 parts of chlorine-free water (1:1:18). This solution was then stored for three to five days in an airtight expandable container (non-glass) for fermentation until the pH was below 3.5. Built up gas was released once daily [21].

2.5. Composting

For beginning the composting, the feedstocks were added to the piles by alternating between green and brown materials [22]. The compost materials were covered with plastic sheets to trap the heat during the composting process [23,24]. For piles with inoculation with EM, a 1 L EM solution was used to spray each layer of feedstock in the pile while alternating between green and brown materials. Six compost trials were created. Bakery waste (BW), cow dung (CD), dry leaves (DL), paper boxes (PB), and eggshells (ES) were mixed as stated in Table 1 below:
All trials were replicated 3 times. The compost trials were turned at weekly intervals using garden forks. Turning was performed until the compost temperature was not increasing after turning [11,24].

2.6. Physicochemical Analysis of Compost

For every physical and chemical analysis performed, samples were made by mixing five subsamples taken from five points in the pile [15].

2.6.1. Determination of pH and Electrical Conductivity

The pH and electrical conductivity of the compost trials were taken weekly by using IONIX digital pH meter and HANNA DiST 4 HI98304 electrical conductivity tester. The compost solution was made by adding distilled water into compost sample in w/v 1:10 ratio. It was placed for 2 h at room temperature (25 °C) to dissolve the maximum salts [15,20,25,26].

2.6.2. Determination of Moisture Content

Moisture content was recorded on a weekly basis. Ten grams (10 g) of each compost sample was dried in an electric oven at 105 °C. The process was carried out until a constant weight was obtained. Moisture content was adjusted at each turning time and maintained by the addition of distilled water [11,20,24,27,28,29].
Moisture   Content   =   Wet   weight   of   sample   W 1 Dry   weight   of   sample   W 2 Wet   weight   of   sample   W 1   × 100 %
where W1 refers to compost weight before drying (in grams) and W2 refers to compost weight after drying.

2.6.3. Determination of Temperature

Temperature of the compost was measured using a compost thermometer on a daily basis over the entire experimental duration until there was no increase in temperature. The temperature was taken from a constant depth at the centre of the compost system and 4 other different spots surrounding the compost. Once there was no increase in temperature, the compost trials were allowed to mature for a period of 8 weeks with no turning [26,30].

2.6.4. Determination of Water Holding Capacity (WHC)

A wet sample of known initial moisture content was weighed (Wi) and placed in a beaker. After soaking in water for 2 days and draining the excess water through a Whatman No. 2 filter paper, the saturated sample was weighed again (Ws). WHC is the amount of water retained by the dry sample [15]. The WHC (g water/g dry material) was calculated based on the formula below:
WHC   =   Ws     Wi     +   MC   ×   Wi 1     MC   ×   Wi   ×   100 %
where Wi is the initial weight of sample (g), Ws is the final weight of sample (g), and MC is the initial moisture content of sample.

2.6.5. Nitrogen, Phosphorus, Potassium (N,P,K), and Total Organic Carbon (TOC) Analysis of End Product

The samples were screened through a 10 mm sieve and kept in airtight plastic bags. The N, P, K content and total organic carbon (TOC) were analyzed for the end products. Nitrogen was determined by using the Kjeldahl method [18]. Phosphorus and potassium were determined using ICP-OES [19]. TOC was determined using a total organic carbon analyzer [20].

2.6.6. Color Intensity of Water Extract

Aqueous compost extracts were prepared from 10 g of solid (dry basis) with 100 mL of distilled water (1:10). After soaking for 2 h, the extracts were filtered using Whatman No.2 filter paper. The aqueous extracts’ colors for each compost trial were then compared [31].

2.6.7. Determination of Phytotoxicity

Phytotoxicity was evaluated based on the effects on seed germination and root growth of aqueous compost extracts prepared from 1.5 g of solid (dry basis) with 15 mL of distilled water (1:10) and shaken for one hour in an orbital shaker at room temperature. The compost solutions were filtered using Whatman No.2 filter paper, and 5 mL from each compost trial’s extract was placed in each Petri dish with 10 seeds of Phaseolus vulgaris [32]. Three replicates were done per sample. The Petri dishes were left at room temperature in dark conditions for 72 h. A control test was prepared with distilled water. The Petri dishes were sealed with parafilm to minimize water loss while allowing air penetration. The number of germinated seeds and their root length were measured after 72 h [24,33]. According to Zucconi et al. [34], the relative seed germination (RSG), relative root elongation (RRE), and germination index (GI) were calculated using the following formulation:
RSG   % =   Number   of   seeds   germinated   in   the   aqueous   extract   Number   of   seeds   germinated   in   control     × 100 %
RRE   % =   Mean   root   length   in   the   aqueous   extract Mean   root   length   in   control × 100 %
GI   % =   RSG × RRE   100

2.7. Statistical Analysis

The experimental data were analysed statistically by one-way analysis of variance (ANOVA) at 95% confidence level using SPSS Version 21.

3. Results and Discussion

3.1. Physicochemical Properties

3.1.1. Analysis of Compost Feedstocks

It is essential to perform analysis of every feedstock to obtain a high level of accuracy when assessing feedstocks for developing compost recipes. Feedstocks or input materials will influence not only the nutrient contents of the finished compost; they also ensure the stable humus content of the end product and the composition of the microbial population. The abundant presence of microorganisms in cow dung enhances the fast decomposition process once there are sufficient levels of moisture and oxygen.
The dry leaves provide aeration and thereby help to enable air penetration to all parts of the compost pile, including its core [31]. The technical preparation of the feedstocks also plays an important role in guaranteeing a good composting process. The initial C/N ratio of the starting mixture has to be kept between 20 and 40, with sufficient moisture content for proper microbial activity. Carbon serves primarily as a food source, and nitrogen is the primary constituent of protein [31,35]. In this study, the initial C/N ratio for C1, C2, C3, C4, C5, and C6 were 41.68, 41.14, 41.68, 41.14, 33.81, and 33.38, respectively. Table 2 shows the analysis results of compost feedstocks. In this study, creamy bakery waste, non-creamy bakery waste, dry leaves, and paper boxes were large contributors of carbon sources for the compost. However, creamy bakery waste, non-creamy bakery waste, and cow dung were large contributors of nitrogen sources. Less than 1% of phosphorus and potassium were contributed by all six feedstocks. The results show that the moisture content of the cow dung was high compared to other feedstocks used. The bakery wastes, cow dung, and eggshells showed a C/N ratio < 30. According to Chai, feedstock with a C/N ratio < 30 can be used as a nitrogen source in composting. The C/N ratios of cow dung, paper boxes, and dry leaves match with the standard values reported by Cooperband [36]. Paper boxes and dry leaves have high carbon content and are therefore used as carbon sources for composting in this study. In this study, cow dung [37] and eggshells [38] recorded high pHs, which were more than 9.0 due to their alkaline natures. However, dry leaves’ pH value falls in the acidic range and bakery waste’s pH ranged between 6.01 and 6.53. Feedstocks with a pH of between 6 and 8 are within the normal range, and dairy manure is typically high-pH [39]. The electrical conductivity (EC) ranged between 0.11 and 2.42. Table 3 shows the key parameters for organic composting and the recommended range.

3.1.2. Temperature Analysis of Compost Trials

The temperature profile of every compost trial is depicted in Figure 1. Throughout the composting period, there were four common composting phases that were clearly identified: a mesophilic phase, a thermophilic phase, a cooling phase, and a maturation phase [42]. Temperature profile is vital to verify that there was a good thermophilic and mesophilic range, and consequently, a good biodegradation and compost produced. The mesophilic phase at the beginning is usually short-lasting, taking only a couple of days due to active microbial activity, which leads to a quick temperature rise. The thermophilic phase plays a vital role in composting to ensure the safety of compost from pathogens [31,43,44]. The mesophilic microbes rapidly breakdown the soluble, readily degradable compounds and cause a rapid increase in compost temperature. Once temperatures exceed 40 °C, the heat-loving thermophilic microbes replace mesophilic microorganisms as it becomes less competitive. The thermophilic stage will begin after 40 °C. During the thermophilic stage, breakdown of proteins, fats, and complex carbohydrates like cellulose and hemicellulose, the major structural molecules in plants, will be accelerated by high temperatures. As the time progress, the temperature of the compost gradually decreases as the supply of these compounds becomes exhausted, and mesophilic microorganisms once again take over for the final phase of maturation of the remaining organic matter [11,45]. Some studies reported that thermophilic temperatures are approximately from 45 °C to 70 °C [46,47]. In a composting project by Hashemi et al. [48] using 5 L plastic buckets, a temperature range between 25 °C and 60 °C was recorded. However, the smaller compost systems are not likely to get as hot as compost in large piles or windrows. A well-designed indoor compost system, >10 gallons in volume, can heat up to 40 to 50 °C. A soda bottle bioreactor, because it is so small, is more likely to peak at temperatures of 40–45 °C [45]. In this study, starting from the first day, the core temperature of compost trials had started to increase above 40 °C. The temperature rise above 40 °C was observed until day 20. Maximum temperature reached by the compost trials was 50 °C. Although in these composting trials hygienization temperature was not achieved, high temperature ranges (above 40 °C) were achieved in the composting process. The one-way ANOVA statistical analysis showed that there are significant differences between the temperature profiles of each compost trial. According to Ayilara et al. [49], the volume of the wastes treated sometimes determines the temperature or heat generation; if the volume of waste is low, a high temperature may not be attained. Sometimes the temperature during composting does not rise to hygienization temperature, but pathogens could die due to exhausted nutrients present in the composting materials, and when competitive organisms excrete enzymes that are capable of destroying the pathogens. Aeration provides the necessary aerobic conditions for rapid and odourless decomposition of the organic matter and the generation of thermophilic conditions with high temperatures that will allow the destruction of pathogens. During composting, a continuous supply of fresh air is required for the aerobic microorganisms to maintain their metabolic activities. Aeration also plays a role in controlling the temperature and moisture content [50]. In this study, aeration was provided by performing turning the compost pile using a shovel. It was done weekly. Some researchers suggested turning be performed in 1-week intervals [51] and 10-day intervals [50]. The mean values of compost temperature were stable starting from day 65. Moreover, after 90 days, the compost trials were left undisturbed for maturation, where no turnings were performed. According to Palaniveloo et al. [35], at the end of the composting phase, the amount of readily available substrates becomes a limiting factor, resulting in a decline in microbial activity, which implies reduced oxygen uptake and heat output. Therefore, the temperature profile was not continued after day 90 and the compost trials were left to mature until Day 119.

3.1.3. pH Analysis of Compost Trials

The pH profiles of the compost trials are shown in Figure 2. In this study, at the beginning of the composting process, all of the trials were acidic, and as the composting process progressed, the pH increased. At the end of the composting period, overall pH ranged between 6.0 and 8.0. A pH between 5.5 and 8.0 is the optimum range for composting, which was observed during this composting study [50]. The increase in pH value throughout the composting was as a consequence of the degradation and mineralization of organic compounds [52]. According to Wurff et al. [31], organic matters are comprised of easily degradable compounds such as sugars and proteins. Bacteria are better competitors compared to fungi for easily degradable carbon sources. Thus, fungi are quickly outcompeted by bacteria. At the mesophilic stage, bacteria such as Lactobacillus and Acetobacter are often present and produce organic acids such as lactic and acetic acids. The acidic condition at the beginning of composting was due to the accumulation of these organic acids. However, as the composting progresses, other groups of bacteria, usually present in the composting pile, degrade these organic acids quickly. As the temperature continues to rise, microorganisms adapted to higher temperatures gradually replace the mesophilic bacteria and fungi. The one-way ANOVA test revealed significant differences between the pHs of the compost trials.

3.1.4. Moisture Content Analysis of Compost Trials

Figure 3 shows the moisture content recorded for every week throughout the composting process. During the composting process, the presence of water is essential for microbial growth. The moisture content needs to be controlled at the proper level in order to achieve optimum degradation and to assist in the dissipation of heat [50]. At the beginning of the composting process, the moisture contents of all the trials were low due to the addition of various dry feedstocks such as food waste, dry leaves, paper boxes, and eggshells. During the 7th day and 14th day of composting, the moisture content was recorded as being as low as 34.63%. This was due to the thermophilic stage of the compost. According to Chaher et al. [42], the moisture content declines during the composting process due to the degradation of feedstock and the heat generated by microbial activity, temperature variation, and water evaporation. The optimum moisture content for compost lies between 40% and 65% by weight [20,29]. The values match with this research’s findings, where at the ending of the maturation phase (day 91), the moisture contents recorded for all the compost trials were within the range of 40–65%. Significant differences were noticed between each compost trial according to the one-way ANOVA statistical analysis. Moisture content above 65% will hinder the process of decomposition, promote nutrient leaching, and may initiate anaerobic degradation due to lack of oxygen, since the interparticle air spaces within the compost are filled with water [50]. Slowing of biological activities or inactivation of microbial activities will happen when the moisture content is below 40%. Therefore, only dried compost with moisture content of below 40% should be packaged in order to prevent the development of anaerobic spots within the packaging [29,50].

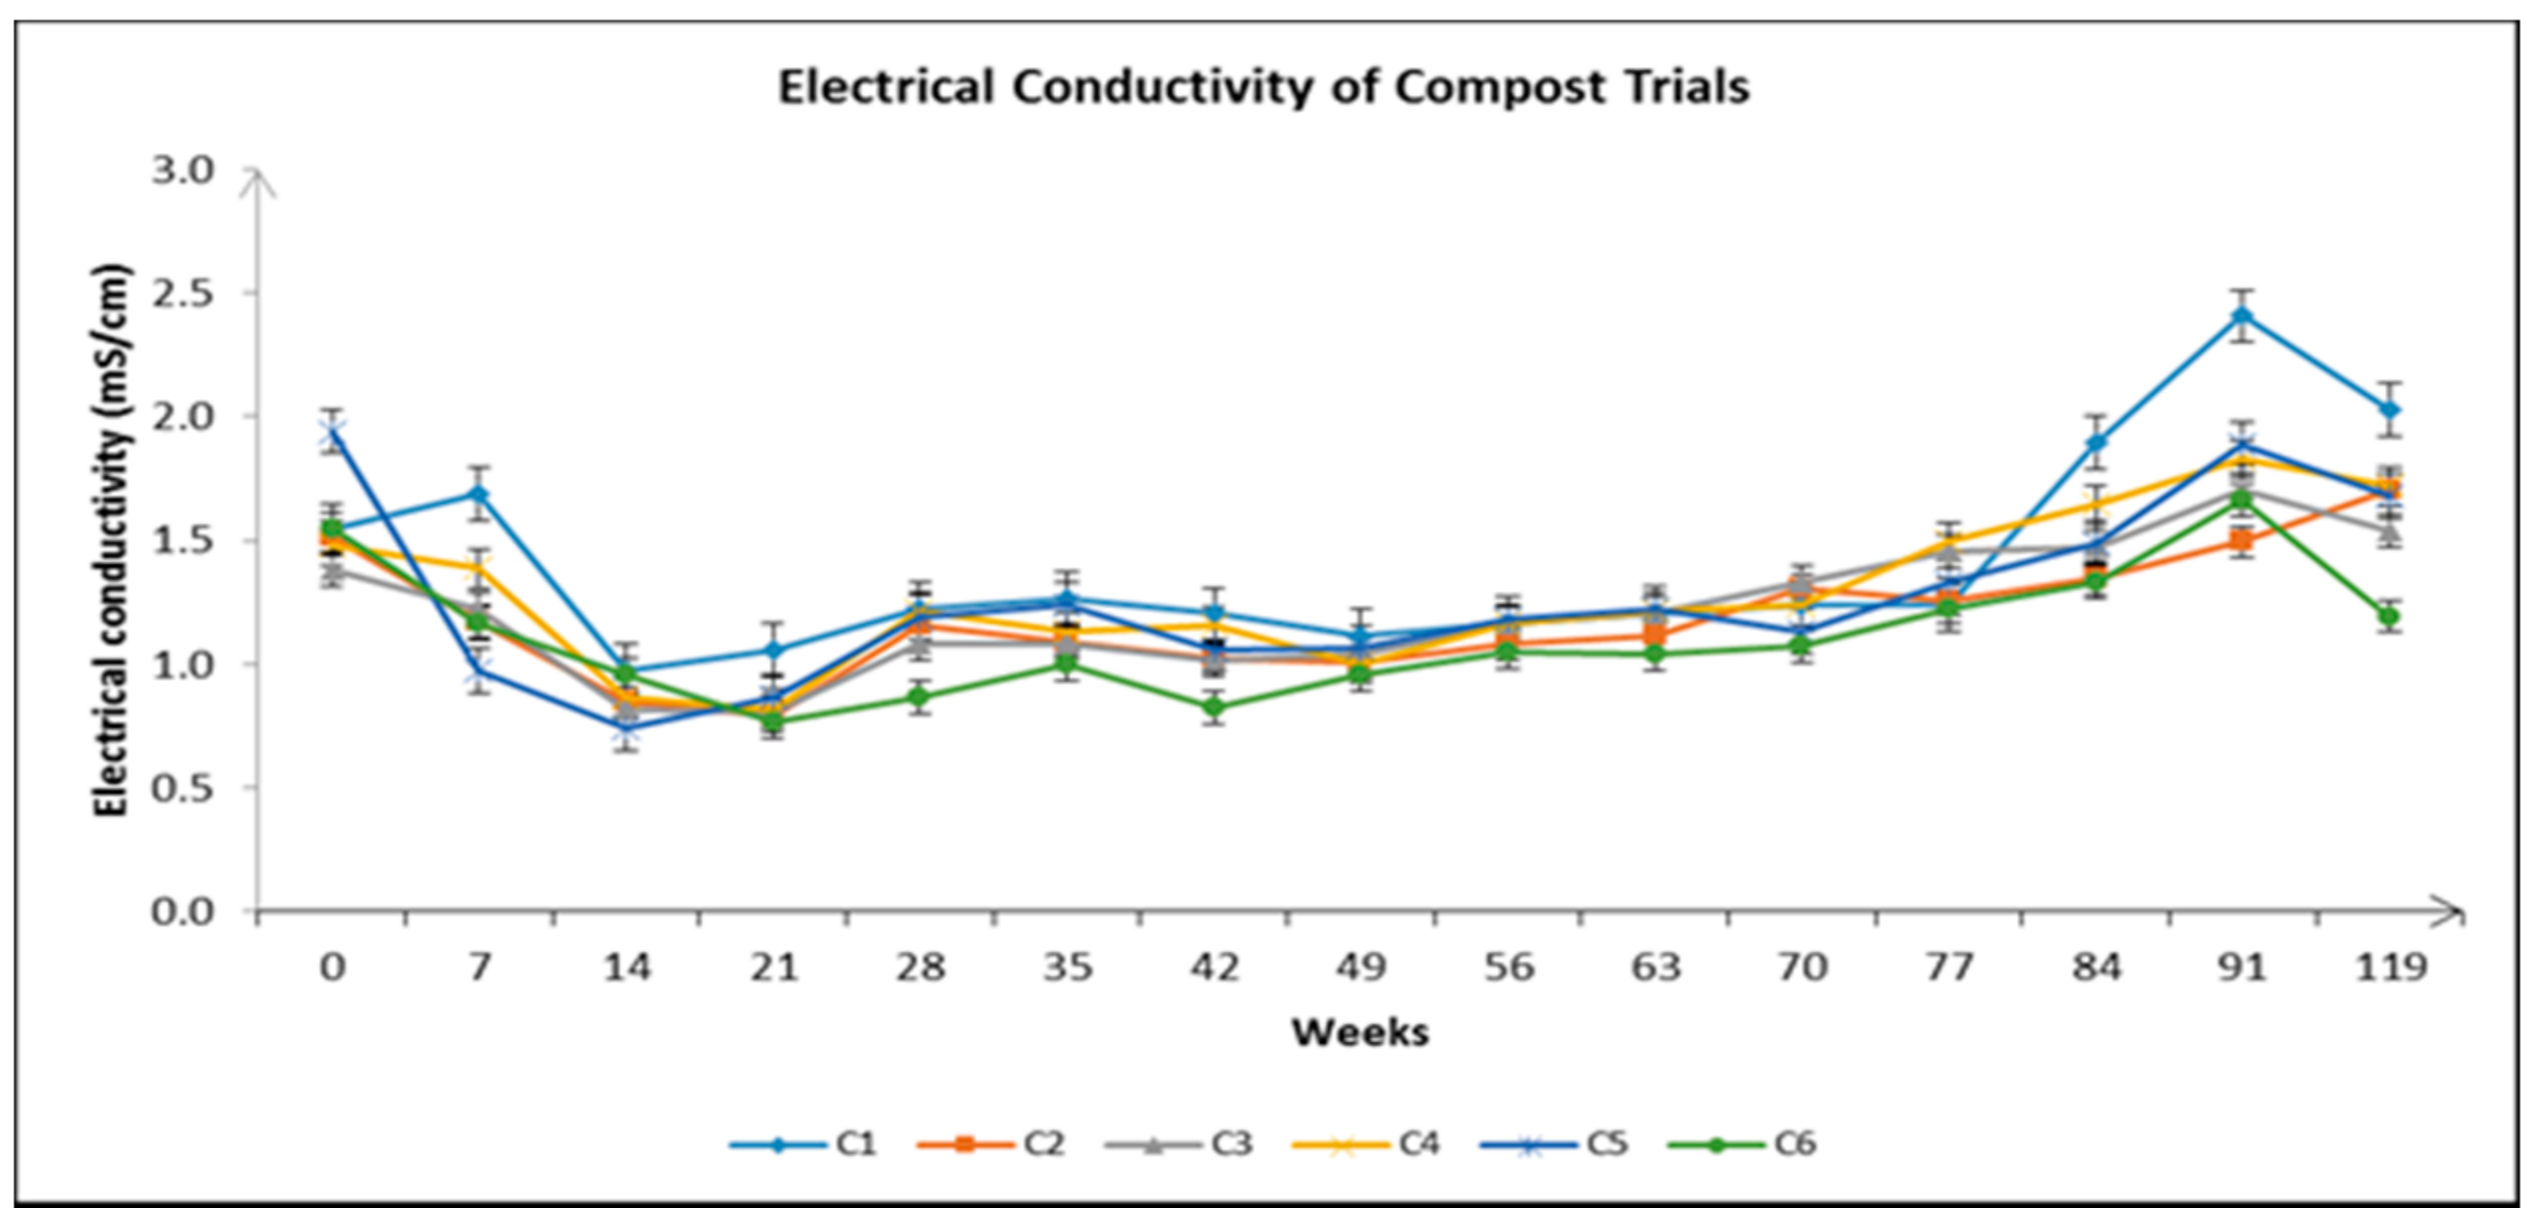
3.1.5. Electrical Conductivity Analysis of Compost Trials

Electrical conductivity (EC) indicates the level of dissolved salts by measuring the ability of a solution to carry an electric current by ions (Figure 4). Due to higher electrical conductivity, a plant may lose its productivity. In agricultural field, electrical conductivity is a limiting factor of plant growth and seed germination [8]. In this study, at the end of 119th day, all the compost trials have shown EC values ranging between 1.13 and 2.14 mS/cm. The highest EC values were shown by C1 (non-creamy bakery waste without EM), and the lowest value was shown by C6 (creamy bakery waste with eggshells and EM culture). The one-way ANOVA results showed that there is significant difference between each compost trial. Most of the past research studies proved that electrical conductivity of less than 4.0 mS/cm is the optimum for most of the plants [15,26,50,53]. Based on A&L Canada Laboratories [54], the compost may be used directly as a media for small plants and seeding if the EC ratio is between 0 and 2.0. However, if it is between 2.0 to 3.5, it may be used for transplanting potted plants and mature plants with high nutrient demand. In applications with tender plants, the compost may need to be diluted with 25–50% soil.

3.1.6. Water Holding Capacity (WHC) Analysis of Compost Trials

Water holding capacities recorded at the end of the composting process are shown in Figure 5. The water holding capacities recorded in this study ranged from 1.91 to 5.14 g water/g dry sample. The lowest value of water holding capacity was found in the compost trial C5, with non-creamy bakery waste with EM culture and eggshells. However, the highest value was recorded in the compost trial C3, with creamy bakery waste with EM culture. Results showed that the compost trials with eggshells have lower water holding capacity compared to other compost trials. The water holding capacity of compost trials in ascending order is C5 < C6 < C1 < C4 < C2 < C3. The values obtained in this study almost match with a previous study by Khater [15] on compost made up of cow manure and plant residues, where it was reported that water holding capacity ranged from 3.50 to 4.40 g water/g dry sample. The C3 water holding capacity is the highest compared to others, followed by C2. It might be due to the hydrophobic nature of creamy bakery waste found in the compost, which repels water and increases the water content in the compost matrix. The least water holding capacity found in compost trials was with eggshells. It was reported that the chemical composition of the eggshell is 94% calcium carbonate, 1% magnesium carbonate, 1% calcium phosphate, and approximately 4% organic matter [55]. High levels of CaCO3 in the eggshell are able to absorb more water [56]. This might be the reason for less water in the compost matrix. The one-way ANOVA results showed that there are significant differences between water holding capacity of the compost trials.

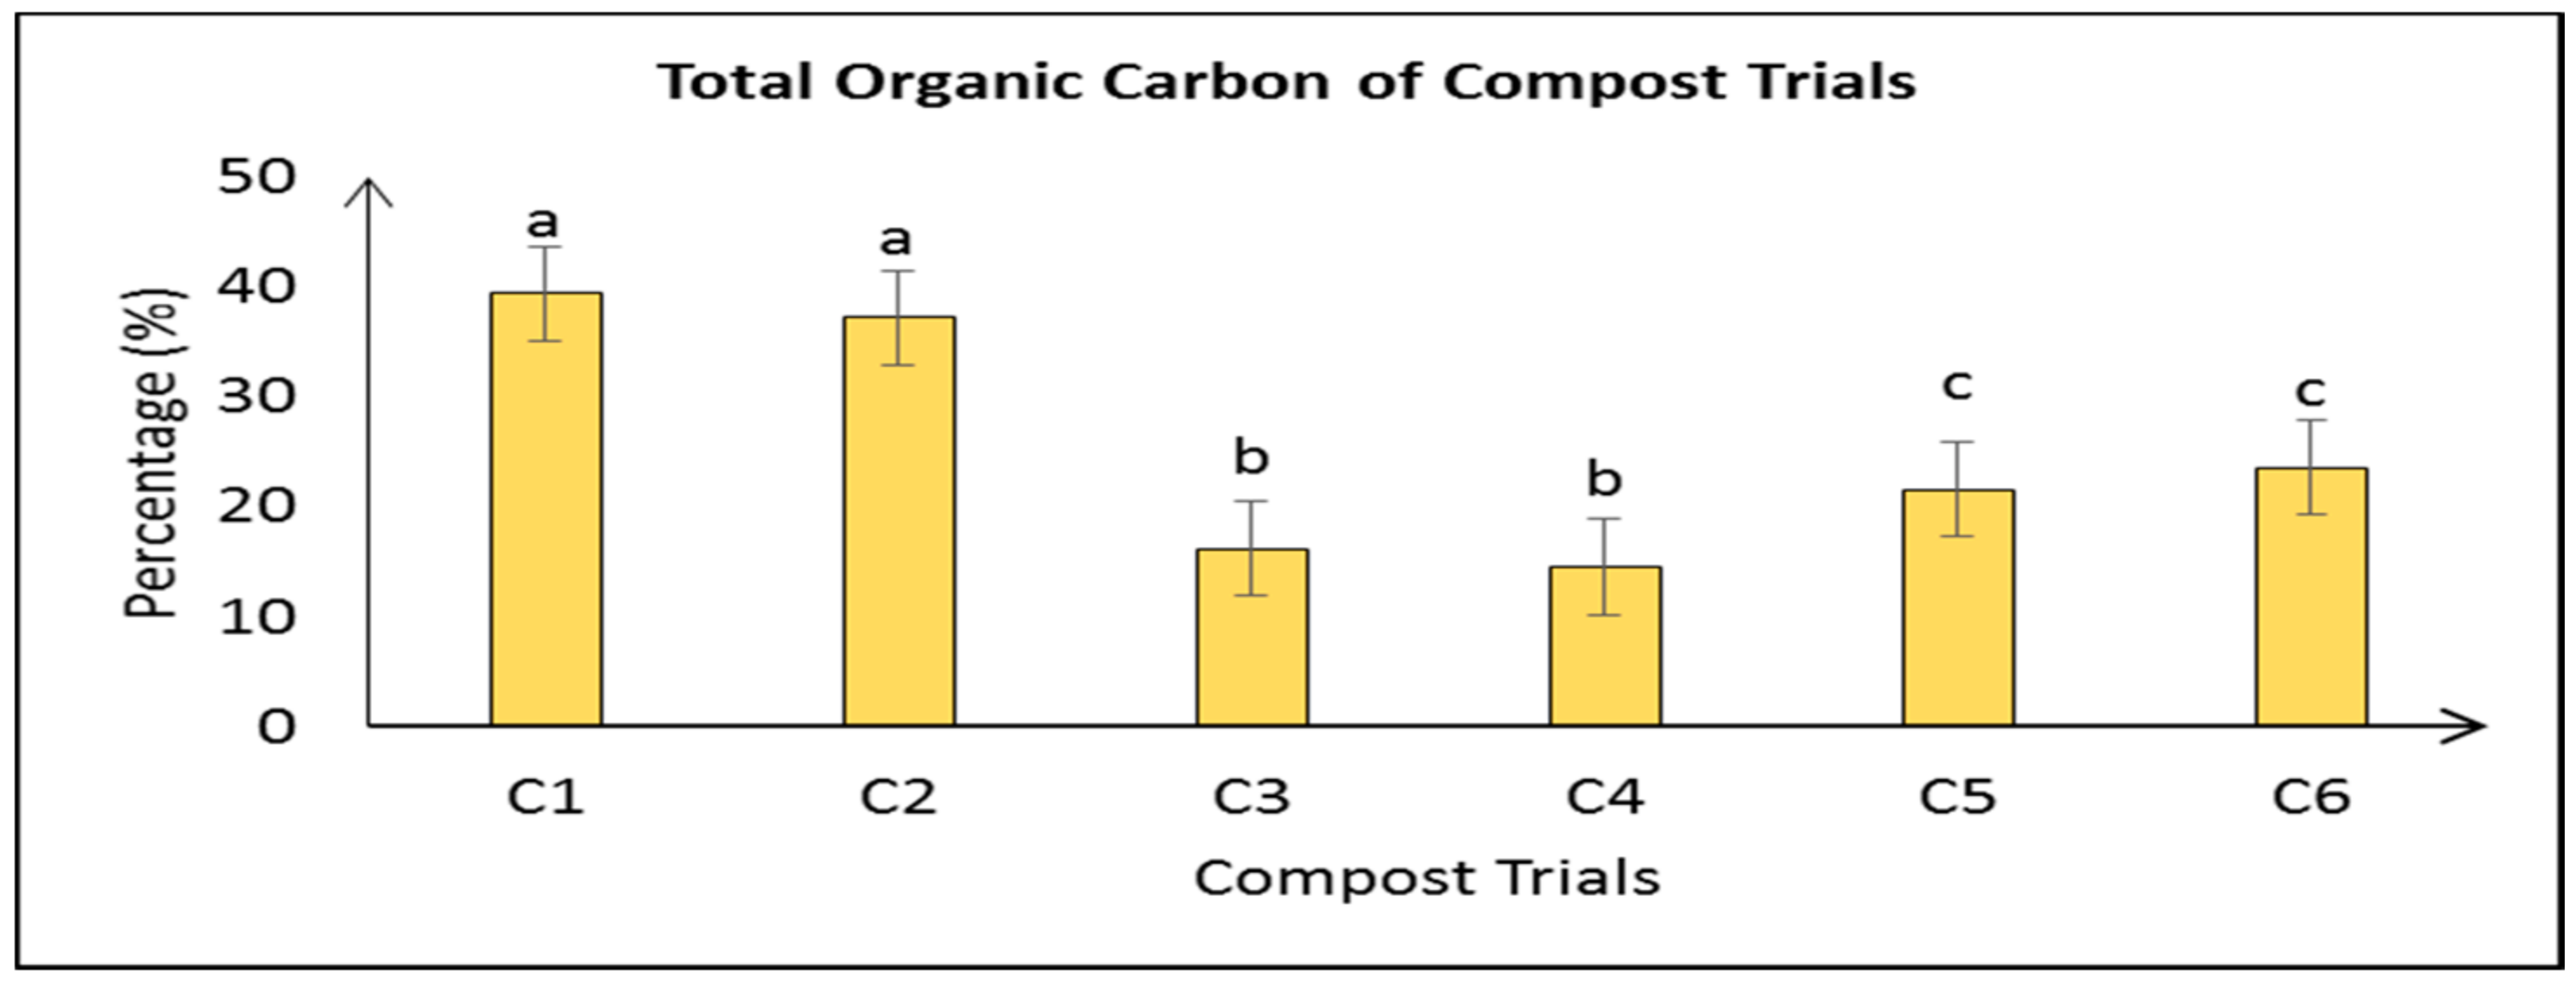
3.1.7. NPK and TOC Analysis on Compost Trials

The nitrogen, phosphorus, potassium, and total organic carbon (TOC) values obtained for the end products are shown in Figure 6 and Figure 7, respectively. Lower organic carbon was recorded in the compost trials with EM culture. This might be due to high degradation of carbon by microbes in EM as found by Daur [57]. Similar findings were reported by Kadir et al. [12], Khater [15], and Mutairi et al. [58]. Total organic carbon (TOC) values obtained during this study were similar to those in the study conducted by Khater [15]. The results obtained in our study complies with the standard N, P, K values of compost as suggested by Weitbrecht et al. [59]. The one-way ANOVA results showed that significant differences were observed between N, P, K, and TOC values of compost trials. It was noticed that the compost trials with eggshells (C5 & C6) showed reduced N, P, and K values compared to the other trials. Studies by Elamin et al. [60] show that the nitrogen and phosphorus amount will be reduced in the presence of calcium carbonate, which is the main component of eggshells. This is possibly due to the adverse effect of calcium carbonate on the availability of nitrogen by increasing ammonia volatilization. Monteith and Sherman [61] reported that phosphorus availability might be reduced in the presence of calcium carbonate where phosphorus fixation is increased. In a calcareous environment, potassium fixation might be overriding and result in a lower value of potassium [62].

3.1.8. C/N Ratio of Compost Trials

The C/N ratio of every compost trial after 120 days is presented in Figure 8. C/N ratio is one of the crucial parameters affecting the microbiology of compost. It plays a vital role in detecting the maturation of compost and classifying the quality of the compost produced. According to Jiménez and García [63], a C/N value between 10 and 20 is within the acceptable range for mature compost. A C/N ratio of <20 is considered as acceptable, but a C/N ratio of <12–15 is the preferred range that indicates proper compost maturity [52,64]. A study by Neves [11] on high-lipid-content food produced compost with a C/N ratio of 10–18. The C/N ratio in this study ranged from 5.32 to 14.48. The highest C/N ratio was obtained from C2, and the lowest ratio obtained from C4. For compost trials C1, C2, C5, and C6, the C/N ratio was within the acceptable range. However, the compost trials C3 and C4 showed C/N ratios of less than 10. Compost trials C5 and C6 proved that the addition of eggshells improved the C/N ratio of the compost, as the trials without the addition of eggshells, C3 and C4, showed C/N ratios less than 10. Similar to a study by Neves [11], the addition of creamy bakery waste in this study was not impeditive of a faster achievement of compost maturity. On the contrary, creamy bakery waste gave similar results as non-creamy bakery waste. The statistical analysis of one-way ANOVA showed that there is a significant difference between the C/N ratios of compost trials.

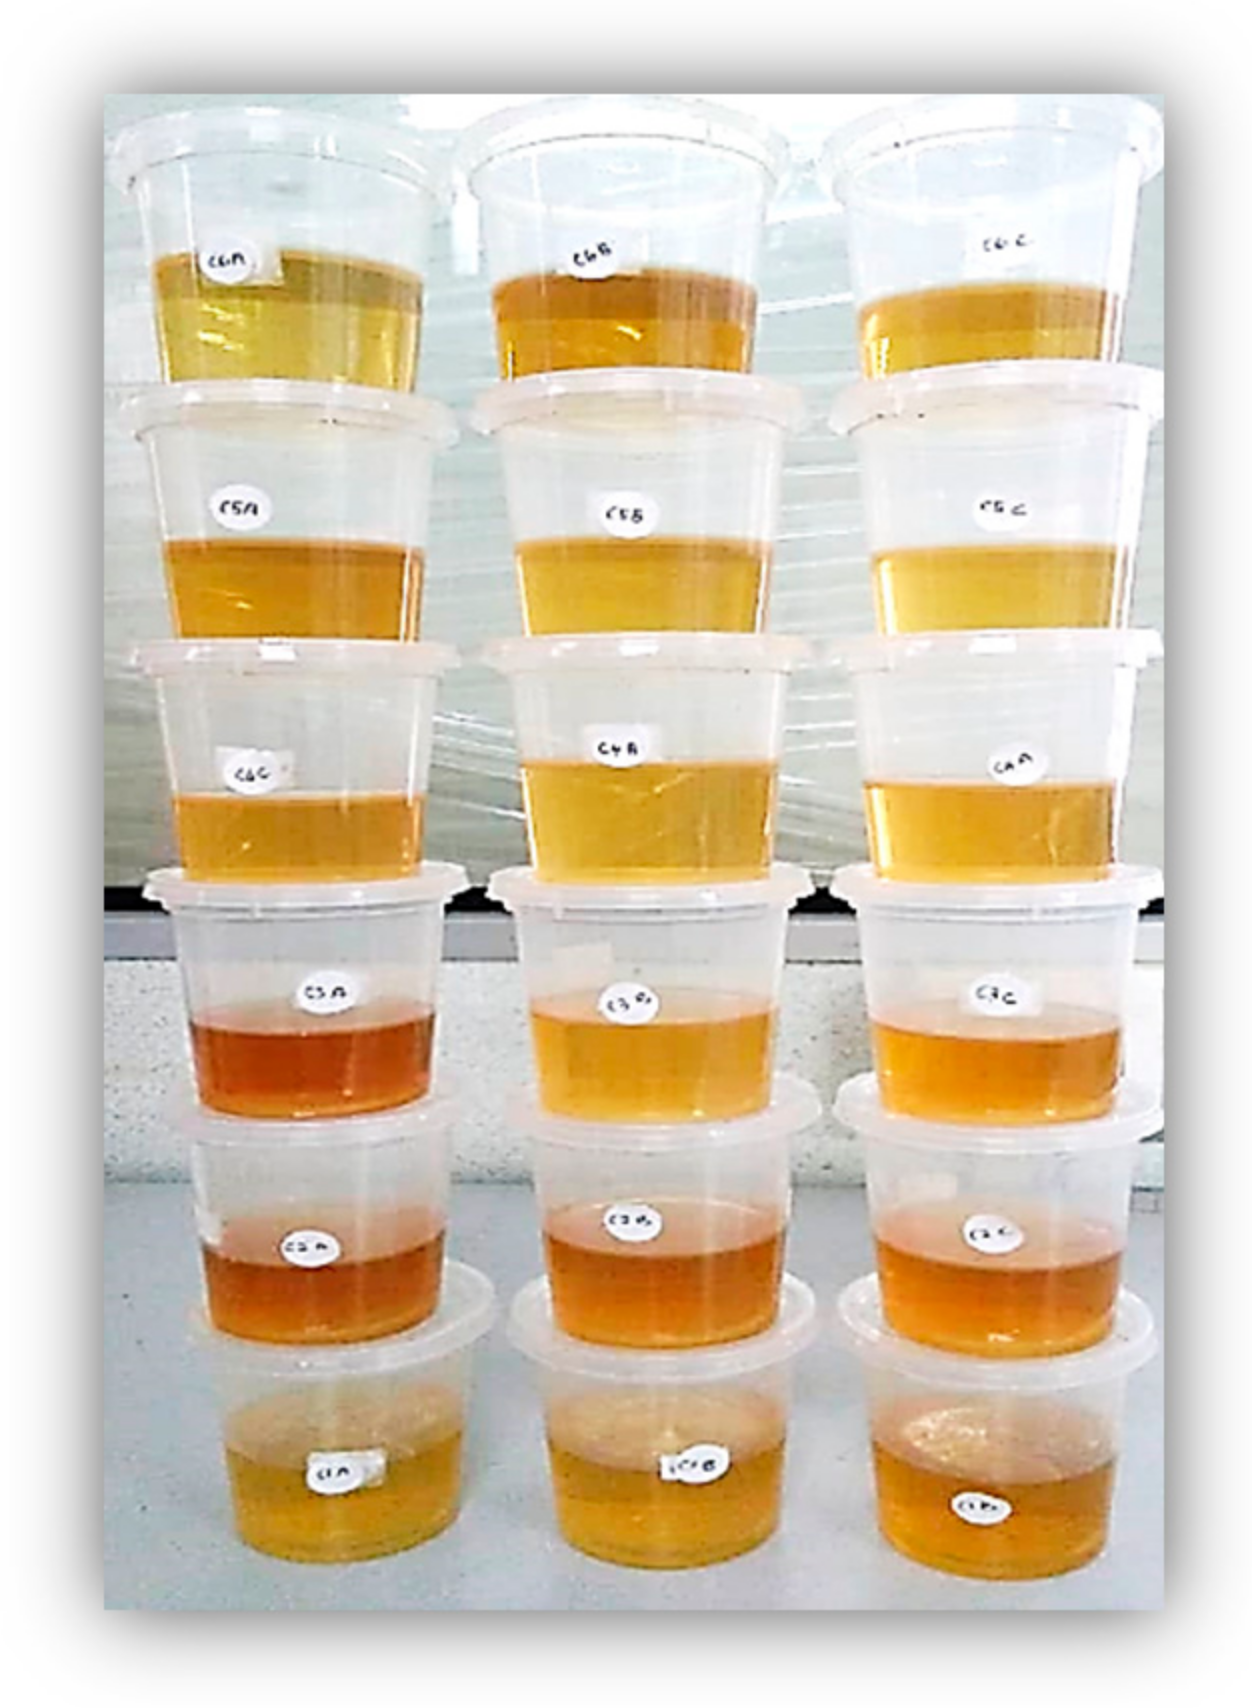
3.1.9. The Color Intensity of Water Extract of Compost Trials

Figure 9 shows the color intensity of water extract of compost trials. The color intensity of water extract of compost can be used as an indication of the maturity of the compost. The water extract from a young lignin-rich compost will be dark, and its color becomes lighter with increasing maturity. This is because the humus molecules present in young composts are small and soluble in water. During the maturation of compost, the microorganisms construct more complex humus molecules that are no longer soluble, thus making the extract lighter. However, the darkness of the extract of young compost can also depend on the composition of the starting mixture [31]. In this study, the color intensity of C2 and C3 (comprised of creamy bakery waste) showed a slightly darker water extract, but all other compost trials recorded light brown water extract. The dark color extracts of C2 and C3 might be due to the effect of creamy feedstocks.

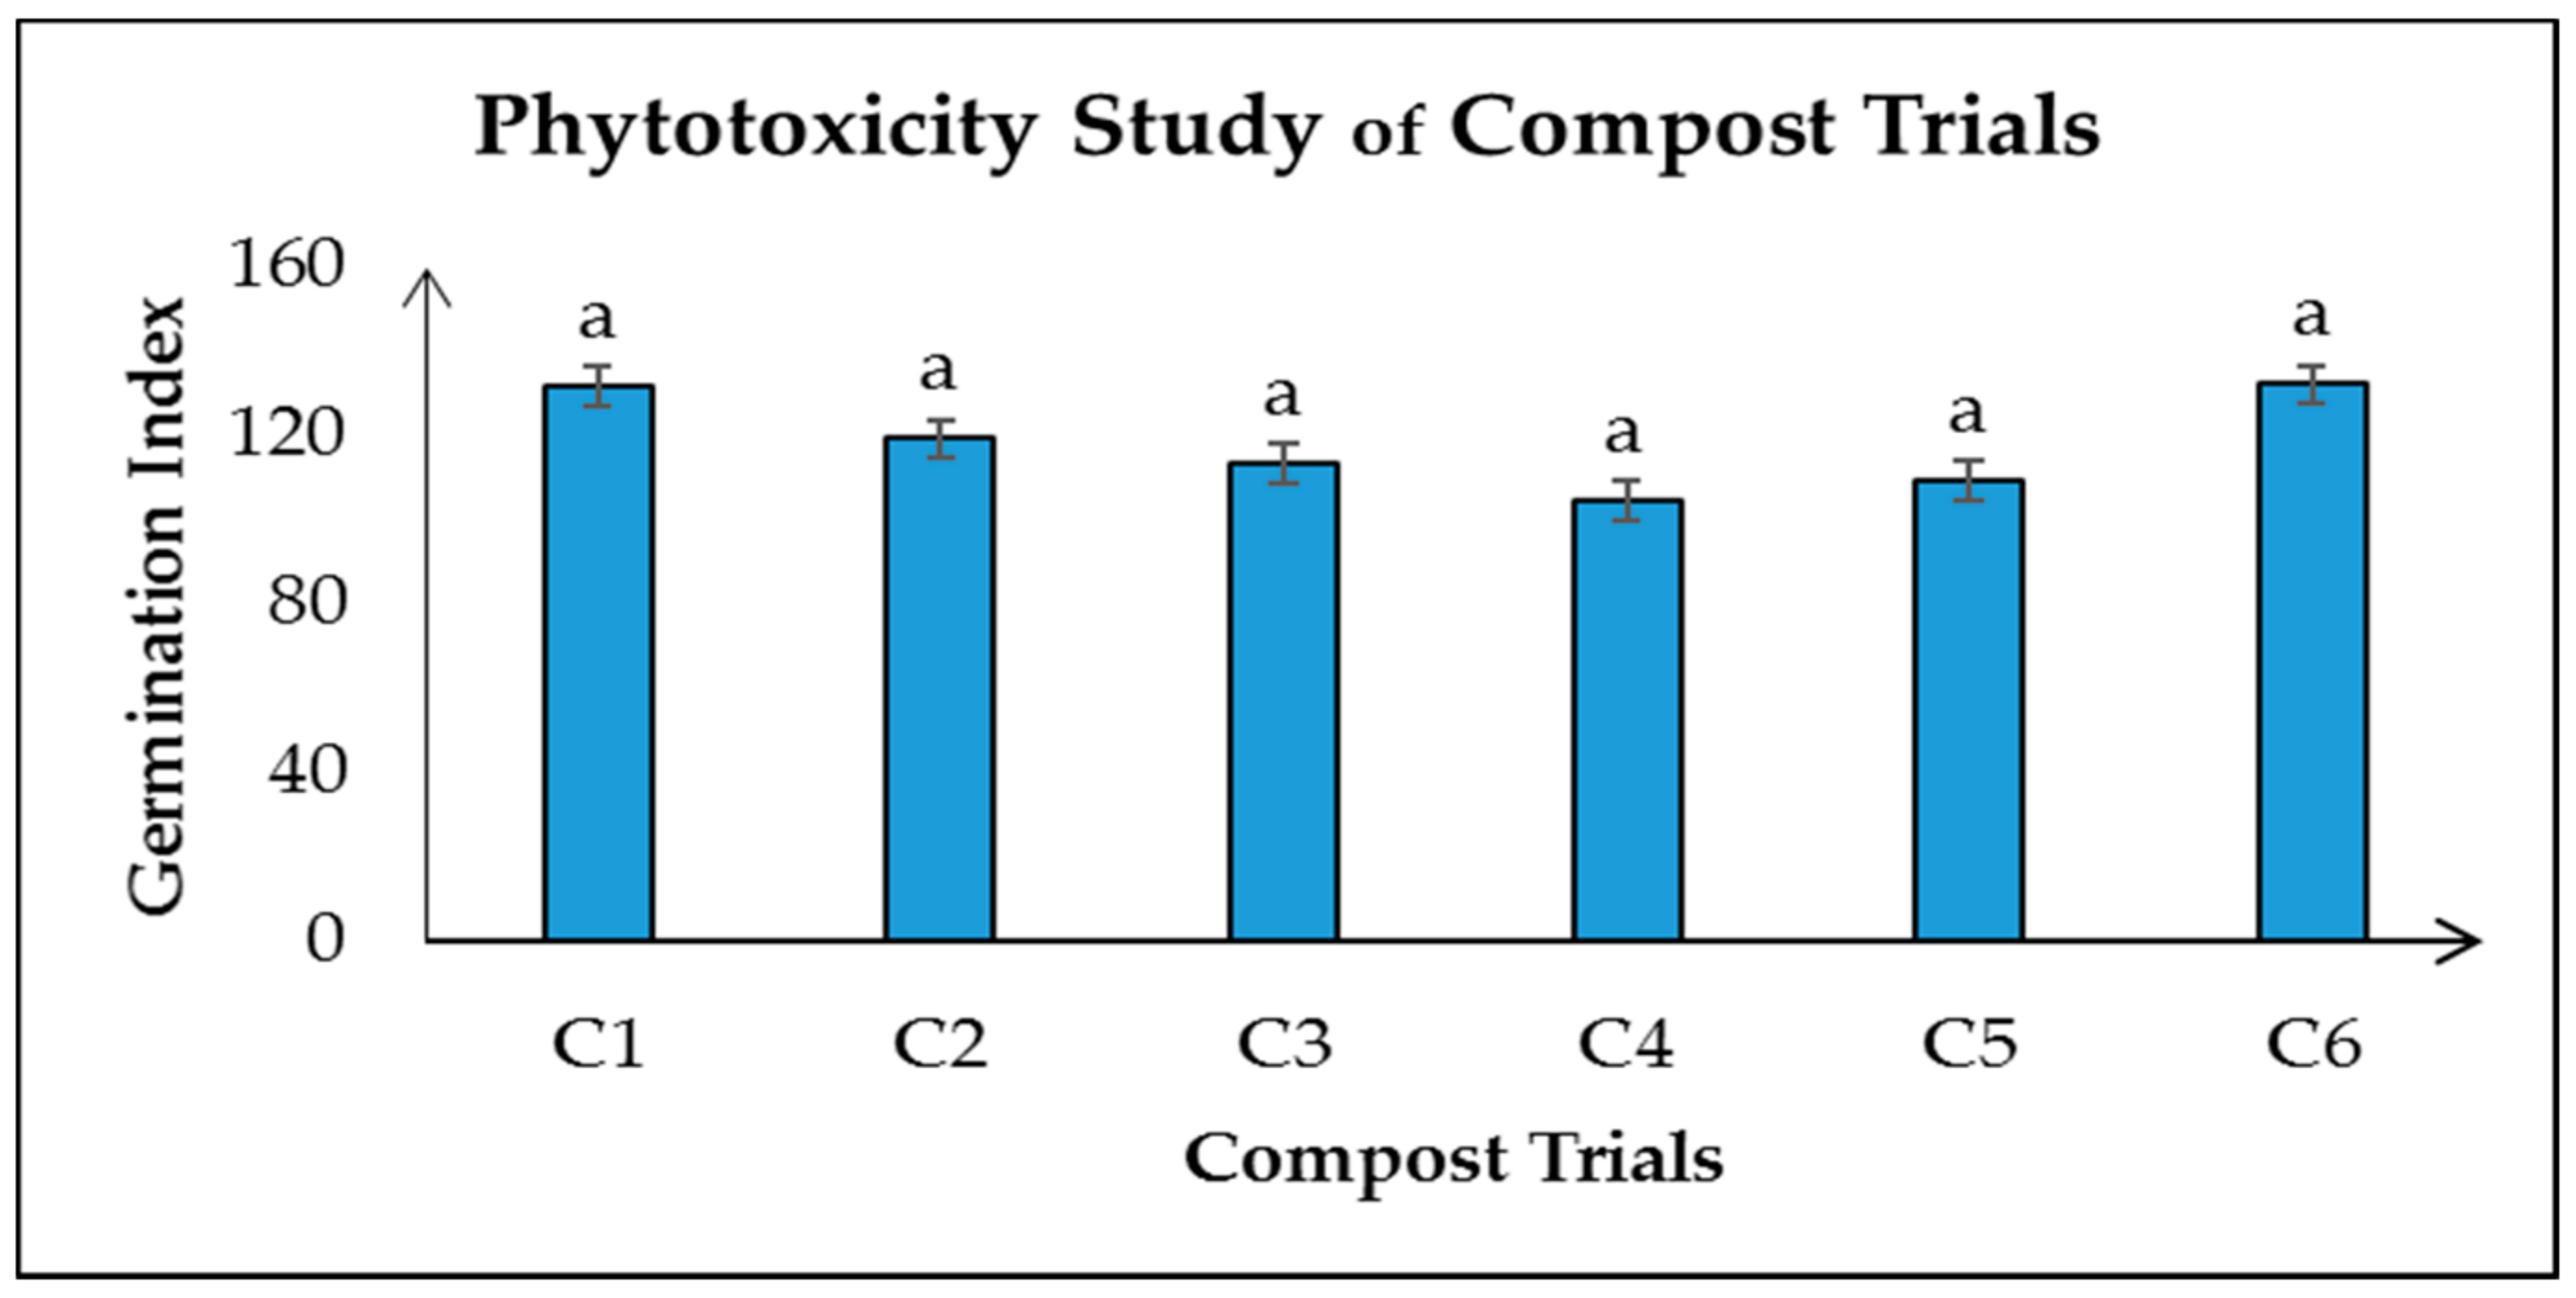
3.2. Phytotoxicity Analysis of Compost Trials

Figure 10 shows the germination index of each compost trial. Microbial activity will be prolonged in the soil if immature compost is applied to the soil and nutrients may not be available for plant growth [65]. Therefore, the germination index study was performed to determine the maturity and phytotoxicity of the compost trials. Currently, there are multiple viewpoints on the analysis and judgment of seed germination tests. Firstly, GI is widely adopted because it combines relative seed germination (RSG) with relative root elongation (RRE), both of which can reflect the toxicity of compost [34,66]. Secondly, RRG is a more sensitive indicator than RSG to the toxicity [67,68]. Thirdly, the toxic level of the compost that inhibits seed germination is higher than that that inhibits radicle elongation, thus RSG and RRE are used to evaluate the toxicity separately. It is because if the compost inhibits seed germination, it is not necessary to evaluate the effect of it on radicle elongation; if not, the effect on the radicle needs to be evaluated [69]. In this study, Phaseolus vulgaris seeds were used for the phytotoxicity study. There is no recognized seed species that can be used to evaluate the compost toxicity, and locally obtained seeds are commonly used [69]. According to Weitbrecht et al. [59], the definition of seed germination can be divided into three groups by radicle length (only visible, at least 2 mm, and at least 5 mm), and the operational definition of germination is based on the length that the radical reached. The extraction ratio of 1:10 (w/v) was used in this study since it is one of the most-used ratios in other studies. All the compost extracts from compost trials after 120 days showed GI value more than 100%. These results are similar to findings of studies conducted by Fan et al. [33]. The GI recorded ranged between 104.85% and 132.19%. The highest GI was recorded for compost trial C6, and the lowest value was recorded in compost trial C4. Qian et al. [70] suggests that GI values reaching more than 100% after 90 days signals zero phytotoxicity problems in the final compost. Compost can be considered immature when the GI values are less than 80%, mature when they are between 80% and 90%, and highly mature at GI values higher than 90% [71]. Therefore, based on the GI values obtained in this study, all the compost trials can be considered phytotoxic-free. However, the one-way ANOVA statistical analysis showed that there were no significant differences between the GI values of the different compost trials. In addition, post hoc results calculated with Tukey’s tests and insignificance differences were recorded between the trials.

4. Conclusions

In this study, a composting method was performed as one of the feasible alternative methods for handling bakery industry waste. Creamy bakery waste was not impeditive to yielding a good quality of compost. However, the results obtained from this study proved that the developed composting method could produce a satisfactory finished product that complies with standard values for compost. Moreover, the addition of commercially available effective microorganism did not impact the compost development. Since the compost produced complies with standard requirements, it could potentially be used as an organic amendment for crops in the agricultural field. As Malaysia is facing increasing food waste issues, composting can be considered a cost-effective method to deal with huge amount of bakery waste, and this method can be the nation’s sustainable solid waste management framework. Considering the lack of scientific data on the bakery waste compost, we believe that our work will provide useful new insights to strengthen local industries for more sustainable waste management.

Author Contributions

Conceptualization, M.G., K.V.S. and K.M.; methodology, M.G.; software, K.M.; validation, K.V.S. and K.M.; formal analysis, M.G., K.V.S. and K.M.; investigation, M.G.; resources, M.G. and K.V.S.; data curation, K.V.S. and K.M.; writing—original draft preparation, M.G. and K.V.S.; writing—review and editing, M.G. and K.V.S.; supervision, K.V.S. and K.M.; project administration, K.V.S. and K.M.; funding acquisition, M.G. and K.V.S. All authors have read and agreed to the published version of the manuscript.

Funding

This research was funded by Fairy Food Industries Sdn. Bhd., AURRB/IND/FAIRY/2018/02.

Institutional Review Board Statement

Not applicable.

Informed Consent Statement

Not applicable.

Data Availability Statement

Not applicable.

Acknowledgments

The authors express their sincere appreciation to AIMST University and Fairy Food Industries Sdn. Bhd. for providing the space and utilities for the research purpose.

Conflicts of Interest

The authors declare no conflict of interest.

References

  1. Ferronato, N.; Torretta, V. Waste Mismanagement in Developing Countries: A Review of Global Issues. IJERPH 2019, 16, 1060. [Google Scholar] [CrossRef] [Green Version]
  2. FAO. Towards the Future We Want: End Hunger and Make the Transition to Sustainable Agricultural and Food Systems; Food and Agriculture Organization of the United Nations: Rome, Italy, 2012. [Google Scholar]
  3. Melikoglu, M.; Lin, C.; Webb, C. Analysing Global Food Waste Problem: Pinpointing the Facts and Estimating the Energy Content. Open Eng. 2013, 3, 157–164. [Google Scholar] [CrossRef]
  4. Paritosh, K.; Kushwaha, S.K.; Yadav, M.; Pareek, N.; Chawade, A.; Vivekanand, V. Food Waste to Energy: An Overview of Sustainable Approaches for Food Waste Management and Nutrient Recycling. BioMed Res. Int. 2017, 2017, 2370927. [Google Scholar] [CrossRef]
  5. Katami, T.; Yasuhara, A.; Shibamoto, T. Formation of Dioxins from Incineration of Foods Found in Domestic Garbage. Environ. Sci. Technol. 2004, 38, 1062–1065. [Google Scholar] [CrossRef] [PubMed]
  6. Ma, H.; Wang, Q.; Qian, D.; Gong, L.; Zhang, W. The Utilization of Acid-Tolerant Bacteria on Ethanol Production from Kitchen Garbage. Renew. Energy 2009, 34, 1466–1470. [Google Scholar] [CrossRef]
  7. Macgregor, C.A. Directory of Feeds & Feed Ingredients, 3rd ed.; Hoard’s Dairyman; W.D. Hoard & Sons: Fort Atkinson, WI, USA, 2000. [Google Scholar]
  8. Quested, T.; Johnson, H. Household Food and Drink Waste in the UK: Final Report; Wastes & Resources Action Programme (WRAP): Banbury, UK, 2009. [Google Scholar]
  9. Zhang, A.Y.; Sun, Z.; Leung, C.C.J.; Han, W.; Lau, K.Y.; Li, M.; Lin, C.S.K. Valorisation of Bakery Waste for Succinic Acid Production. Green Chem. 2013, 15, 690. [Google Scholar] [CrossRef]
  10. Han, W.; Lam, W.C.; Melikoglu, M.; Wong, M.T.; Leung, H.T.; Ng, C.L.; Yan, P.; Yeung, S.Y.; Lin, C.S.K. Kinetic Analysis of a Crude Enzyme Extract Produced via Solid State Fermentation of Bakery Waste. ACS Sustain. Chem. Eng. 2015, 3, 2043–2048. [Google Scholar] [CrossRef]
  11. Neves, L.; Ferreira, V.; Oliveira, R. Co-Composting Cow Manure with Food Waste: The Influence of Lipids Content. World Acad. Sci. Eng. Technol. 2009, 58, 986–991. [Google Scholar]
  12. Kadir, A.A.; Azhari, N.W.; Jamaludin, S.N. Evaluation of Physical, Chemical and Heavy Metal Concentration of Food Waste Composting. MATEC Web Conf. 2017, 103, 5014. [Google Scholar] [CrossRef] [Green Version]
  13. Hassen, A.; Belguith, K.; Jedidi, N.; Cherif, A.; Cherif, M.; Boudabous, A. Microbial Characterization during Composting of Municipal Solid Waste. Bioresour. Technol. 2001, 80, 217–225. [Google Scholar] [CrossRef]
  14. Frimpong, K.; Asare-Bediako, E.; Amissah, R.; Okae-Anti, D. Influence of Compost on Incidence and Severity of Okra Mosaic Disease and Fruit Yield and Quality of Two Okra (Abelmoschus esculentus L. Moench) Cultivars. IJPSS 2017, 16, 1–14. [Google Scholar] [CrossRef] [Green Version]
  15. Khater, E.S. Some Physical and Chemical Properties of Compost. Int. J. Waste Resour. 2015, 5. [Google Scholar] [CrossRef]
  16. Misra, R.V.; Roy, R.N.; Hiraoka, H. On-Farm Composting Methods; Food and Agriculture Organization of the United Nations: Rome, Italy, 2013. [Google Scholar]
  17. Zhang, M.; Wang, N.; Xu, Q.; Harlina, P.W.; Ma, M. An Efficient Method for Co-Purification of Eggshell Matrix Proteins OC-17, OC-116, and OCX-36. Korean J. Food Sci. Anim. Resour. 2016, 36, 769–778. [Google Scholar] [CrossRef] [Green Version]
  18. Wolka, K.; Melaku, B. Exploring Selected Plant Nutrient in Compost Prepared from Food Waste and Cattle Manure and Its Effect on Soil Properties and Maize Yield at Wondo Genet, Ethiopia. Environ. Syst. Res. 2015, 4, 9. [Google Scholar] [CrossRef] [Green Version]
  19. Ong, H.K.; Chew, B.H.; Suhaimi, M. Effect of Effective Microorganisms on Composting Characteristics of Chicken Manure. J. Trop. Agric. Food Sci. 2001, 2, 189–196. [Google Scholar]
  20. Kumar, M.; Ou, Y.L.; Lin, J.G. Co-Composting of Green Waste and Food Waste at Low C/N Ratio. Waste Manag. 2010, 30, 602–609. [Google Scholar] [CrossRef] [PubMed]
  21. EMRO Malaysia Sdn Bhd. How to Produce EMAS (EM Activated Solution), EMRO Malaysia Sdn Bhd. 2020. Available online: https://www.emromalaysia.my/index.php?ws=showproducts&products_id=2294283 (accessed on 28 February 2021).
  22. Mathews, S.; Gowrilekshmi, R. Solid Waste Management Using Effective Microorganism (EM) Technology. Int. J. Curr. Microbiol. Appl. Sci. 2016, 5, 804–815. [Google Scholar] [CrossRef]
  23. Jusoh, M.L.; Manaf, L.A.; Latiff, P.A. Composting of Rice Straw with Effective Microorganisms (EM) and Its Influence on Compost Quality. J. Environ. Health Sci. Eng. 2013, 10, 17. [Google Scholar] [CrossRef] [Green Version]
  24. Selim, S.M.; Zayed, M.S.; Atta, H.M. Evaluation of Phytotoxicity of Compost during Composting Process. Nat. Sci. 2011, 10, 69–77. [Google Scholar]
  25. Ameen, A.; Raza, S.; Ahmad, J. Effect of PH and Moisture Content on Composting of Municipal Solid Waste. Int. J. Sci. Res. Publ. 2016, 6, 35–37. [Google Scholar]
  26. Waqas, M.; Nizami, A.S.; Aburiazaiza, A.S.; Barakat, M.A.; Ismail, I.M.I.; Rashid, M.I. Optimization of Food Waste Compost with the Use of Biochar. J. Environ. Manag. 2018, 216, 70–81. [Google Scholar] [CrossRef]
  27. Mat Saad, N.F.; Ma’min, N.N.; Md Zain, S.; Ahmad Basri, N.E.; Md Zaini, N.S. Composting of Mixed Yard and Food Wastes with Effective Microbes. J. Teknol. 2013, 65, 89–95. [Google Scholar] [CrossRef] [Green Version]
  28. Cyrille, T.; Patrick, E.A.; Lyde, T.A.; Mama, D.; Boko, M. Physico- Chemical Characteristics of Compost (Cotonou, Benin, West Africa). J. Appl. Sci. Environ. Manag. 2014, 18, 301–306. [Google Scholar] [CrossRef] [Green Version]
  29. Rynk, R. Top Soil Bulk Compost Suppliers, Logs and Firewood. In Science of Composting; Olus Environmental Ltd. Company: Henfield, UK, 2008; pp. 24–30. [Google Scholar]
  30. Sánchez-Monedero, M.; Urpilainen, S.T.; Cabañas-Vargas, D.D.; Kamilaki, A.; Stentiford, E.I. Assessing the Stability and Maturity of Compost at Large-Scale Plants. Interam. Sanit. Environ. Eng. Assoc. 2005, 9, 25–30. [Google Scholar]
  31. Der Wurff, A.; Fuchs, J.G.; Raviv, M.; Termorshuizen, A. Handbook for Composting and Compost Use in Organic Horticulture; BioGreenhouse COST Action FA1105: Bleiswijk, The Netherlands, 2016. [Google Scholar]
  32. Masó, M.A.; Blasi, A.B. Evaluation of Composting as a Strategy for Managing Organic Wastes from a Municipal Market in Nicaragua. Bioresour. Technol. 2008, 99, 5120–5124. [Google Scholar] [CrossRef] [PubMed]
  33. Fan, Y.V.; Lee, C.T.; Leow, C.W.; Chua, L.S.; Sarmidi, M.R. Physico-Chemical and Biological Changes During Co-Composting of Model Kitchen Waste, Rice Bran and Dried Leaves with Different Microbial Inoculants. MJAS 2016, 20, 1447–1457. [Google Scholar] [CrossRef]
  34. Zucconi, F.; Pera, A.M.F.; Bertoldi, M.D. Evaluating Toxicity of Immature Compost. BioCycle 1981, 22, 54–57. [Google Scholar]
  35. Monson, C.C.; Murugappan, A. Developing Optimal Combination of Bulking Agents in an In-Vessel Composting of Vegetable Waste. E-J. Chem. 2010, 7, 93–100. [Google Scholar] [CrossRef]
  36. Cooperband, L. The Art and Science of Composting Science of Composting; University of Wisconsin-Madison: Madison, WI, USA, 2002. [Google Scholar]
  37. Irshad, M.; Eneji, A.E.; Hussain, Z.; Ashraf, M. Chemical Characterization of Fresh and Composted Livestock Manures. J. Soil Sci. Plant Nutr. 2013, 13, 115–121. [Google Scholar] [CrossRef] [Green Version]
  38. Hunton, P. Research on Eggshell Structure and Quality: An Historical Overview. Rev. Bras. Cienc. Avic. 2005, 7, 67–71. [Google Scholar] [CrossRef] [Green Version]
  39. McSweeney, J. Analytically Based Recipe Development; Agency of Natural Resources, Department of Environmental Conservation: Fairfield, NJ, USA, 2015. [Google Scholar]
  40. Palaniveloo, K.; Amran, M.A.; Norhashim, N.A.; Mohamad-Fauzi, N.; Peng-Hui, F.; Hui-Wen, L.; Kai-Lin, Y.; Jiale, L.; Chian-Yee, M.G.; Jing-Yi, L.; et al. Food Waste Composting and Microbial Community Structure Profiling. Processes 2020, 8, 723. [Google Scholar] [CrossRef]
  41. Ozores-Hampton, M. Guidelines for Assessing Compost Quality for Safe and Effective Utilization in Vegetable Production. hortte 2017, 27, 162–165. [Google Scholar] [CrossRef]
  42. Chaher, N.E.; Chakchouk, M.; Engler, N.; Nassour, A.; Nelles, M.; Hamdi, M. Optimization of Food Waste and Biochar In-Vessel Co-Composting. Sustainability 2020, 12, 1356. [Google Scholar] [CrossRef] [Green Version]
  43. Bernal, M.P.; Alburquerque, J.A.; Moral, R. Composting of Animal Manures and Chemical Criteria for Compost Maturity Assessment. A Review. Bioresour. Technol. 2009, 100, 5444–5453. [Google Scholar] [CrossRef] [PubMed]
  44. Wang, W.; Zhang, L.; Sun, X. Improvement of Two-Stage Composting of Green Waste by Addition of Eggshell Waste and Rice Husks. Bioresour. Technol. 2021, 320, 124388. [Google Scholar] [CrossRef] [PubMed]
  45. Trautmann, N.M.; Krasny, M.E. The Science of Composting. In Composting in the Classroom; Soil Wealth Integrated Crop. Protection; Kendall/Hunt Publishing Company: Dubuque, IA, USA, 2015. [Google Scholar]
  46. Sundberg, C.; Smars, S.; Jonsson, H. Low PH as an Inhibiting Factor in the Transition from Mesophilic to Thermophilic Phase in Composting. Bioresour. Technol. 2004, 95, 145–150. [Google Scholar] [CrossRef]
  47. Epstein, E. The Science of Composting; CRC Press: Boca Raton, FL, USA, 1997. [Google Scholar]
  48. Hashemi, S.; Boudaghpour, S.; Han, M. Evaluation of Different Natural Additives Effects on the Composting Process of Source Separated Feces in Resource-Oriented Sanitation Systems. Ecotoxicol. Environ. Saf. 2019, 185, 109667. [Google Scholar] [CrossRef]
  49. Ayilara, M.; Olanrewaju, O.; Babalola, O.; Odeyemi, O. Waste Management through Composting: Challenges and Potentials. Sustainability 2020, 12, 4456. [Google Scholar] [CrossRef]
  50. Cofie, O.; Nikiema, J.; Impraim, R.; Adamtey, A.; Paul, J.; Kone, D. Co-Composting of Solid Waste and Fecal Sludge for Nutrient and Organic Matter Recovery; International Water Management Institute (IWMI): Gujarat, India, 2016. [Google Scholar] [CrossRef]
  51. Manga, M.; Camargo-Valero, M.A.; Anthonj, C.; Evans, B.E. Fate of Faecal Pathogen Indicators during Faecal Sludge Composting with Different Bulking Agents in Tropical Climate. Int. J. Hyg. Environ. Health 2021, 232, 113670. [Google Scholar] [CrossRef]
  52. Benito, M.; Masaguer, A.; Moliner, A.; Arrigo, N.; Palma, R.M. Chemical and Microbiological Parameters for the Characterisation of the Stability and Maturity of Pruning Waste Compost. Biol. Fertil. Soils 2003, 37, 184–189. [Google Scholar] [CrossRef]
  53. Lasaridi, K.; Protopapa, I.; Kotsou, M.; Pilidis, G.; Manios, T.; Kyriacou, A. Quality Assessment of Composts in the Greek Market: The Need for Standards and Quality Assurance. J. Environ. Manag. 2006, 80, 58–65. [Google Scholar] [CrossRef] [PubMed]
  54. A&L Canada Laboratories. Compost Analysis for Available Nutrients and Soil Suitability Criteria and Evaluation; A&L Canada Laboratories: London, ON, Canada, 2004. [Google Scholar]
  55. Carvalho, J.; Araujo, J.; Castro, F. Alternative Low-Cost Adsorbent for Water and Wastewater Decontamination Derived from Eggshell Waste: An Overview. Waste Biomass Valor 2011, 2, 157–167. [Google Scholar] [CrossRef] [Green Version]
  56. Farahana, R.N.; Supri, A.G.; Teh, P.L. Tensile and Water Absorption Properties of Eggshell Powder Filled Recycled High-Density Polyethylene/Ethylene Vinyl Acetate Composites: Effect of 3-Aminopropyltriethoxysilane. J. Adv. Res. Mater. Sci. 2015, 5, 1–9. [Google Scholar]
  57. Daur, I. Study of Commercial Effective Microorganism on Composting and Dynamics of Plant Essential Metal Micronutrients. J. Environ. Biol. 2016, 37, 937–941. [Google Scholar]
  58. Mutairi, S.; Ghoneim, A.; Modaihsh, A.; Alotaibi, K.; Al-Barakah, F.; Noor, M. Deriving Compost from Municipal OrganicWastes in Saudi Arabia. Pol. J. Environ. Stud. 2019, 28, 1839–1845. [Google Scholar] [CrossRef]
  59. Eitbrecht, K.; Müller, K.; Gerhard, L.-M. First off the Mark: Early Seed Germination. J. Exp. Bot. 2011, 62, 3289–3309. [Google Scholar] [CrossRef] [PubMed] [Green Version]
  60. Elamin, E.A.; El-Tilib, A.M.; El-Gaziri, M.M. Effects of Nitrogen Fertilization and Calcium Carbonate on Soil Nitrogen, Phosporus, Potassium, Calcium and Magnesium. Univ. Khartoum J. Agric. Sci. 2007, 15, 259–272. [Google Scholar]
  61. Monteith, N.H.; Sherman, G.D. The Comparative Effects of Calcium Carbonate and of Calcium Silicate on the Yield of Sudan Grass Grown in a Ferruginous Latosol and a Hydrol Humic Latosol; University of Hawaii, College of Tropical Agriculture: Honolulu, HI, USA, 1963. [Google Scholar]
  62. Najafi-Ghiri, M.; Abtahi, A. Potassium Fixation in Soil Size Fractions of Arid Soils. Soil Water Res. 2013, 8, 49–55. [Google Scholar] [CrossRef] [Green Version]
  63. Iglesias-Jimenez, E.; Perez-Garcia, V. Determination of Maturity Indices for City Refuse Composts. Agric. Ecosyst. Environ. 1992, 38, 331–343. [Google Scholar] [CrossRef]
  64. Adi, A.J.; Noor, Z.M. Waste Recycling: Utilization of Coffee Grounds and Kitchen Waste in Vermicomposting. Bioresour. Technol. 2009, 100, 1027–1030. [Google Scholar] [CrossRef] [PubMed]
  65. Singh, J.; Kalamdhad, A.S. Reduction of Heavy Metals during Composting—A Review. Int. J. Environ. Prot. 2012, 2, 36–43. [Google Scholar]
  66. Emino, E.R.; Warman, P.R. Biological Assay for Compost Quality. Compos. Sci. Util. 2004, 12, 342–348. [Google Scholar] [CrossRef]
  67. Tiquia, S.M.; Tam, N.F.Y.; Hodgkiss, I.J. Effects of Composting on Phytotoxicity of Spent Pig-Manure Sawdust Litter. Environ. Pollut. 1996, 93, 249–256. [Google Scholar] [CrossRef]
  68. Fuentes, A. Phytotoxicity and Heavy Metals Speciation of Stabilised Sewage Sludges. J. Hazard. Mater. 2004, 108, 161–169. [Google Scholar] [CrossRef]
  69. Luo, Y.; Liang, J.; Zeng, G.; Chen, M.; Mo, D.; Li, G.; Zhang, D. Seed Germination Test for Toxicity Evaluation of Compost: Its Roles, Problems and Prospects. Waste Manag. 2018, 71, 109–114. [Google Scholar] [CrossRef]
  70. Qian, X.; Shen, G.; Wang, Z.; Guo, C.; Liu, Y.; Lei, Z.; Zhang, Z. Co-Composting of Livestock Manure with Rice Straw: Characterization and Establishment of Maturity Evaluation System. Waste Manag. 2014, 34, 530–535. [Google Scholar] [CrossRef] [Green Version]
  71. Bazrafshan, E.; Zarei, A.; Kord Mostafapour, F.; Poormollae, N.; Mahmoodi, S.; Zazouli, M.A. Maturity and Stability Evaluation of Composted Municipal Solid Wastes. Health Scope 2016, 5, e33202. [Google Scholar] [CrossRef] [Green Version]
Figure 1. Temperature profile of compost trials throughout composting.
Sustainability 13 02835 g001
Figure 2. The pH profiles of compost trials throughout the composting period.
Sustainability 13 02835 g002
Figure 3. The moisture content of compost trials throughout the composting period.
Sustainability 13 02835 g003
Figure 4. The electrical conductivity of compost trials throughout the composting period.
Sustainability 13 02835 g004
Figure 5. Water holding capacity (WHC) of compost trials. Different lowercase letters indicate a significant difference among the compost trials. The ‘a’ letter in a column indicate significant differences compared to the letter ‘b’ based on Tukey’s HSD test (p < 0.05). The bars with the same letters are not significantly different based on Tukey’s HSD test (p < 0.05).
Sustainability 13 02835 g005
Figure 6. N, P, K Analysis of compost trials. Different lowercase letters indicate a significant difference among the compost trials. The ‘a’ letter in a column indicates significant differences com-pared to the letter ‘b’, the ‘c’ letter in a column indicates significant differences compared to the letter ‘d’ and ‘e’, and the ‘f’ letter in a column indicates significant differences compared to the letter ‘g’ and ‘h’, based on Tukey’s HSD test (p < 0.05). The bars with the same letters are not significantly different based on Tukey’s HSD test (p < 0.05).
Sustainability 13 02835 g006
Figure 7. Total organic carbon of compost trials. Different lowercase letters indicate a significant difference among the compost trials. The ‘a’ letter in a column indicates significant differences compared to the letter ‘b’ and ‘c’, based on Tukey’s HSD test (p < 0.05). The bars with the same letters are not significantly different based on Tukey’s HSD test (p < 0.05).
Sustainability 13 02835 g007
Figure 8. C/N ratios of compost trials. Different lowercase letters indicate a significant difference among the compost trials. The ‘a’ letter in a column indicate significant differences compared to the letter ‘b’ based on Tukey’s HSD test (p < 0.05). The bars with the same letters are not significantly different based on Tukey’s HSD test (p < 0.05).
Sustainability 13 02835 g008
Figure 9. Color intensity of water extract of compost trials. (From top: C6, C5, C4, C3, C2, C1). Each trials consist of three replicates (left to right).
Sustainability 13 02835 g009
Figure 10. Phytotoxicity of compost trials. Different lowercase letters indicate a significant difference among the compost trials. The bars with the same letter are not significantly different based on Tukey’s HSD test (p < 0.05).
Sustainability 13 02835 g010
Table 1. Composition of each compost trial.
TrialsNon-Creamy BWCreamy
BW
CDDLPBESEM
Culture
C11 kg1.5 kg1 kg0.5 kg
C21 kg1.5 kg1 kg0.5 kg
C31 kg1.5 kg1 kg0.5 kg1 L
C41 kg1.5 kg1 kg0.5 kg1 L
C51 kg1.5 kg1 kg0.5 kg1 kg1 L
C61 kg1.5 kg1 kg0.5 kg1 kg1 L
Table 2. Analysis of compost feedstocks. Values are means (± standard error). The p-value results are from one-way ANOVA.
FeedstocksMoisture Content (%)pHEC (ms/cm)TOC (%)N (%)P (%)K (%)C/N Ratio
Non-creamy bakery waste21.80
(±0.32)
6.54
(±0.04)
1.85
(±0.02)
40.60
(±0.15)
1.45
(±0.02)
0.49
(±0.02)
0.18
(±0.01)
28.07
(±0.24)
Creamy bakery waste32.23
(±0.35)
6.01
(±0.02)
1.59
(±0.02)
31.47
(±0.09)
1.21
(±0.02)
0.30
(±0.01)
0.17
(±0.01)
26.09
(±0.47)
Dry leaves11.53
(±0.20)
4.34
(±0.02)
1.07
(±0.01)
31.70
(±0.10)
0.73
(±0.02)
0.15
(±0.01)
0.34
(±0.01)
43.46
(±0.81)
Paper boxes0.00
(±0.00)
7.14
(±0.02)
0.35
(±0.02)
34.57
(±0.18)
0.24
(±0.01)
0.00
(±0.00)
0.02
(±0.00)
147.10
(±8.57)
Cow dung71.40
(±0.83)
9.16
(±0.02)
2.44
(±0.03)
14.53
(±0.15)
1.71
(±0.01)
0.43
(±0.02)
0.53
(±0.03)
8.48
(±0.11)
Eggshells0.00
(±0.00)
9.06
(±0.03)
0.14
(±0.01)
1.80
(±0.06)
0.79
(±0.01)
0.36
(±0.01)
0.05
(±0.00)
2.29
(±0.10)
p-value0.000.000.000.000.000.000.000.00
Table 3. Key parameters for organic composting and the recommended range.
ParametersAcceptable RangeReferences
Temperature43–66 °C
Moisture (%)40–65%
pH5.0–8.0
EC (mS/cm)<6[40,41]
C/N ratio10–25
Nitrogen (%)0.5–6.0
Phosphorous (%)0.2–3.0
Potassium (%)0.10–3.5
Publisher’s Note: MDPI stays neutral with regard to jurisdictional claims in published maps and institutional affiliations.

