Abstract
It is well established that the transport sector is not an equalitarian sector. To develop a sustainable society, a more equalitarian and safe transport system for both users and transport sector employees is needed. This work prioritizes the needs and barriers previously identified as relevant among transport system users and employees for four different transport scenarios (railways, autonomous vehicles (AVs), bicycle-sharing services (BSSs), and employment). The aim of this paper is to prioritize the factors affecting women in these four transport scenarios with the help of a survey followed by the application of mathematical and computational algorithms based on the analytic hierarchy process (AHP) methodology. The identification of factors with higher influence in the fair participation of women in the transport sector will help transport planners, bike-sharing system owners, decision-makers, transport companies, and regulatory professionals to develop measures that could plausibly increase the proportion of women as users of BSSs, users of rail public transport, and AVs, as well as employees in the transport sector for a sustainable society. The results indicated that safety and security were the most challenging factors for railways. Weather, topography, and family responsibilities were shown to have a high influence on the use of BSSs. In the case of autonomous vehicles, the simultaneity and trust in the technology are the main opportunities to influence the acceptance of such vehicles. Finally, for transport employment, caring and parenting responsibilities were the factors that had the largest effect. Some differences in priorities were found for different profiles of women.
1. Introduction
In general, people’s experiences of traveling and employment opportunities in the transport sector differ from one to another, based on gender, along with other sociodemographic characteristics, which is one of the aspects that makes the transport a non-equalitarian sector. There are less numbers of women working in the transport sector, and users’ experience in the public and private transport is also different according to gender. Building an equalitarian and fair transport system goes toward the achievement of the United Nations sustainable development goal 5: “Achieve gender equality and empower all women and girls”.
The objective of this paper is to identify which aspects or factors we should prioritize in order to build an equalitarian transport system. For that, a survey was conducted, and the analytic hierarchy process (AHP) method, together with computational methods was applied to facilitate the analysis of different sociodemographic profiles. To get some insights on the needs of specific groups (e.g., women, women with family or traveling with dependents), the above-mentioned methods were used to obtain the hierarchy and weight the relevant factors in four different transport scenarios (railways, autonomous vehicles, bicycle-sharing services (BSSs), and employment). The representativeness of the samples and the significance of the results were calculated for statistical purposes. The data used in this study were gathered through online surveys in six languages (Spanish, French, English, Polish, Italian, and Serbian).
The remainder of this paper is organized as follows. Section 2 includes a literature review analyzing previous research on gender equity in transport. Section 3 defines the materials and methods used, indicating the general structure of the analysis and the description of each method. Section 4 shows the results obtained for the four transport scenarios, and Section 5 provides the conclusions.
2. Literature Review
The transport sector and its interaction with people has been represented, in a previous work [1], with an octahedron shape (or diamond shape), which represents the transport sector, inside of which is a polyhedron (or polyhedral individual (PI)), which represents the users and sector workers with their different characteristics (i.e., age, gender, culture, family, religion, disability, economic level, sexuality, and appearance). This representation has been called the inclusion diamond (ID) [2,3]. The octahedron has six vertexes; three of them represent the transport sector of today and define three different sides of transport (i.e., transport infrastructure and business models, vehicle users, and jobholder), and the other three vertexes represent the transport sector in the future. Each of these vertexes have, at the same time, different layers or areas for study [2,3].
Women’s experiences in transport differ from those of men. Culture, religion, ethnicity, living environment, and gender characteristics are some of the factors that have been shown to influence the interaction with the different modes of transport and also influence employment in transport-related careers. Different studies have shown that women tend to use public transport more than men, but their user experience is worse, and they are more likely to experience harassment than men. Data have also shown that women use bicycle-sharing schemes (BSSs) less frequently, are more reluctant to adopt technological changes (e.g., autonomous vehicles), have different transport needs, and are less likely to participate in transport-related employment. These four different scenarios (public transport, BSS, autonomous vehicles, and employment) are the subject of this paper and will be further analyzed in Section 2.1 and Section 2.2. Their corresponding vertex and layer in the ID were previously defined in Molero et al. [4].
2.1. Gender Issues in Transport from a Quantitative Point of View
2.1.1. Public Transport: Railway Stations
The railway, as a public transport service, allows people to travel for work, shopping, and many other everyday activities, but there are gender differences in railway use. Different mobility patterns—related mainly to the care role, which still applies to a majority of women—makes them follow a trip chain model when using transport to take children to school, to go to the doctor, and to do other errand activities. A study made in Los Angeles also showed that while women tend to make more trips per day than men, there are also more women who do not take any trips in a given day [5]. These travel differences cause women to waste more money on transport than men, which another study has called “the pink tax in transport” [5]. Due to these mobility differences, the public transport sector cannot be designed without the gender lens, considering the needs of all of its potential users, to build more gender-sensitive and inclusive transport.
Different mobility patterns and roles are not the only issue influencing the use of public transport. Another very important issue that mainly affects women is safety. In the UK, Harvey et al. pointed out that women give greater importance to safety than men when traveling on long-distance trains, while men give more importance to speed [6]. In addition, different international organizations (International Transport Forum (ITF), European Transport Workers’ Federation (ETF), United Nations (UN), European Union (EU)), researchers, and the general public have highlighted the fact that women feel insecure when using public transport due to episodes of sexual harassment, pickpocketing, or violence. Such safety and security problems appear in all countries around the world. Installing cameras is not enough to improve this situation; other actions that have been taken include the development of protocols for sexual harassment or advertising campaigns, but more actions should be taken. The surroundings of railway stations and bus and tram stops and their access routes (e.g., underground tunnels) are also places that generate anxiety, especially at nighttime or for solo travelers. The creation of more human interaction within these areas is one of the proposals suggested to improve this situation [7].
Studies have also revealed that there is little or no access for women with disabilities to public transport [8]. Inappropriate design of the stations or vehicles hinders their use by those who are more vulnerable, such as people using a wheelchair. The absence of ramps to enter vehicles, inappropriate heights for automatic ticketing machines or signals and travel information make rail and other public transport systems an unfair service that is not egalitarian. Another issue that affects equality and fair transport is the lack or low service of public transportation in rural and suburban areas that would allow residents to do their daily activities such as going to work, access bigger markets, or access health services [8]. Thus, people living in rural and suburban areas are forced to use taxis for travel, which results in more expensive transport to meet their daily needs than in with higher access to different public transport services.
2.1.2. Bike-Sharing Services: Station-Based Shared Bicycles
The first plan or prototype of public bicycles was developed in 1965 by an non-governmental organization (NGO) called Provo in Amsterdam to reduce traffic congestion and air pollution. This first plan used normal bicycles painted white that could be used by anyone and could be picked up and left anywhere [9]. The main problems of this system were vandalism (e.g., bikes were thrown into the canal), thefts, and low political support [10]. The first large BSS with user registration and an automatic system of bicycle delivery/drop off was developed by Velo’v in Lyon (France) with 1500 bicycles in 2005 [11].
From the Lyon BSS, the model spread to different countries throughout the world (e.g., Amsterdam, Paris, New York, Shanghai, etc.) [12]. BSSs have increased as an eco-friendly means of transport for commuter use in the first and last mile (up to 3 or 4 km) of work trips and also for leisure and tourism. Europe has the highest bicycle use. Among the different European countries, those with a stronger bike culture and higher use include Holland, where 71% of the population uses bikes, Finland with 57%, and Denmark with 56% [13]. Other countries and cities have lower usage rates (e.g., Helsinki 14% and Paris 5% (2019 data)) [14].
Thus, bicycles and BSSs are a good transport mode for short distances that allow cheaper transport compared with other modes, as bicycles reduce needed parking space, are environmentally friendly, and have positive health effects on people. Usage varies between women and men. There is clear evidence that gender is an important demographic variable that defines individual mobility patterns and affects cycling and bike-sharing [15,16,17]. According to the transport for London report developed in 2014, in the UK, women cycle and use bicycle-sharing services less than men [17]. Gender-related barriers have received significantly less attention from policy-makers to bridge the gap between male and female users. The commonly cited barriers to cycling and BSS use among women include convenience, harassment, or abuse by other road users; traveling with children or goods; cost, access, and logistics; and knowledge and experience.
2.1.3. Autonomous Vehicles
Improvements are continually being incorporated in vehicles, including automatization of the driving experience. The Society of Automotive Engineering (SAE) classifies the automatization levels from L0 (no automatization) to L5 (fully automated vehicles). The current market for commercial vehicles includes automatization levels up to L3. Böhm et al. expect L4 vehicles (capable of performing all driving functions under certain circumstances) to be affordable and commonplace in the 2040s [18].
The literature review highlights differences in driving behavior between men and women and in gender-specific use [19,20]. New technologies used in vehicles should focus on meeting the real needs of citizens and then consider the different needs of society and men and women. From a gender point of view, there are two different dominant patterns of mobility while driving to work: while women trip-chain (25% of women, 39% if they have children older than 9) when traveling to work, men tend to move directly from point A to point B [21,22]. Several studies have shown that in Europe, the percentage of men who own a car is higher than that for women. Studies analyzing the willingness to use and purchase an autonomous vehicle (AV) found that men and younger people want to use or purchase AVs more than women [23,24,25,26]. To have a fair transport system and a more equalitarian use of different transport options—which have a direct influence on job opportunities and job positions to which women and men can apply—future transport technologies such AVs should incorporate a gender perspective during the design process.
2.1.4. Employment in Transport
Only 22% of women are working in transport in the EU [27,28]. The access to employment in the transport system for women is limited, whether in terms of road maintenance or technical professions or in access to bus or truck driving positions. In the EU, the transport and storage sector accounts for more than 5% of total employment and almost 5% of GDP (2016 data) [29]. There are 6.2 males for every female employee in land transport, while the same figure is 4.1 for waterborne transport, 1.5 for air transport, and 2.8 for warehousing and supporting activities; this ratio is only 1.1 for the total economy [30]. In addition, only 10% of bus drivers in Europe are women [27]. In the rail industry, the percentage of women depends on the position: specialized positions as engineers account for just 2% of total women workers in railway companies, while 66% are in other service roles [8]. In the male-dominated transport sector, women predominantly work in customer-facing or administrative jobs, and they often work in mobile workplaces, such as on board airplanes, trains, or ships, as well as in customer support offices [31]. One of the reasons behind the lower participation of women in the sector has been the embedded norms or inherent roles that predispose women to overlook transport as a sector with interesting and appropriate employment opportunities.
In 2019, the European Transport Workers’ Federation (ETF) launched a survey of women transport workers of Europe to identify their key demands for making the sector fairer and suitable for women. Results from the analysis of over 2770 responses indicated that there were five main areas to be tackled if the sector wanted to become a sector that would match women’s needs, make them feel comfortable, make enrollment more attractive, and ensure retention. These areas included the dominant culture of masculinity and stereotyping, discrimination and unequal treatment, work–life balance and caring responsibilities, women’s health and safety (acceptable sanitary facilities), and gender-based violence and sexual harassment in the workplace [32]. Safety in the work environment was a key aspect for women, as 49% of the respondents indicated that they considered their workplace did not prioritize a safe and adequate work environment for women. That women continue to be the main person in charge of taking care of vulnerable members of the family unit (e.g., children, the elderly, and disabled people) makes them more likely to work part-time (according to the ETF survey, 39% of women transport workers work part-time due to caring responsibilities [31]), which significantly affects their career progression, pay, and future pension. Women transport workers have also indicated that maternity, maternity leave, or caring responsibilities have consequences in their working conditions, with penalties including a frozen of or reduced salary or even unpaid leave in the cases in which the leave is extended beyond the maximum protected by law [31]. Thus, previous research has shown that transport is a sector with unattractive features and practices that pose significant barriers to the retention of women [27,33].
2.2. Gender Issues in Transport from a Thematic Point of View
2.2.1. Public Transport: Railway Stations
An individual’s economic level has been shown to be an important factor in the use of public or private transport. Women with higher incomes tend to use more private transport. Sexual harassment is one of the factors that have received more attention in the literature published on gender issues in the transport sector. In their contribution to the publication of the ITF, Montes Calero and Montoya highlighted that the risk of harassment in journeys is higher in stations with low or insufficient lighting and on sidewalks in poor condition [5]. However, the risk is not only at the stations: women feel vulnerable during the entire trip, including the first and last mile. Montes Calero and Montoya suggest improving the surroundings with better lighting and parks that do not reduce visibility, providing higher frequency service at peak hours, and having effective mechanisms in place for claims of victims, as well as the development of a list of aggressions and the imposition of sanctions [5].
Most studies on the use of multicriteria decision-making (MCDM) models are focused on the evaluation of different locations according to different criteria, which are weighted following the rules of different MCDM methods. The main advantage of such techniques is that they allow the use of both quantitative and qualitative criteria and consider the opinions of different experts. Mateus et al. used MCDM analysis to evaluate the relative overall value of different location alternatives for a high-speed railway station in Porto [34]. They defined a series of parameters to evaluate the alternatives and, from the criteria selected, those with direct influence on individual benefits were demand, accessibility, travel time, comfort, intermodality with car and other modes of transport (e.g., other railway connections, surface light rail), availability for public and private transport, and availability of support services [34].
Farooq et al. (2019) evaluated the location of a new station evaluating six different alternatives considering travel and economic criteria [35]. Criteria weights obtained by the analytic hierarchy process (AHP) method showed that experts considered that the criteria with highest weight were, in order of importance, connectivity between cities (19%), transport satisfaction (16%), travel time (15%), profit (15%), and payback period (14%).
2.2.2. Bike-Sharing Services: Station-Based Shared Bicycles
Reccently, Eren and Uz developed a review of factors affecting bike-sharing demand. They defined as the main groups of factors analyzed in the literature weather, built environment, and land use (including population density, job and retail density, recreation areas, and bicycle infrastructure), public transportation, station level, sociodemographic effects, and temporal factors and safety [36]. They said that convenience was the main impact factor motivating cycling, and that convenience could include different concepts such as station accessibility, membership procedures, simplicity of payment, and helmet supply. In line with this are the main factors found in García-Jiménez et al., who analyzed subfactors inside four main areas: accessibility and spontaneity, safety and security, social constraint, and weather and topography [1]. Yao et al. refined the sociodemographic issues affecting the use of BSSs and found that, together with weather conditions, infrastructure, population density, and connection with other means of transport, gender, age, income, and education level were aspects affecting the use of shared bicycles [9]. Zeng et al. also mentioned the importance of weather conditions and travel distance for the use of BSSs, and they added the influence of the built environment while noting the different travel behaviors in different neighborhoods [37]. Li and Shan and Ban and Hyun highlighted the importance of bike availability in docking stations as a key factor for BSS use, as well as the concentration of bikes in specific zones, and they considered how this affects commuters more than leisure travelers [38,39]. Both studies proposed a user participation-based rebalancing method that makes use of public involvement to distribute the congested bikes to stations where they are needed by providing incentives to participants, as in the “Bike Angel” program in New York [38,39].
A BSS in Poland was analyzed by Bieliński et al. using an ordinary least squares (OLS) regression model [40]. Their results indicated that BSS performance was positively related to cities’ population, tourism, number of bike stations per capita, congestion, length of bicycle pathways, and higher temperature, and it was negatively related to precipitation. They also suggested trips per day per bicycle as a measure of BSS effectiveness. Different mathematical and computational methods can be found in the literature that attempt to define the optimal location for bicycle-sharing stations. Romero et al. (2012) used a simulation optimization approach based on genetic algorithms to optimize the location of BSS docking stations in Santander (Spain), which is primarily based on accessibility and the walking time to zones of interest [41].
Some studies can be found that used MCDM techniques to evaluate different stations or to select the most appropriate location for bike-sharing stations. Cheng and Wei (2020) used AHP and data envelopment analysis (DEA) to determine the optimal bike-sharing parking point for a free-floating BSS [42]. The criteria identified as those with greater importance were, in order of importance, proximity to bus stations (0.22), proximity to subway stations (0.22), population density (0.17), distance from destination entrance (0.13), and proximity to parking spots (0.11). Kabak et al. (2018) used geographic information system (GIS), AHP, and multi-objective optimization by ratio analysis (MOORA) to solve the bike-share station site location problem [43]. They identified three clusters of criteria related to the urban life dimension, another cluster related to users, and a third cluster related to the transport network. Their results indicated that experts considered the transport network cluster to have the highest importance, and that the most important subfactors were proximity to bicycle lanes (0.30), proximity to transport hubs (0.13), proximity to sports centers (0.11), and population density (0.10), while the lowest values were obtained for proximity to schools (0.017) and proximity to shopping malls (0.022). In general, most of the studies found focused on finding the optimal locations for stations or on analyzing—in a general way—the factors that influence the use of these stations. Within this paper, we focus on the needs of women and how to improve current service based on those needs.
2.2.3. Autonomous Vehicles
Arena et al. (2018) indicated four aspects as crucial for the development of AVs: national policy and legislation (remove regulatory obstacles and creating a dedicated national body to promote adoption and financing), technology and innovation, existing and future infrastructure (investing in high-quality road infrastructure and next-generation mobile communications), and the interest shown by the consumers of these vehicles [44]. They also identified some security aspects that should be considered in AV development. Nair and Bhat indicate the importance of understanding public perceptions regarding safety considerations when using an AV and identified different affective, sociodemographic, and technology-use attributes that affect an individual´s perception of the safety of sharing the road with AVs. In this study, they indicate that to increase the acceptance of AVs and safety perception, it is much more effective to develop interventions targeted and customized to specific sociodemographic groups with the aim of improving enthusiasm and reducing anxiety about AVs rather than those based on increasing tech-savviness levels or presenting positive technology use experiences [45]. Topolšek et al. analyzed the influence of various factors on purchasing intentions of AVs using bibliometrics, online survey, and SEM modeling, and they concluded that car safety, buyer age and level of education, perceived social influence, anxiety, and performance expectancy are significantly correlated to the purchasing intention of AVs [46]. In line with this, Asmussen, Mondal, and Bhat said that AV technology adoption and the speed of adoption is shaped by individual-level demographic characteristics, individual-level psycho-social attributes (considering the psycho-social factors of driving control, mobility control, safety concerns, and tech-savviness) and AV vehicle characteristics [47]. The results of their study showed a strong influence of gender and age on AVs adoption. The gender effect is manifested in both the AVs adoption and the duration to adoption primarily related to issues of safety and losing driving control. The authors suggest as the most effective strategies to increase AVs uptake to highlight the expected safety benefits of AVs and also address concerns about child transport [47].
A recent survey showed that the experts consulted were skeptical about the positive impacts of AVs, and that they doubted the benefits (e.g., they could produce an increase of car trips) [48]. Raj et al. analyzed different barriers to AV adoption using Grey- Decision Making Trial and Evaluation Laboratory (DEMATEL) MDCM and systems thinking [49]. Their study showed that the barriers to AV adoption do not act in isolation but rather form a system of interrelated factors that influence each other. They also found that the lack of consumer acceptance was the biggest barrier, followed by lack of standards, absence of regulation and certification, obscure accountability (i.e., a lack of clarity in identifying who is responsible for AV-related accidents and/or damages), and inadequate infrastructure [49]. Haboucha et al. [50] analyzed user preferences for AVs in Israel and North America and found that older people prefer using and driving regular vehicles to shared autonomous vehicles (SAVs) or privately owned AVs. They also found that gender played a significant role in this decision only for Israelis. In Israel, men were more likely than women to favor SAVs. This could possibly be explained by traditional gender differences being more prominent in the Middle East than in North America or Europe. Cartenì quantified the willingness to pay for SAVs of public transport users (i.e., bus and taxi) in Naples (Italy) using a survey and Mixed Logit model and found that men have a lower reluctance in using driverless transit services than women, with an unwillingness to pay equal to €-0.50/trip for men between 18 and 40 years old against €-1.08/trip for females in the same age group. They also confirm results from other studies, indicating that the unwillingness to pay for an AVs service is probably mainly due to the concerns over personal safety and/or security. In addition, their results strongly suggest that the main barrier for the acceptance of AVs may also be psychological besides technological [26].
Overtoom et al. highlighted the fact that the incorporation of AVs in the transport system, the way they are designed nowadays, will create more congestion, and that this is an important factor to consider in the urban mobility [51]. They analyzed the use of private AVs and SAVs through simulation methods, and their results showed that AVs could contribute to congestion reduction only if the vehicles were available in organized networks such as car-sharing systems, and that individual AVs could contribute to increasing congestion.
Using a survey and the evaluation of experts, Turoń and Kubik analyzed the factors with the greatest impact on car-sharing services, including those that involve AVs. From the different factors, the most important were those related to the economy, and within them, in order of importance, were vehicle shape, vehicle maintenance costs, travel distance, travel time, vehicle purchase costs, vehicle rental costs, and vehicle class [52]. Focusing more on costing criteria and benefiting criteria (operational and design), Zavadskas et al. [53] used a combination of the Criteria Importance Through Intercriteria Correlation (CRITIC) technique to obtain the weights of seven different criteria found to influence AVs, and they used theDistance from the Average Solution in the Minkowski space (EDAS-M) method to evaluate different alternatives according to these criteria. The most important factor was found to be the speed of the AV, followed by the vehicle dimensions. However, the weights obtained indicated that the seven factors (dimensions, minimum lift height, price, AV capacity, battery capacity, maximum lift height, and speed) influenced the evaluation of AVs.
2.2.4. Employment in Transport
Turnbull has analyzed women’s careers in the transport sector and built cause–effect relationships related to the barriers faced by women in different career stages (i.e., attraction, selection, retention, interruption, re-entry, and realization stages) [54]. In the attraction stage, one of the barriers is the “advertisement” of transport jobs in schools to young girls as a potential career choice because of stereotypes and influencing, thus limiting the attraction of women to the transport sector, as well as a lower incorporation of STEM (Science, Technology, Engineering, and Math) careers in transport and early dropouts; a second barrier is the preference for male recruits in transport-related jobs. The main barriers in the selection stage were inappropriate selection criteria and the reluctance to consider women as candidates (stereotyping, social norms). Low retention rates of women in transport tended to be caused by working conditions, training, harassment, and incompatibility between family life and work. Other barriers found were anticipated (childbirth and caring responsibilities) and unanticipated (voluntary and involuntary quits) career interruptions. However, Turnbull has indicated that the low re-entry of women to transport jobs after a career interruption is mainly produced by a loss of employment benefits and the loss of employment status or career progression opportunities (skills). Finally, the last barrier identified was the limited opportunity for self-actualization, which is produced by what is called the “sticky floor”—that is, the fact that women do not have options to move to positions that are socially considered to be “men’s work”—and the “glass ceiling”—that is, the lower possibilities of career progression due to too few women in management positions/mentors and to limited training and development. Other studies have also suggested that the mobility opportunities of their male partners could affect women’s career trajectory and that a more equalitarian income level could equilibrate this fact [55,56].
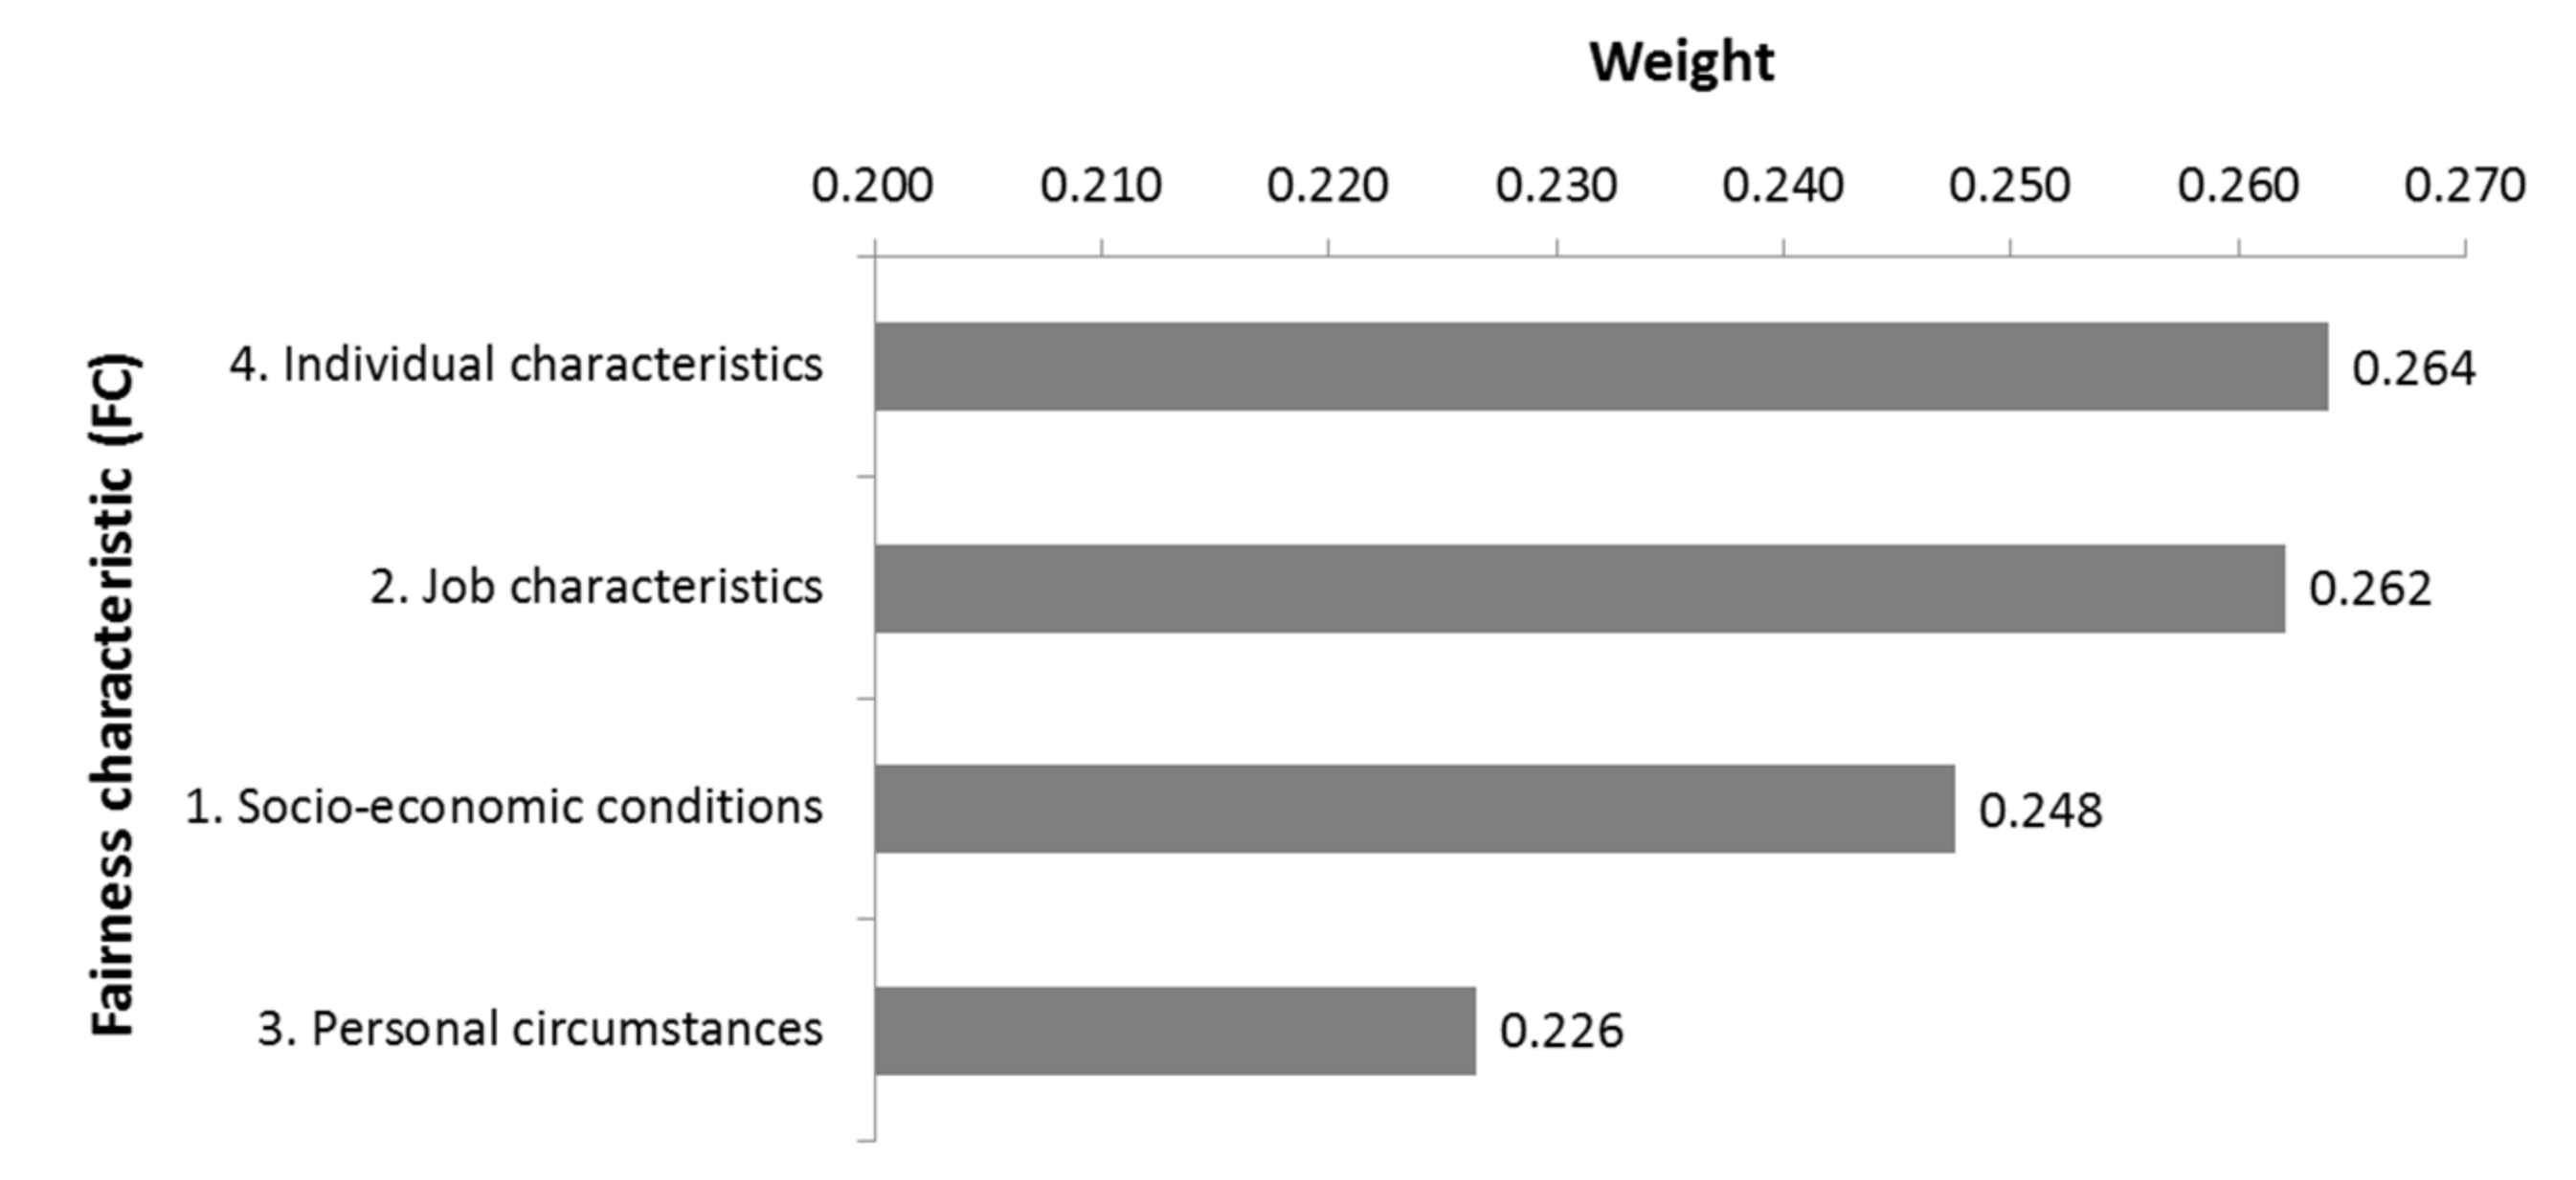
The ETF has recommended the promotion of women’s employment in the transport sector, the development of actions to improve recruitment policies, work–life balance, health and safety at work, equality in wages, working culture (to eliminate gender stereotypes), and corporate policy [57]. In our previous work, we defined the main groups of criteria and subcriteria affecting the fair involvement and an increase of the participation of women in the transport sector, which included socioeconomic conditions, job characteristics, personal circumstances, and individual characteristics. Analysis of the literature on the factors and barriers affecting women in transport-related jobs shows many similarities, and most research indicates similar factors, the main difference is how specific such studies are and how focused they are on specific aspects (e.g., on the need for female facilities, or harassment issues).
Very few studies have sought to identify which are the most important barriers that should be overcame first or that should be the main focus to increase the participation of women in transport-related jobs. A 2020 survey by the ETF [32] showed that the main factors affecting women in transport jobs, ranked in order of perceived adverse impact, are the masculine culture (which made women’s professional progression difficult), the working hours, sanitary issues (e.g., availability of toilets and toilet breaks), negative attitudes toward women mangers or supervisors, safety issues (e.g., violence or harassment), and gendered jobs (e.g., “women’s” vs. “men’s” jobs). However, some studies have analyzed the impact of equity measures on the increase in women’s participation in transport-related jobs. French and Strachan have analyzed different approaches undertaken by transport companies in Australia for equal employment opportunities and how those approaches influence women’s participation [58]. These approaches mainly focused on encouraging equal treatment of men and women through social measures related to recruitment processes, promotion, and training, and through equitable terms and conditions of employment and family balance strategies. The study revealed that the application of these measures did not produce any change in the representation of women in management or in non-traditional areas. Therefore, they suggested that measures need to be more proactive and strategic for change to occur.
The analysis developed in this paper goes a step further. We did not focus on the identification of factors but used those already identified in the literature [1] and analyzed priorities using AHP [59]. Using the Pareto principle [60,61], which says that roughly 80% of consequences come from 20% of the causes—or in business, 80% of sales comes from 20% of clients—if we focus first on those factors with a higher influence on women’s employment in the transport sector, we can make remarkable changes and with a greater probability of producing lasting effects and increasing women’s employment in the transport sector. We not only focus on aggregated data coming from the whole society or from women but also on specific profiles of women (e.g., rural, low income). Analysis of disaggregated data will be very helpful to gain a better understanding of gender differences in transport, which will be very helpful for policy-makers, transport planners, and transport companies [5].
3. Methodology
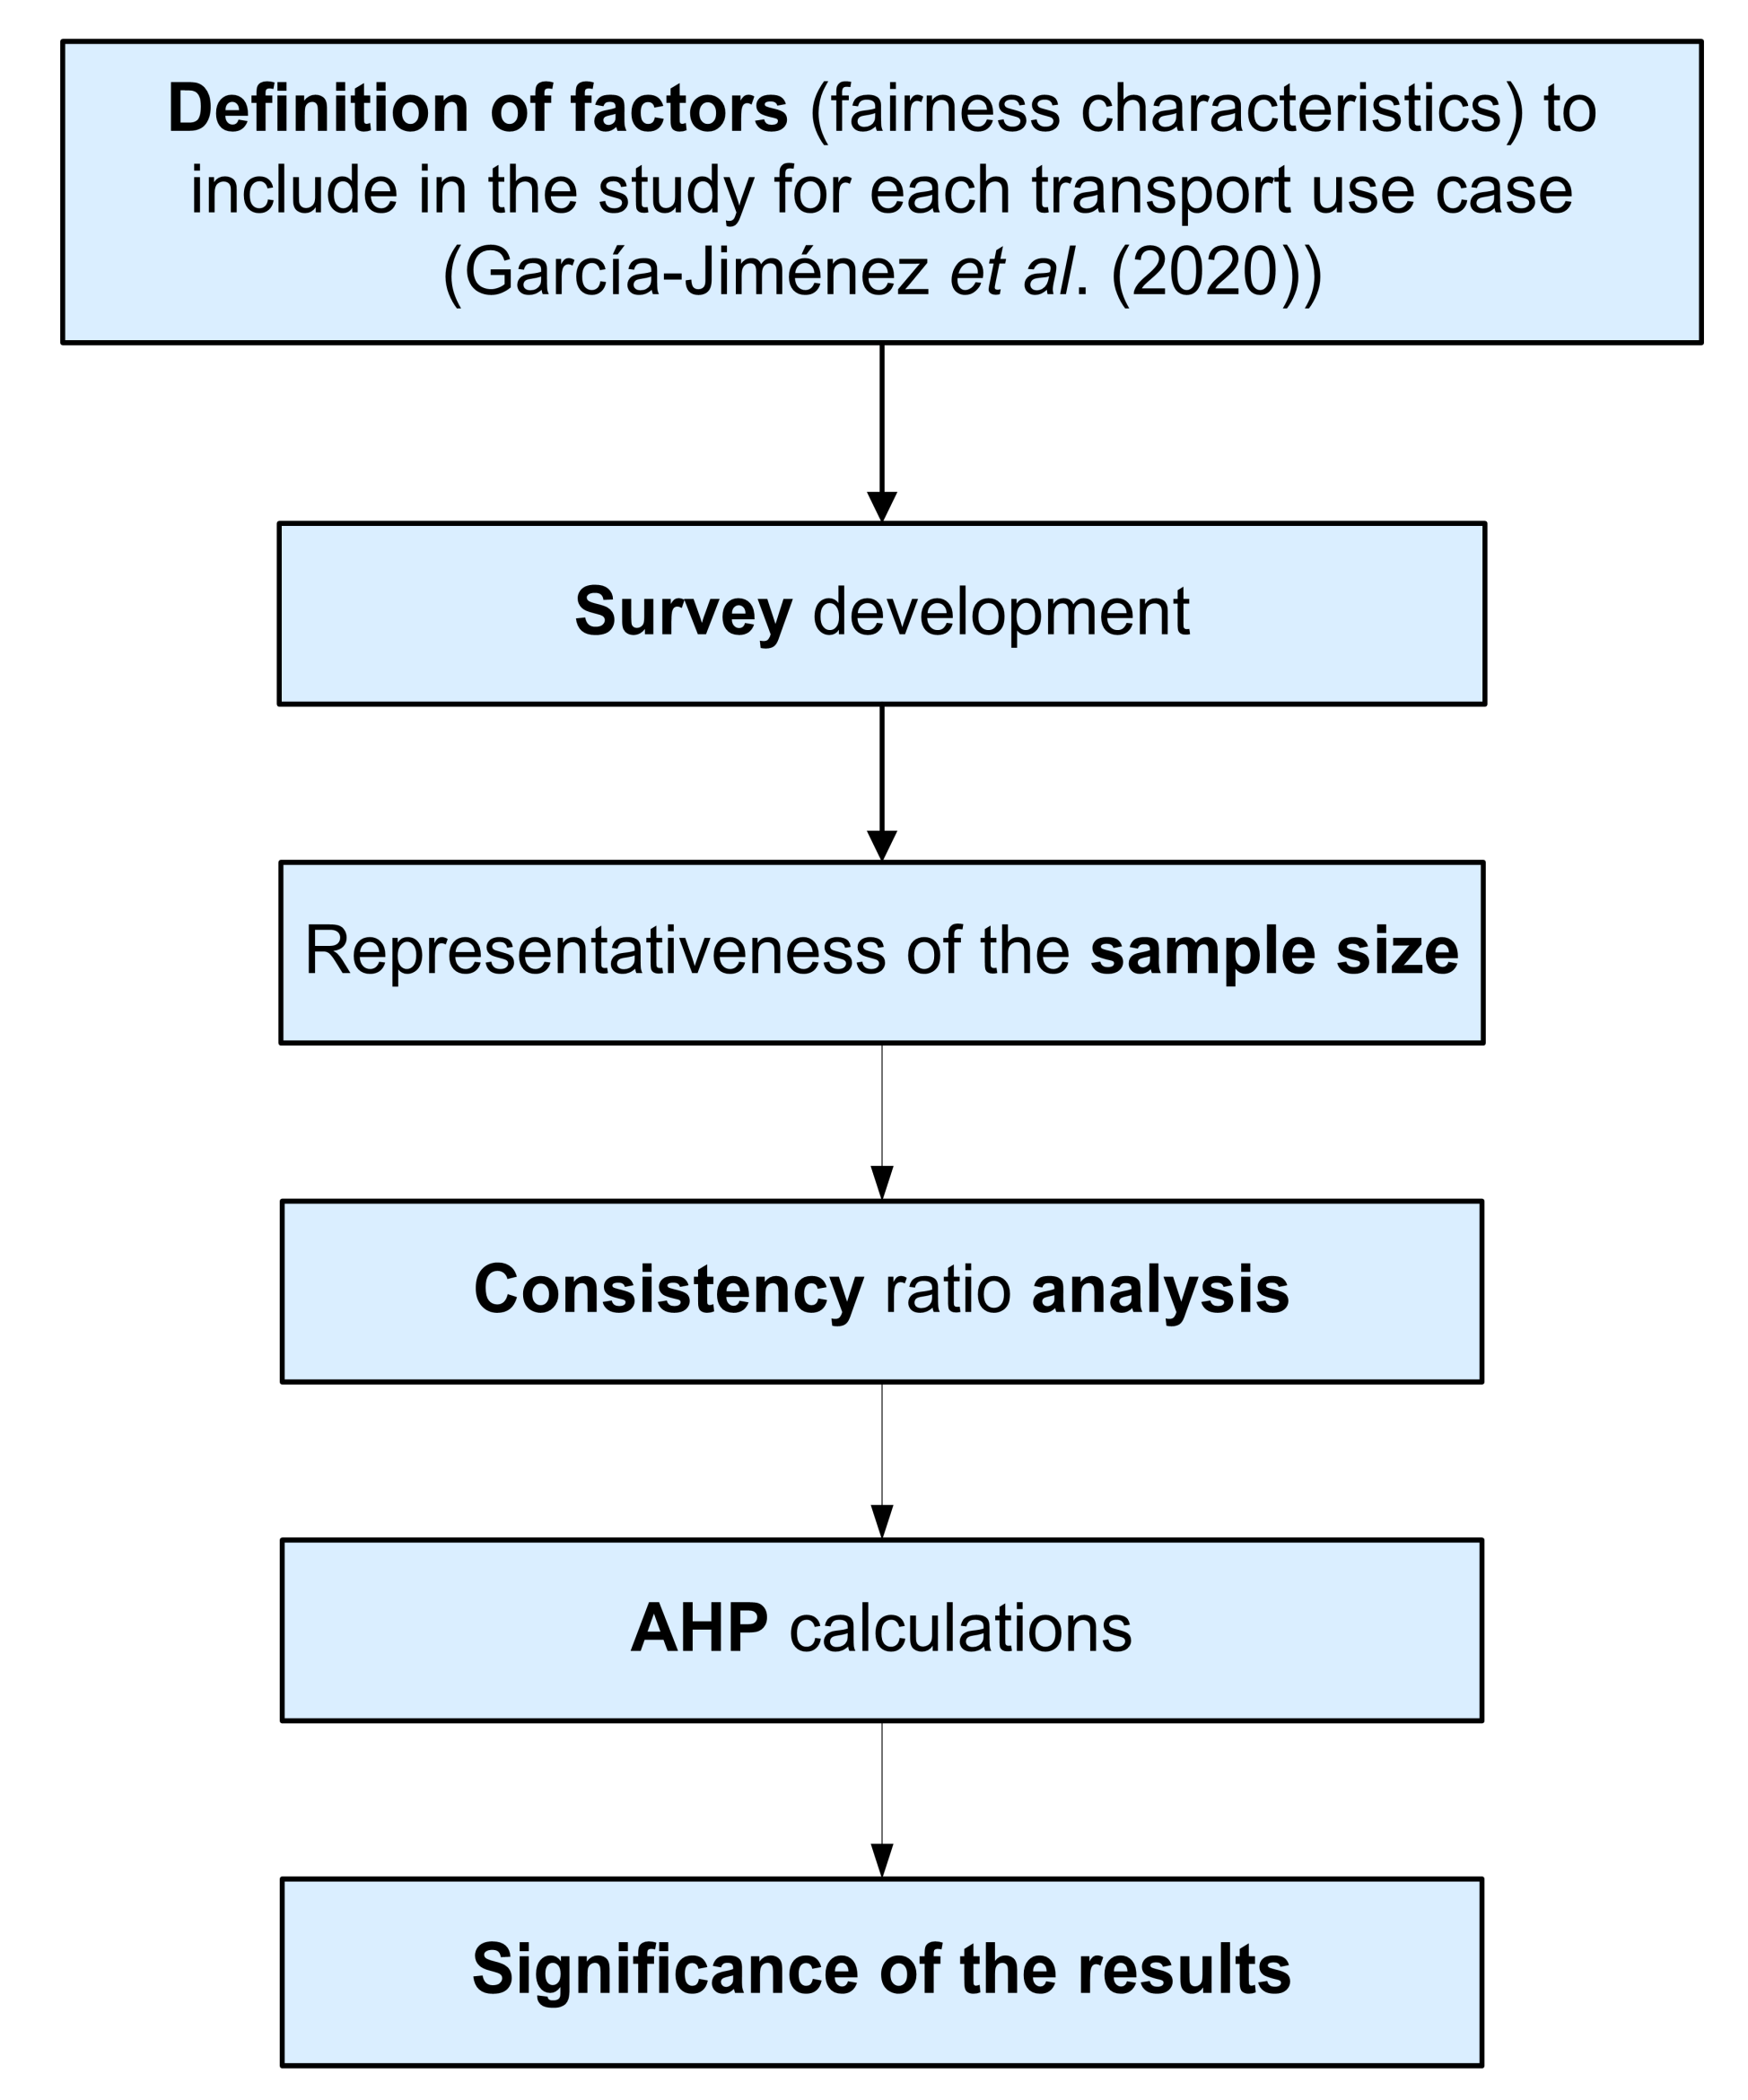
This section is divided into six different subsections that define the different steps of the methodology. In general words, Section 3.1 (which is also represented graphically in Figure 1) represents the full explanation of each step in their corresponding subsection. Section 3.2 defines the list of fairness characteristics asked in the survey as well as how it was developed. Section 3.3 includes the mathematical expressions used to calculate the representativeness of the sample size needed for each of the four use cases and for the aggregated and intersectional (for different profiles) analysis. Section 3.4 includes the calculations to obtain the consistency ratio of the gathered responses following the AHP method. It is the ratio that helps us consider only those responses in our analysis that are reliable. In Section 3.5, the AHP methodology is described. This methodology helps us obtain a ranking of fairness characteristics (FCs) based on respondents´ answers to the pairwise questions asked in the survey. Finally, Section 3.6 defines the mathematical expressions used to calculate the significance of the results obtained.
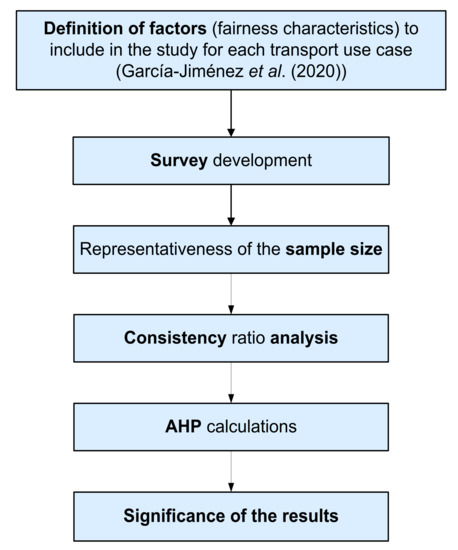
Figure 1.
General scheme of the methodology used.
3.1. General Structure of the Methodology
The planned methodology was based on the use of AHP to evaluate the opinions of employees and users of the transport system related to previously identified factors (FCs) [1] for four use cases or scenarios: public transport—railway stations; AVs; BSSs; and employment in transport. The ID is a representation of the transport system through vertexes and layers that divide the system into present and future scenarios. Three future scenarios for three of the use cases were analyzed to assess the transport system’s evolution. These future scenarios were hyperloop (related with use case 1), totally automated AVs (related with use case 2), and drones used in logistics (related with use case 4). Results obtained in the previous work published by García-Jiménez et al. [1] yielded a hierarchical model in two levels of FCs for each use case. Due to the difference in topic and to keep the survey from being onerously long, level 1 FCs were considered with the same weight for present scenarios (the weights of all level 1 FCs of each use case sum 1), while level 2 FCs inside each level 1 FC were compared in pairs following AHP through an online survey. For future scenarios, respondents evaluated priorities for level 1 FCs, because at this stage, the technology is not fully deployed, there is no sense in delving into level 2 FCs at this stage, and we wanted to analyze how level 1 priorities would change in these scenarios. Due to the high number of response calculations and to develop a flexible and fast method for the analysis of data in an aggregated and disaggregated way considering the different sociodemographic characteristics included in the questionnaire, AHP calculations were automatized using Matlab and Visual Basic for Applications (VBA). The general scheme of this methodology is shown in Figure 1.
3.2. Survey Development
Table 1 shows the different FCs considered for each use case based on the results previously obtained [1]. FCs were divided into level 1 and level 2 FCs, thus forming a hierarchical model.

Table 1.
Fairness characteristics (FCs) of the four use cases. The first level FCs are in bold, and the second level FCs are in italics. See the full description in [1].
Opinions regarding level 2 FCs for each of the four use cases were obtained through an online survey, developed using Typeform, in six languages (Spanish, French, English, Polish, Italian, and Serbian). The survey was made public through social media channels and newsletters of both the DIAMOND project and the partners involved (including public transport service providers and BSS), as well as through e-mails to partners’ contacts related to the topic. The online survey had two parts. The first part contained sociodemographic questions (or PI characteristics), including questions about gender, age, nationality, education, income, ethnicity, religion, and family [2,3]; the second part evaluated user preferences regarding different aspects or FCs identified as important for women for each of the use cases. PI characteristics were identified as a joint work between the members of the DIAMOND and TINNGO H2020 projects, which used thematic analysis, and their expertise highlighted the individual characteristics that could have an influence on behavior when an individual interacts with the transport system. The time needed to complete each of the four surveys (one for each use case) was approximately 18 min. Although the focus of the study is on the improvement of women participation in each of the four transport use cases, the aim of the questionnaire is to develop a more equalitarian transport system for everyone, and then data are also gathered and analyzed for all genders and different profiles.
The FCs inside the same level or cluster were compared pairwise using a user-friendly format that allowed later translation into Saaty’s scale [62], which was used to perform AHP analysis. The first question asked which FC was more important from the individual’s point of view A, B, or equal importance; the second question asked the respondent to rate the importance from 1 to 8 if A or B were selected.
3.3. Representativeness of the Sample Size
3.3.1. Aggregated Analysis
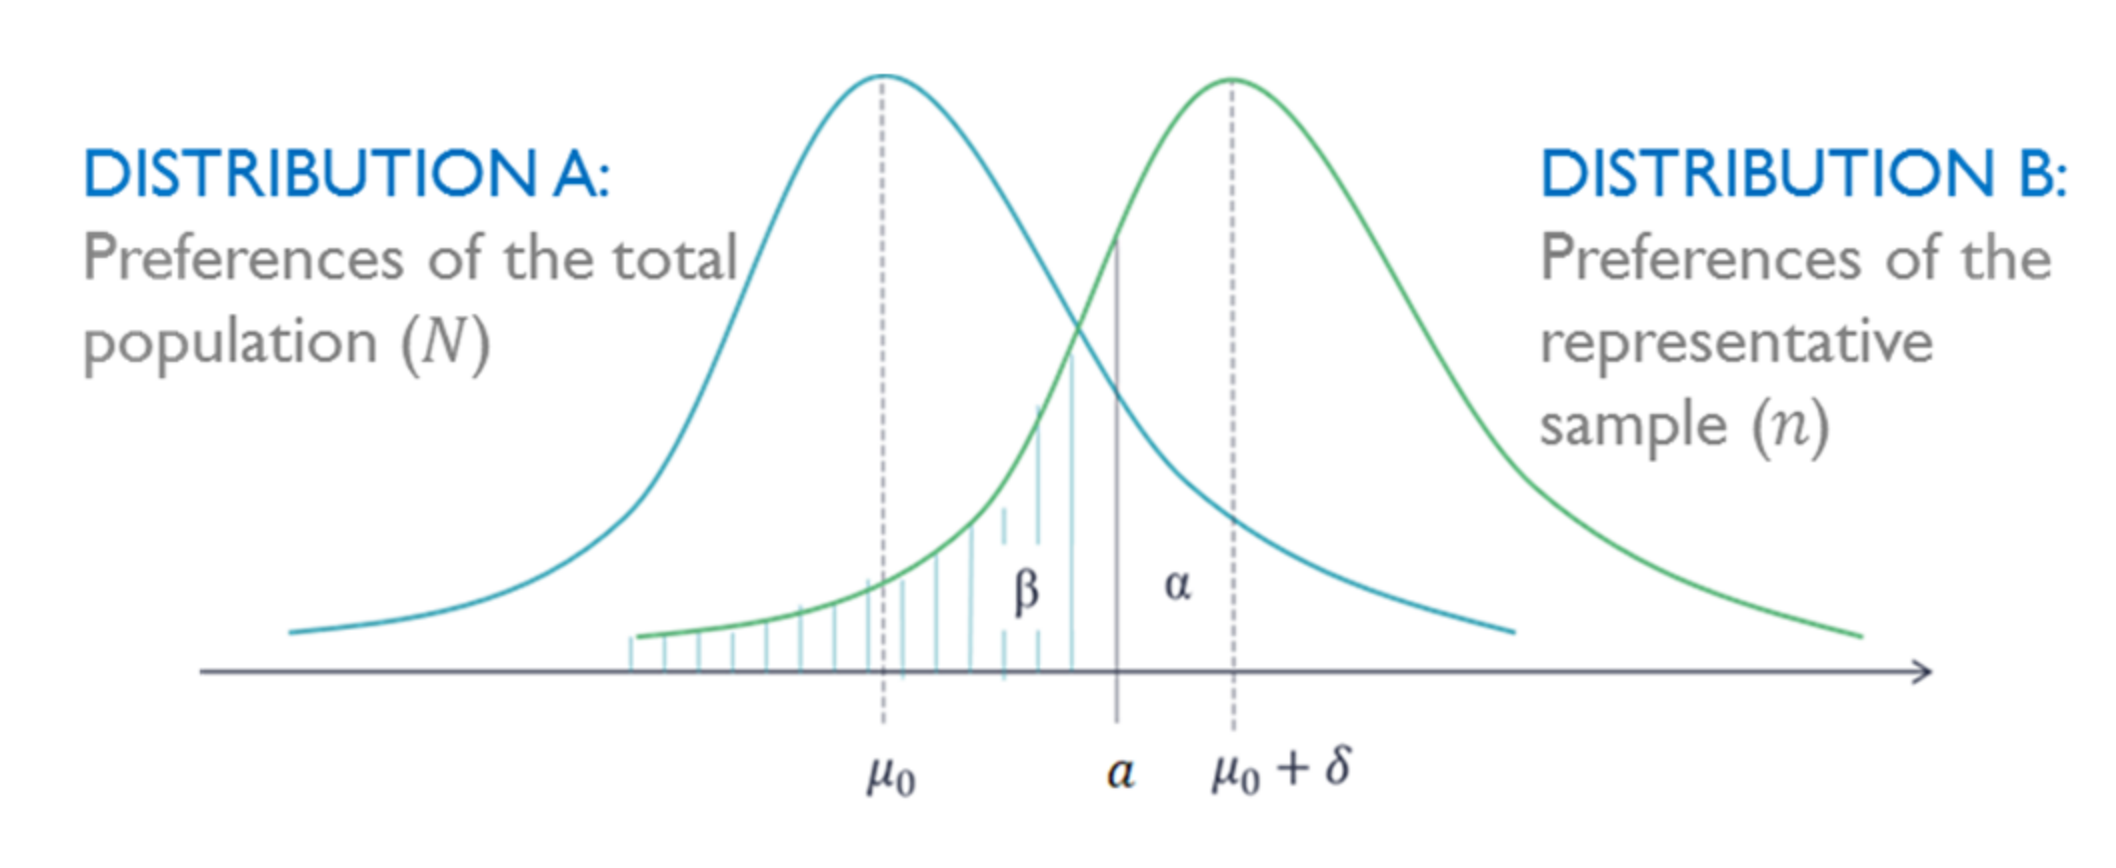
The representativeness of the samples was calculated to define the number of respondents necessary. A hypothesis test was used to estimate the representativeness of the sample, where the null hypothesis was that the sample was following the same probabilistic distribution of the total population (Figure 2).
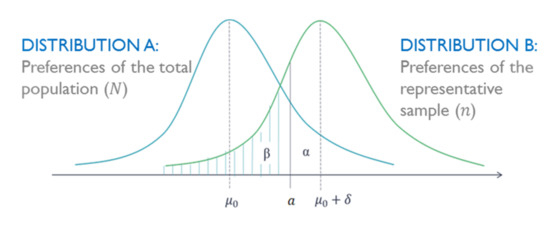
Figure 2.
Representation of the preferences of the total population and of the sample surveyed .
By fixing the probability to reject this hypothesis if true and the probability to accept it if false, we obtained the value of (representative sample size) for the use case () from a total population using Equation (1).
Here, is the variance, is the probability to select by the respondent and equal to 0.5; is the significance level or probability of error type I, rejecting the null hypothesis when it is true. is the critical value of Z (normal distribution) for a significance level , set at 0.05. is the probability of error type II, accepting the null hypothesis when it is not true. is the critical value of Z for = 0.80; and is the size effect equal to 0.5.
3.3.2. Intersectional Analysis
The minimum sample size for a specific granularity () can be obtained by the multiplication of the significant sample size for the aggregated analysis () by the proportion of people pertaining to the PI characteristics (based on Eurostat data) of the profile or granularity for analysis; see Equation (2).
Here, is the proportion (or percentage) of the population pertaining to each characteristic of the PI considered in the profile or granularity to be studied. Probabilities used were based on European data and can be seen in Table A1 of the Appendix A.
3.4. Consistency Ratio Analysis
Pairwise comparison responses coming from the survey for each cluster (i.e., level 2 FCs inside a level 1 FC) were translated into Saaty’s scale (Table 2) [62,63].

Table 2.
Correspondence between the answers to the survey and Saaty’s scale, were is the preferred fairness characteristic (FC) and is the comparison FC.
The values of the pairwise comparisons form, for each level, a comparison matrix A for each respondent:
To check inconsistencies in the responses, the consistency ratio of the matrices (A) obtained for each respondent was calculated using Equation (4).
Here, is the larger or principal eigenvalue of matrix A, is the size of the matrix, and RI is the random index, which is an experimental value that depends on [64]. Matrices with a CR above 0.1 were rejected and were not considered in the next steps for the calculation of the FC weights [59,65]. The use of this CR condition in the analysis allows the consideration of only those responses that are reliable.
3.5. AHP Calculations
Once the inconsistent responses were removed, the geometric mean of the responses for each pairwise comparison was obtained, which was used as the consensus value. The geometric mean was used instead of Delphi [66,67] due to the large quantity of responses. Methods such as Delphi are recommended when the responses come from a small group (e.g., 5–7 people) with which several iterations can be done to get a consensus response among all respondents or experts. After building the consensus matrix , the vector of priorities or the local normalized weights were obtained by normalizing the elements in each column and then averaging over each row (Equation (5)).
Global normalized weights () of the level 2 FCs were obtained by multiplying the local normalized weight by its corresponding level 1 FC. For example, in Table 1, use case 1, the global normalized weight of “1.1. Service availability and efficiency” would be obtained by multiplying its local normalized weight by the local normalized weight of the level 1 FC “1. Accessibility of service”. This allows the prioritization of the FCs for each use case from the most important (the one with the highest global normalized weight) to the least important (the one with the lowest global normalized weight).
Robustness of the results was analyzed performing a sensitivity analysis. The sensitivity analysis evaluates how minor changes in the judgments of the final decision to level 1 FCs vary the global weights obtained for level 2 FCs. Specifically, we studied the variation of the relative importance of the criteria of the second level in the rank when modifying the value of the local weights of level 1 FCs by a ±50%.
Aggregated and intersectional analysis based on the different profiles defined in the sociodemographic questionnaire was developed. The sociodemographic questions asked were based on the PI characteristics [2,3]. Merging the data from the six different languages and then translating it into English for homogenization were automatized using Matlab. To allow many possible combinations of sociodemographic analysis, the filtering process was automatized through a VBA code to filter the dataset to only those responses corresponding to the profile or PI characteristic to be analyzed. Finally, Matlab was used to perform the AHP weights calculation and other statistical computations (confidence level and power of the test, see Section 3.6.) of the sample automatically.
3.6. Statistical Significance of the AHP Results
The significance of results was calculated using the hypothesis test, which was defined as the null hypothesis that one FC was preferable to another. The estimated number of respondents preferring FC1 to FC2 is , and the real number of respondents preferring FC1 to FC2 is . The confidence level () is obtained using Equation (6).
The standard deviation () can be expressed as and , where is the number of responses preferring one FC to another, and is the probability of preferring one FC before another, in this case, .
In addition, the power of the test (1−) can be calculated using the equation shown in Figure 3.

Figure 3.
Representation of the calculation of .
Here, is the expected number of respondents not preferring FC1 to FC2, so the power of the test is obtained by subtracting from 1.
4. Results and Discussion
4.1. Use Case 1: Public transport—Railway Stations and Hyperloop
The needed sample size obtained after applying Equation (1), considering the European population, was 385. The total sample gathered was of 384 responses. Table 3 shows the sociodemographic statistics of the sample gathered based on different PI characteristics. In addition to this information, 18.49% of respondents said that they have felt discriminated against because of their appearance.

Table 3.
Sociodemographic statistics of the responses obtained to public transport—railway stations survey (n = 384).
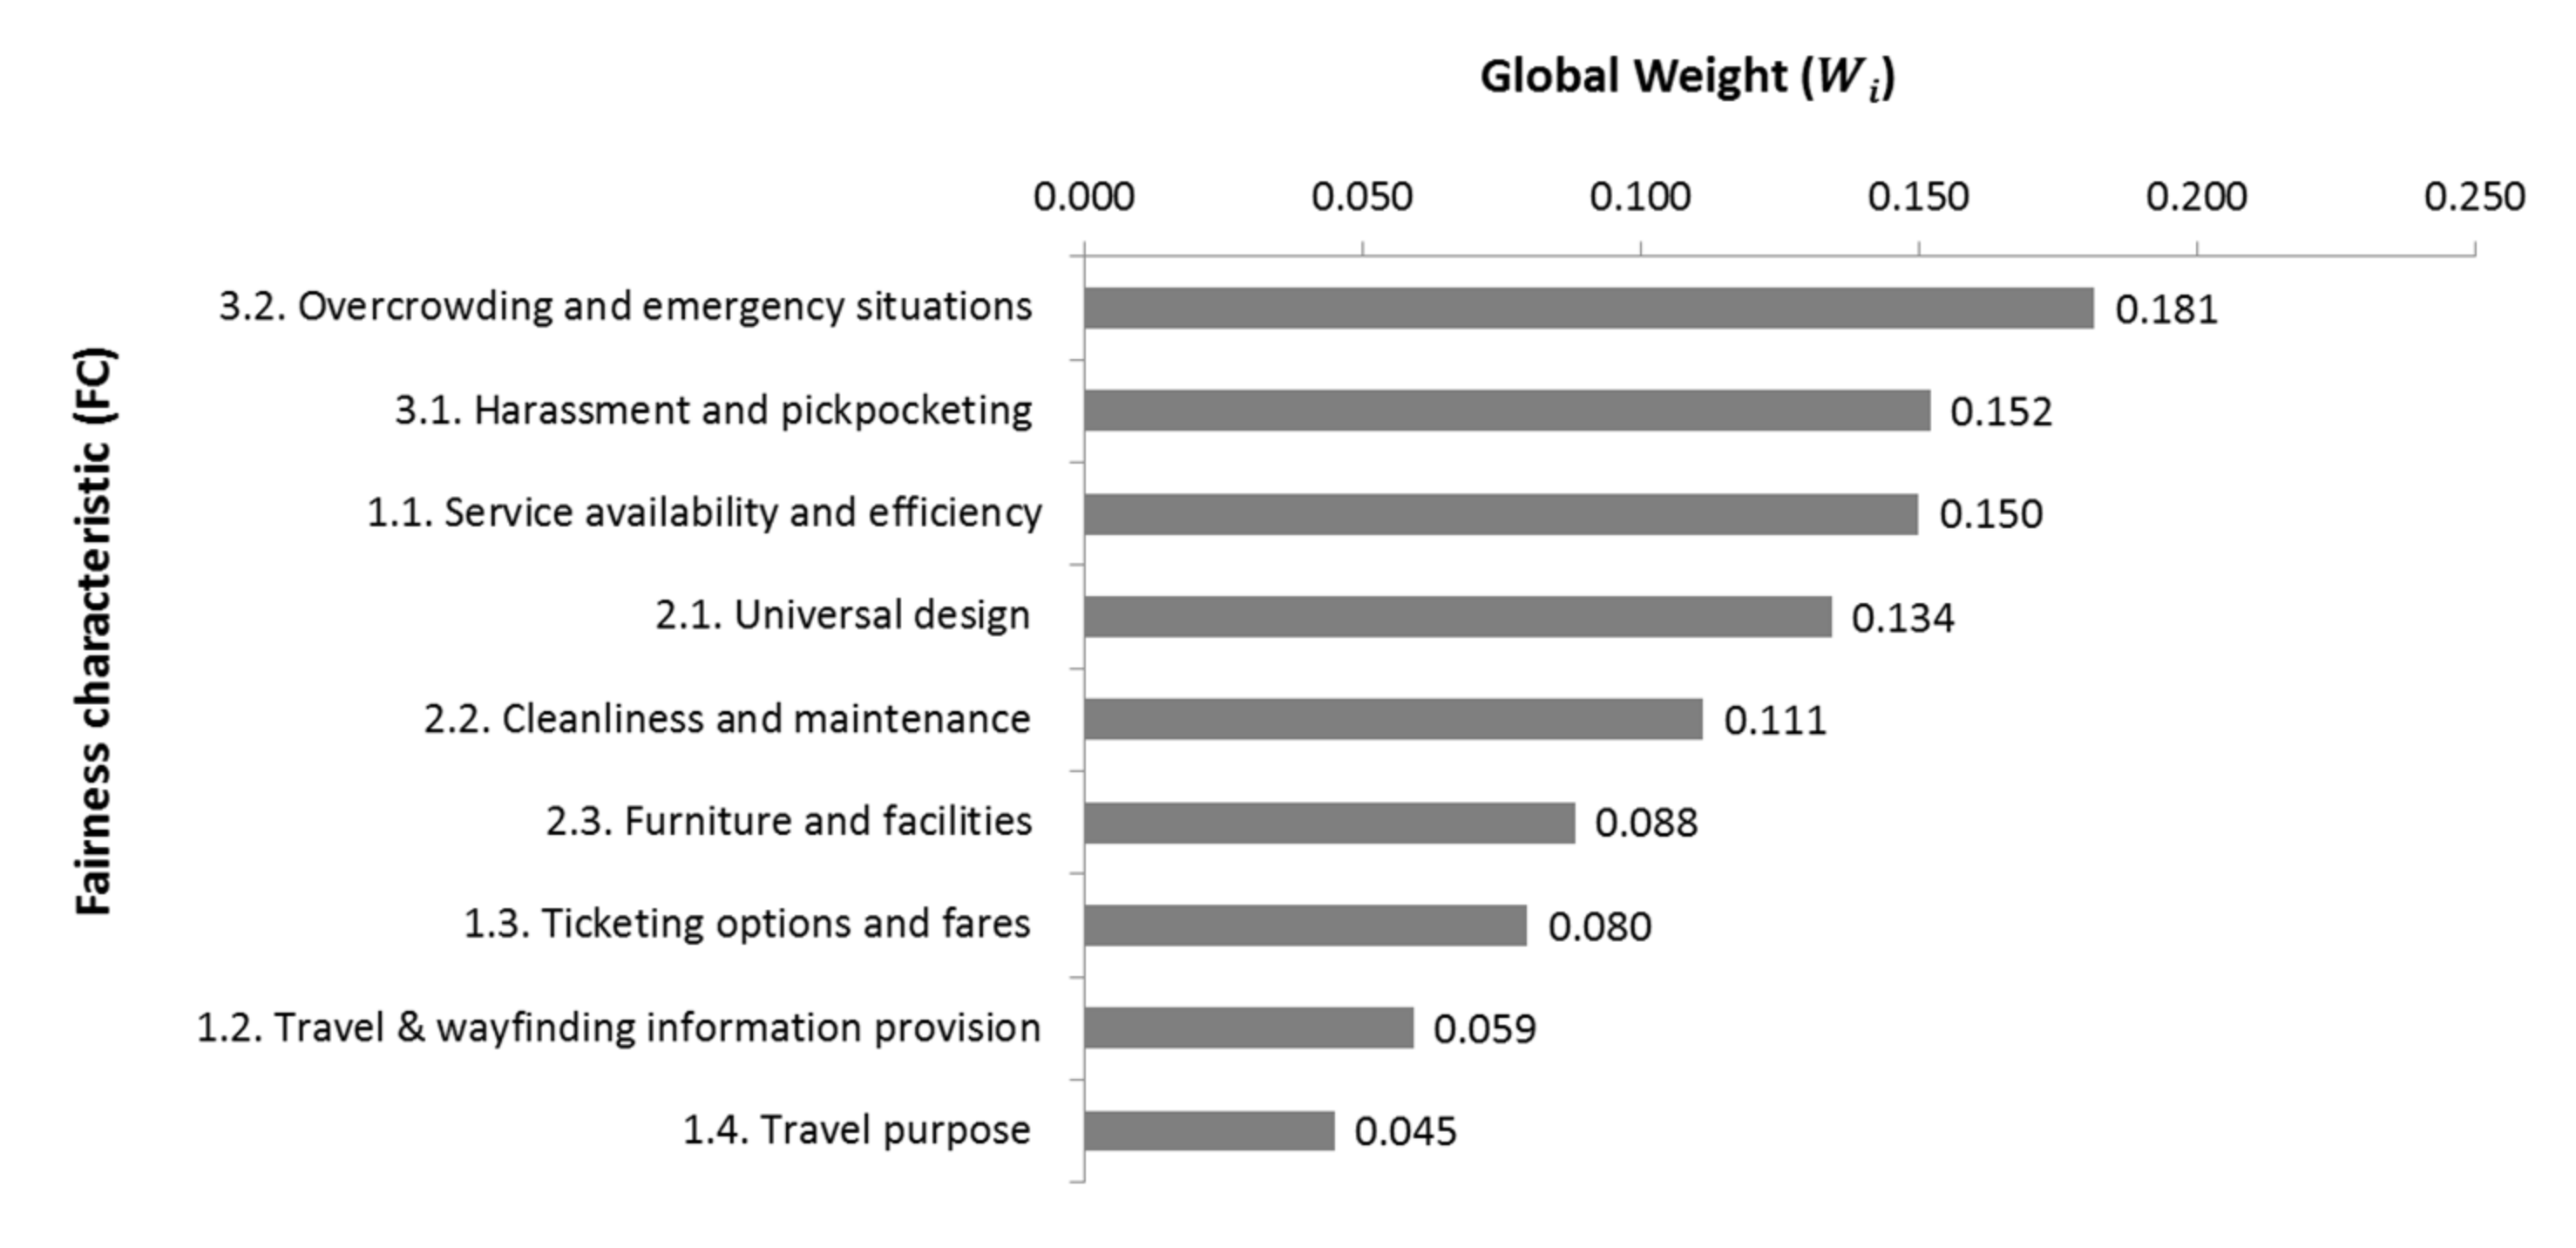
Analysis of the aggregated data resulted in an average of 170 consistent responses (representativeness of the sample 33.94%) with a confidence level of 0.50 and a statistical power of 0.45. Figure 4 shows the hierarchy of level 2 FCs obtained after the AHP analysis from the most important to the least important. Level 1 FCs were weighted equally in this analysis.
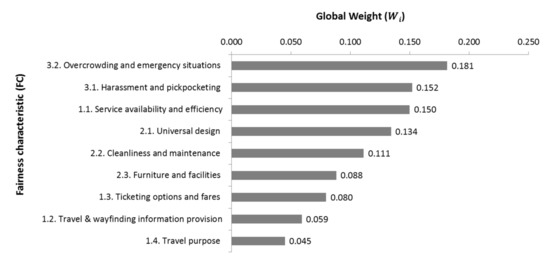
Figure 4.
Hierarchy of level 2 fairness characteristics for public transport—railway stations.
The results indicate that safety and security issues were the main priorities for transport users: to use the service, users need to feel safe. Overcrowded stations and the consequences of emergency situations were the most important aspects for the satisfaction of users with a rail station. In general, feeling safe is the most important factor when using the public transport service and also in other aspects of our life. Feeling safe is essential to feeling comfortable and, this must be the case if someone prefers using railway stations instead of other transport options. Overcrowded stations make people feel uncomfortable or even feel that their life could be compromised in case of an emergency situation (e.g., fire, floods, etc.). In addition, in these kinds of circumstances, there is a higher probability of pickpocketing incidences. Therefore, it is logical to have the overcrowding factor in the first position of the ranking. The second factor with a higher weight was harassment and pickpocketing, which make people feel unsafe. If harassment and pickpocketing are usual in a station, users will change to other stations or other modes of transport. For a good user experience and a higher use of this mode of transport, it is needed to reduce anything that can compromise the safety, security, and comfort of transport users. Harassment and pickpocketing are not specific problems that happen only at a station, but they tend to be a general problem for the neighborhood or region. In addition to specific measures that can be applied in the station (e.g., security personnel, CCTV, support/help office), other policy measures, advertisement campaigns, and societal education should be considered by politicians, regulators, and the mass media.
The third FC was service availability and efficiency. The use of a station was intimately linked to the level of service, which was mainly related to the frequency of and adjustments in the timetable. If the timetable does not suit user needs (e.g., work time entry and exit, good timetable to come back from shopping zones), they will only use the service as their last option. Therefore, after safety and security factors, the worthiness, related to the frequency of trains and adjustment to the travel needs of potential users, is the third most important factor. If a service is safe and useful for me, then I will consider using it. Universal design was also a highly ranked FC, which is mainly related to the design of the station to make it accessible for everyone, with adequate lifts, escalators for people carrying things or traveling with a baby in a pram, and disabled people or people with special needs (e.g., the visually impaired). Then, after having a station that is safe and secure, with the frequency of trains and destinations needed by the users, the next important factor is its accessibility for everyone; if the station is not adequate to my mobility needs, then I will not use it. The next FC in the ranking was cleanliness and maintenance; people feel more comfortable and prefer to be in a well-maintained station rather than in a dirty one with broken seats, signals, maps, and lighting, or with vandalism or graffiti, as this makes people feel insecure and would reduce station use. The last FC summing 80% of the weights (cumulative weight) was furniture and facilities, which are related to the furniture used in the station to accommodate people and their fellow travelers, including children, appropriate seats for pregnant, elderly, or disabled people, and adequate space for prams or wheelchairs, as well as the facilities needed in the station for normal needs, such as toilets designed for women and disabled people or baby changing rooms.
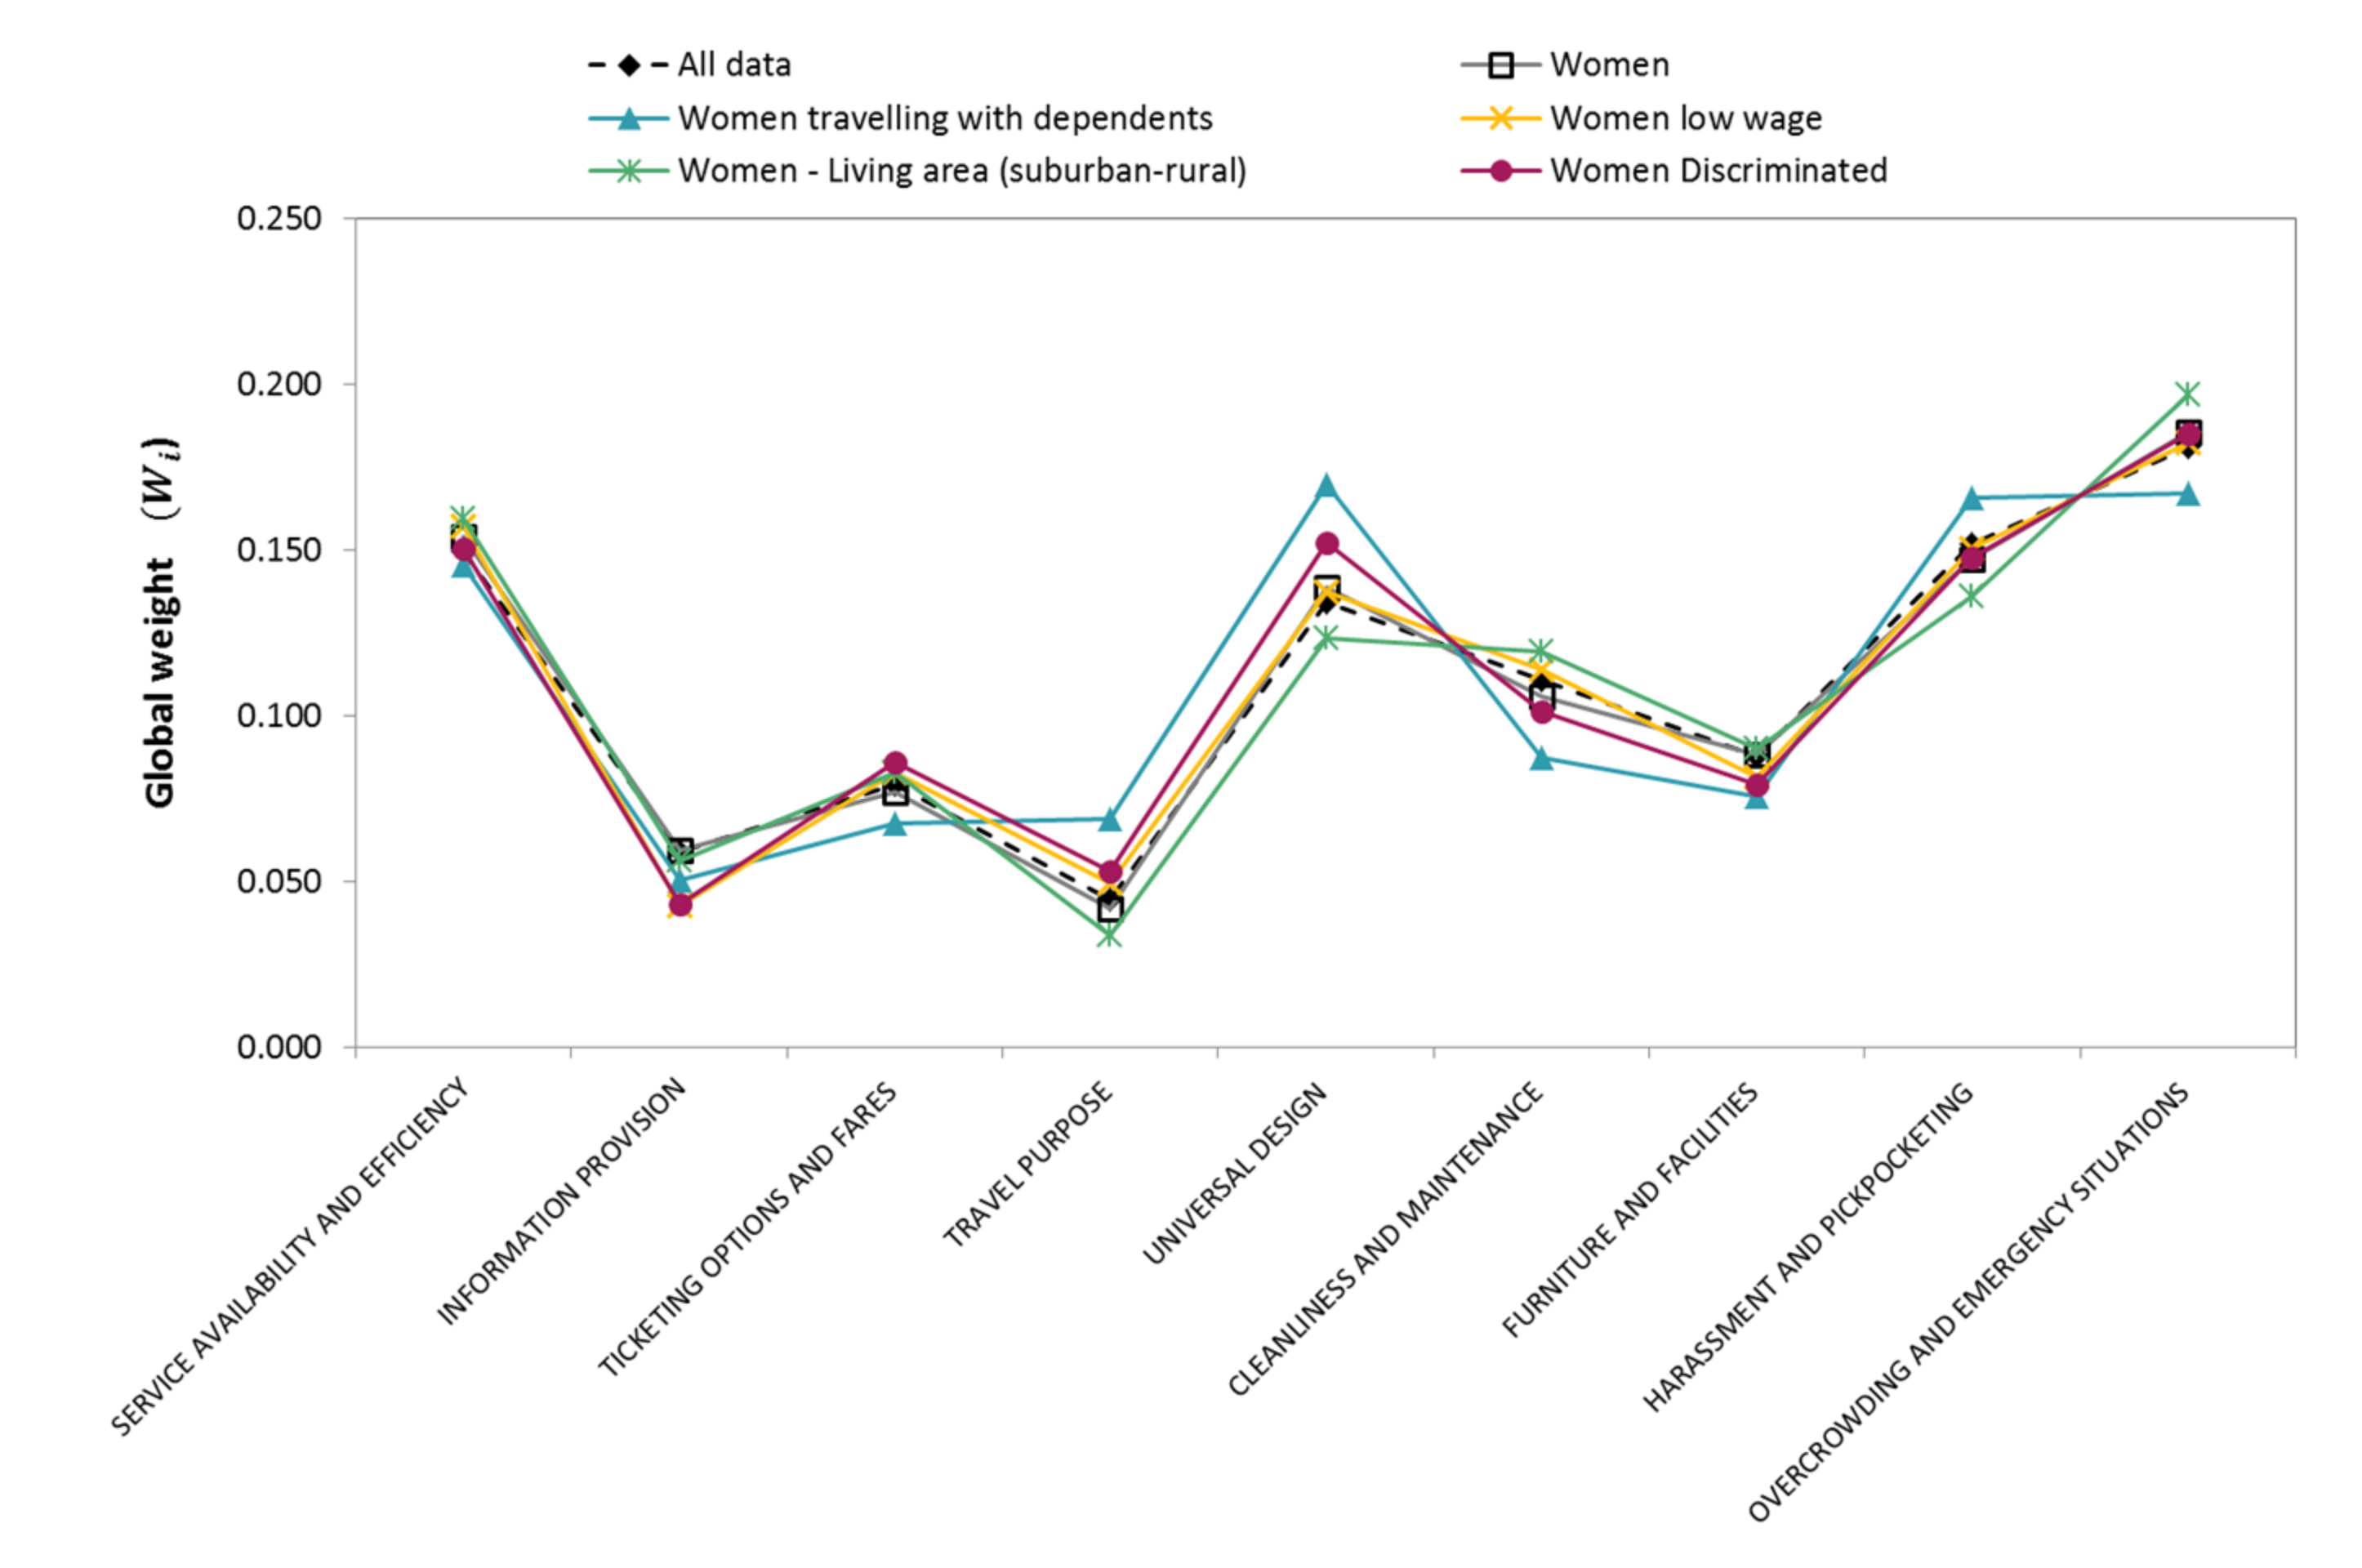
The algorithms developed in Matlab made it quick to obtain the AHP weights for different profiles. Figure 5 shows an example of the weights obtained for some profiles. The results obtained for women, women traveling with dependents, women with wages lower than 21,000 €/year, women living in rural and urban areas, and women who have, at some point, felt discriminated against were selected for comparison purposes, as these are some of the profiles mentioned as those whose barriers need to be considered and thus provide opportunities for improvement in the transport system.
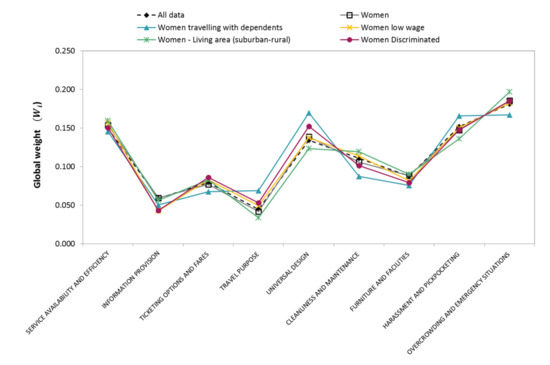
Figure 5.
Differences in global weights of level 2 fairness characteristics for different polyhedral individual characteristics regarding railway station preferences.
In general, the results show that the distribution of weights is quite similar among these groups, with some small changes. Women traveling with dependents placed more importance than other groups on universal design, and this FC was the most important for them. They also placed more importance than other groups on harassment and pickpocketing and travel purpose. While all of the other groups gave greater importance to ticketing options and fares than to travel purpose, women traveling with dependents were the only group that placed more importance on travel purpose compared to ticketing options and fares. Where they go and with whom directly influenced the use of transport mode. If rail transport was able to fulfill their mobility easily (e.g., space needs, easy to move using lifts, easy to get on board), they would not have mobility restrictions and would be more willing to use rail public transport. Regarding women living in rural and suburban areas, they gave more importance than other groups to cleanliness and maintenance and to overcrowding and emergency situations. The higher importance for cleanliness and maintenance could be because of their experience in stations, as rural stations may experience poorer maintenance regimes than urban ones. Regarding overcrowding, urban people were more accustomed to being in contact with many people every day, while the rural environment tends to be quieter and less crowded. This social difference could influence the perception or importance of some FCs. People living in rural or suburban areas also weighted harassment and pickpocketing lower than other groups; however, this factor was still among the three most important factors.
Results of the sensitivity analysis developed for all the profiles can be seen in Appendix A Table A2, which show only a few changes in the ranking, 15%, indicating that the results obtained are robust.
According to the ID, the scenario “public transport—railways station” has a vertex for future business models and public transport provisions. For this case, we considered, as an example, the future scenario of hyperloop stations. Survey respondents were asked about their preferences regarding level 1 FCs to establish a hierarchy instead of considering all of them with an equal weight. The results are shown in Figure 6.
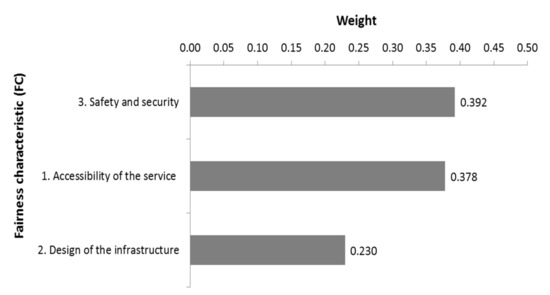
Figure 6.
Hierarchy of level 1 fairness characteristics for public transport in the future: hyperloop.
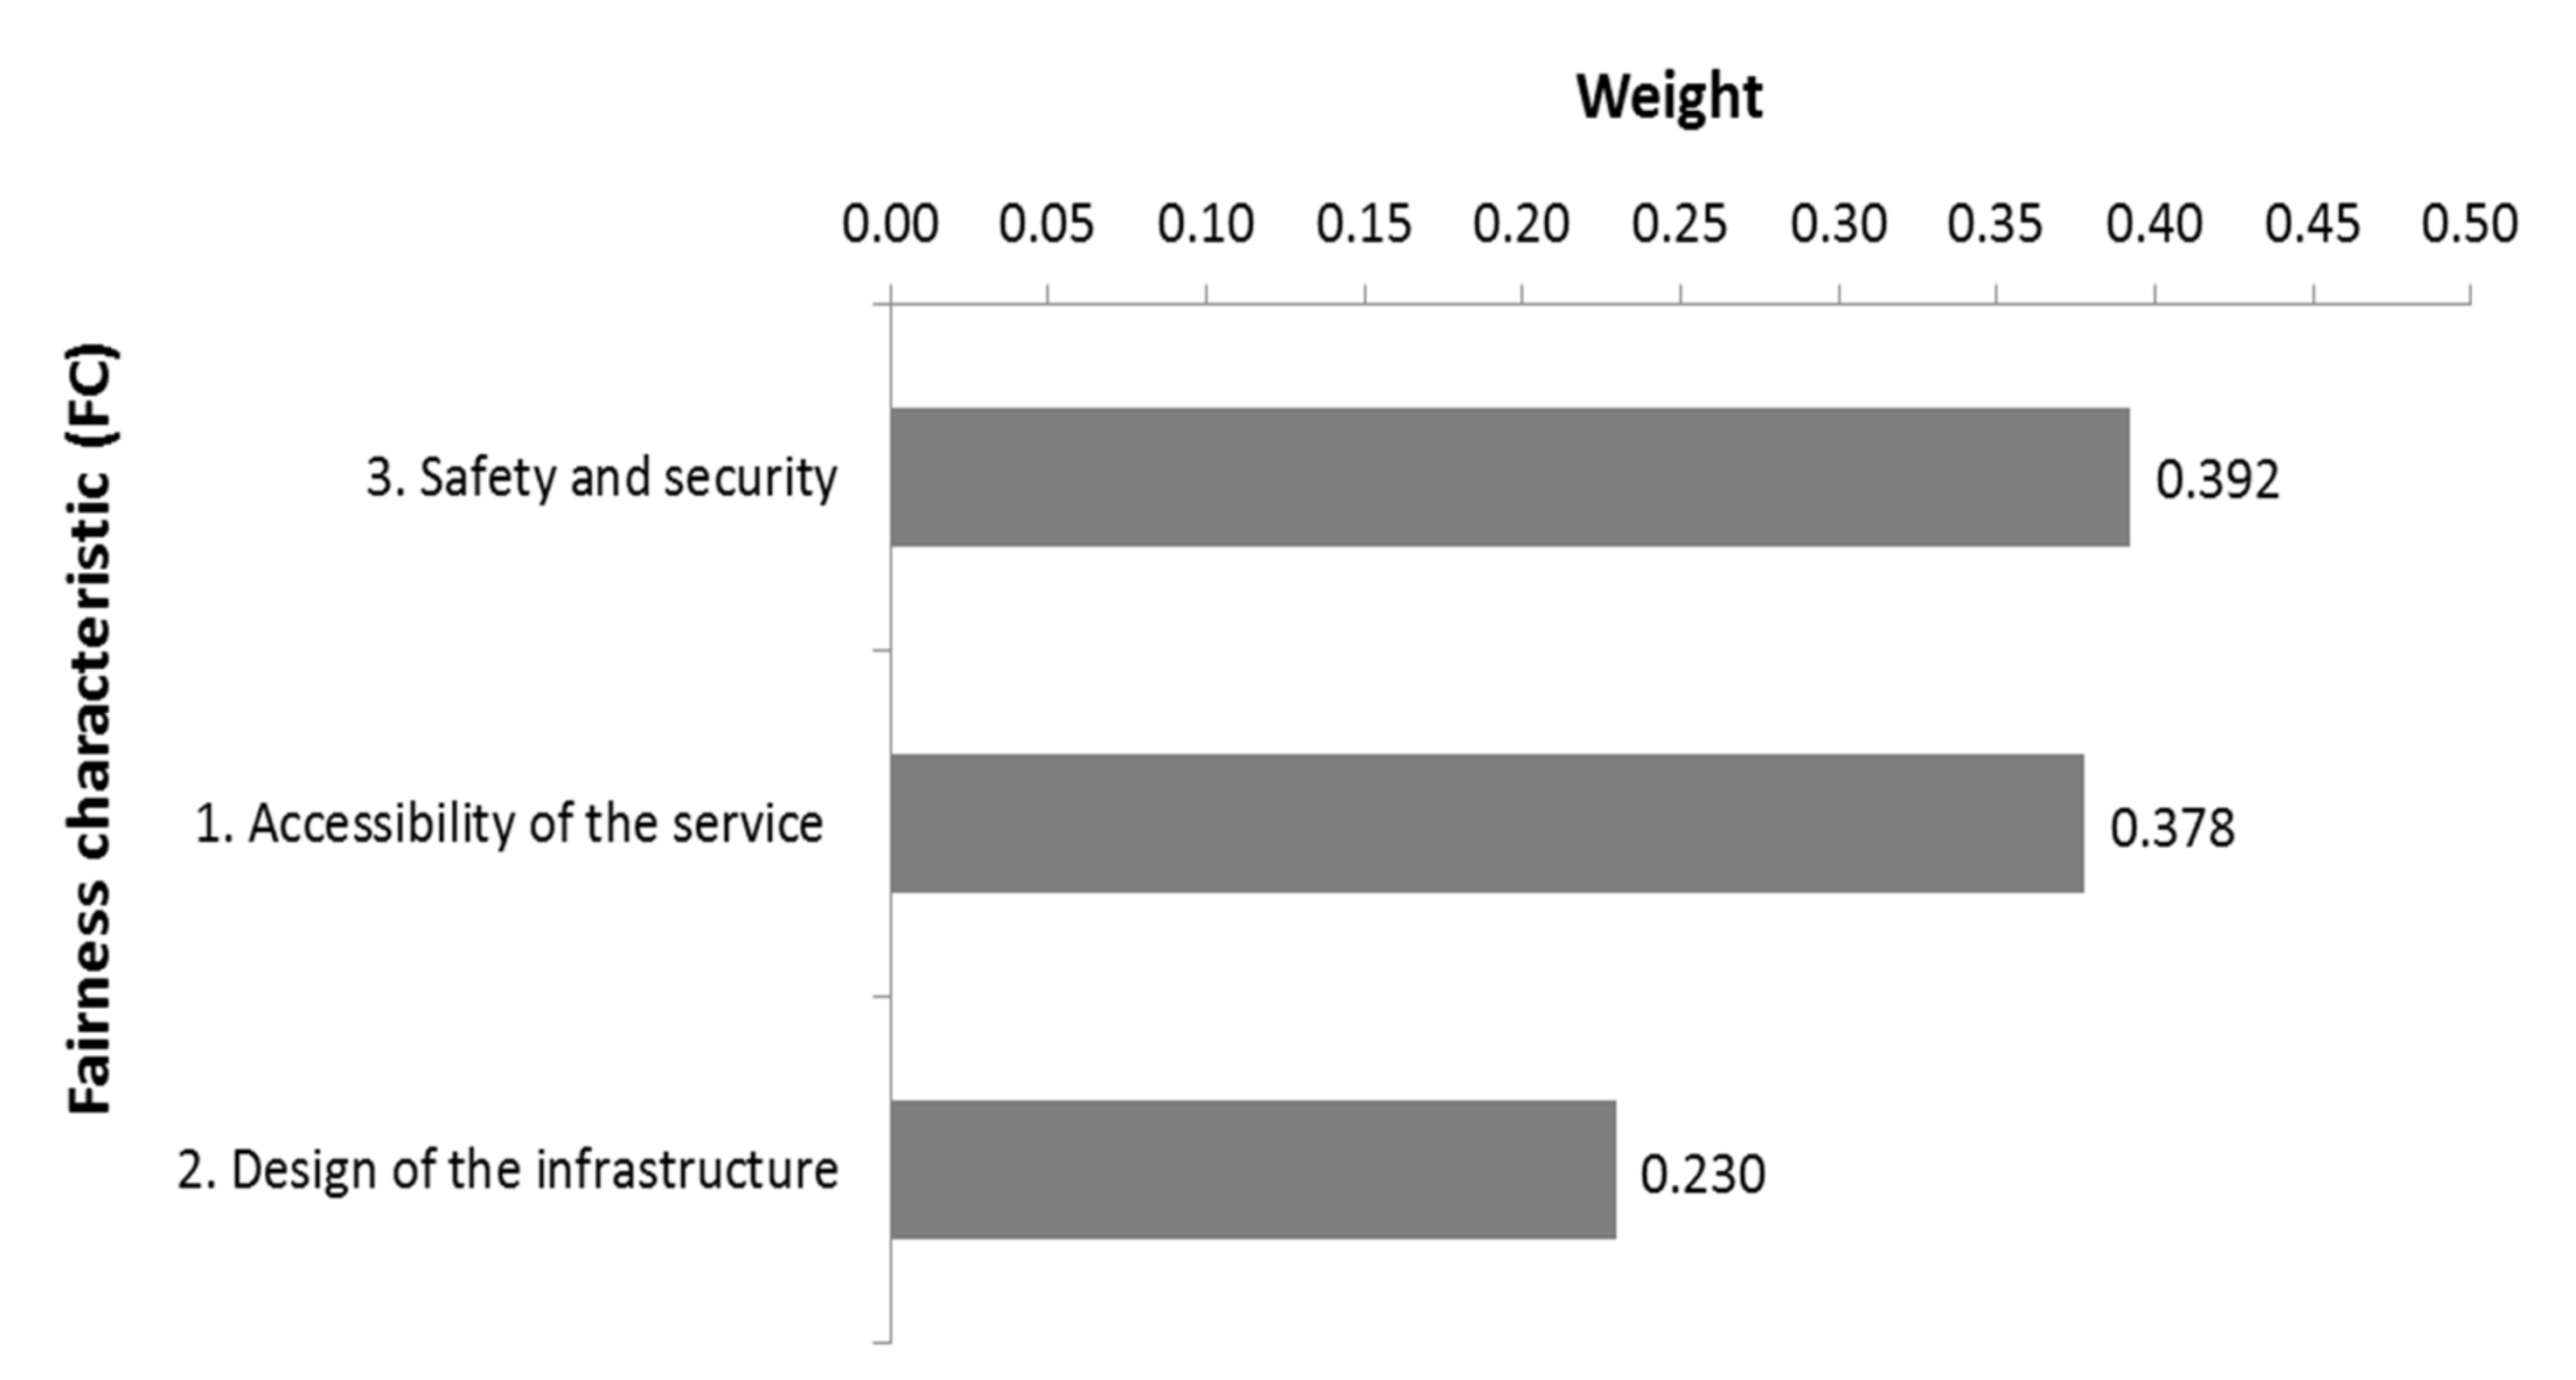
The results indicate that respondents place the highest importance on safety and security issues: any new transport model or public service needs to be safe for people to use it. If this safety is not guaranteed at a high level and people do not feel safe, they will not use the new transport model. Very close to safety and security issues was the accessibility of the service FC, which refers to issues such as ticketing options and fares, service availability and efficiency, travel purposes, and good travel information that makes its use easy. If the service fulfills individual travel needs (origin–destination) and can easily be accessed at a good price, then people will use it. In 2017, the EU published a report on a survey in which one of the issues analyzed was the implementation of the hyperloop. One of the issues mentioned was that hyperloop would be useful for non-stop long distance travel and for large populated areas, and one of the main issues was its high costs [68]—both of which affect this FC. The last level 1 FC was infrastructure design; this does not mean it is not important—in fact, its weight is of 0.23—but it was less important than safety and security and accessibility. However, all three areas should be assessed for good future acceptance of the hyperloop.
4.2. Use Case 2: Autonomous Vehicles
The needed sample size obtained after applying Equation (1), considering the European population, was 385. The total sample gathered was of 116 responses. Table 4 shows the sociodemographic statistics of the sample gathered based on different PI characteristics.

Table 4.
Sociodemographic statistics of the responses obtained from the autonomous vehicles survey (n = 116).
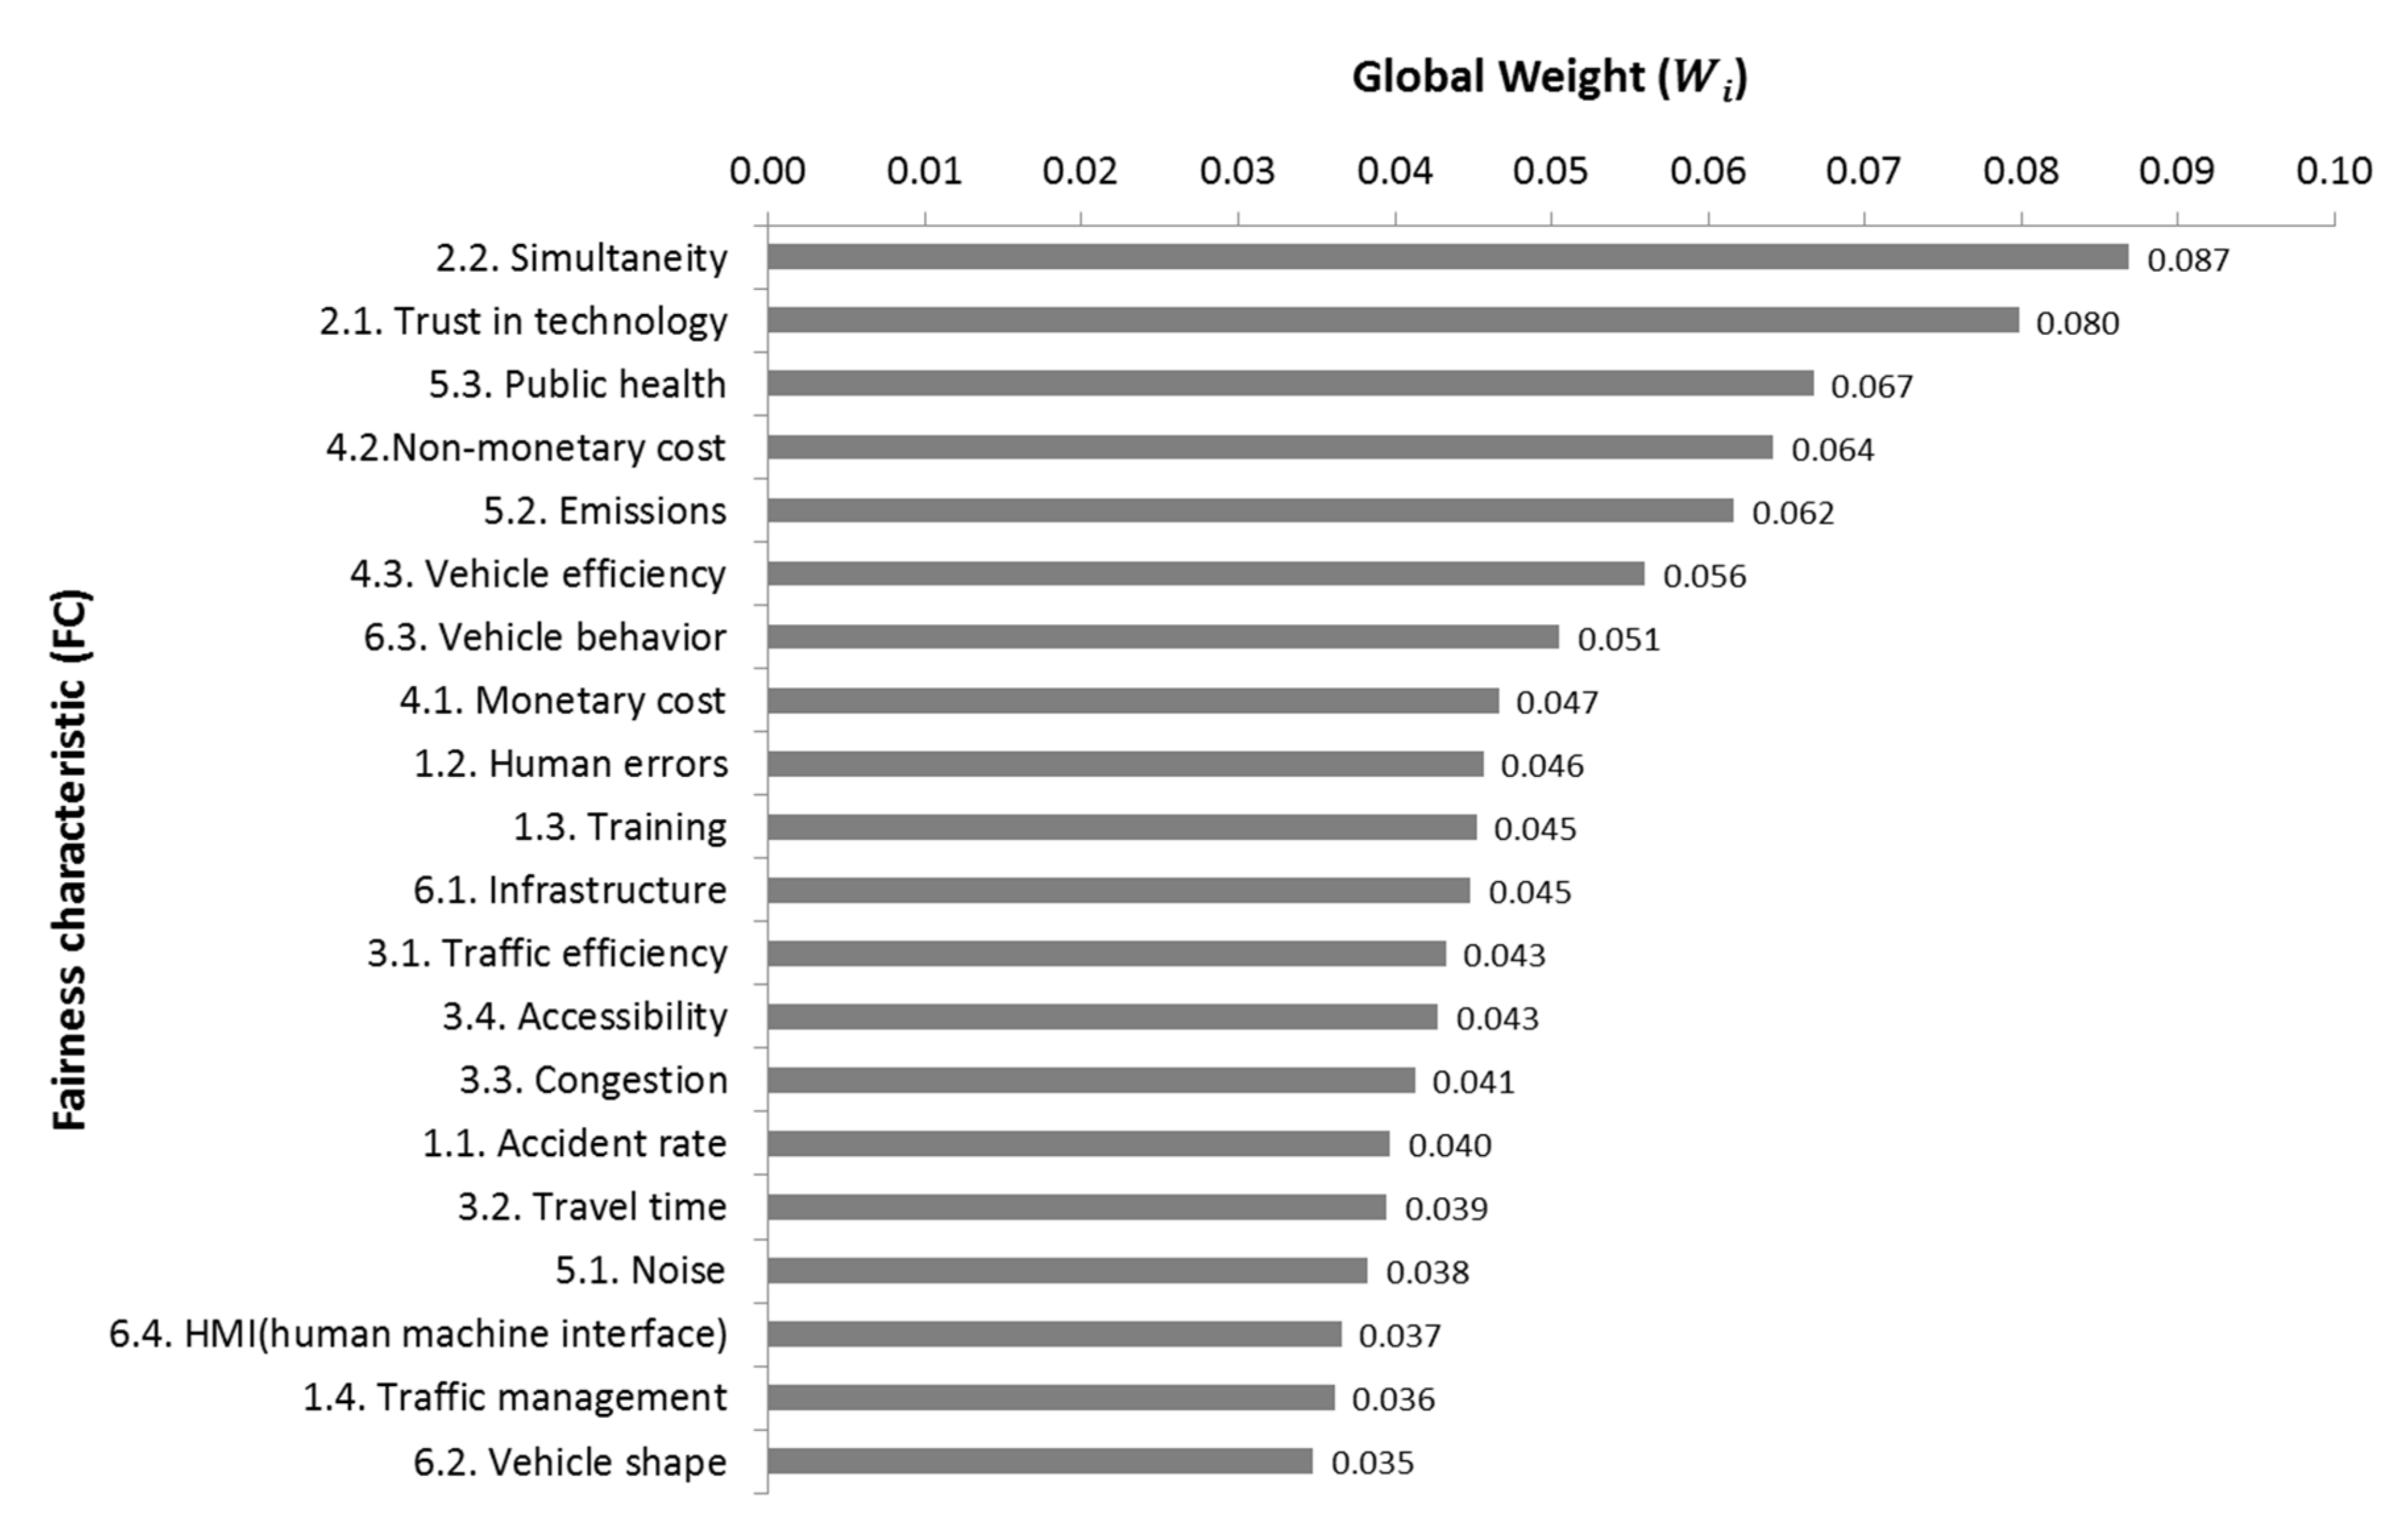
The analysis of the aggregated data resulted in an average of 52 consistent responses (representativeness of the sample 10.31%) with a confidence level of 0.17 and a statistical power of 0.83. Figure 7 illustrates the hierarchy of level 2 FCs obtained after an AHP analysis from the most important to the least important. FCs level 1 were weighted equal in this analysis.
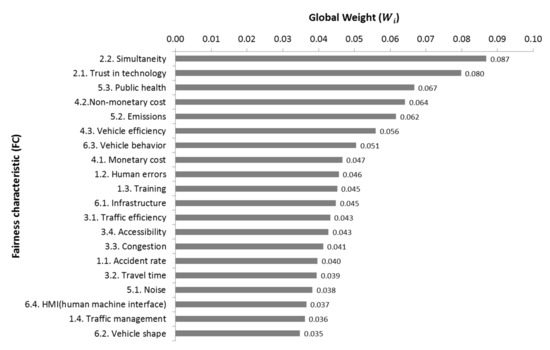
Figure 7.
Hierarchy of level 2 fairness characteristics for autonomous vehicles.
The results indicate that simultaneity and trust in technology are the most important factors influencing respondents’ acceptance of AVs. People need to feel safe in different traffic situations, such as rain, when someone is crossing the street, or if there is a car broken down or stopped in the middle of a highway. Users need to trust the system capabilities to manage these situations and also feel comfortable in normal conditions, so that the effect of the speed or the smoothness of the AV trip does not make them feel dizzy or uncomfortable. The use of a fully autonomous car can benefit people doing an additional thing, such as reading a book or watching a film, while the car drives (simultaneity), and this was the most important benefit highlighted by respondents influencing the acceptance of AVs. In order to make possible the change from non-autonomous vehicles to fully autonomous vehicles, the user needs to obtain some benefits or additional services that improve their travel or driving experience; and simultaneity was considered by potential users as the main benefit of the use of autonomous cars and the factor that will make them consider buying an AV.
Public health was rated as the third most important factor. Public health is understood in this scenario as the benefits of using AVs related to a reduction in air pollution due to an optimization of car use and the use of cleaner technologies together, with the mental benefit of reduced stress from not having to drive in stressful situations. This factor was also related to the FC vehicle efficiency (sixth in importance in the table) and emissions (fifth), which refer to efficient fuel consumption due to optimized driving, as well as the synchronization of the conflict point and its associated reduction of greenhouse gases emissions, respectively. Another important factor for accepting the use of AVs was “non-monetary costs”, which is related to the non-monetary benefits obtained such as saving time or increased traffic safety. Therefore, respondents considered that the use of AVs will have some indirect benefits to the whole society, mainly related to health, safety, and the environment. An important issue related to the performance of AVs that arises from the analysis is vehicle behavior. AV behavior needs to be predictable to other vehicles, and AV reaction times to a sudden change in traffic should be short. If there is wide acceptance of this type of vehicle, inappropriate behaviors such as driving while drunk or at very high speeds would also be reduced to a large extent, increasing the safety of all the road users.
The cost of AVs was the eighth most important factor affecting AV purchase or use. Once AVs fulfill the requirements for benefits and trust in the technology, then it is time to consider the costs. AVs need to be affordable by the whole population if high society-wide acceptance is sought to build a safer and more sustainable transport economy. The use of AVs will be closely related to acquisition costs. The last FCs, summing 80% of the weights (cumulative weight), were human errors and training. These two FCs were related to AVs with a level of autonomy up to L4 [69] when there are situations that require human intervention. It is very important that errors due to the need for human intervention are reduced to a minimum, which could be fulfilled by fully autonomous cars rated L4+. In cases where there is the possibility that a driver would need to take control, it was assessed as important to have a special training for such vehicles to reduce any possible mistakes or slow reactions from the driver. As in the previous use case, selected profiles were analyzed as an example and considered interesting with our objective to increase the acceptance of AVs by women (Figure 8).
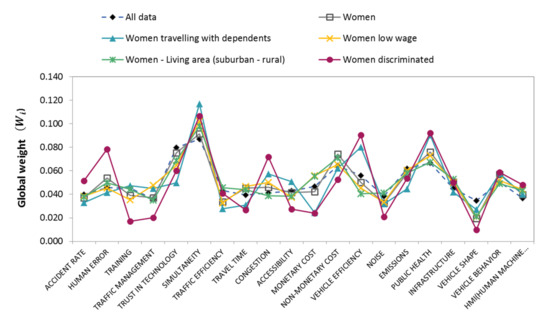
Figure 8.
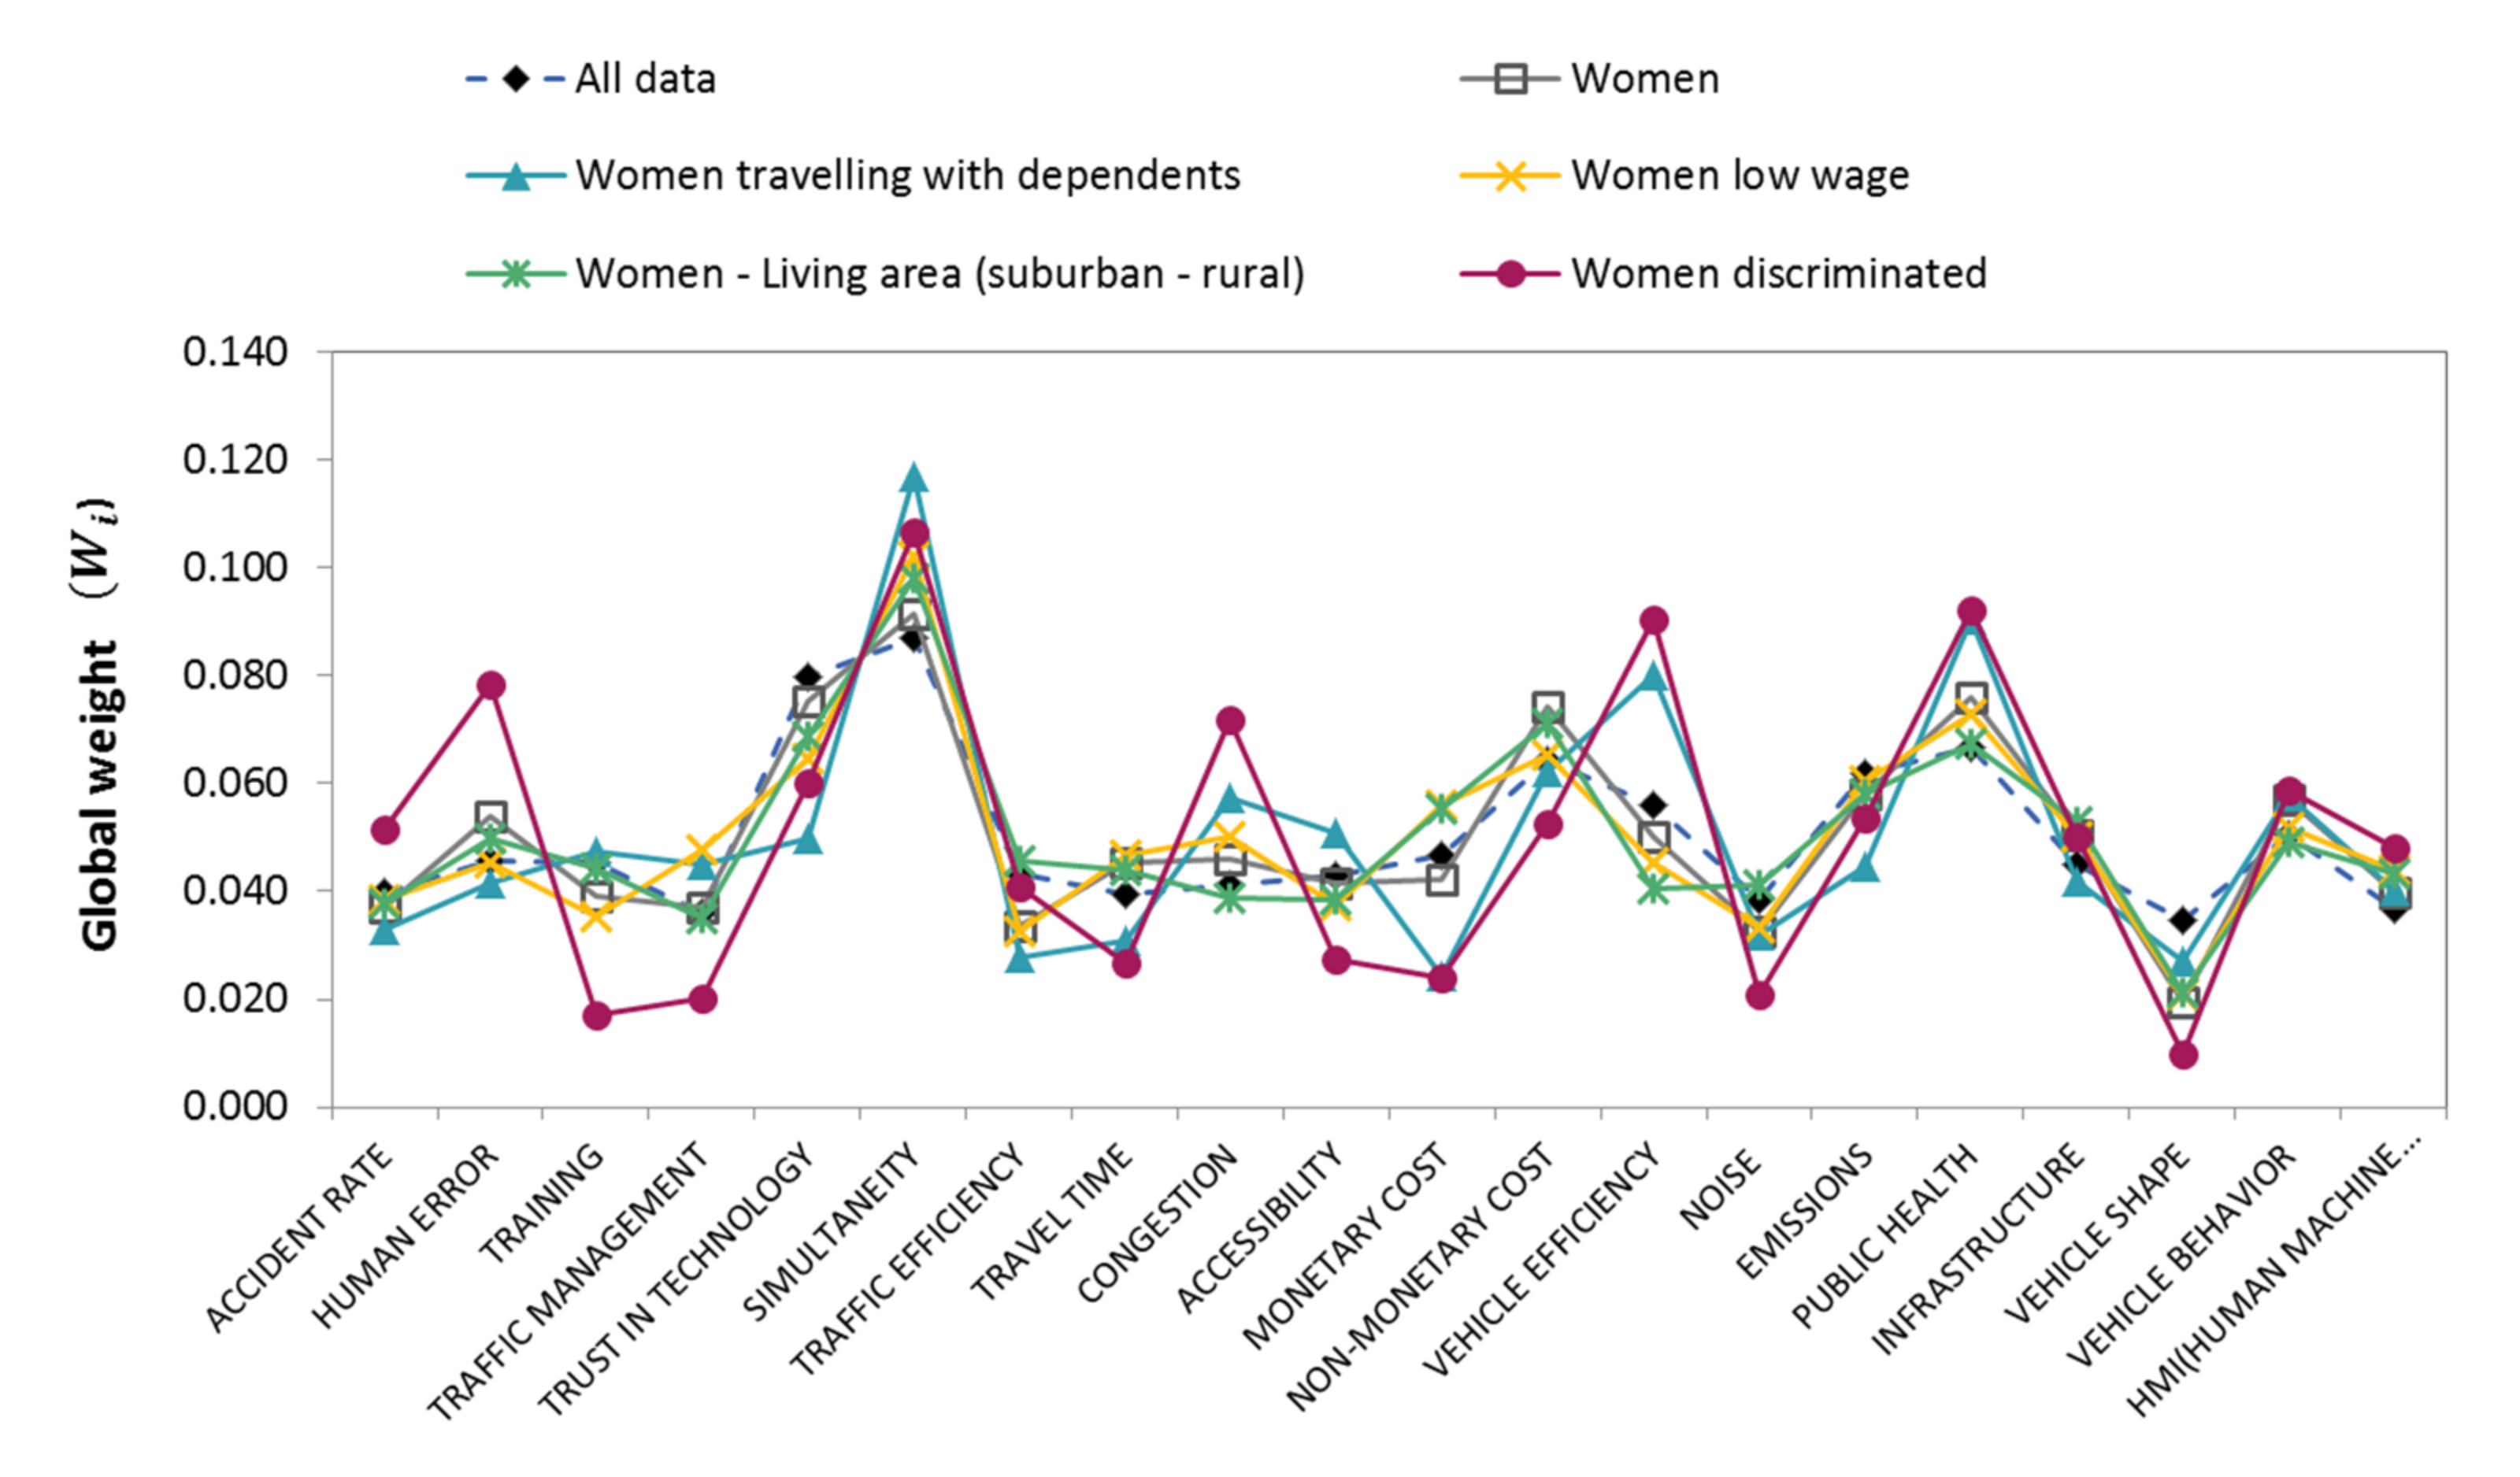
Differences in global weights of level 2 fairness characteristics for different polyhedral individual characteristics regarding autonomous vehicles.
The results indicate that the ranking of women’s preferences and those of the overall population for the acceptance of AV use are quite similar. In general, priorities were quite similar for all profiles, with some deviations in the profiles of women who have felt discriminated against using transport and among women traveling with dependents. Women who have suffered discrimination rated aspects such as accident rate, human errors, congestion, vehicle efficiency, and public health higher than other profiles, and aspects such as training, traffic management, travel time, accessibility, monetary costs, noise, and vehicle shape (i.e., differentiation of AV from non-automated vehicles, as well as clarity of vehicle’s driving mode to other drivers) lower than other profiles. Women traveling with dependents rated simultaneity (although this was the most important factor for all profiles), congestion, accessibility, vehicle efficiency, and public health higher than the overall sample. Therefore, women traveling with dependents give priority to the aspects related to safety, health, and the comfort of themselves along with of those who travel with them and need their help when selecting a specific transport option, since they do not only think of their own well-being but give priority to the well-being of those they love and are in charge of. They gave lower importance to traffic efficiency, travel time, monetary costs, emissions, and vehicle shape. For women traveling with dependents, it appeared that aspects related to ease and comfort of travel were more important, while the time needed to reach their destination was not as important. Public health, vehicle efficiency, simultaneity, emissions, and non-monetary cost were the top five priorities for them; while vehicle shape, traffic efficiency, travel time, human–machine interface (HMI), and infrastructure received the lowest scores. It should also be noted that people living in rural and suburban areas prioritized the monetary costs of vehicles over efficiency. The lower wages of people living in rural areas and the expected high costs of AVs make them rate higher the monetary cost factor. It is not as important for them if the AV is very efficient if they cannot afford it, so first, they should be able to afford it in order to think if it is efficient enough for considering buying it.
Results of the sensitivity analysis developed for all the profiles can be seen in Appendix A Table A3, which show only a few changes in the ranking, 10%, indicating that the results obtained are robust.
The AV use case has a vertex for future vehicles. For this case, we considered, as an example, the future scenario of a fully autonomous vehicle (L4+). Respondents were asked about their preferences regarding level 1 FCs to establish a hierarchy instead of considering all of them with the same equal weight. The results are shown in Figure 9.
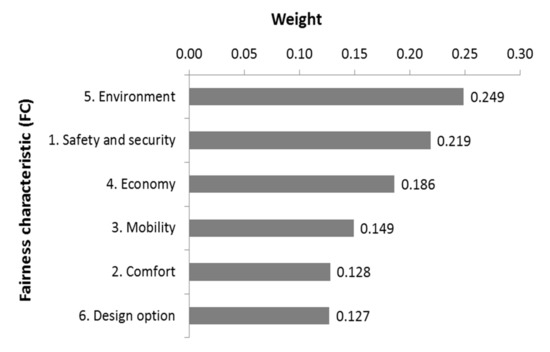
Figure 9.
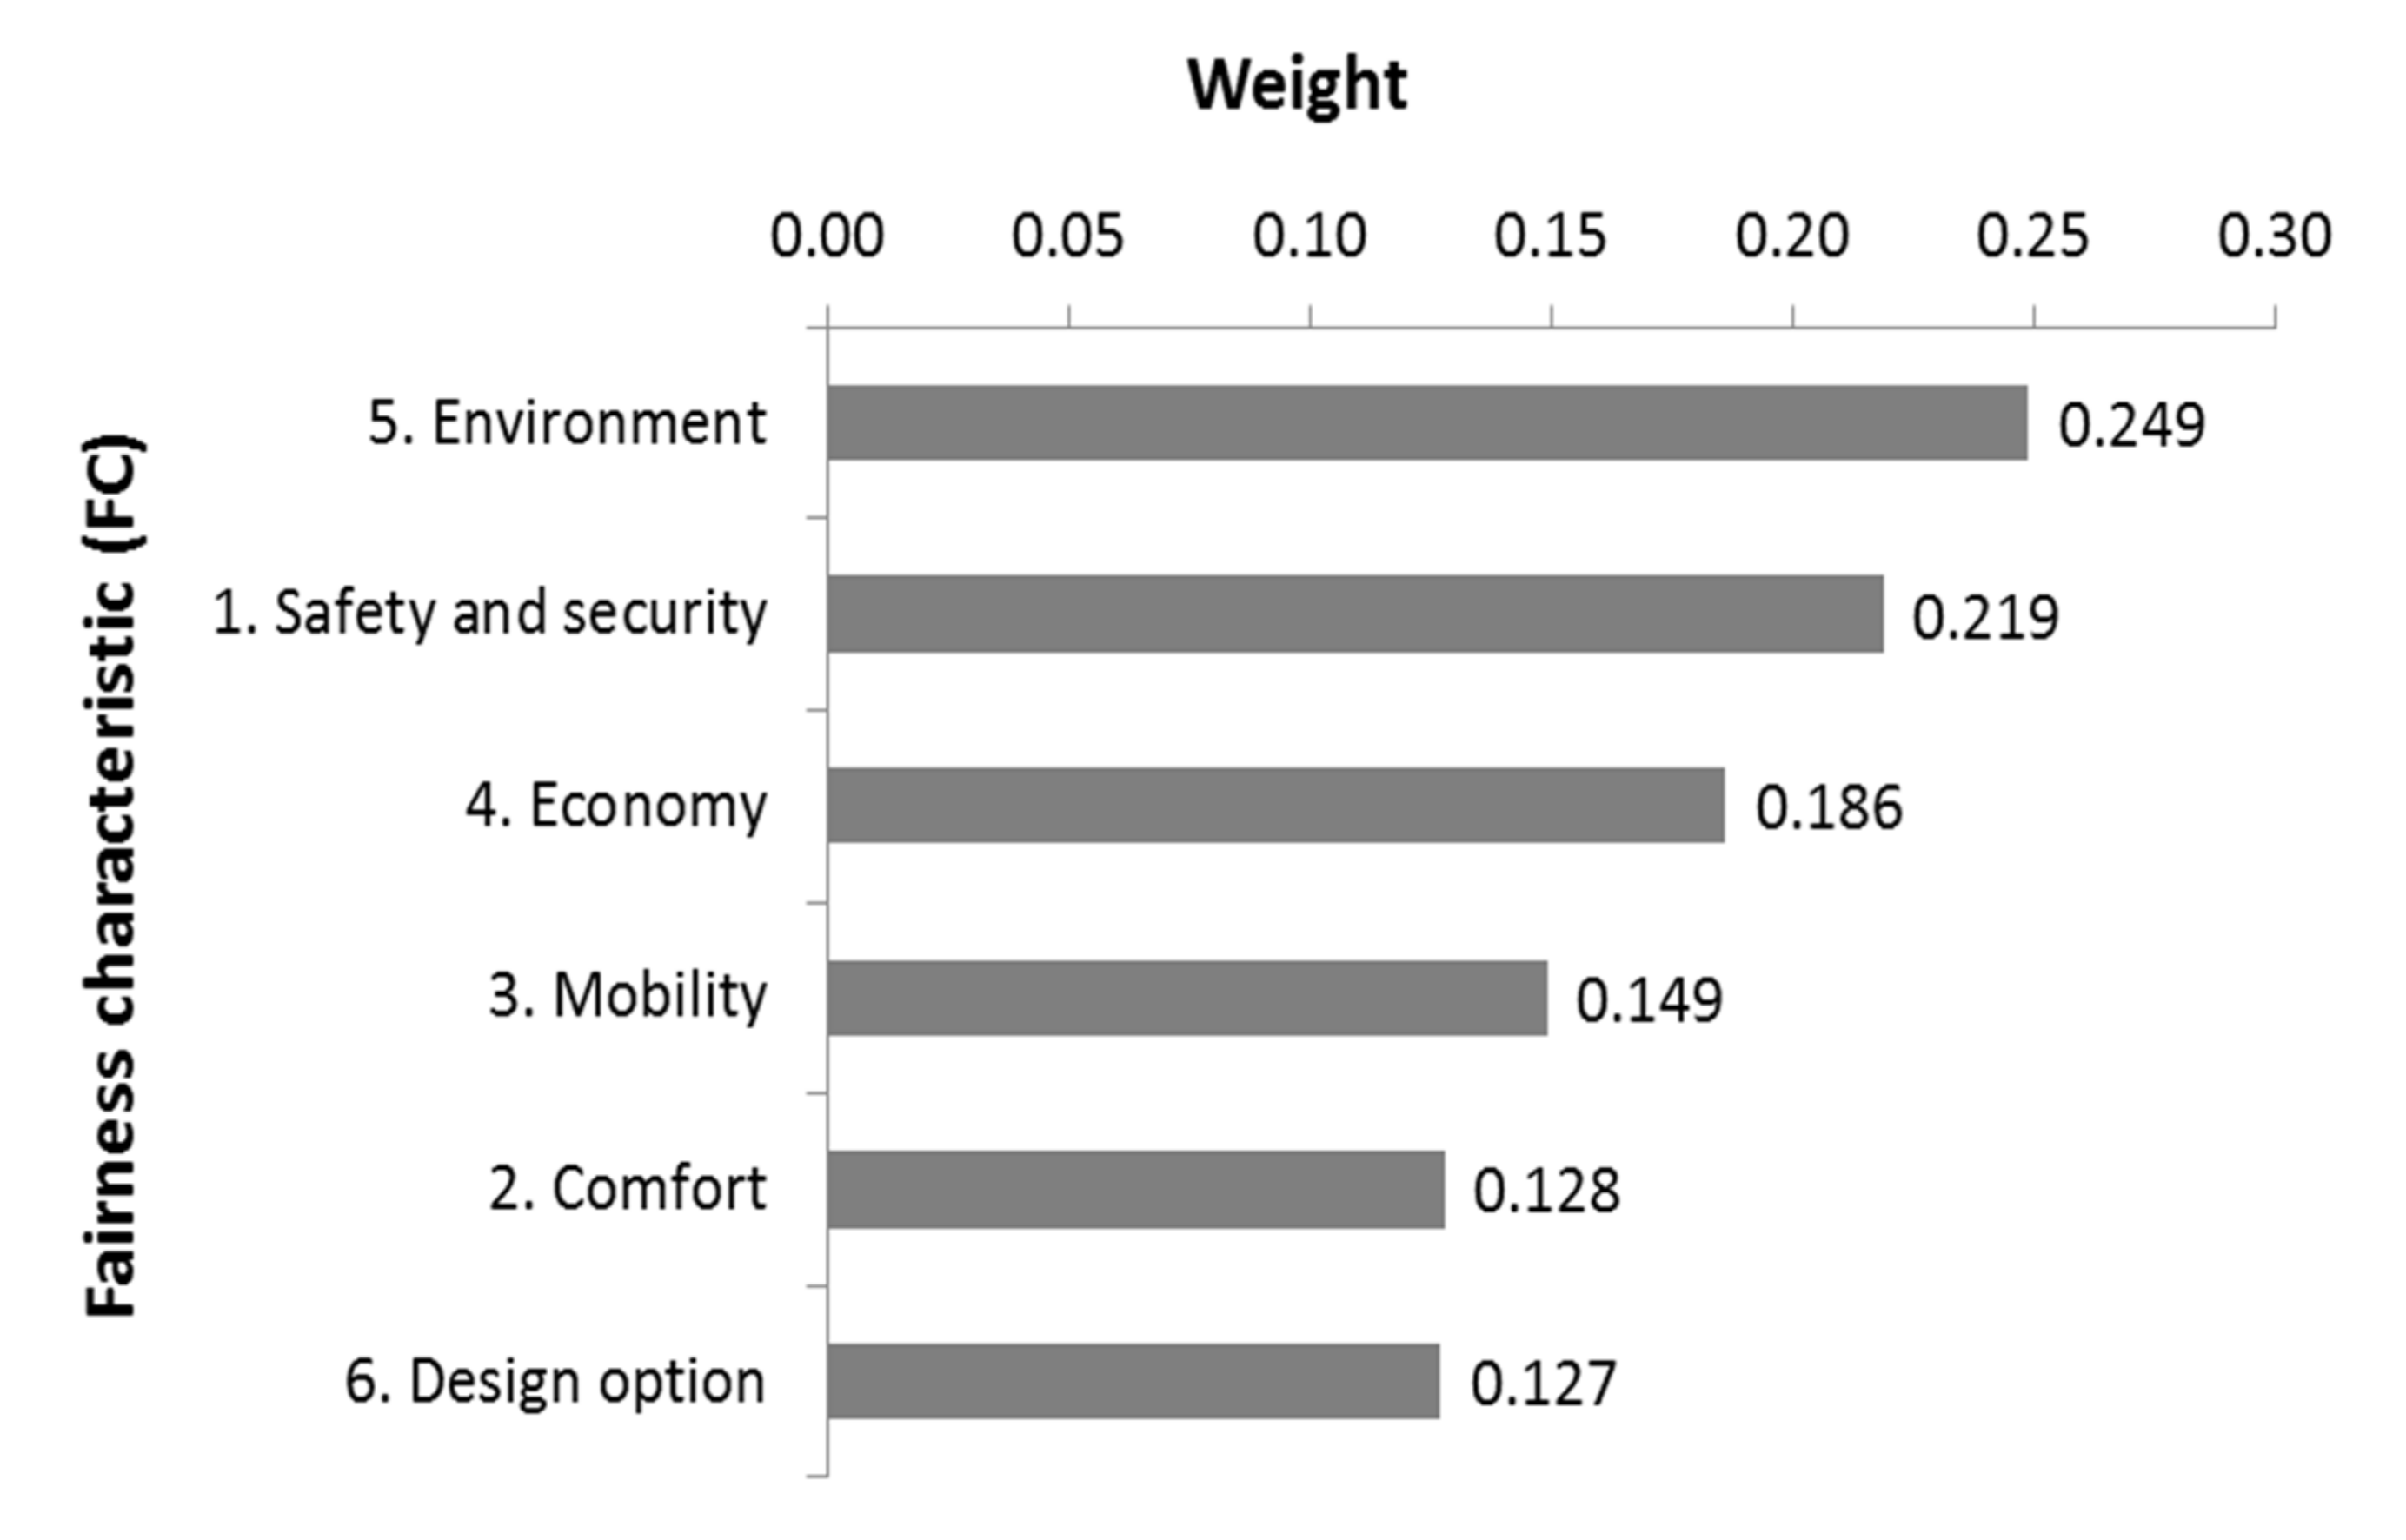
Hierarchy of level 1 fairness characteristics for autonomous vehicles of the future: L4+.
The results indicate that respondents prioritized environmental and safety and security issues. Environmental issues include aspects related to noise, emissions, and health. The use of AVs is supposed to improve driving patterns (e.g., smoother accelerations and decelerations) that would produce a reduction in emissions and also improve health. In addition, this new type of vehicle will be fed by sustainable energy sources (e.g., electric vehicles whose energy comes from renewable sources), which will contribute to lower greenhouse gases emissions. Other health improvements are related to a reduction in the stress produced by some driving conditions due to a safer driving environment. From our perspective, it is somehow surprising that the environment factor was given higher importance over the safety and security factor. One of the possible explanations is that people assume that once the AVs L4+ are fully deployed, safety and security will be guaranteed, and that at least they will fulfill the safety and security given by current vehicles. Therefore, since the safety given by current vehicles is very high, they consider that the most important change would be an improvement of health aspects (reduced stress) and lower environmental impact due to an efficient driving and the use of cleaner technologies. The next FC for good acceptance of L4+ AVs was economic. The more affordable such vehicles are, the higher the acceptance of the technology will be across society as a whole and not for only those with high incomes. The mobility FC was the next on the ranking and refers to higher transport efficiency reducing travel time and congestion, as well as the higher accessibility of AVs for those who, due to personal circumstances or illness, cannot drive; AV transport would give them more autonomy and higher mobility. The last two level 1 FCs were related to comfort and design and received almost the same weight. Comfort and design are aspects needed for AVs, but they are the last in the list when deciding to move from a non-autonomous vehicle to an AV.
4.3. Use Case 3: Bicycle-Sharing Services
The needed sample size obtained after applying Equation (1), considering the European population, was of 385. The total sample gathered was 97 responses. Table 5 shows the sociodemographic statistics of the sample gathered based on different PI characteristics.

Table 5.
Sociodemographic statistics of the responses obtained from the bicycle-sharing services survey (n = 97).
The analysis of the aggregated data resulted in an average of 40 consistent responses (representativeness of the sample 7.97%) with a confidence level of 0.23 and a statistical power of 0.77. Figure 10 illustrates the hierarchy of level 2 FCs obtained after AHP analysis from the most important to the least important. Level 1 FCs were weighted equally in this analysis.
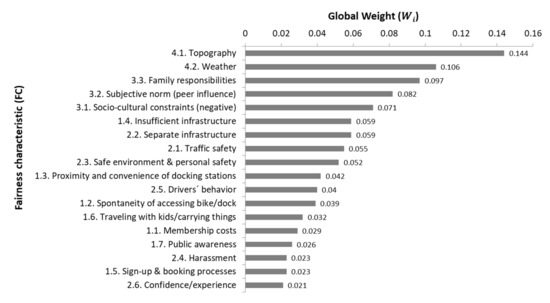
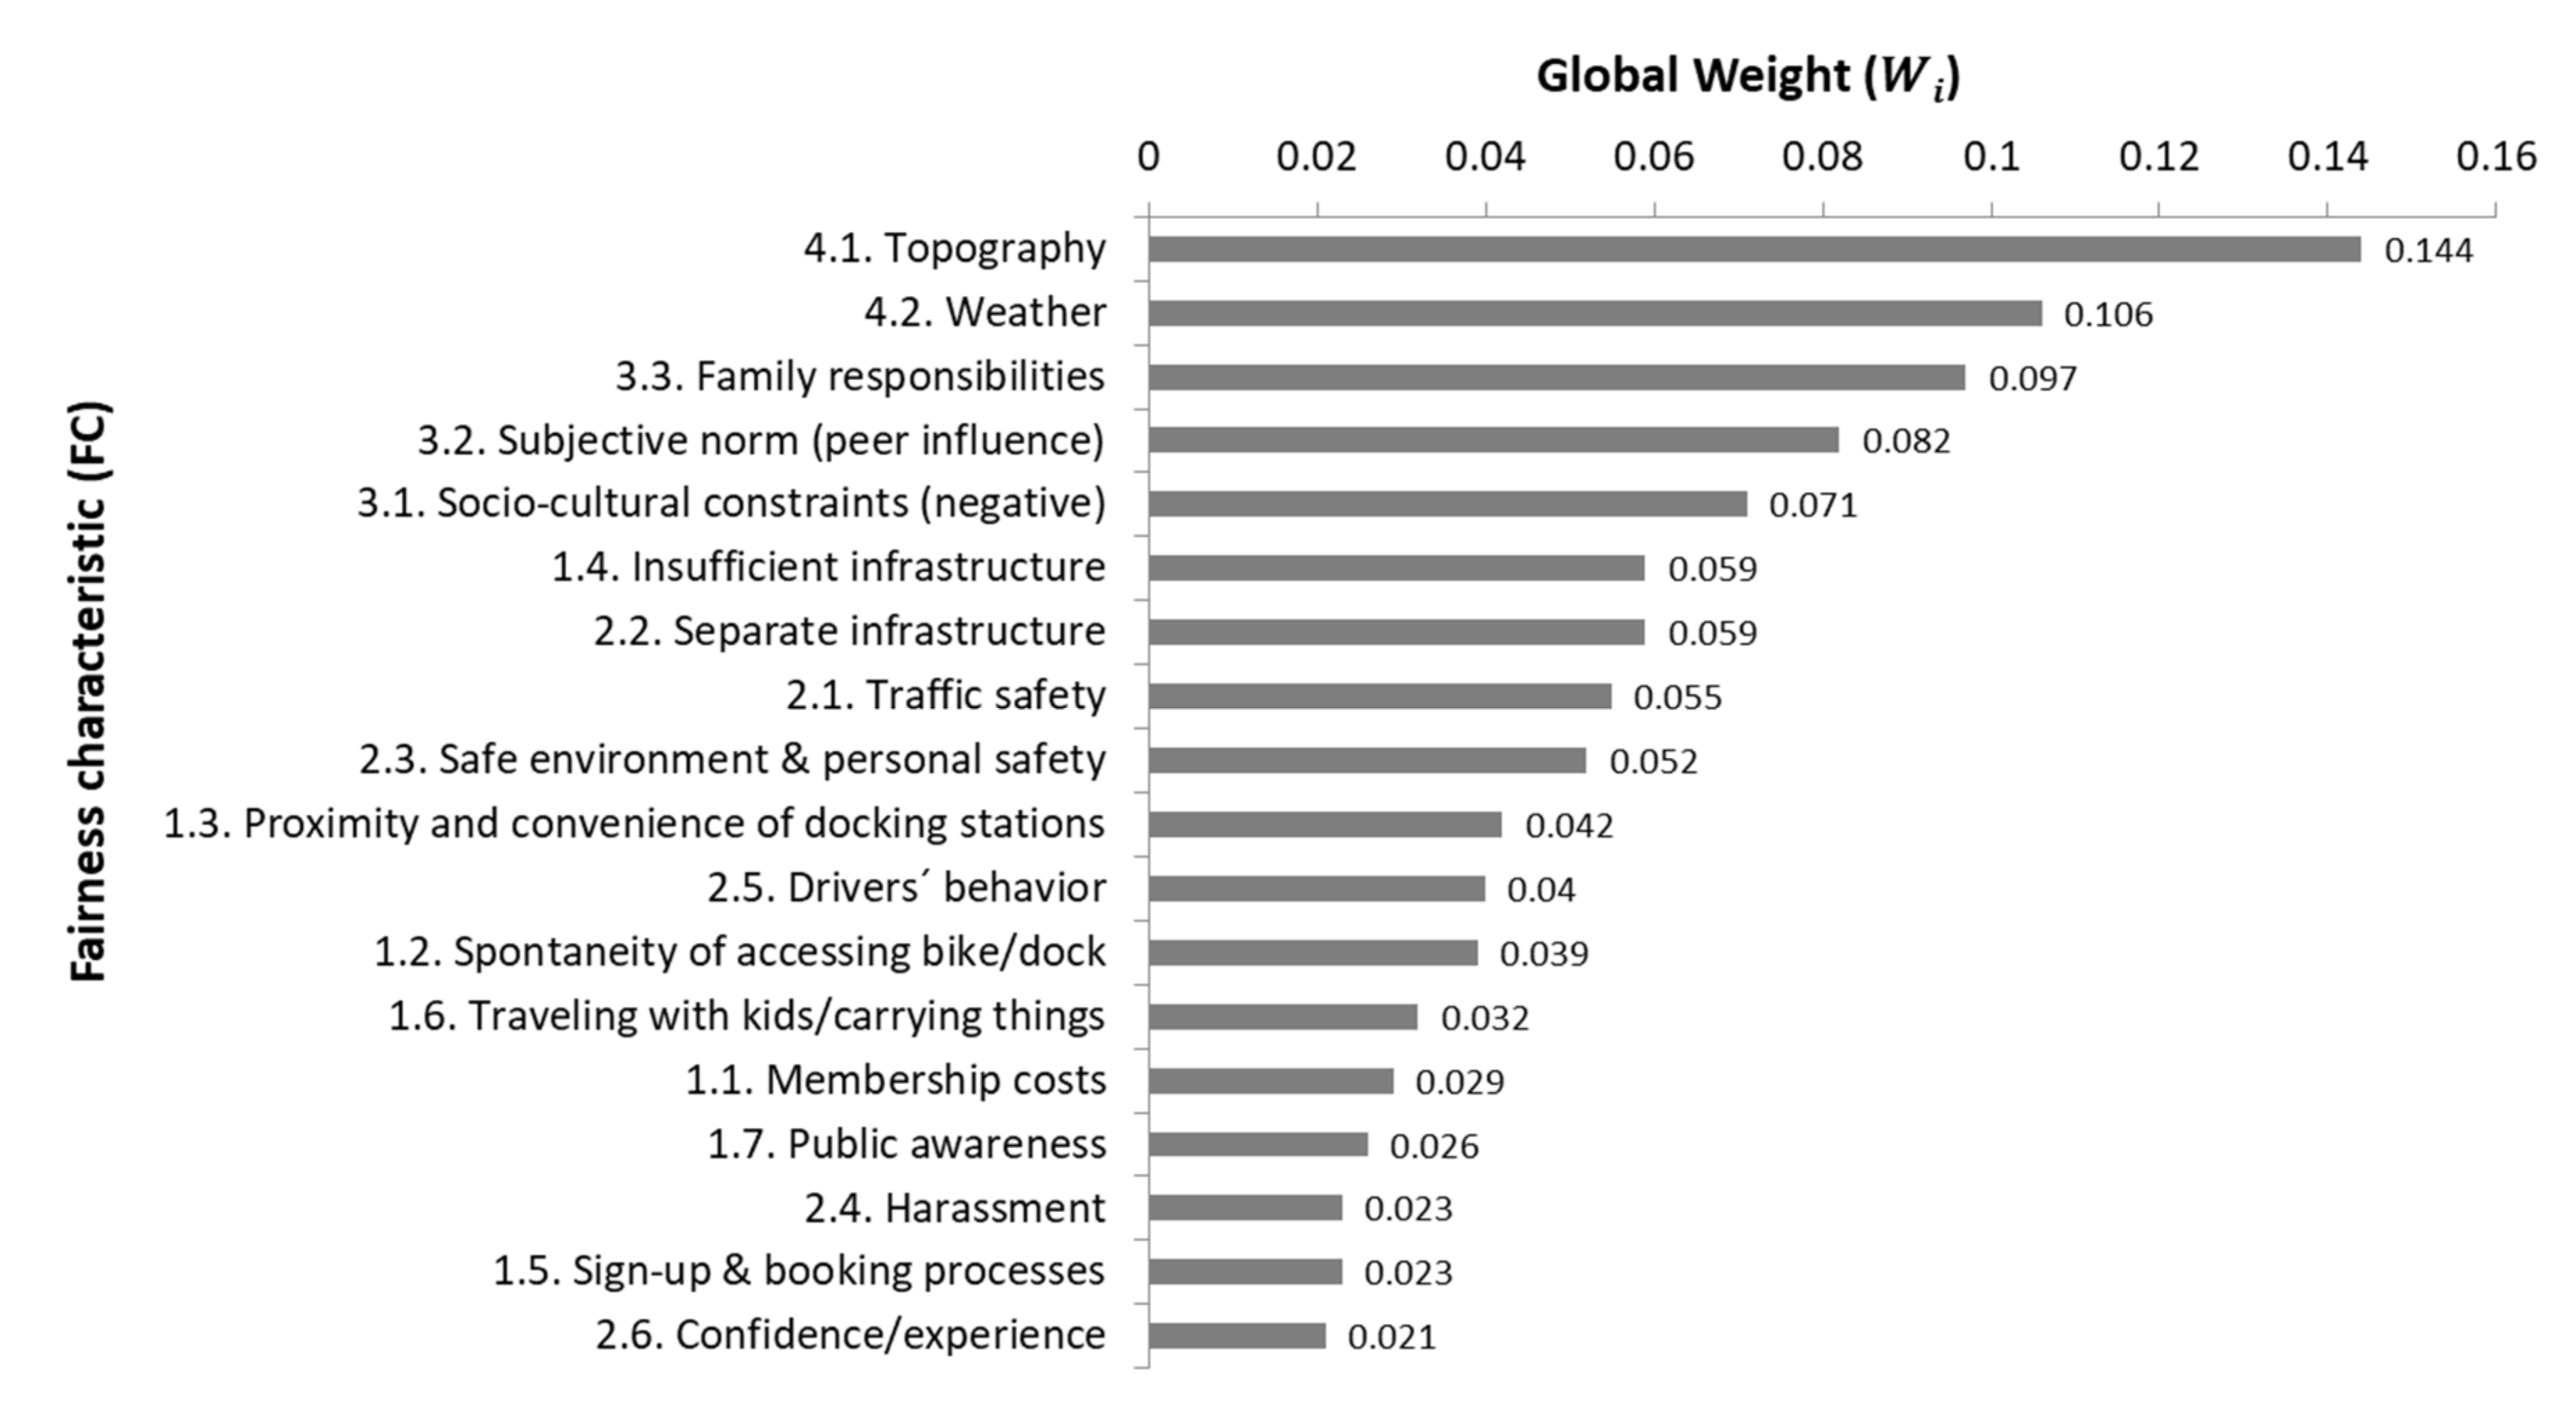
Figure 10.
Hierarchy of level 2 FCs for bicycle-sharing systems.
Weather and topography were shown to be determinant factors for the decision to use BSSs. If the topography of the city, town, or neighborhood is hilly, people will probably look for another transport option. This is being solved in different BSSs through the use of electrical bicycles, which make it easier to travel on such terrain. The case for weather is similar: rainy or windy weather hinders the use of BSSs, and people tend to use other modes of transport on such days. Family responsibilities were the third FC in level of priority and could affect the use of BSSs; the provision of bicycle infrastructure and sharing services, such as electric bicycles with child seats, could enhance the use of BSSs by people with family responsibilities. The next two factors were subjective norms (peer influence) and sociocultural constraints (negative). These two factors highlight the importance of cultural issues related to bicycle use as a mode of transport. In some places, bicycle use is still associated with people of low income or low culture; this myth can hinder their use, so campaigns should be developed to increase the recognition that cycling is a sustainable and effective mode of transport for the first and last mile. In addition, the use of bicycles as a mode of transport by those who are close, e.g., colleagues or friends, can have an influence on using them. The fifth to eighth FCs ranked were insufficient infrastructure, separate infrastructure, traffic safety, and safe environment and personal safety. All four factors of these factors are linked and highlight the necessity of a safer environment for bicycle use, which would include improving the infrastructure, lowering road traffic speeds, creating bicycle paths or lanes separated from normal road traffic, improving lighting, or installing a CCTV system. In addition to separated lanes, traffic safety can also be increased through the education of drivers on their responsibility to ensure cyclists’ safety. The fact that infrastructure and safety related factors are in lower positions of the ranking than subjective norms and sociocultural constraints is somehow surprising. If we compare the results of BSSs with the ones obtained in use case one, railway stations, safety and security-related factors such as overcrowding and emergency situations, and harassment are very important for using a specific transport service. The result obtained for BSSs highlights the high influence that has the society on our behavior and that this influence is very important on the use of BSSs; while rail public transport is more widely used and accepted by the society, the use of BSS schemes in many countries is still very low (with some exceptions, e.g., Netherlands), and then this factor should be given special consideration if we want to build a more sustainable mobility system.
The next factor was the proximity and convenience of docking stations, which influenced people who use BSSs as a first and last mile mode of transport rather than those who use it for leisure or as a mode of transport when visiting a city. If there is a good connection or proximity of BSS docking stations at one’s origin and destination for daily commuting and errands, then the probability of using this system is higher. The last factor, summing up to the 80% of the weight, was drivers´ behavior. Respondents considered that the behavior of drivers when on roads shared with cyclists needs to be improved. Education of drivers on the rights of cyclists and their responsibilities to ensure cyclist safety through training programs or general campaigns could be measures to improve this aspect.
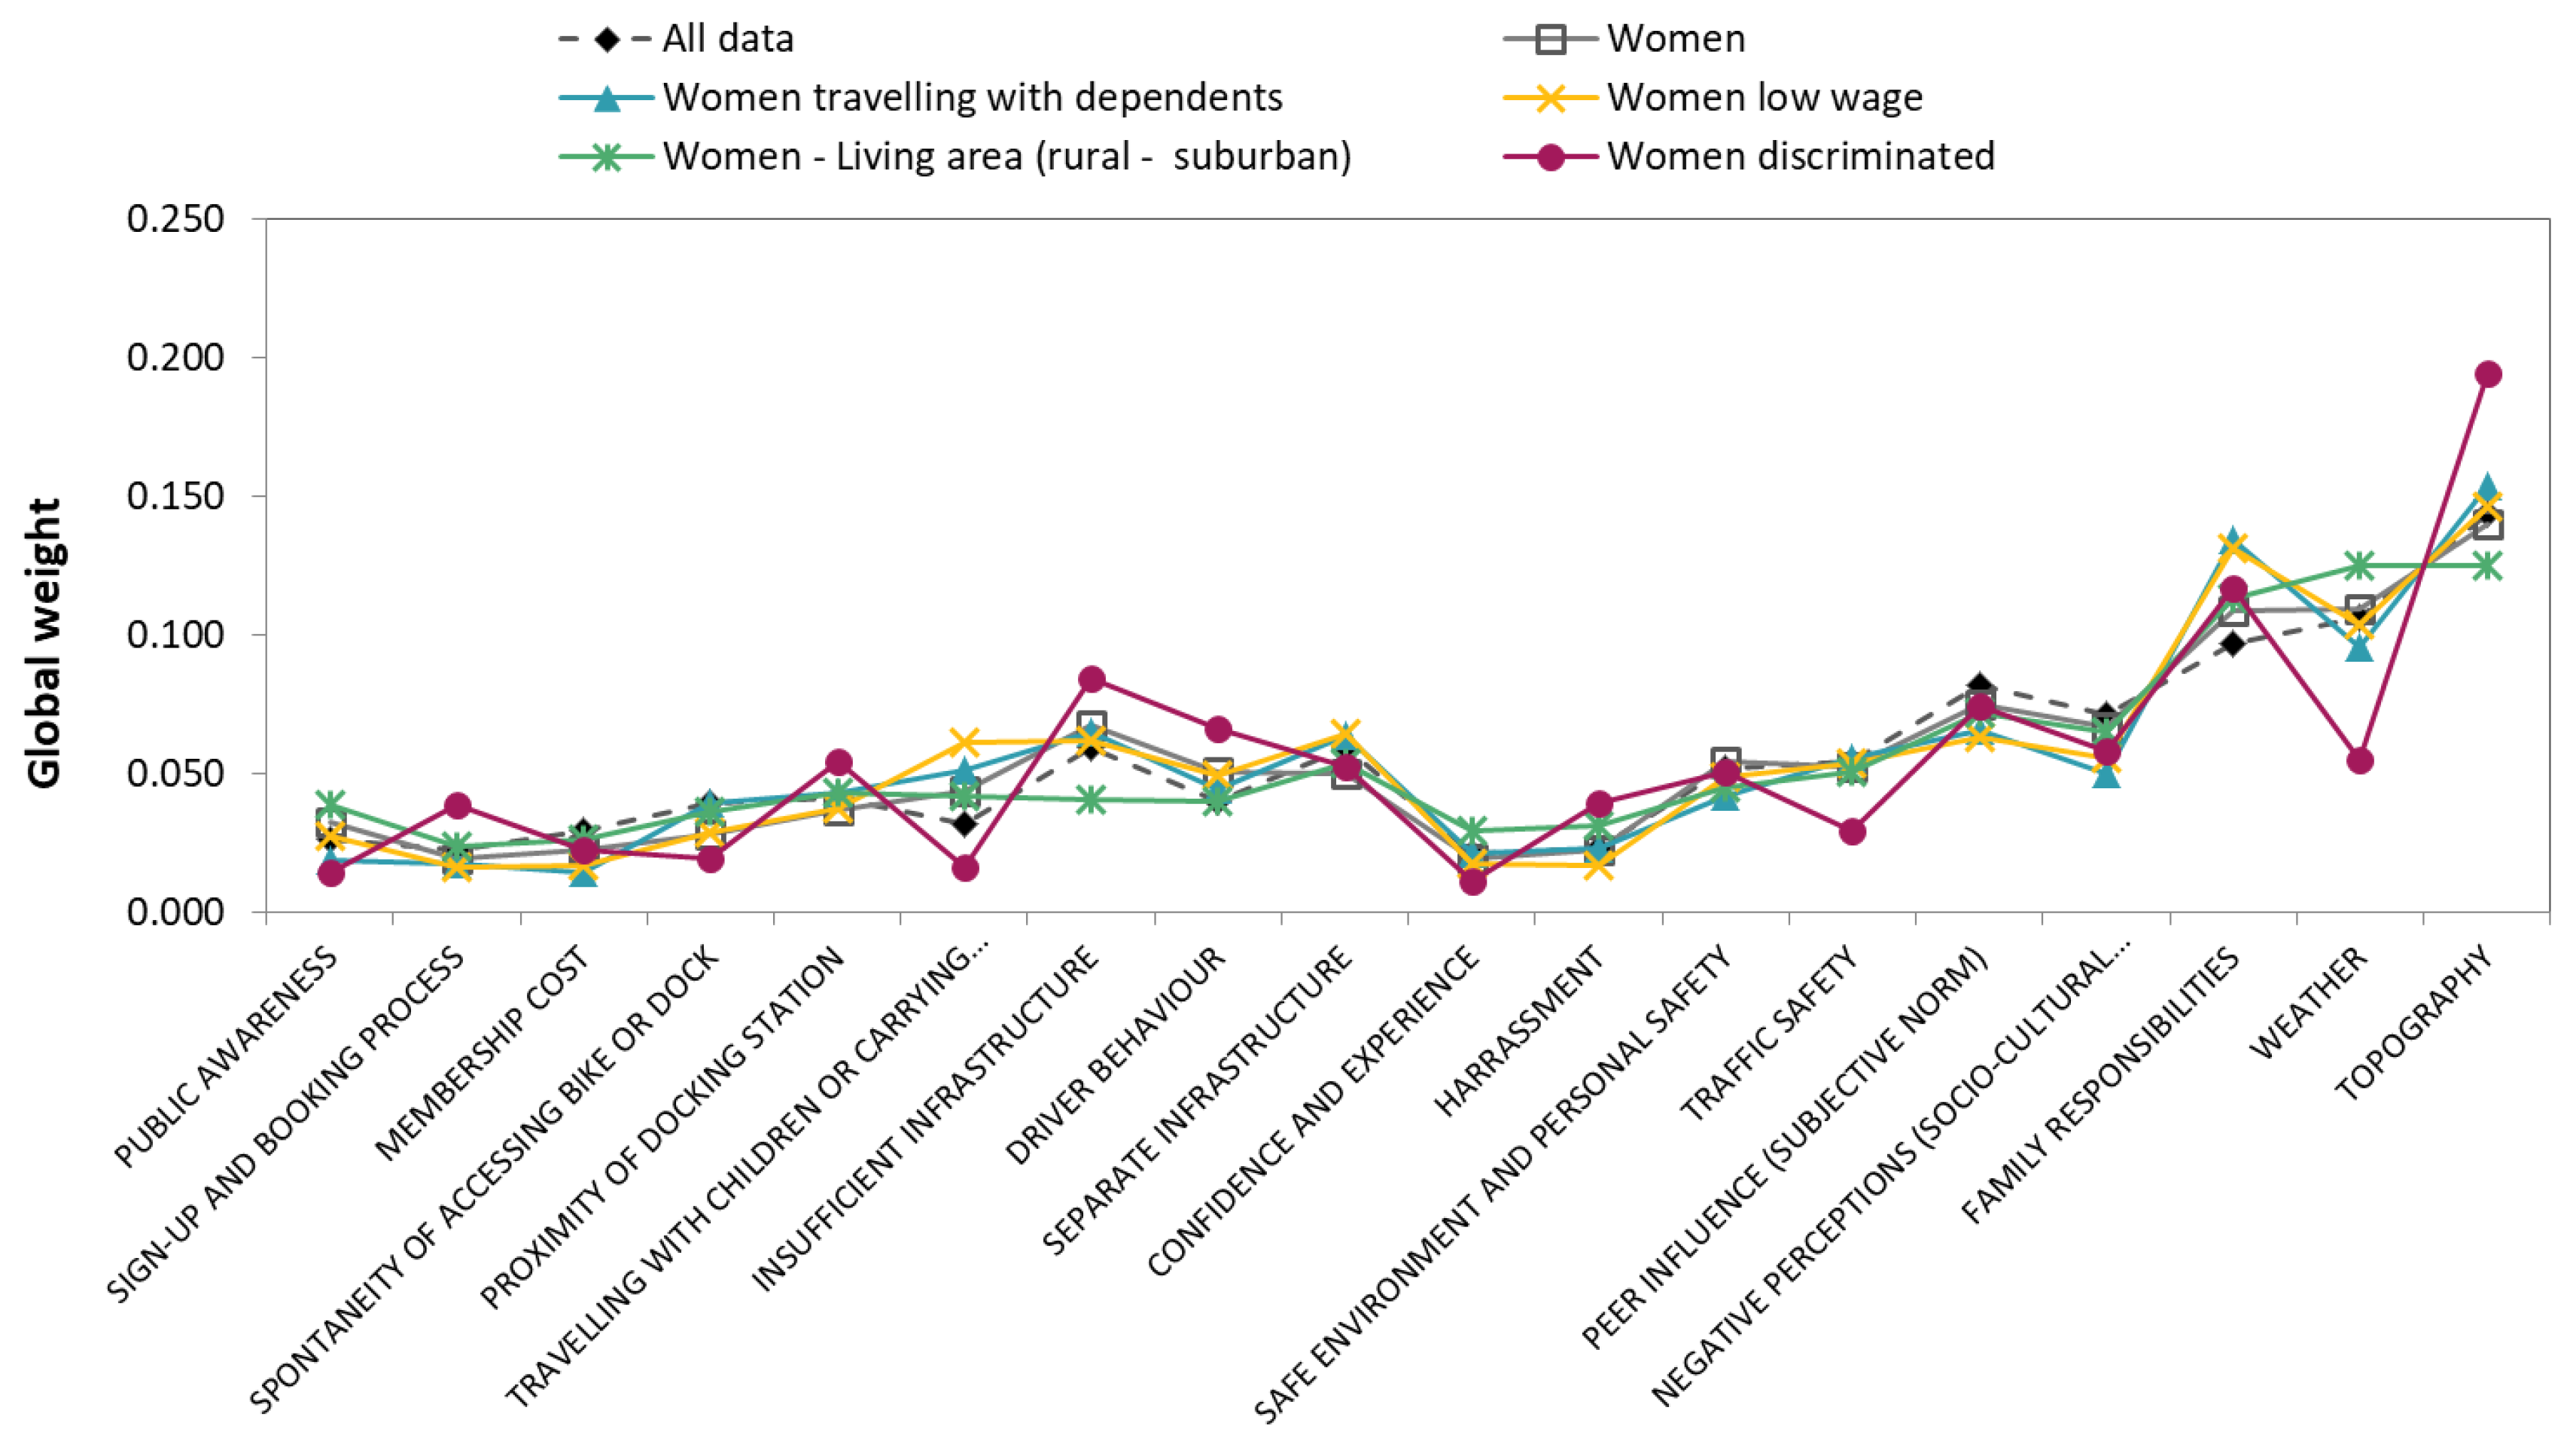
Figure 11 shows the weights of level 2 FCs for selected relevant PI characteristics according to the literature review, that is, women, women who travel with dependents in their daily life, women considered as low wage earners (<21,000 €/year), women living in rural and suburban areas, and women who have ever felt discriminated against in the transport sector (working in the transport sector or using a transport mode).
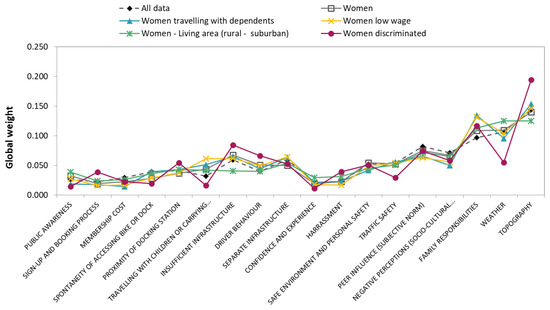
Figure 11.
Differences in global weights of level 2 fairness characteristics for different polyhedral individual characteristics regarding bicycle-sharing systems.
In general terms, the preferences of the different profiles are quite similar to those of the overall sample. For all profiles, topography, weather, and family responsibilities were the three factors with the highest weight when deciding to use BSSs. The main differences appeared among women who have experienced discrimination in transport. They gave greater weight to the FCs topography, insufficient infrastructure, driver behavior, proximity of docking stations, harassment, and the sign-up and booking process. It should also be noted that women living in rural and suburban areas and women considered as low wage earners give greater weight to family responsibilities than the overall sample, or the profiles of all women. This result would be in line with the previous literature and the hypothesis that those women with family responsibilities usually have lower wages and the fact that those living in rural areas usually have more traditional family households. Finally, women living in rural and suburban areas gave less importance to insufficient infrastructure and topography. This could be due to the lower traffic levels in rural areas compared with urban areas; a lower traffic level could make such users feel safer than when cycling with lots of cars around.
Results of the sensitivity analysis developed for all the profiles can be seen in Appendix A Table A4, which show only a few changes in the ranking, 12.5%, indicating that the results obtained are robust.
4.4. Use Case 4—Transport Employment
The needed sample size obtained after applying Equation (1), considering the European population, was 385. The total sample gathered was 100 responses. Table 6 shows the sociodemographic statistics of the sample gathered based on different PI characteristics.

Table 6.
Sociodemographic statistics of the responses obtained to transport employment survey (n = 100).
Analysis of aggregated data resulted in an average of 53 consistent responses (representativeness of the sample 10.56%) with a confidence level of 0.13 and a statistical power of 0.9987. Figure 12 illustrates the hierarchy of level 2 FCs obtained after AHP analysis from the most important to the least important. Level 1 FCs were weighted equally in this analysis.
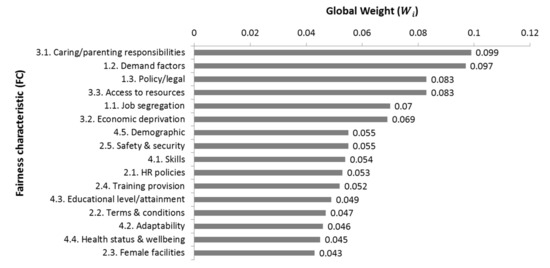
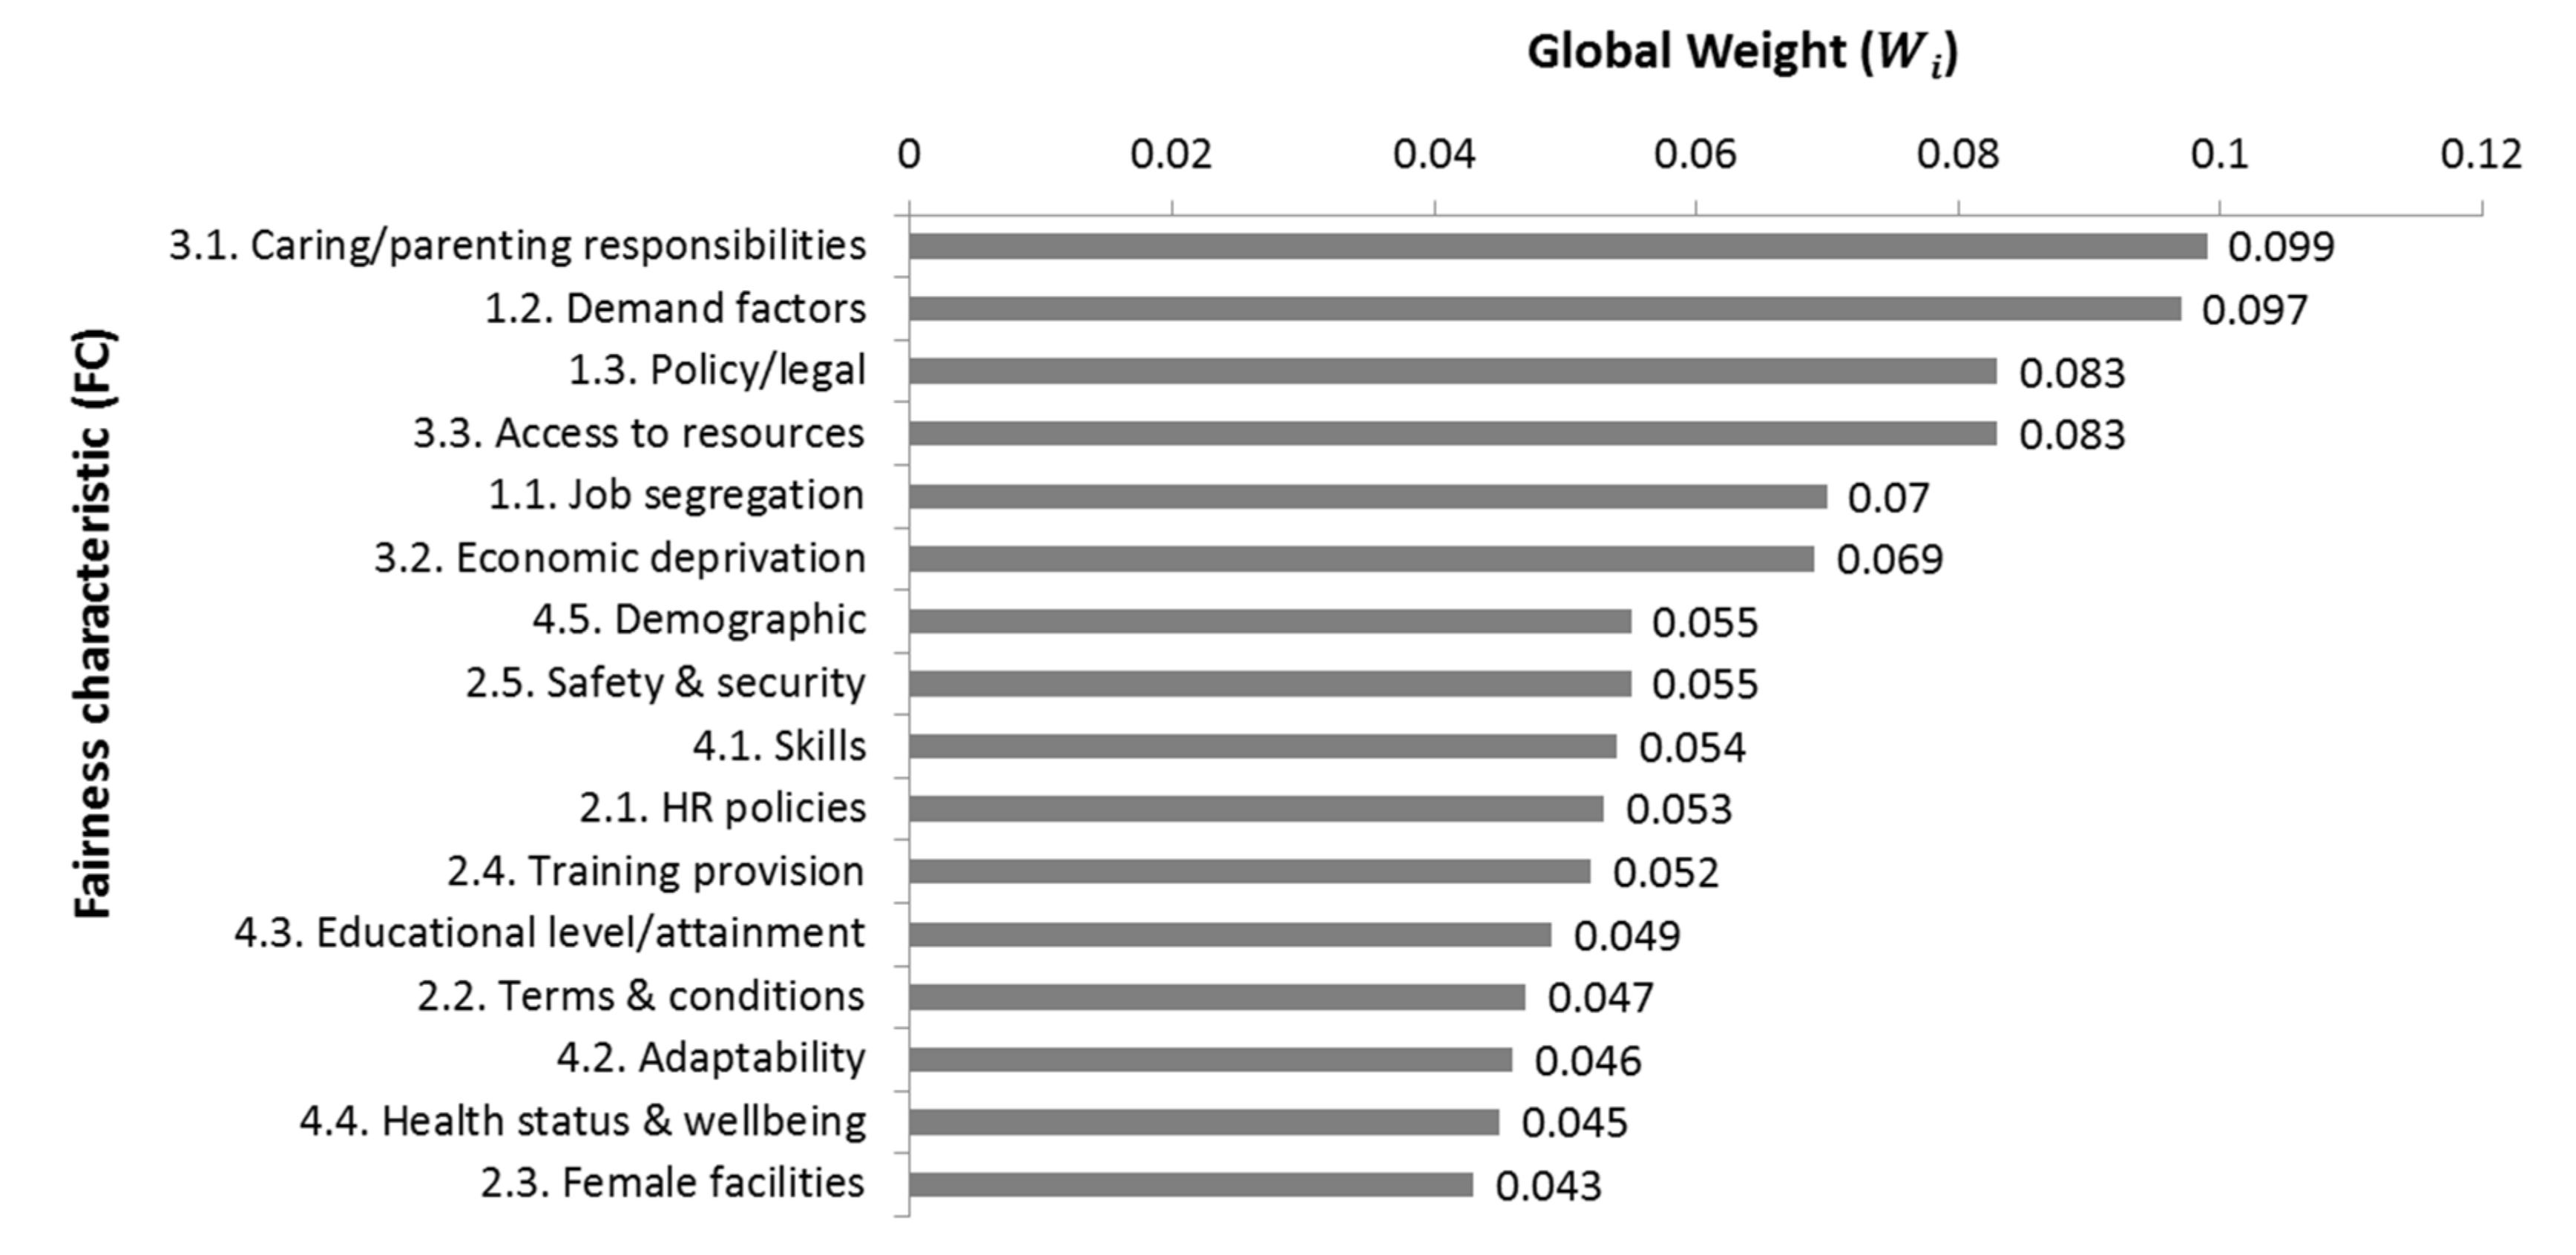
Figure 12.
Hierarchy of level 2 fairness characteristics for employment in the transport sector.
The results indicate that the first issue affecting employment in the transport sector was caring and parenting responsibilities. Work timetables were one of the main issues affecting those with caring and parenting responsibilities. People choose their jobs based on their preferences and skills, but their responsibilities are one of the main factors that influence the selection of one job position over another. Many transport jobs do not allow flexible working hours, and career breaks due to childcare seem to negatively affect long-term careers. The second FC in the ranking, very close to caring and parenting responsibilities, was demand factors, which include recruitment, promotion, and job design as gender-neutral processes that are genuinely open equally to both men and women (not implicitly biased against women). The design of transport jobs and the recruitment and promotion processes should be fair to both women and men if higher participation of women in this sector is desired. Equality in recruitment and promotions is essential to allow a higher participation of women in transport-related jobs. It seems logical that in order to increase the participation of women in transport, first, women should want to work in one of the job positions of the sector. Then, their family responsibilities should allow them to fully commit to the job they want, and then, the recruitment process should be fair so that they have the possibility to actually develop within the job.
Respondents ranked as the third factor the FC policy and legal aspects, which are related to the need to implement policies within transport organizations to support the fair recruitment and promotion for women, as suggested under the FC demand factors. The same importance or priority was given to the FC access to resources, which refers to the availability of accessible, affordable, and suitable facilities (e.g., for childcare) or resources (e.g., availability and cost of transport) that could facilitate women getting and retaining jobs in the transport sector. The next FC was job segregation, which is also linked to the FC demand factor and refers to the fact that all jobs are available and suitable for both men and women and that there should be a more equal balance between genders across all occupation levels. Although currently, in developed countries, women are seen as equal and can work in any job position, there is still some unbalance mainly in management positions that need to be improved for an equalitarian employment in transport.
Economic deprivation was the next FC in the priority list. This FC refers to the discrimination that those coming from a poor background or locality could face when applying to a job opportunity. This type of social discrimination or unconscious prejudice based on appearance or origin should be eliminated to ensure fair recruitment processes and career progression. This is directly linked with the next FC in the list, demographic, which highlights the fact that, for a fair transport system and higher employment rate for women in the transport sector, all employees and future employees should be treated equally and fairly in employment, with access to training or skills development programs regardless of age, gender, ethnicity, migrant status, part-time workers, those with family responsibilities, and so forth. The next FC in the priority list was an issue highlighted in several gender studies: safety and security. Women need to feel that the transport sector offers them safe and secure working conditions so that they can work in a good work environment where they can feel comfortable. This factor includes the need for transport companies to apply measures that can prevent violence and protect women. The last four FCs, summing up to 80% of the (cumulative) weight were, in order, skills, HR policies, training provision, and educational level attainment. Three of these are related to education and the improvement of skills to facilitate employment, promotion, and retention. The educational level attainment FC also highlights that the incorporation of women in transport-related jobs can be increased if educational bodies prepare and encourage women to find employment in all parts of the transport sector. The HR policies FC is focused on the need to develop HR policies and processes that promote fairness in relation to gender as a useful tool to reduce and finally eliminate any bias related to gender or any other factor that is not connected to the skills and technical requirements of the position. Figure 13 shows the weights of level 2 FCs for selected relevant PI characteristics, as for the other three use cases.
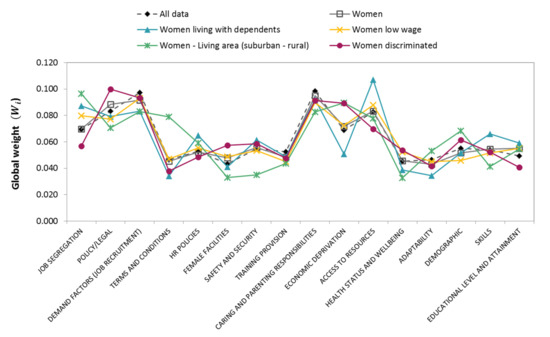
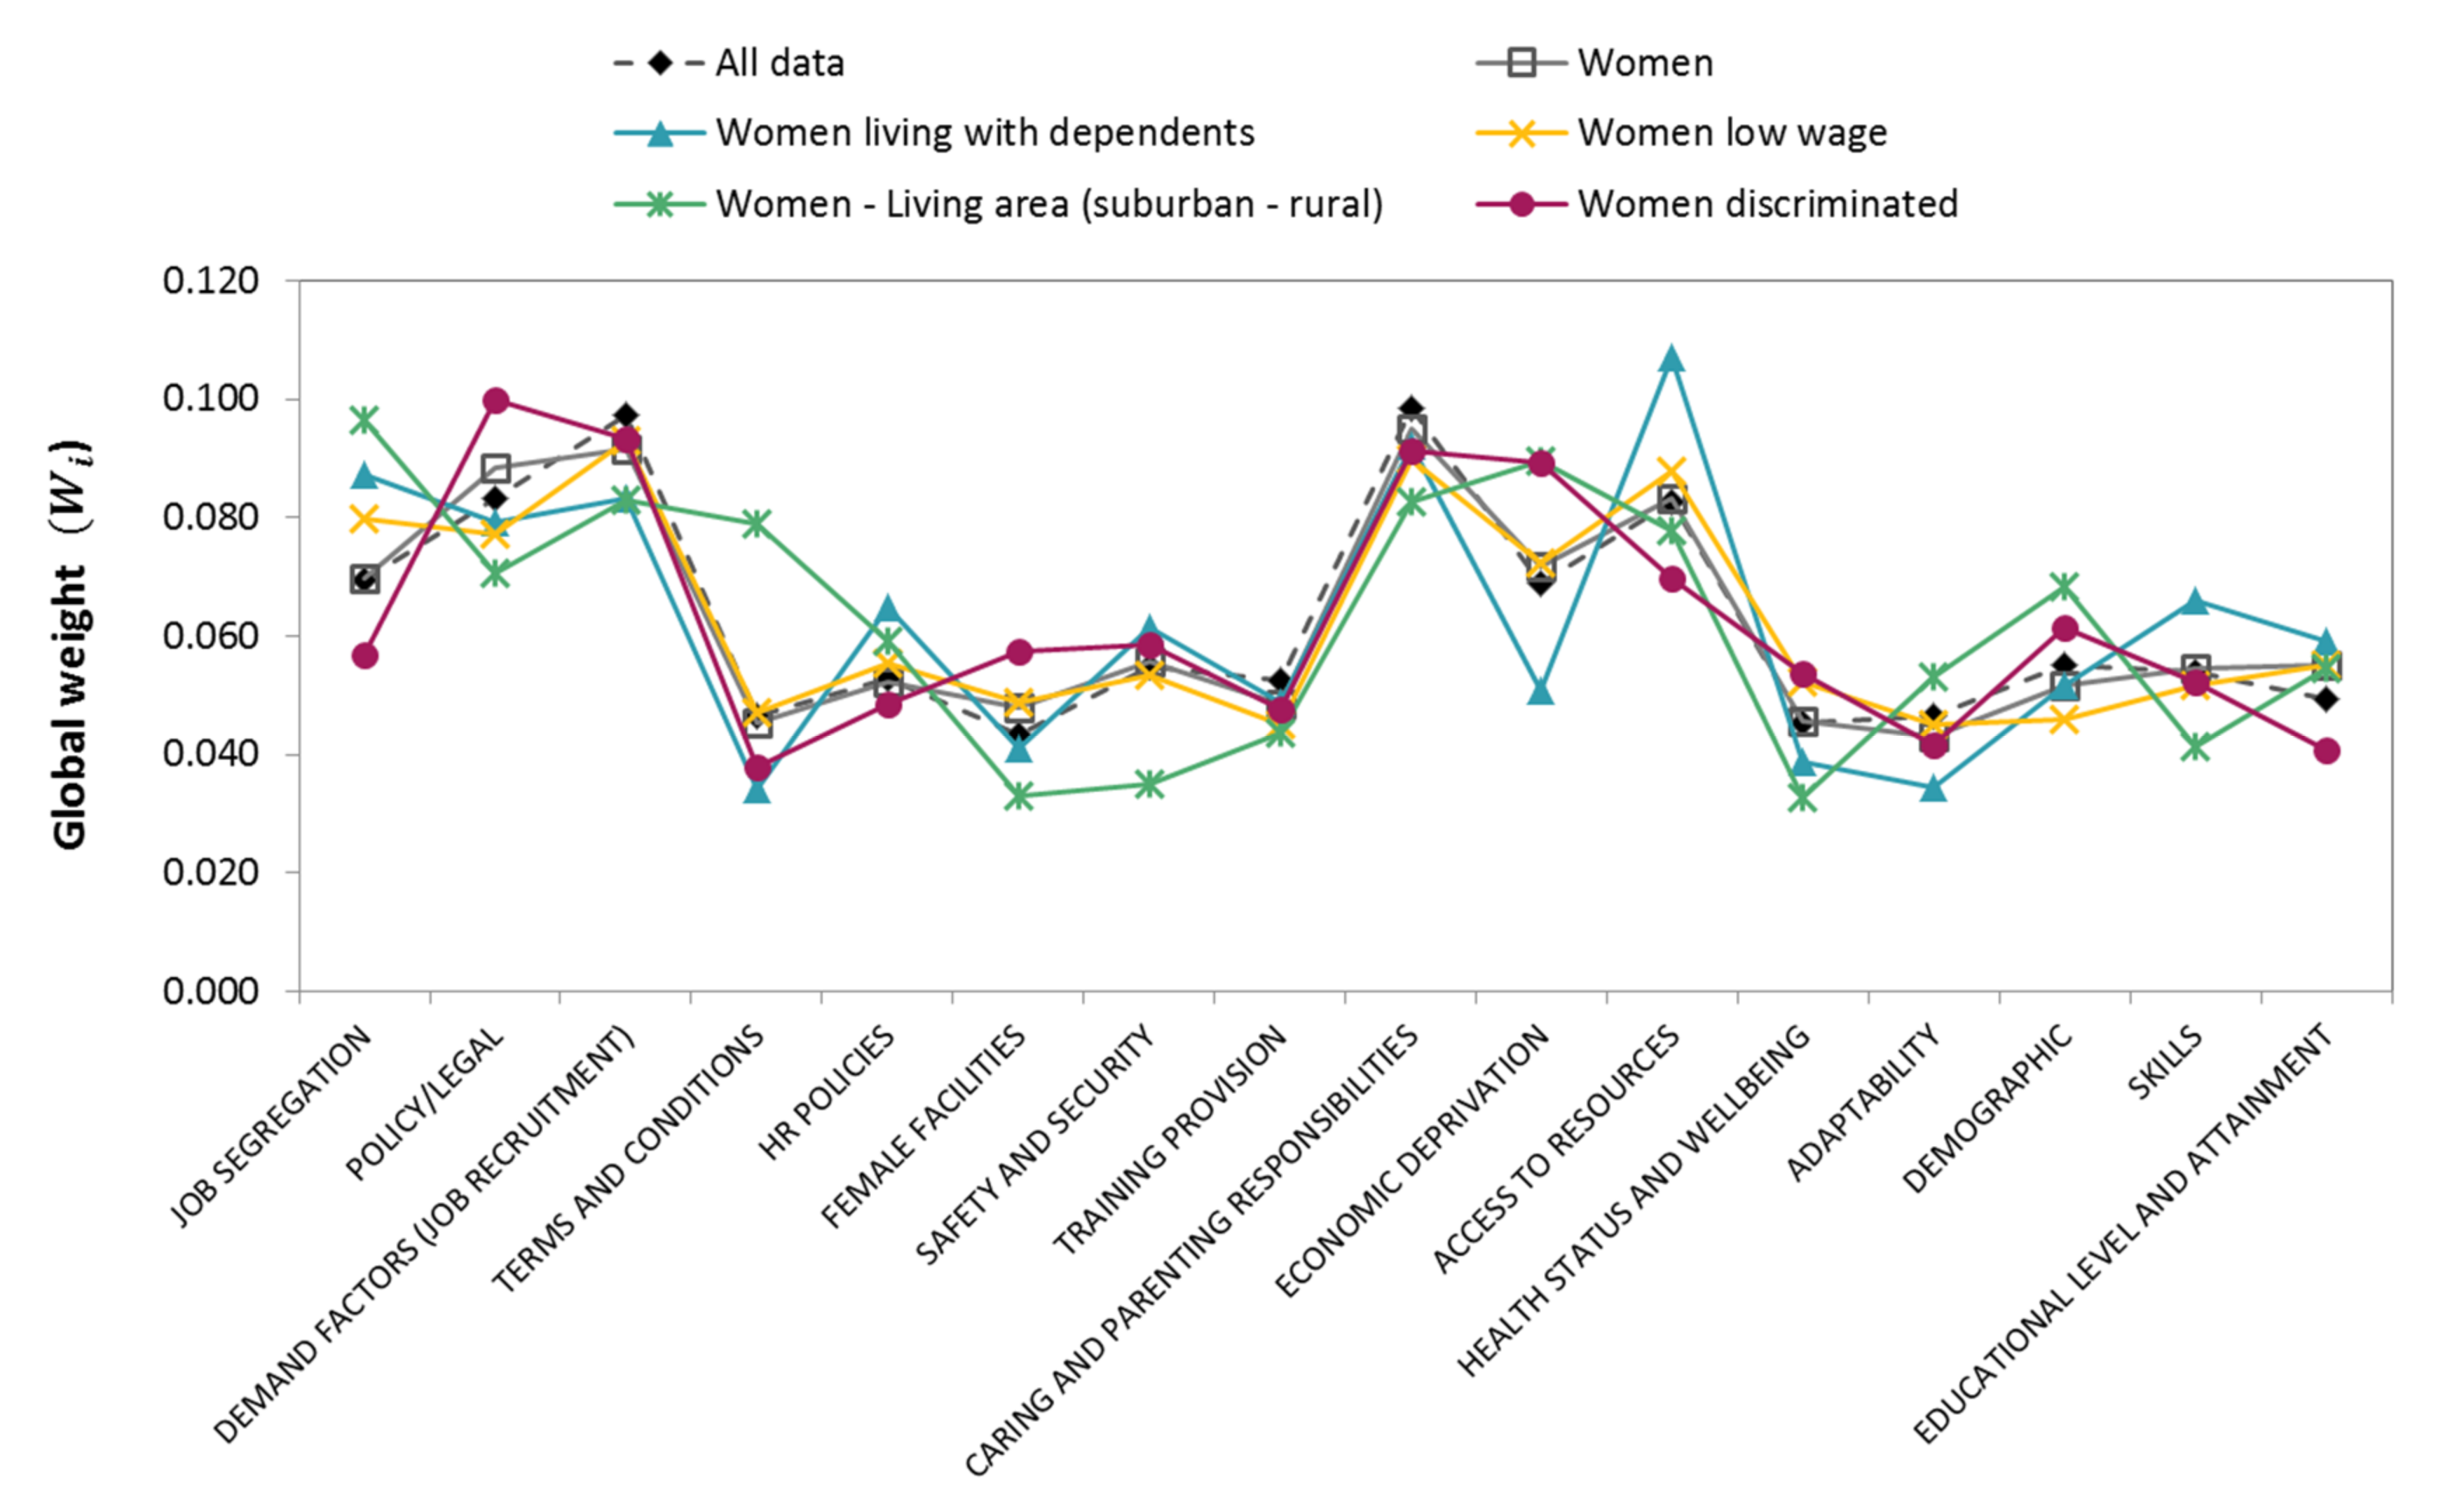
Figure 13.
Differences in global weights of level 2 fairness characteristics for different polyhedral individual characteristics regarding employment in the transport sector.
The results indicate that for almost all of the analyzed samples, one of the FCs that affects the incorporation of women in the transport system most is caring and parenting responsibilities. This changed in two of the profiles: women living with dependents and women who have felt discriminated against in the transport sector. For them, access to resources and policy and legal aspects, respectively, were the most important factors for them to be involved in transport-related jobs. Comparing the results for women living with dependents with those from the overall sample yielded some differences. Women living with dependents rated the FCs terms and conditions, demand factors (job recruitment), economic deprivation, and adaptability lower; and they rated FCs such as job segregation, HR policies, access to resources, and skills higher. It seems logical that those who are in charge of dependent persons have rated skills higher over HR policies for fair recruitment and promotion processes. They have not given priority to their personal conditions; rather they give priority to their actual skills to develop the job as well as access resources that allow them to both develop their job and take care of dependents. Women who have experienced discrimination rated aspects such as job segregation, access to resources, and educational level and attainment lower than the overall population; in contrast, they gave more importance to policy and legal aspects, the need for female facilities, economic deprivation, and health status and wellbeing. Those who have experienced discrimination need policies that can help them feel secure and supported by the company, and clear procedures need to be set in case of any discriminatory or undesired action produced. In addition, they need to be in a working environment where they feel comfortable and healthy, and which fulfills their needs (e.g., female changing rooms if needed). Women living in rural or suburban areas gave lower importance to policy and legal aspects, female facilities, safety and security aspects, health status, and skills, while giving greater weight than the overall population to the FCs job segregation, terms and conditions (including working conditions that considered the needs for caring responsibilities), economic deprivation, and demographics (i.e., discrimination based on coming from a poor location or due to other PI characteristics such as ethnicity, age, or gender).
Results of the sensitivity analysis developed for all the profiles can be seen in Appendix A Table A5, which show only a few changes in the ranking, 16%, indicating that the results obtained are robust.
In this use case, the ID representation also has a vertex for challenges and opportunities regarding the future employment of women in the transport system; here, we considered the logistics of drones. Under the consideration of this being a reality, respondents were also asked about their preferences regarding level 1 FCs to establish a hierarchy, instead of giving all of them the same equal weight. Results are shown in Figure 14.
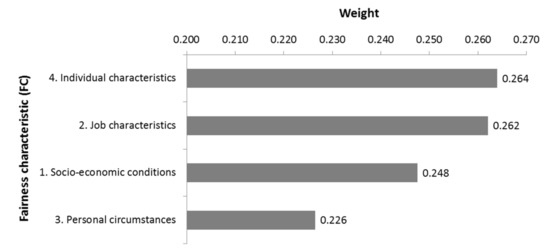
Figure 14.
Hierarchy of level 1 fairness characteristics for future employment in the transport sector: drone logistics.
The results indicate that all four level 1 FCs were important for the involvement of women in drone logistics. The two level 1 FCs with the highest weight were individual characteristics (i.e., that employee PI characteristics do not influence their employment in the sector) and job characteristics, which suggests that employers should reduce job barriers to women’s employment and progression in the transport sector, creating a corporate culture that encourages women in all sectors of the industry. The third FC in the ranking was socioeconomic conditions (i.e., the need for wider societal encouragement of females to enter and progress within the transport sector, including encouraging more women in STEM) so that women can work in the emerging field of drone logistics. Finally, personal circumstances influenced the development of a career in the transport sector and also in drone logistics, but, according to the results, it would not be the most important factor influencing women when considering whether or not to be involved in drone logistics.
5. Conclusions
To develop a sustainable society, a more equalitarian and safe transport system is needed both from a user perspective and from the perspective of employees in the sector. Researchers and international institutions have highlighted the need for a better understanding of the factors affecting the fair participation of women in the transport sector and the development of measures to improve this situation. This paper analyzed priorities for the fair inclusion of women in four transport scenarios: as users of the public transport rail system, as users of BSSs, as future users of AVs, and as transport employees. In the first case, the main issues affecting users of the railway system were related to safety and security, which were mainly due to overcrowded stations, emergency situations, or harassment and pickpocketing incidents. The disaggregated analysis showed that there were slight changes in the priorities for specific profiles of women. Women traveling with dependents gave special importance to universal design, and they also weighted how harassment and pickpocketing affect them in the use of rail public transport higher than other profiles. Women living in rural and suburban areas also weighted aspects related to the cleanliness and maintenance of stations higher than the overall population. Regarding the future use of hyperloop stations, the most important factors were related to the safety, security, and accessibility of the service.
In the case of future AV users, the results indicated that simultaneity and trust in technology were the two most important factors influencing potential use. Differences in the FC weights were obtained for some of the profiles analyzed, notably for women traveling with dependents and those who have experienced discrimination when using public transport. The latter weighted aspects related to accident rates, human errors, or congestion issues higher than the overall population, while women traveling with dependents weighted the aspects simultaneity, congestion, or accessibility higher. People living in rural areas weighted aspects related to the costs of AVs higher. If only fully autonomous vehicles (L4+) were considered, the two most important factors for better acceptance of AVs by women were the environment and safety and security issues. Women would use L4+ AVs if such vehicles offered them a safer driving environment and environmental and health benefits, related to the reduction of stress, lower emissions, and noise.
To obtain higher participation of women in BSSs, the results of this study indicated that the most important factors were weather and topography, followed by family responsibilities, peer influence, sociocultural constraints, and insufficient infrastructure. When analyzing different sociodemographic profiles, the results were quite similar with small differences when analyzing responses from women who have experienced discrimination. These women gave higher importance to the FCs topography, insufficient infrastructure, driver behavior, and proximity of docking stations, while giving lower weight to the weather. Women living in rural or suburban areas and low wage earners gave higher importance to family responsibilities. Women in rural areas also gave less importance to infrastructure.
For the last use case, employment in the transport sector, the results showed that caring and parenting responsibilities was the factor with the highest effect on higher participation of women in the transport sector. Other important factors, in order of importance, were demand factors for equalitarian and fair recruitment, promotion and design of jobs, and policy and legal aspects. When analyzing different sociodemographic profiles, the results showed different priorities for some profiles. Women living with dependents or women who have experienced discrimination considered the FCs related to access to resources and policy and legal aspects the most important. Analysis of transport employment by women for future scenarios such as drone logistics highlighted the need to focus on eliminating discrimination due to individual characteristics, not affecting employees in their role or position within the transport sector due to their PI characteristics (e.g., male vs. female roles), and also the need to reduce job barriers to women’s employment and progression by employers creating a corporate culture that encourages and supports women’s employment in the sector. The results also showed that encouraging more women in STEM careers and their personal circumstances would continue to be factors to consider for drone logistics employment.
It should be noted that the results of this study come from a specific and limited number of answers from European countries. However, the study allowed the identification of those factors with higher influence in the fair participation of women in the transport sector according to the obtained responses. The resulting priorities will help transport planners, BSS owners, decision makers, transport companies, and regulatory professionals in the development of measures that could plausibly increase the proportion of the women as users of BSSs, public rail transport, and AVs, and also as employees in the transport sector for a sustainable society. Further studies should focus on obtaining the priorities based on quantitative data coming from, for example, transport service providers and transport companies (e.g., related to number of employees, percentage of women in different company positions, equity policies, etc.) using machine learning algorithms such as Bayesian networks in order to analyze the situation not only considering the opinions of the users and employees but also having an analysis with quantitative data of current situation. In addition, results of this paper will allow the development of further studies on specific themes such as employment in specific areas of transport.
Author Contributions
Conceptualization, F.E.S. and G.D.M.; methodology, F.E.S., G.D.M., S.P.-R. and M.C.L.; investigation, E.G.-J., S.P.-R., M.C.L. and F.E.S.; formal analysis, A.K.M., F.E.S., S.P.-R., E.G.-J. and M.C.L.; software, A.K.M., F.E.S. and S.P.-R.; writing—original draft preparation, S.P.-R.; writing—review and editing, F.E.S. and S.P.-R.; visualization, S.P.-R.; supervision, F.E.S. and M.C.L.; project administration, G.D.M.; funding acquisition, F.E.S. All authors have read and agreed to the published version of the manuscript.
Funding
This research was funded by the H2020 program within the DIAMOND project, grant number 824326.
Institutional Review Board Statement
The study was conducted according to the guidelines of the Declaration of Helsinki, and approved by the Ethics Committee of DIAMOND project (on 31 October 2019).
Informed Consent Statement
Informed consent was obtained from all subjects involved in the study.
Acknowledgments
The authors want to thank all DIAMOND project (grant number 824326) partners involved in the dissemination of the survey and the collection of data, and especially Wave and Genre & Ville (France), SYS (France), STIR and ENU (Scotland), TUDublin (Ireland), FTTE (Serbia), ZTM (Poland), and EUT, FGC, IBV, and AITEC (Spain). Proofreading and article processing charges were partially supported by the European Union through the European Regional Development Funds, within the Operative Program of the Comunitat Valenciana (IVACE).
Conflicts of Interest
The authors declare no conflict of interest.
Appendix A

Table A1.
Distribution of the European population for different sociodemographic information or polyhedral individual (PI) characteristics.
Table A1.
Distribution of the European population for different sociodemographic information or polyhedral individual (PI) characteristics.
| Characteristic of the PI | EU-28 | |
|---|---|---|
| Age 1 | Age <25 years | 0.26 |
| 25≤ Age <65 | 0.53 | |
| Age ≥65 years | 0.21 | |
| Gender 2 | Male | 0.49 |
| Female | 0.51 | |
| Education 3 | Low (ISCED 0–2) | 0.27 |
| Medium (ISCED 3–4) | 0.45 | |
| High (ISCED 5–8) | 0.28 | |
| Disability 4 | With disability | 0.176 |
| Without disability | 0.824 | |
| Family 5 | 1 person—Single | 0.33 |
| 2 people | 0.31 | |
| >2 people | 0.36 | |
| Sexual orientation 6 | Heterosexual | 0.94 |
| LGBT | 0.06 | |
| Ethnicity | No data | No data |
| Religion | No data | No data |
| Economic level | Low wage earners | 0.1719 |
| Non low wage earners | 0.8281 | |
1 Source: Eurostat. Population: Structure indicators [demo_pjanind]. Data from 2018, 2 Source: Eurostat. Population on 1 January by age and sex [demo_pjan]. Data from 2018, 3 Culture is understood as level of education. ISCED: International Standard Classification of Education (Low level of education corresponds to people with lower secondary education or less; Medium level of education is between upper secondary education and short-cycle tertiary education; and High level of education is a degree or higher) Source: Eurostat. Population by educational attainment level, sex, and age (%) [edat_lfs_9903]. Ages from 15 to 74. Data from 2018, 4 Source: Eurostat. Population by sex, age, and disability status [hlth_dpeh005]. Data from 2012, 5 Source: Eurostat. Distribution of households by household size; EU-SILC survey [ilc_lvph03]. Data from 2018. 6 Data from 2016. https://daliaresearch.com/blog/counting-the-lgbt-population-6-of-europeans-identify-as-lgbt/ accessed on 25 February 2021.

Table A2.
Use case 1 sensitivity analysis.
Table A2.
Use case 1 sensitivity analysis.
| Initial Weight 1 | A1 × 1.5 2 | A1 × 0.5 2 | A2 × 1.5 2 | A2 × 0.5 2 | A3 × 1.5 2 | A3 × 0.5 2 | |
|---|---|---|---|---|---|---|---|
| Description | = 0.33 | ||||||
| All data (aggregated analysis) | |||||||
| OVERCROWDING AND EMERGENCY SITUATIONS | 0.181 | 0.136 | 0.227 | 0.136 | 0.227 | 0.272 | 0.091 |
| HARASSMENT AND PICKPOCKETING | 0.152 | 0.114 | 0.190 | 0.114 | 0.190 | 0.228 | 0.076 |
| SERVICE AVAILABILITY AND EFFICIENCY | 0.150 | 0.225 | 0.075 | 0.112 | 0.187 | 0.112 | 0.187 |
| UNIVERSAL DESIGN | 0.134 | 0.101 | 0.168 | 0.201 | 0.067 | 0.101 | 0.168 |
| CLEANLINESS AND MAINTENANCE | 0.111 | 0.083 | 0.139 | 0.167 | 0.056 | 0.083 | 0.139 |
| FURNITURE AND FACILITIES | 0.088 | 0.066 | 0.110 | 0.132 | 0.044 | 0.066 | 0.110 |
| Women | |||||||
| OVERCROWDING AND EMERGENCY SITUATIONS | 0.186 | 0.139 | 0.232 | 0.139 | 0.232 | 0.279 | 0.093 |
| SERVICE AVAILABILITY AND EFFICIENCY | 0.154 | 0.231 | 0.077 | 0.116 | 0.193 | 0.116 | 0.193 |
| HARASSMENT AND PICKPOCKETING | 0.148 | 0.111 | 0.184 | 0.111 | 0.184 | 0.221 | 0.074 |
| UNIVERSAL DESIGN | 0.139 | 0.104 | 0.174 | 0.209 | 0.070 | 0.104 | 0.174 |
| CLEANLINESS AND MAINTENANCE | 0.106 | 0.079 | 0.132 | 0.159 | 0.053 | 0.079 | 0.132 |
| FURNITURE AND FACILITIES | 0.088 | 0.066 | 0.110 | 0.133 | 0.044 | 0.066 | 0.110 |
| Women traveling with dependents | |||||||
| UNIVERSAL DESIGN | 0.170 | 0.128 | 0.213 | 0.255 | 0.085 | 0.128 | 0.213 |
| OVERCROWDING AND EMERGENCY SITUATIONS | 0.167 | 0.125 | 0.209 | 0.125 | 0.209 | 0.251 | 0.084 |
| HARASSMENT AND PICKPOCKETING | 0.166 | 0.125 | 0.208 | 0.125 | 0.208 | 0.249 | 0.083 |
| SERVICE AVAILABILITY AND EFFICIENCY | 0.146 | 0.218 | 0.073 | 0.109 | 0.182 | 0.109 | 0.182 |
| CLEANLINESS AND MAINTENANCE | 0.087 | 0.066 | 0.109 | 0.131 | 0.044 | 0.066 | 0.109 |
| FURNITURE AND FACILITIES | 0.076 | 0.057 | 0.095 | 0.114 | 0.038 | 0.057 | 0.095 |
| Women low wage earners | |||||||
| OVERCROWDING AND EMERGENCY SITUATIONS | 0.183 | 0.137 | 0.228 | 0.137 | 0.228 | 0.274 | 0.091 |
| SERVICE AVAILABILITY AND EFFICIENCY | 0.157 | 0.236 | 0.079 | 0.118 | 0.197 | 0.118 | 0.197 |
| HARASSMENT AND PICKPOCKETING | 0.151 | 0.113 | 0.188 | 0.113 | 0.188 | 0.226 | 0.075 |
| UNIVERSAL DESIGN | 0.137 | 0.103 | 0.172 | 0.206 | 0.069 | 0.103 | 0.172 |
| CLEANLINESS AND MAINTENANCE | 0.114 | 0.086 | 0.143 | 0.171 | 0.057 | 0.086 | 0.143 |
| TICKETING OPTIONS AND FARES | 0.083 | 0.125 | 0.042 | 0.062 | 0.104 | 0.062 | 0.104 |
| OVERCROWDING AND EMERGENCY SITUATIONS | 0.183 | 0.137 | 0.228 | 0.137 | 0.228 | 0.274 | 0.091 |
| Women living in rural or suburban areas | |||||||
| OVERCROWDING AND EMERGENCY SITUATIONS | 0.197 | 0.148 | 0.246 | 0.148 | 0.246 | 0.296 | 0.098 |
| SERVICE AVAILABILITY AND EFFICIENCY | 0.159 | 0.239 | 0.080 | 0.120 | 0.199 | 0.120 | 0.199 |
| HARASSMENT AND PICKPOCKETING | 0.136 | 0.102 | 0.170 | 0.102 | 0.170 | 0.204 | 0.068 |
| UNIVERSAL DESIGN | 0.123 | 0.092 | 0.154 | 0.185 | 0.062 | 0.092 | 0.154 |
| CLEANLINESS AND MAINTENANCE | 0.119 | 0.089 | 0.149 | 0.179 | 0.060 | 0.089 | 0.149 |
| FURNITURE AND FACILITIES | 0.090 | 0.068 | 0.113 | 0.136 | 0.045 | 0.068 | 0.113 |
| Women discriminated | |||||||
| OVERCROWDING AND EMERGENCY SITUATIONS | 0.185 | 0.148 | 0.232 | 0.139 | 0.232 | 0.278 | 0.093 |
| UNIVERSAL DESIGN | 0.153 | 0.093 | 0.191 | 0.229 | 0.076 | 0.114 | 0.191 |
| SERVICE AVAILABILITY AND EFFICIENCY | 0.150 | 0.239 | 0.075 | 0.113 | 0.188 | 0.113 | 0.188 |
| HARASSMENT AND PICKPOCKETING | 0.148 | 0.102 | 0.185 | 0.111 | 0.185 | 0.222 | 0.074 |
| CLEANLINESS AND MAINTENANCE | 0.101 | 0.090 | 0.127 | 0.152 | 0.051 | 0.076 | 0.127 |
| TICKETING OPTIONS AND FARES | 0.086 | 0.125 | 0.043 | 0.065 | 0.108 | 0.065 | 0.108 |
1 Weights of level 2 FCs with the highest weights and summing up to 80%. 2 Weights of the level 2 FCs when changing level 1 FCs local weight by ±50%. A1: 1. Accessibility of the service. A2: 2. Design of the infrastructure. A3: 3. Safety and security. Underlined those level 2 FCs that are not included within the 80% cumulative weight when assessing the ±50% change in level one FC weight (.

Table A3.
Use case 2 sensitivity analysis.
Table A3.
Use case 2 sensitivity analysis.
| Initial Weight 1 | A1 × 1.5 2 | A1 × 0.5 2 | A2 × 1.5 2 | A2 × 0.5 2 | A3 × 1.5 2 | A3 × 0.5 2 | A4 × 1.5 2 | A4 × 0.5 2 | A5 × 1.5 2 | A5 × 0.5 2 | A6 × 1.5 2 | A6 × 0.5 2 | |
|---|---|---|---|---|---|---|---|---|---|---|---|---|---|
| Description | |||||||||||||
| All data (aggregated analysis) | |||||||||||||
| SIMULTANEITY | 0.087 | 0.078 | 0.096 | 0.130 | 0.043 | 0.078 | 0.096 | 0.078 | 0.096 | 0.078 | 0.096 | 0.078 | 0.096 |
| TRUST IN TECHNOLOGY | 0.080 | 0.072 | 0.088 | 0.120 | 0.040 | 0.072 | 0.088 | 0.072 | 0.088 | 0.072 | 0.088 | 0.072 | 0.088 |
| PUBLIC HEALTH | 0.067 | 0.060 | 0.073 | 0.060 | 0.073 | 0.060 | 0.073 | 0.060 | 0.073 | 0.100 | 0.033 | 0.060 | 0.073 |
| NON-MONETARY COST | 0.064 | 0.058 | 0.071 | 0.058 | 0.071 | 0.058 | 0.071 | 0.096 | 0.032 | 0.058 | 0.071 | 0.058 | 0.071 |
| EMISSIONS | 0.062 | 0.055 | 0.068 | 0.055 | 0.068 | 0.055 | 0.068 | 0.055 | 0.068 | 0.092 | 0.031 | 0.055 | 0.068 |
| VEHICLE EFFICIENCY | 0.056 | 0.050 | 0.062 | 0.050 | 0.062 | 0.050 | 0.062 | 0.084 | 0.028 | 0.050 | 0.062 | 0.050 | 0.062 |
| VEHICLE BEHAVIOR | 0.051 | 0.045 | 0.056 | 0.045 | 0.056 | 0.045 | 0.056 | 0.045 | 0.056 | 0.045 | 0.056 | 0.076 | 0.025 |
| MONETARY COST | 0.047 | 0.042 | 0.051 | 0.042 | 0.051 | 0.042 | 0.051 | 0.070 | 0.023 | 0.042 | 0.051 | 0.042 | 0.051 |
| HUMAN ERROR | 0.046 | 0.068 | 0.023 | 0.041 | 0.050 | 0.041 | 0.050 | 0.041 | 0.050 | 0.041 | 0.050 | 0.041 | 0.050 |
| TRAINING | 0.045 | 0.068 | 0.023 | 0.041 | 0.050 | 0.041 | 0.050 | 0.041 | 0.050 | 0.041 | 0.050 | 0.041 | 0.050 |
| INFRASTRUCTURE | 0.045 | 0.040 | 0.049 | 0.040 | 0.049 | 0.040 | 0.049 | 0.040 | 0.049 | 0.040 | 0.049 | 0.067 | 0.022 |
| TRAFFIC EFFICIENCY | 0.043 | 0.039 | 0.048 | 0.039 | 0.048 | 0.065 | 0.022 | 0.039 | 0.048 | 0.039 | 0.048 | 0.039 | 0.048 |
| ACCESSIBILITY | 0.043 | 0.038 | 0.047 | 0.038 | 0.047 | 0.064 | 0.021 | 0.038 | 0.047 | 0.038 | 0.047 | 0.038 | 0.047 |
| CONGESTION | 0.041 | 0.037 | 0.045 | 0.037 | 0.045 | 0.062 | 0.021 | 0.037 | 0.045 | 0.037 | 0.045 | 0.037 | 0.045 |
| ACCIDENT RATE | 0.040 | 0.060 | 0.020 | 0.036 | 0.044 | 0.036 | 0.044 | 0.036 | 0.044 | 0.036 | 0.044 | 0.036 | 0.044 |
| Women | |||||||||||||
| SIMULTANEITY | 0.091 | 0.082 | 0.100 | 0.137 | 0.046 | 0.082 | 0.100 | 0.082 | 0.100 | 0.082 | 0.100 | 0.082 | 0.100 |
| PUBLIC HEALTH | 0.076 | 0.068 | 0.083 | 0.068 | 0.083 | 0.068 | 0.083 | 0.068 | 0.083 | 0.114 | 0.038 | 0.068 | 0.083 |
| TRUST IN TECHNOLOGY | 0.075 | 0.068 | 0.083 | 0.113 | 0.038 | 0.068 | 0.083 | 0.068 | 0.083 | 0.068 | 0.083 | 0.068 | 0.083 |
| NON-MONETARY COST | 0.074 | 0.067 | 0.082 | 0.067 | 0.082 | 0.067 | 0.082 | 0.112 | 0.037 | 0.067 | 0.082 | 0.067 | 0.082 |
| EMISSIONS | 0.058 | 0.052 | 0.064 | 0.052 | 0.064 | 0.052 | 0.064 | 0.052 | 0.064 | 0.087 | 0.029 | 0.052 | 0.064 |
| VEHICLE BEHAVIOR | 0.057 | 0.051 | 0.063 | 0.051 | 0.063 | 0.051 | 0.063 | 0.051 | 0.063 | 0.051 | 0.063 | 0.085 | 0.028 |
| HUMAN ERROR | 0.054 | 0.081 | 0.027 | 0.048 | 0.059 | 0.048 | 0.059 | 0.048 | 0.059 | 0.048 | 0.059 | 0.048 | 0.059 |
| INFRASTRUCTURE | 0.050 | 0.045 | 0.056 | 0.045 | 0.056 | 0.045 | 0.056 | 0.045 | 0.056 | 0.045 | 0.056 | 0.076 | 0.025 |
| VEHICLE EFFICIENCY | 0.050 | 0.045 | 0.055 | 0.045 | 0.055 | 0.045 | 0.055 | 0.075 | 0.025 | 0.045 | 0.055 | 0.045 | 0.055 |
| CONGESTION | 0.046 | 0.042 | 0.051 | 0.042 | 0.051 | 0.069 | 0.023 | 0.042 | 0.051 | 0.042 | 0.051 | 0.042 | 0.051 |
| TRAVEL TIME | 0.045 | 0.041 | 0.050 | 0.041 | 0.050 | 0.068 | 0.023 | 0.041 | 0.050 | 0.041 | 0.050 | 0.041 | 0.050 |
| MONETARY COST | 0.042 | 0.038 | 0.047 | 0.038 | 0.047 | 0.038 | 0.047 | 0.063 | 0.021 | 0.038 | 0.047 | 0.038 | 0.047 |
| ACCESSIBILITY | 0.042 | 0.037 | 0.046 | 0.037 | 0.046 | 0.062 | 0.021 | 0.037 | 0.046 | 0.037 | 0.046 | 0.037 | 0.046 |
| HMI (HUMAN–MACHINE INTERFACE) | 0.040 | 0.036 | 0.044 | 0.036 | 0.044 | 0.036 | 0.044 | 0.036 | 0.044 | 0.036 | 0.044 | 0.060 | 0.020 |
| Women traveling with dependents | |||||||||||||
| SIMULTANEITY | 0.117 | 0.105 | 0.128 | 0.175 | 0.058 | 0.105 | 0.128 | 0.105 | 0.128 | 0.105 | 0.128 | 0.105 | 0.128 |
| PUBLIC HEALTH | 0.090 | 0.081 | 0.099 | 0.081 | 0.099 | 0.081 | 0.099 | 0.081 | 0.099 | 0.136 | 0.045 | 0.081 | 0.099 |
| VEHICLE EFFICIENCY | 0.080 | 0.072 | 0.088 | 0.072 | 0.088 | 0.072 | 0.088 | 0.120 | 0.040 | 0.072 | 0.088 | 0.072 | 0.088 |
| NON-MONETARY COST | 0.062 | 0.056 | 0.068 | 0.056 | 0.068 | 0.056 | 0.068 | 0.093 | 0.031 | 0.056 | 0.068 | 0.056 | 0.068 |
| VEHICLE BEHAVIOR | 0.058 | 0.052 | 0.064 | 0.052 | 0.064 | 0.052 | 0.064 | 0.052 | 0.064 | 0.052 | 0.064 | 0.087 | 0.029 |
| CONGESTION | 0.057 | 0.052 | 0.063 | 0.052 | 0.063 | 0.086 | 0.029 | 0.052 | 0.063 | 0.052 | 0.063 | 0.052 | 0.063 |
| ACCESSIBILITY | 0.051 | 0.046 | 0.056 | 0.046 | 0.056 | 0.076 | 0.025 | 0.046 | 0.056 | 0.046 | 0.056 | 0.046 | 0.056 |
| TRUST IN TECHNOLOGY | 0.050 | 0.045 | 0.055 | 0.075 | 0.025 | 0.045 | 0.055 | 0.045 | 0.055 | 0.045 | 0.055 | 0.045 | 0.055 |
| TRAINING | 0.047 | 0.071 | 0.024 | 0.043 | 0.052 | 0.043 | 0.052 | 0.043 | 0.052 | 0.043 | 0.052 | 0.043 | 0.052 |
| TRAFFIC MANAGEMENT | 0.045 | 0.067 | 0.022 | 0.040 | 0.049 | 0.040 | 0.049 | 0.040 | 0.049 | 0.040 | 0.049 | 0.040 | 0.049 |
| EMISSIONS | 0.044 | 0.040 | 0.049 | 0.040 | 0.049 | 0.040 | 0.049 | 0.040 | 0.049 | 0.067 | 0.022 | 0.040 | 0.049 |
| INFRASTRUCTURE | 0.042 | 0.038 | 0.046 | 0.038 | 0.046 | 0.038 | 0.046 | 0.038 | 0.046 | 0.038 | 0.046 | 0.063 | 0.021 |
| HUMAN ERROR | 0.042 | 0.062 | 0.021 | 0.037 | 0.046 | 0.037 | 0.046 | 0.037 | 0.046 | 0.037 | 0.046 | 0.037 | 0.046 |
| HMI (HUMAN–MACHINE INTERFACE) | 0.040 | 0.036 | 0.044 | 0.036 | 0.044 | 0.036 | 0.044 | 0.036 | 0.044 | 0.036 | 0.044 | 0.060 | 0.020 |
| Women low wage earners | |||||||||||||
| SIMULTANEITY | 0.102 | 0.092 | 0.112 | 0.153 | 0.051 | 0.092 | 0.112 | 0.092 | 0.112 | 0.092 | 0.112 | 0.092 | 0.112 |
| PUBLIC HEALTH | 0.073 | 0.065 | 0.080 | 0.065 | 0.080 | 0.065 | 0.080 | 0.065 | 0.080 | 0.109 | 0.036 | 0.065 | 0.080 |
| NON-MONETARY COST | 0.065 | 0.059 | 0.072 | 0.059 | 0.072 | 0.059 | 0.072 | 0.098 | 0.033 | 0.059 | 0.072 | 0.059 | 0.072 |
| TRUST IN TECHNOLOGY | 0.065 | 0.058 | 0.071 | 0.097 | 0.032 | 0.058 | 0.071 | 0.058 | 0.071 | 0.058 | 0.071 | 0.058 | 0.071 |
| EMISSIONS | 0.061 | 0.054 | 0.067 | 0.054 | 0.067 | 0.054 | 0.067 | 0.054 | 0.067 | 0.091 | 0.030 | 0.054 | 0.067 |
| MONETARY COST | 0.056 | 0.050 | 0.062 | 0.050 | 0.062 | 0.050 | 0.062 | 0.084 | 0.028 | 0.050 | 0.062 | 0.050 | 0.062 |
| VEHICLE BEHAVIOR | 0.052 | 0.047 | 0.057 | 0.047 | 0.057 | 0.047 | 0.057 | 0.047 | 0.057 | 0.047 | 0.057 | 0.078 | 0.026 |
| INFRASTRUCTURE | 0.050 | 0.045 | 0.055 | 0.045 | 0.055 | 0.045 | 0.055 | 0.045 | 0.055 | 0.045 | 0.055 | 0.075 | 0.025 |
| CONGESTION | 0.050 | 0.045 | 0.055 | 0.045 | 0.055 | 0.075 | 0.025 | 0.045 | 0.055 | 0.045 | 0.055 | 0.045 | 0.055 |
| TRAFFIC MANAGEMENT | 0.048 | 0.072 | 0.024 | 0.043 | 0.052 | 0.043 | 0.052 | 0.043 | 0.052 | 0.043 | 0.052 | 0.043 | 0.052 |
| TRAVEL TIME | 0.047 | 0.042 | 0.051 | 0.042 | 0.051 | 0.070 | 0.023 | 0.042 | 0.051 | 0.042 | 0.051 | 0.042 | 0.051 |
| VEHICLE EFFICIENCY | 0.045 | 0.041 | 0.050 | 0.041 | 0.050 | 0.041 | 0.050 | 0.068 | 0.023 | 0.041 | 0.050 | 0.041 | 0.050 |
| HUMAN ERROR | 0.045 | 0.068 | 0.023 | 0.041 | 0.050 | 0.041 | 0.050 | 0.041 | 0.050 | 0.041 | 0.050 | 0.041 | 0.050 |
| HMI (HUMAN–MACHINE INTERFACE) | 0.044 | 0.039 | 0.048 | 0.039 | 0.048 | 0.039 | 0.048 | 0.039 | 0.048 | 0.039 | 0.048 | 0.066 | 0.022 |
| Women living in rural and suburban areas | |||||||||||||
| SIMULTANEITY | 0.098 | 0.088 | 0.108 | 0.147 | 0.049 | 0.088 | 0.108 | 0.088 | 0.108 | 0.088 | 0.108 | 0.088 | 0.108 |
| NON-MONETARY COST | 0.071 | 0.064 | 0.078 | 0.064 | 0.078 | 0.064 | 0.078 | 0.107 | 0.036 | 0.064 | 0.078 | 0.064 | 0.078 |
| TRUST IN TECHNOLOGY | 0.069 | 0.062 | 0.075 | 0.103 | 0.034 | 0.062 | 0.075 | 0.062 | 0.075 | 0.062 | 0.075 | 0.062 | 0.075 |
| PUBLIC HEALTH | 0.067 | 0.052 | 0.074 | 0.061 | 0.074 | 0.061 | 0.074 | 0.061 | 0.074 | 0.101 | 0.034 | 0.061 | 0.074 |
| EMISSIONS | 0.058 | 0.052 | 0.064 | 0.052 | 0.064 | 0.052 | 0.064 | 0.052 | 0.064 | 0.087 | 0.029 | 0.052 | 0.064 |
| MONETARY COST | 0.055 | 0.050 | 0.061 | 0.050 | 0.061 | 0.050 | 0.061 | 0.083 | 0.028 | 0.050 | 0.061 | 0.050 | 0.061 |
| INFRASTRUCTURE | 0.053 | 0.052 | 0.058 | 0.048 | 0.058 | 0.048 | 0.058 | 0.048 | 0.058 | 0.048 | 0.058 | 0.079 | 0.026 |
| HUMAN ERROR | 0.050 | 0.075 | 0.025 | 0.045 | 0.055 | 0.045 | 0.055 | 0.045 | 0.055 | 0.045 | 0.055 | 0.045 | 0.055 |
| VEHICLE BEHAVIOR | 0.049 | 0.052 | 0.054 | 0.044 | 0.054 | 0.044 | 0.054 | 0.044 | 0.054 | 0.044 | 0.054 | 0.074 | 0.025 |
| TRAFFIC EFFICIENCY | 0.046 | 0.041 | 0.050 | 0.041 | 0.050 | 0.068 | 0.023 | 0.041 | 0.050 | 0.041 | 0.050 | 0.041 | 0.050 |
| TRAINING | 0.044 | 0.066 | 0.022 | 0.040 | 0.049 | 0.040 | 0.049 | 0.040 | 0.049 | 0.040 | 0.049 | 0.040 | 0.049 |
| TRAVEL TIME | 0.044 | 0.039 | 0.048 | 0.039 | 0.048 | 0.066 | 0.022 | 0.039 | 0.048 | 0.039 | 0.048 | 0.039 | 0.048 |
| HMI (HUMAN–MACHINE INTERFACE) | 0.043 | 0.052 | 0.048 | 0.039 | 0.048 | 0.039 | 0.048 | 0.039 | 0.048 | 0.039 | 0.048 | 0.065 | 0.022 |
| NOISE | 0.041 | 0.037 | 0.045 | 0.037 | 0.045 | 0.037 | 0.045 | 0.037 | 0.045 | 0.062 | 0.021 | 0.037 | 0.045 |
| VEHICLE EFFICIENCY | 0.040 | 0.036 | 0.044 | 0.036 | 0.044 | 0.036 | 0.044 | 0.061 | 0.020 | 0.036 | 0.044 | 0.036 | 0.044 |
| Women discriminated | |||||||||||||
| SIMULTANEITY | 0.107 | 0.096 | 0.117 | 0.160 | 0.053 | 0.096 | 0.117 | 0.096 | 0.117 | 0.096 | 0.117 | 0.096 | 0.117 |
| PUBLIC HEALTH | 0.092 | 0.083 | 0.101 | 0.083 | 0.101 | 0.083 | 0.101 | 0.083 | 0.101 | 0.138 | 0.046 | 0.083 | 0.101 |
| VEHICLE EFFICIENCY | 0.090 | 0.081 | 0.099 | 0.081 | 0.099 | 0.081 | 0.099 | 0.135 | 0.045 | 0.081 | 0.099 | 0.081 | 0.099 |
| HUMAN ERROR | 0.078 | 0.117 | 0.039 | 0.070 | 0.086 | 0.070 | 0.086 | 0.070 | 0.086 | 0.070 | 0.086 | 0.070 | 0.086 |
| CONGESTION | 0.072 | 0.065 | 0.079 | 0.065 | 0.079 | 0.108 | 0.036 | 0.065 | 0.079 | 0.065 | 0.079 | 0.065 | 0.079 |
| TRUST IN TECHNOLOGY | 0.060 | 0.054 | 0.066 | 0.090 | 0.030 | 0.054 | 0.066 | 0.054 | 0.066 | 0.054 | 0.066 | 0.054 | 0.066 |
| VEHICLE BEHAVIOR | 0.059 | 0.053 | 0.064 | 0.053 | 0.064 | 0.053 | 0.064 | 0.053 | 0.064 | 0.053 | 0.064 | 0.088 | 0.029 |
| EMISSIONS | 0.053 | 0.048 | 0.059 | 0.048 | 0.059 | 0.048 | 0.059 | 0.048 | 0.059 | 0.080 | 0.027 | 0.048 | 0.059 |
| NON-MONETARY COST | 0.052 | 0.047 | 0.058 | 0.047 | 0.058 | 0.047 | 0.058 | 0.079 | 0.026 | 0.047 | 0.058 | 0.047 | 0.058 |
| ACCIDENT RATE | 0.051 | 0.077 | 0.026 | 0.046 | 0.057 | 0.046 | 0.057 | 0.046 | 0.057 | 0.046 | 0.057 | 0.046 | 0.057 |
| INFRASTRUCTURE | 0.050 | 0.045 | 0.055 | 0.045 | 0.055 | 0.045 | 0.055 | 0.045 | 0.055 | 0.045 | 0.055 | 0.075 | 0.025 |
| HMI (HUMAN–MACHINE INTERFACE) | 0.048 | 0.043 | 0.053 | 0.043 | 0.053 | 0.043 | 0.053 | 0.043 | 0.053 | 0.043 | 0.053 | 0.072 | 0.024 |
1 Weights of level 2 FCs with the highest weights and summing up to 80%. 2 Weights of the level 2 FCs when changing level 1 FCs local weight by ±50%. A1: 1. Safety and security. A2: 2. Comfort. A3: 3. Mobility. A4: 4. Economy. A5: 5. Environment. A6: 6. Design option. Underlined those level 2 FCs that are not included within the 80% cumulative weight when assessing the ±50% change in level one FC weight (.

Table A4.
Use case 3 sensitivity analysis.
Table A4.
Use case 3 sensitivity analysis.
| Initial Weight 1 | A1 × 1.5 2 | A1 × 0.5 2 | A2 × 1.5 2 | A2 × 0.5 2 | A3 × 1.5 2 | A3 × 0.5 2 | A4 × 1.5 2 | A4 × 0.5 2 | |
|---|---|---|---|---|---|---|---|---|---|
| Description | 0 | ||||||||
| All data (aggregated analysis) | |||||||||
| TOPOGRAPHY | 0.144 | 0.120 | 0.168 | 0.120 | 0.168 | 0.120 | 0.168 | 0.216 | 0.072 |
| WEATHER | 0.106 | 0.089 | 0.124 | 0.089 | 0.124 | 0.089 | 0.124 | 0.159 | 0.053 |
| FAMILY RESPONSIBILITIES | 0.097 | 0.081 | 0.113 | 0.081 | 0.113 | 0.145 | 0.048 | 0.081 | 0.113 |
| PEER INFLUENCE (SUBJECTIVE NORM) | 0.082 | 0.068 | 0.096 | 0.068 | 0.096 | 0.123 | 0.041 | 0.068 | 0.096 |
| NEGATIVE PERCEPTIONS (SOCIOCULTURAL CONSTRAINS) | 0.071 | 0.059 | 0.083 | 0.059 | 0.083 | 0.107 | 0.036 | 0.059 | 0.083 |
| INSUFFICIENT INFRASTRUCTURE | 0.059 | 0.089 | 0.030 | 0.049 | 0.069 | 0.049 | 0.069 | 0.049 | 0.069 |
| SEPARATE INFRASTRUCTURE | 0.059 | 0.049 | 0.069 | 0.089 | 0.030 | 0.049 | 0.069 | 0.049 | 0.069 |
| TRAFFIC SAFETY | 0.055 | 0.046 | 0.064 | 0.082 | 0.027 | 0.046 | 0.064 | 0.046 | 0.064 |
| SAFE ENVIRONMENT AND PERSONAL SAFETY | 0.052 | 0.043 | 0.061 | 0.078 | 0.026 | 0.043 | 0.061 | 0.043 | 0.061 |
| PROXIMITY OF DOCKING STATION | 0.041 | 0.062 | 0.021 | 0.035 | 0.048 | 0.035 | 0.048 | 0.035 | 0.048 |
| DRIVERS´ BEHAVIOR | 0.040 | 0.033 | 0.047 | 0.060 | 0.020 | 0.033 | 0.047 | 0.033 | 0.047 |
| Women | |||||||||
| TOPOGRAPHY | 0.140 | 0.117 | 0.164 | 0.117 | 0.164 | 0.117 | 0.164 | 0.210 | 0.070 |
| WEATHER | 0.110 | 0.091 | 0.128 | 0.091 | 0.128 | 0.091 | 0.128 | 0.165 | 0.055 |
| FAMILY RESPONSIBILITIES | 0.108 | 0.090 | 0.127 | 0.090 | 0.127 | 0.163 | 0.054 | 0.090 | 0.127 |
| PEER INFLUENCE (SUBJECTIVE NORM) | 0.075 | 0.062 | 0.087 | 0.062 | 0.087 | 0.112 | 0.037 | 0.062 | 0.087 |
| INSUFFICIENT INFRASTRUCTURE | 0.067 | 0.101 | 0.034 | 0.056 | 0.079 | 0.056 | 0.079 | 0.056 | 0.079 |
| NEGATIVE PERCEPTIONS (SOCIOCULTURAL CONSTRAINS) | 0.067 | 0.056 | 0.078 | 0.056 | 0.078 | 0.100 | 0.033 | 0.056 | 0.078 |
| SAFE ENVIRONMENT AND PERSONAL SAFETY | 0.054 | 0.045 | 0.063 | 0.081 | 0.027 | 0.045 | 0.063 | 0.045 | 0.063 |
| TRAFFIC SAFETY | 0.053 | 0.044 | 0.061 | 0.079 | 0.026 | 0.044 | 0.061 | 0.044 | 0.061 |
| DRIVERS´ BEHAVIOR | 0.051 | 0.042 | 0.059 | 0.076 | 0.025 | 0.042 | 0.059 | 0.042 | 0.059 |
| SEPARATE INFRASTRUCTURE | 0.050 | 0.042 | 0.058 | 0.075 | 0.025 | 0.042 | 0.058 | 0.042 | 0.058 |
| TRAVELING WITH CHILDREN OR CARRYING THINGS | 0.044 | 0.066 | 0.022 | 0.036 | 0.051 | 0.036 | 0.051 | 0.036 | 0.051 |
| Women traveling with dependents | |||||||||
| TOPOGRAPHY | 0.154 | 0.128 | 0.180 | 0.128 | 0.180 | 0.128 | 0.180 | 0.231 | 0.077 |
| FAMILY RESPONSIBILITIES | 0.134 | 0.112 | 0.157 | 0.112 | 0.157 | 0.201 | 0.067 | 0.112 | 0.157 |
| WEATHER | 0.096 | 0.080 | 0.112 | 0.080 | 0.112 | 0.080 | 0.112 | 0.144 | 0.048 |
| PEER INFLUENCE (SUBJECTIVE NORM) | 0.065 | 0.055 | 0.076 | 0.055 | 0.076 | 0.098 | 0.033 | 0.055 | 0.076 |
| INSUFFICIENT INFRASTRUCTURE | 0.065 | 0.098 | 0.033 | 0.054 | 0.076 | 0.054 | 0.076 | 0.054 | 0.076 |
| SEPARATE INFRASTRUCTURE | 0.064 | 0.053 | 0.075 | 0.096 | 0.032 | 0.053 | 0.075 | 0.053 | 0.075 |
| TRAFFIC SAFETY | 0.055 | 0.046 | 0.065 | 0.083 | 0.028 | 0.046 | 0.065 | 0.046 | 0.065 |
| TRAVELING WITH CHILDREN OR CARRYING THINGS | 0.051 | 0.077 | 0.026 | 0.043 | 0.060 | 0.043 | 0.060 | 0.043 | 0.060 |
| NEGATIVE PERCEPTIONS (SOCIOCULTURAL CONSTRAINS) | 0.050 | 0.042 | 0.059 | 0.042 | 0.059 | 0.075 | 0.025 | 0.042 | 0.059 |
| DRIVERS´ BEHAVIOR | 0.044 | 0.037 | 0.052 | 0.067 | 0.022 | 0.037 | 0.052 | 0.037 | 0.052 |
| PROXIMITY OF DOCKING STATION | 0.043 | 0.065 | 0.022 | 0.036 | 0.051 | 0.036 | 0.051 | 0.036 | 0.051 |
| Women low wage earners | |||||||||
| TOPOGRAPHY | 0.146 | 0.122 | 0.171 | 0.122 | 0.171 | 0.122 | 0.171 | 0.219 | 0.073 |
| FAMILY RESPONSIBILITIES | 0.131 | 0.109 | 0.153 | 0.109 | 0.153 | 0.197 | 0.066 | 0.109 | 0.153 |
| WEATHER | 0.104 | 0.087 | 0.121 | 0.087 | 0.121 | 0.087 | 0.121 | 0.156 | 0.052 |
| SEPARATE INFRASTRUCTURE | 0.064 | 0.053 | 0.075 | 0.096 | 0.032 | 0.053 | 0.075 | 0.053 | 0.075 |
| PEER INFLUENCE (SUBJECTIVE NORM) | 0.063 | 0.052 | 0.073 | 0.052 | 0.073 | 0.094 | 0.031 | 0.052 | 0.073 |
| INSUFFICIENT INFRASTRUCTURE | 0.062 | 0.093 | 0.031 | 0.052 | 0.072 | 0.052 | 0.072 | 0.052 | 0.072 |
| TRAVELING WITH CHILDREN OR CARRYING THINGS | 0.061 | 0.092 | 0.031 | 0.051 | 0.071 | 0.051 | 0.071 | 0.051 | 0.071 |
| NEGATIVE PERCEPTIONS (SOCIOCULTURAL CONSTRAINS) | 0.056 | 0.047 | 0.065 | 0.047 | 0.065 | 0.084 | 0.028 | 0.047 | 0.065 |
| TRAFFIC SAFETY | 0.054 | 0.045 | 0.063 | 0.080 | 0.027 | 0.045 | 0.063 | 0.045 | 0.063 |
| DRIVERS´ BEHAVIOR | 0.050 | 0.041 | 0.058 | 0.074 | 0.025 | 0.041 | 0.058 | 0.041 | 0.058 |
| SAFE ENVIRONMENT AND PERSONAL SAFETY | 0.048 | 0.040 | 0.057 | 0.073 | 0.024 | 0.040 | 0.057 | 0.040 | 0.057 |
| Women living in rural or suburban areas | |||||||||
| WEATHER | 0.125 | 0.104 | 0.146 | 0.104 | 0.146 | 0.104 | 0.146 | 0.188 | 0.063 |
| TOPOGRAPHY | 0.125 | 0.104 | 0.146 | 0.104 | 0.146 | 0.104 | 0.146 | 0.188 | 0.063 |
| FAMILY RESPONSIBILITIES | 0.113 | 0.094 | 0.132 | 0.094 | 0.132 | 0.170 | 0.057 | 0.094 | 0.132 |
| PEER INFLUENCE (SUBJECTIVE NORM) | 0.072 | 0.060 | 0.084 | 0.060 | 0.084 | 0.108 | 0.036 | 0.060 | 0.084 |
| NEGATIVE PERCEPTIONS (SOCIOCULTURAL CONSTRAINS) | 0.065 | 0.054 | 0.076 | 0.054 | 0.076 | 0.098 | 0.033 | 0.054 | 0.076 |
| SEPARATE INFRASTRUCTURE | 0.054 | 0.045 | 0.063 | 0.080 | 0.027 | 0.045 | 0.063 | 0.045 | 0.063 |
| TRAFFIC SAFETY | 0.051 | 0.042 | 0.059 | 0.076 | 0.025 | 0.042 | 0.059 | 0.042 | 0.059 |
| SAFE ENVIRONMENT AND PERSONAL SAFETY | 0.045 | 0.038 | 0.053 | 0.068 | 0.023 | 0.038 | 0.053 | 0.038 | 0.053 |
| PROXIMITY OF DOCKING STATION | 0.043 | 0.064 | 0.021 | 0.036 | 0.050 | 0.036 | 0.050 | 0.036 | 0.050 |
| TRAVELING WITH CHILDREN OR CARRYING THINGS | 0.042 | 0.063 | 0.021 | 0.035 | 0.049 | 0.035 | 0.049 | 0.035 | 0.049 |
| INSUFFICIENT INFRASTRUCTURE | 0.040 | 0.061 | 0.020 | 0.034 | 0.047 | 0.034 | 0.047 | 0.034 | 0.047 |
| DRIVERS´ BEHAVIOR | 0.040 | 0.033 | 0.046 | 0.060 | 0.020 | 0.033 | 0.046 | 0.033 | 0.046 |
| Women discriminated | |||||||||
| TOPOGRAPHY | 0.195 | 0.162 | 0.227 | 0.162 | 0.227 | 0.162 | 0.227 | 0.292 | 0.097 |
| FAMILY RESPONSIBILITIES | 0.117 | 0.098 | 0.137 | 0.098 | 0.137 | 0.176 | 0.059 | 0.098 | 0.137 |
| INSUFFICIENT INFRASTRUCTURE | 0.084 | 0.126 | 0.042 | 0.070 | 0.098 | 0.070 | 0.098 | 0.070 | 0.098 |
| PEER INFLUENCE (SUBJECTIVE NORM) | 0.075 | 0.062 | 0.087 | 0.062 | 0.087 | 0.112 | 0.037 | 0.062 | 0.087 |
| DRIVERS´ BEHAVIOR | 0.066 | 0.055 | 0.077 | 0.099 | 0.033 | 0.055 | 0.077 | 0.055 | 0.077 |
| NEGATIVE PERCEPTIONS (SOCIOCULTURAL CONSTRAINS) | 0.058 | 0.049 | 0.068 | 0.049 | 0.068 | 0.088 | 0.029 | 0.049 | 0.068 |
| WEATHER | 0.055 | 0.046 | 0.065 | 0.046 | 0.065 | 0.046 | 0.065 | 0.083 | 0.028 |
| PROXIMITY OF DOCKING STATION | 0.054 | 0.081 | 0.027 | 0.045 | 0.063 | 0.045 | 0.063 | 0.045 | 0.063 |
| SEPARATE INFRASTRUCTURE | 0.053 | 0.044 | 0.062 | 0.079 | 0.026 | 0.044 | 0.062 | 0.044 | 0.062 |
| SAFE ENVIRONMENT AND PERSONAL SAFETY | 0.051 | 0.042 | 0.059 | 0.076 | 0.025 | 0.042 | 0.059 | 0.042 | 0.059 |
1 Weights of level 2 FCs with the highest weights and summing up to 80%. 2 Weights of the level 2 FCs when changing level 1 FCs local weight by ±50%. A1: 1. Accessibility and spontaneity. A2: 2. Safety and security. A3: 3. Social constraints. A4: 4. Weather and topology. Underlined those level 2 FCs that are not included within the 80% cumulative weight when assessing the ±50% change in level one FC weight (.

Table A5.
Use case 4 sensitivity analysis.
Table A5.
Use case 4 sensitivity analysis.
| Initial Weight 1 | A1 × 1.5 2 | A1 × 0.5 2 | A2 × 1.5 2 | A2 × 0.5 2 | A3 × 1.5 2 | A3 × 0.5 2 | A4 × 1.5 2 | A4 × 0.5 2 | |
|---|---|---|---|---|---|---|---|---|---|
| Description | |||||||||
| All data (aggregated analysis) | |||||||||
| CARING AND PARENTING RESPONSIBILITIES | 0.098 | 0.082 | 0.107 | 0.082 | 0.115 | 0.148 | 0.049 | 0.082 | 0.115 |
| DEMAND FACTORS (JOB RECRUITMENT) | 0.097 | 0.146 | 0.073 | 0.081 | 0.113 | 0.081 | 0.113 | 0.081 | 0.113 |
| POLICY/LEGAL | 0.083 | 0.125 | 0.062 | 0.069 | 0.097 | 0.069 | 0.097 | 0.069 | 0.097 |
| ACCESS TO RESOURCES | 0.082 | 0.069 | 0.089 | 0.069 | 0.096 | 0.124 | 0.041 | 0.069 | 0.096 |
| JOB SEGREGATION | 0.069 | 0.104 | 0.052 | 0.058 | 0.081 | 0.058 | 0.081 | 0.058 | 0.081 |
| ECONOMIC DEPRIVATION | 0.069 | 0.057 | 0.075 | 0.057 | 0.080 | 0.103 | 0.034 | 0.057 | 0.080 |
| DEMOGRAPHIC | 0.055 | 0.046 | 0.060 | 0.046 | 0.064 | 0.046 | 0.064 | 0.083 | 0.028 |
| SAFETY AND SECURITY | 0.055 | 0.046 | 0.060 | 0.082 | 0.027 | 0.046 | 0.064 | 0.046 | 0.064 |
| SKILLS | 0.054 | 0.045 | 0.058 | 0.045 | 0.063 | 0.045 | 0.063 | 0.081 | 0.027 |
| HR POLICIES | 0.053 | 0.044 | 0.057 | 0.079 | 0.026 | 0.044 | 0.062 | 0.044 | 0.062 |
| TRAINING PROVISION | 0.052 | 0.044 | 0.057 | 0.079 | 0.026 | 0.044 | 0.061 | 0.044 | 0.061 |
| EDUCATIONAL LEVEL AND ATTAINMENT | 0.049 | 0.041 | 0.053 | 0.041 | 0.058 | 0.041 | 0.058 | 0.074 | 0.025 |
| Women | |||||||||
| CARING AND PARENTING RESPONSIBILITIES | 0.095 | 0.079 | 0.103 | 0.079 | 0.111 | 0.143 | 0.048 | 0.079 | 0.111 |
| DEMAND FACTORS (JOB RECRUITMENT) | 0.092 | 0.138 | 0.069 | 0.076 | 0.107 | 0.076 | 0.107 | 0.076 | 0.107 |
| POLICY/LEGAL | 0.088 | 0.133 | 0.066 | 0.074 | 0.103 | 0.074 | 0.103 | 0.074 | 0.103 |
| ACCESS TO RESOURCES | 0.083 | 0.069 | 0.090 | 0.069 | 0.097 | 0.125 | 0.042 | 0.069 | 0.097 |
| ECONOMIC DEPRIVATION | 0.072 | 0.060 | 0.078 | 0.060 | 0.084 | 0.108 | 0.036 | 0.060 | 0.084 |
| JOB SEGREGATION | 0.070 | 0.105 | 0.052 | 0.058 | 0.081 | 0.058 | 0.081 | 0.058 | 0.081 |
| SAFETY AND SECURITY | 0.056 | 0.046 | 0.060 | 0.084 | 0.028 | 0.046 | 0.065 | 0.046 | 0.065 |
| EDUCATIONAL LEVEL AND ATTAINMENT | 0.055 | 0.046 | 0.060 | 0.046 | 0.064 | 0.046 | 0.064 | 0.083 | 0.028 |
| SKILLS | 0.055 | 0.045 | 0.059 | 0.045 | 0.064 | 0.045 | 0.064 | 0.082 | 0.027 |
| HR POLICIES | 0.052 | 0.044 | 0.057 | 0.078 | 0.026 | 0.044 | 0.061 | 0.044 | 0.061 |
| DEMOGRAPHIC | 0.052 | 0.043 | 0.056 | 0.043 | 0.060 | 0.043 | 0.060 | 0.077 | 0.026 |
| TRAINING PROVISION | 0.049 | 0.040 | 0.053 | 0.073 | 0.024 | 0.040 | 0.057 | 0.040 | 0.057 |
| Women traveling with dependents | |||||||||
| CARING AND PARENTING RESPONSIBILITIES | 0.104 | 0.087 | 0.113 | 0.087 | 0.121 | 0.156 | 0.052 | 0.087 | 0.121 |
| DEMAND FACTORS (JOB RECRUITMENT) | 0.100 | 0.151 | 0.075 | 0.084 | 0.117 | 0.084 | 0.117 | 0.084 | 0.117 |
| POLICY/LEGAL | 0.078 | 0.117 | 0.059 | 0.065 | 0.091 | 0.065 | 0.091 | 0.065 | 0.091 |
| ECONOMIC DEPRIVATION | 0.077 | 0.064 | 0.083 | 0.064 | 0.090 | 0.115 | 0.038 | 0.064 | 0.090 |
| JOB SEGREGATION | 0.071 | 0.107 | 0.053 | 0.059 | 0.083 | 0.059 | 0.083 | 0.059 | 0.083 |
| ACCESS TO RESOURCES | 0.069 | 0.058 | 0.075 | 0.058 | 0.081 | 0.104 | 0.035 | 0.058 | 0.081 |
| SAFETY AND SECURITY | 0.066 | 0.055 | 0.072 | 0.100 | 0.033 | 0.055 | 0.078 | 0.055 | 0.078 |
| SKILLS | 0.057 | 0.047 | 0.061 | 0.047 | 0.066 | 0.047 | 0.066 | 0.085 | 0.028 |
| FEMALE FACILITIES | 0.053 | 0.044 | 0.057 | 0.079 | 0.026 | 0.044 | 0.061 | 0.044 | 0.061 |
| TRAINING PROVISION | 0.052 | 0.043 | 0.056 | 0.078 | 0.026 | 0.043 | 0.061 | 0.043 | 0.061 |
| HEALTH STATUS AND WELLBEING | 0.052 | 0.043 | 0.056 | 0.043 | 0.061 | 0.043 | 0.061 | 0.078 | 0.026 |
| EDUCATIONAL LEVEL AND ATTAINMENT | 0.052 | 0.043 | 0.056 | 0.043 | 0.061 | 0.043 | 0.061 | 0.078 | 0.026 |
| Women low wage earners | |||||||||
| DEMAND FACTORS (JOB RECRUITMENT) | 0.093 | 0.139 | 0.046 | 0.077 | 0.108 | 0.077 | 0.108 | 0.077 | 0.108 |
| CARING AND PARENTING RESPONSIBILITIES | 0.090 | 0.075 | 0.105 | 0.075 | 0.105 | 0.135 | 0.045 | 0.075 | 0.105 |
| ACCESS TO RESOURCES | 0.088 | 0.073 | 0.102 | 0.073 | 0.102 | 0.132 | 0.044 | 0.073 | 0.102 |
| JOB SEGREGATION | 0.080 | 0.120 | 0.040 | 0.067 | 0.093 | 0.067 | 0.093 | 0.067 | 0.093 |
| POLICY/LEGAL | 0.077 | 0.116 | 0.039 | 0.064 | 0.090 | 0.064 | 0.090 | 0.064 | 0.090 |
| ECONOMIC DEPRIVATION | 0.072 | 0.060 | 0.084 | 0.060 | 0.084 | 0.108 | 0.036 | 0.060 | 0.084 |
| HR POLICIES | 0.055 | 0.046 | 0.065 | 0.083 | 0.028 | 0.046 | 0.065 | 0.046 | 0.065 |
| EDUCATIONAL LEVEL AND ATTAINMENT | 0.055 | 0.046 | 0.064 | 0.046 | 0.064 | 0.046 | 0.064 | 0.083 | 0.028 |
| SAFETY AND SECURITY | 0.053 | 0.044 | 0.062 | 0.080 | 0.027 | 0.044 | 0.062 | 0.044 | 0.062 |
| HEALTH STATUS AND WELLBEING | 0.052 | 0.044 | 0.061 | 0.044 | 0.061 | 0.044 | 0.061 | 0.078 | 0.026 |
| SKILLS | 0.052 | 0.043 | 0.060 | 0.043 | 0.060 | 0.043 | 0.060 | 0.078 | 0.026 |
| FEMALE FACILITIES | 0.049 | 0.041 | 0.057 | 0.073 | 0.024 | 0.041 | 0.057 | 0.041 | 0.057 |
| Women living in rural or urban areas | |||||||||
| JOB SEGREGATION | 0.096 | 0.145 | 0.048 | 0.080 | 0.112 | 0.080 | 0.112 | 0.080 | 0.112 |
| ECONOMIC DEPRIVATION | 0.089 | 0.049 | 0.104 | 0.075 | 0.104 | 0.134 | 0.045 | 0.075 | 0.104 |
| DEMAND FACTORS (JOB RECRUITMENT) | 0.083 | 0.145 | 0.042 | 0.069 | 0.097 | 0.069 | 0.097 | 0.069 | 0.097 |
| CARING AND PARENTING RESPONSIBILITIES | 0.083 | 0.066 | 0.096 | 0.069 | 0.096 | 0.124 | 0.041 | 0.069 | 0.096 |
| TERMS AND CONDITIONS | 0.079 | 0.145 | 0.092 | 0.119 | 0.040 | 0.066 | 0.092 | 0.066 | 0.092 |
| ACCESS TO RESOURCES | 0.078 | 0.028 | 0.091 | 0.065 | 0.091 | 0.117 | 0.039 | 0.065 | 0.091 |
| POLICY/LEGAL | 0.070 | 0.145 | 0.035 | 0.059 | 0.082 | 0.059 | 0.082 | 0.059 | 0.082 |
| DEMOGRAPHIC | 0.068 | 0.036 | 0.080 | 0.057 | 0.080 | 0.057 | 0.080 | 0.102 | 0.034 |
| HR POLICIES | 0.059 | 0.145 | 0.069 | 0.089 | 0.030 | 0.049 | 0.069 | 0.049 | 0.069 |
| EDUCATIONAL LEVEL AND ATTAINMENT | 0.054 | 0.045 | 0.064 | 0.045 | 0.064 | 0.045 | 0.064 | 0.082 | 0.027 |
| ADAPTABILITY | 0.053 | 0.029 | 0.062 | 0.044 | 0.062 | 0.044 | 0.062 | 0.080 | 0.027 |
| Women discriminated | |||||||||
| POLICY/LEGAL | 0.100 | 0.145 | 0.050 | 0.083 | 0.116 | 0.083 | 0.116 | 0.083 | 0.116 |
| DEMAND FACTORS (JOB RECRUITMENT) | 0.093 | 0.145 | 0.047 | 0.078 | 0.109 | 0.078 | 0.109 | 0.078 | 0.109 |
| CARING AND PARENTING RESPONSIBILITIES | 0.091 | 0.066 | 0.106 | 0.076 | 0.106 | 0.137 | 0.046 | 0.076 | 0.106 |
| ECONOMIC DEPRIVATION | 0.089 | 0.049 | 0.104 | 0.074 | 0.104 | 0.134 | 0.045 | 0.074 | 0.104 |
| ACCESS TO RESOURCES | 0.070 | 0.028 | 0.081 | 0.058 | 0.081 | 0.104 | 0.035 | 0.058 | 0.081 |
| DEMOGRAPHIC | 0.061 | 0.036 | 0.072 | 0.051 | 0.072 | 0.051 | 0.072 | 0.092 | 0.031 |
| SAFETY AND SECURITY | 0.058 | 0.145 | 0.068 | 0.088 | 0.029 | 0.049 | 0.068 | 0.049 | 0.068 |
| FEMALE FACILITIES | 0.057 | 0.145 | 0.067 | 0.086 | 0.029 | 0.048 | 0.067 | 0.048 | 0.067 |
| JOB SEGREGATION | 0.057 | 0.145 | 0.028 | 0.047 | 0.066 | 0.047 | 0.066 | 0.047 | 0.066 |
| HEALTH STATUS AND WELLBEING | 0.054 | 0.029 | 0.063 | 0.045 | 0.063 | 0.045 | 0.063 | 0.081 | 0.027 |
| SKILLS | 0.052 | 0.045 | 0.061 | 0.044 | 0.061 | 0.044 | 0.061 | 0.078 | 0.026 |
| HR POLICIES | 0.049 | 0.145 | 0.057 | 0.073 | 0.024 | 0.041 | 0.057 | 0.041 | 0.057 |
1 Weights of level 2 FCs with the highest weights and summing up to 80%. 2 Weights of the level 2 FCs when changing level 1 FCs local weight by ±50%. A1: 1. Socioeconomic conditions. A2: 2. Job characteristics. A3: 3. Personal circumstances. A4: 4. Individual characteristics. Underlined those level 2 FCs that are not included within the 80% cumulative weight when assessing the ±50% change in level one FC weight (.
References
- García-Jiménez, E.; Poveda-Reyes, S.; Molero, G.D.; Santarremigia, F.E.; Gorrini, A.; Hail, Y.; Ababio-Donkor, A.; Leva, M.C.; Mauriello, F. Methodology for gender analysis in transport: Factors with influence in women’s inclusion as professionals and users of transport infrastructures. Sustainability 2020, 12, 3656. [Google Scholar] [CrossRef]
- DIAMOND Project. A Method to Better Structure Your Transport Research: The Inclusion Diamond and Polyhedral Individual. Available online: https://diamond-project.eu/a-method-to-better-structure-your-transport-research-the-inclusion-diamond-and-polyhedral-individual/ (accessed on 19 November 2020).
- Santarremigia, F.E.; Molero, G.D.; Poveda-Reyes, S.; Breuil, F.; Hail, Y. Women inclusion in the transport system by applying a novel structured methodology: The inclusion diamond and polyhedral individual model. In Proceedings of the 6th International Conference on Women’s Issues in Transportation (WIiT 2019), Irvine, CA, USA, 10–13 September 2019. [Google Scholar]
- Molero, G.; Poveda-Reyes, S.; Blache, C.; Choubassi, R.; Boratto, L.; Leva, M.C.; Santarremigia, F. Structuring the evaluation of the inclusion of women within the transport sector: A use case study based on the inclusion diamond model. In Proceedings of the 8th Transport Research Arena TRA 2020, Helsinki, Finland, 27–30 April 2020. [Google Scholar]
- International Transport Forum. Transport Connectivity: A Gender Perspective; International Transport Forum: Paris, France, 2019. [Google Scholar]
- Harvey, J.; Thorpe, N.; Caygill, M.; Namdeo, A. Public attitudes to and perceptions of high speed rail in the UK. Transp. Policy 2014, 36, 70–78. [Google Scholar] [CrossRef]
- Adopt a Station, Projects to Humanise Public Transport Infrastructure. Available online: https://diamond-project.eu/adopt-a-station-projects-to-humanise-public-transport/ (accessed on 19 November 2020).
- UN Women. Across Eastern Europe, Rethinking Urban Planning, Infrastructure and Safety Bring Changes in Women’s Lives. Available online: https://www.unwomen.org/en/news/stories/2019/3/feature-eca-infrastructure (accessed on 19 November 2020).
- Yao, Y.; Zhang, Y.; Tian, L.; Zhou, N.; Li, Z.; Wang, M. Analysis of network structure of urban bike-sharing system: A case study based on real-time data of a public bicycle system. Sustainability 2019, 11, 5425. [Google Scholar] [CrossRef]
- Sanmiguel-Rodríguez, A. Análisis de las edades, trayectos y minutos de uso en la utilización de un sistema de bicicletas compartidas: El caso del VaiBike en Vilagarcía de Arousa (España) (Analysis of ages, routes, and minutes of use in a shared bicycle system: The case of VaiBike in Vilgarcía de Arousa). Retos 2018, 35, 314–319. [Google Scholar] [CrossRef]
- DeMaio, P. Bike-sharing: History, impacts, models of provision, and future. J. Public Transp. 2009, 12, 41–56. [Google Scholar] [CrossRef]
- The Meddin Bike-sharing World Map. Available online: https://bikesharingworldmap.com/#/all/5.3/103.96/1.17/ (accessed on 24 November 2020).
- Porcelanosa Lifestyle Magazine. Europe Gets Around on a Bicycle. Available online: https://www.porcelanosa-lifestyle.com/en/best-bike-friendly-cities/#gref (accessed on 24 November 2020).
- European Cyclists’ Federation (ECF). Cycling Facts and Figures. Available online: https://ecf.com/resources/cycling-facts-and-figures (accessed on 24 November 2020).
- Winslow, J.; Mont, O. Bicycle Sharing: Sustainable Value Creation and Institutionalisation Strategies in Barcelona. Sustainability 2019, 11, 728. [Google Scholar] [CrossRef]
- Raux, C.; Zoubir, A.; Geyik, M. Who are bike sharing schemes members and do they travel differently? The case of Lyon’s “Velo’v” scheme. Transp. Res. Part A 2017, 106, 350–363. [Google Scholar] [CrossRef]
- Stredwick, A. Why Don’t More Women Cycle? Available online: https://www.cyclinguk.org/article/campaigns-guide/women-cycling (accessed on 11 February 2021).
- Böhm, P.; Kocur, M.; Firat, M.; Isemann, D. Which factors influence attitudes towards using autonomous vehicles? In Proceedings of the 9th International Conference on Automotive User Interfaces and Interactive Vehicular Applications Adjunct, Oldenburg, Germany, 24–27 September 2017; ACM Press: New York, NY, USA, 2017; pp. 141–145. [Google Scholar]
- Balkmar, D. Violent mobilities: Men, masculinities and road conflicts in Sweden. Mobilities 2018, 13, 717–732. [Google Scholar] [CrossRef]
- Hanson, S. Gender and mobility: New approaches for informing sustainability. Gend. Place Cult. 2010, 17, 5–23. [Google Scholar] [CrossRef]
- Badstuber, N. Mind the Gender Gap: The Hidden Datagap in Transport. The Mandarin. Available online: https://www.themandarin.com.au/108874-mind-the-gender-gap-the-hidden-data-gap-in-transport/ (accessed on 1 February 2021).
- Criado-Perez, C. Invisible Women: Exposing Data Bias in a World Designed for Men; Vintage Publishing: London, UK, 2019; ISBN 9781784742928. [Google Scholar]
- Payre, W.; Cestac, J.; Delhomme, P. Intention to use a fully automated car: Attitudes and a priori acceptability. Transp. Res. Part F Traffic Psychol. Behav. 2014, 27, 252–263. [Google Scholar] [CrossRef]
- Hulse, L.M.; Xie, H.; Galea, E.R. Perceptions of autonomous vehicles: Relationships with road users, risk, gender and age. Saf. Sci. 2018, 102, 1–13. [Google Scholar] [CrossRef]
- Charness, N.; Yoon, J.S.; Souders, D.; Stothart, C.; Yehnert, C. Predictors of attitudes toward autonomous vehicles: The roles of age, gender, prior knowledge, and personality. Front. Psychol. 2018, 9, 2589. [Google Scholar] [CrossRef]
- Cartenì, A. The acceptability value of autonomous vehicles: A quantitative analysis of the willingness to pay for shared autonomous vehicles (SAVs) mobility services. Transp. Res. Interdiscip. Perspect. 2020, 8, 100224. [Google Scholar] [CrossRef]
- European Commission Mobility and Transport. Social Issues. What Do We Want to Achieve? Available online: https://ec.europa.eu/transport/themes/social (accessed on 7 April 2019).
- Eurostat. Employment by Sex, Age and Economic Activity (from 2008 onwards, NACE Rev. 2)-1000. Available online: http://appsso.eurostat.ec.europa.eu/nui/show.do?dataset=lfsq_egan2&lang=en (accessed on 22 April 2019).
- European Commission. Transport in the European Union-Current Trends and Issues; European Commission: Brussels, Belgium, 2019. [Google Scholar]
- European Commission Business Case to Increase Female Employment in Transport; EU Publications: Brussels, Belgium, 2018.
- Helfferich, B.; Franklin, P. Yes! More Women in Transport. Key Demands by the European Transport Workers’ Federation (ETF) to Make Transport Fit for Women to Work in; ETF: Brussels, Belgium, 2020. [Google Scholar]
- Helfferich, B.; Franklin, P. Making the Transport Sector Fit for Women to Work in. Findings from a Survey of Women Transport Workers by the European Transport Workers’ Federation (ETF); ETF: Brussels, Belgium, 2020. [Google Scholar]
- Hudson, C. Sharing fairly? Mobility, citizenship, and gender relations in two Swedish city-regions. J. Urban Aff. 2018, 40, 82–97. [Google Scholar] [CrossRef]
- Mateus, R.; Ferreira, J.A.; Carreira, J. Multicriteria decision analysis (MCDA): Central Porto high-speed railway station. Eur. J. Oper. Res. 2008, 187, 1–18. [Google Scholar] [CrossRef]
- Farooq, A.; Xie, M.; Stoilova, S.; Ahmad, F. Multicriteria evaluation of transport plan for high-speed rail: An application to Beijing-Xiongan. Math. Probl. Eng. 2019, 2019, 1–23. [Google Scholar] [CrossRef]
- Eren, E.; Uz, V.E. A review on bike-sharing: The factors affecting bike-sharing demand. Sustain. Cities Soc. 2020, 54, 101882. [Google Scholar] [CrossRef]
- Zeng, P.; Wei, M.; Liu, X. Investigating the spatiotemporal dynamics of urban vitality using bicycle-sharing data. Sustainability 2020, 12, 1714. [Google Scholar] [CrossRef]
- Li, L.; Shan, M. Bidirectional incentive model for bicycle redistribution of a bicycle sharing system during rush hour. Sustainability 2016, 8, 1299. [Google Scholar] [CrossRef]
- Ban, S.; Hyun, K.H. Designing a user participation-based bike rebalancing service. Sustainability 2019, 11, 2396. [Google Scholar] [CrossRef]
- Bieliński, T.; Kwapisz, A.; Ważna, A. Bike-sharing systems in Poland. Sustainability 2019, 11, 2458. [Google Scholar] [CrossRef]
- Romero, J.P.; Ibeas, A.; Moura, J.L.; Benavente, J.; Alonso, B. A simulation-optimization approach to design efficient systems of bike-sharing. Procedia Soc. Behav. Sci. 2012, 54, 646–655. [Google Scholar] [CrossRef]
- Cheng, M.; Wei, W. An AHP-DEA Approach of the bike-sharing spots selection problem in the free-floating bike-sharing system. Discret. Dyn. Nat. Soc. 2020, 2020, 1–15. [Google Scholar] [CrossRef]
- Kabak, M.; Erbaş, M.; Çetinkaya, C.; Özceylan, E. A GIS-based MCDM approach for the evaluation of bike-share stations. J. Clean. Prod. 2018, 201, 49–60. [Google Scholar] [CrossRef]
- Arena, F.; Pau, G.; Collotta, M. A survey on driverless vehicles: From their diffusion to security features. JISIS 2018, 3, 1–19. [Google Scholar]
- Nair, G.S.; Bhat, C.R. Sharing the road with autonomous vehicles: Perceived safety and regulatory preferences. Transp. Res. Part C Emerg. Technol. 2021, 122, 102885. [Google Scholar] [CrossRef]
- Topolšek, D.; Babić, D.; Babić, D.; Ojsteršek, T.C. Factors influencing the purchase intention of autonomous cars. Sustainability 2020, 12, 303. [Google Scholar] [CrossRef]
- Asmussen, K.E.; Mondal, A.; Bhat, C.R. A socio-technical model of autonomous vehicle adoption using ranked choice stated preference data. Transp. Res. Part C Emerg. Technol. 2020, 121, 102835. [Google Scholar] [CrossRef]
- Nogués, S.; González-González, E.; Cordera, R. New urban planning challenges under emerging autonomous mobility: Evaluating backcasting scenarios and policies through an expert survey. Land Use Policy 2020, 95, 104652. [Google Scholar] [CrossRef]
- Raj, A.; Kumar, J.A.; Bansal, P. A multicriteria decision making approach to study barriers to the adoption of autonomous vehicles. Transp. Res. Part A Policy Pract. 2020, 133, 122–137. [Google Scholar] [CrossRef]
- Haboucha, C.J.; Ishaq, R.; Shiftan, Y. User preferences regarding autonomous vehicles. Transp. Res. Part C Emerg. Technol. 2017, 78, 37–49. [Google Scholar] [CrossRef]
- Overtoom, I.; Correia, G.; Huang, Y.; Verbraeck, A. Assessing the impacts of shared autonomous vehicles on congestion and curb use: A traffic simulation study in The Hague, Netherlands. Int. J. Transp. Sci. Technol. 2020, 9, 195–206. [Google Scholar] [CrossRef]
- Turoń, K.; Kubik, A. Economic aspects of driving various types of vehicles in intelligent urban transport systems, including car-sharing services and autonomous vehicles. Appl. Sci. 2020, 10, 5580. [Google Scholar] [CrossRef]
- Zavadskas, E.K.; Stević, Ž.; Turskis, Z.; Tomašević, M. A novel extended EDAS in Minkowski space (EDAS-M) method for evaluating autonomous vehicles. Stud. Inform. Control 2019, 28, 255–264. [Google Scholar] [CrossRef]
- Turnbull, P. Working Paper No. 298 Promoting the Employment of Women in the Transport Sector-Obstacles and Policy Options; International Labour Office: Geneva, Switzerland, 2013; ISBN 9789221282433. [Google Scholar]
- Patton, W.; Doherty, C. Career, family, and workforce mobility: An interdisciplinary conversation. J. Career Dev. 2020, 47, 296–309. [Google Scholar] [CrossRef]
- Doherty, C.; Shield, P.; Patton, W.; Mu, G.M. The limits to public service: Rural communities, professional families and work mobility. Community Work Fam. 2015, 18, 100–116. [Google Scholar] [CrossRef]
- European Transport Workers’ Federation (ETF); UITP. Joint Recommendations: Strengthening Women Employment in Urban Public Transport (2014); ETF: Brussels, Belgium; UITP: Brussels, Belgium, 2014. [Google Scholar]
- French, E.; Strachan, G. Evaluating equal employment opportunity and its impact on the increased participation of men and women in the transport industry. Transp. Res. Part A Policy Pract. 2009, 43, 78–89. [Google Scholar] [CrossRef]
- Saaty, T.L. The analytic hierarchy process: What it is and how it is used. Math. Model. 1987, 9, 161–176. [Google Scholar] [CrossRef]
- Backhaus, J. The Pareto Principle. Anal. Krit. 1980, 2, 146–171. [Google Scholar] [CrossRef]
- Loshin, D. Data Quality. In Business Intelligence: The Savvy Manager’s Guide, 2nd ed.; Elsevier/Morgan Kaufmann: Amsterdam, The Netherlands, 2013; pp. 165–187. [Google Scholar]
- Saaty, T.L. The Analytic Hierarchy Process, Planning, Priority Setting, Resource Allocation; McGraw-Hill: New York, NY, USA, 1980. [Google Scholar]
- Santarremigia, F.E.; Molero, G.D.; Poveda-Reyes, S.; Aguilar-Herrando, J. Railway safety by designing the layout of inland terminals with dangerous goods connected with the rail transport system. Saf. Sci. 2018, 110, 206–216. [Google Scholar] [CrossRef]
- Saaty, T.L.; Ozdemir, M.S. Why the magic number seven plus or minus two. Math. Comput. Model. 2003, 38, 233–244. [Google Scholar] [CrossRef]
- Molero, G.D.; Santarremigia, F.E.; Aragonés-Beltrán, P.; Pastor-Ferrando, J.P. Total safety by design: Increased safety and operability of supply chain of inland terminals for containers with dangerous goods. Saf. Sci. 2017, 100, 168–182. [Google Scholar] [CrossRef]
- Linstone, H.A.; Turoff, M. The Delphi Method: Techniques and Applications; Addison-Wesley: Boston, MA, USA, 1975. [Google Scholar]
- Okoli, C.; Pawlowski, S.D. The Delphi method as a research tool: An example, design considerations and applications. Inf. Manag. 2004, 42, 15–29. [Google Scholar] [CrossRef]
- Gheorghiu, R.; Dragomir, B.; Andreescu, L.; Cuhls, K.; Rosa, A.; Curaj, A.; Weber, M. New Horizons: Data from a Delphi Survey in Support of European Union Future Policies in Research and Innovation; Publications Office of the European Union: Brussels, Belgium, 2017. [Google Scholar]
- Collet, C.; Musicant, O. Associating vehicles automation with drivers functional state assessment systems: A challenge for road safety in the future. Front. Hum. Neurosci. 2019, 13, 1–12. [Google Scholar] [CrossRef] [PubMed]
Publisher’s Note: MDPI stays neutral with regard to jurisdictional claims in published maps and institutional affiliations. |
© 2021 by the authors. Licensee MDPI, Basel, Switzerland. This article is an open access article distributed under the terms and conditions of the Creative Commons Attribution (CC BY) license (http://creativecommons.org/licenses/by/4.0/).

