1. Introduction
The design of Thermal Energy Storage (TES) units has gained considerable attention during the past few years since they can hold a significant amount of heat in a compact space [
1]. The TES units significantly contribute to the thermal management of devices and heat loading shifts. For example, a TES unit can be integrated into a cooling/heating system subject to fluctuations in thermal loads, so that the TES could absorb the fluctuations, and the thermal system can be designed for the average thermal load. Moreover, the TES systems can shift the thermal loads between hours, days, or even seasons [
2]. The TES heatsinks are also a novel type of heatsinks that can effectively damp transient heat loads in electronic components [
3,
4]. PCMs have also been integrated with bricks [
5] to improve the building material’s heat transfer characteristics.
The Phase Change Materials (PCMs) are a typical form of thermal energy storage medium, which could undergo a melting/solidification process and store/release thermal heat in the form of latent heat. PCMs are an excellent candidate for compact thermal energy storage; however, their low thermal conductivity results in poor heat transfer properties [
6]. A poor heat transfer rate leads to a slow response time of TES systems, and a long time is required for charging or discharging of thermal energy. Therefore, thermal enhancement approaches are required to improve the heat transfer rate of PCMs, and consequently, the response time of TES. Several approaches such as using metal foams [
7], thermal conductivity enhancement of PCMs by nanoparticles [
6], and extended surfaces and fins [
8] have been proposed to improve the heat transfer of TES units.
The fins have shown effective improvement in the charging/discharging time of TES units since they distribute the heat inside the PCM. Fins increase the contact area of PCM and hot/cold sources and lead to heat transfer improvement. However, the mass of fins does not contribute to latent heat energy storage, and thus, using metallic fins increases the size and weight of a TES for a fixed capacity of thermal energy storage. Moreover, typically the fins are made of copper or aluminum, which are expensive metals. Thus, the mass of utilized fins should be minimized. Another important point in using fins is the fact that they act as obstacles and could suppress the natural convection flows in a molten region of a TES capacity. Considering these points, many researchers tried to investigate the impact of using fins on the heat transfer behavior of TES units.
Borhani et al. [
9] analyzed the melting heat transfer of RT50 in a shell-and-tube shape TES unit. The space between the shell and the tube was filled with a PCM. A hot fluid was flowing in the tube while the surface of the tube was supported with a spiral-shaped fin extended inside the PCM. The authors studied the impact of a geometrical design of fins, such as the fin’s pitch and thickness, on the charging process. The outcomes showed that increasing the fin pitch from 10 mm to 20 mm, decreases the melting time by 35%. A good design of thickness and pitch enhanced the melting performance by 56%. Deng et al. [
10] examined the melting heat transfer of lauric acid PCM in a shell and tube heat exchanger TES unit. They mounted two fins at the tube side into the PCM and investigated the impact of placement location (angle) or fins. They found that there is an optimum angle for the placement of fins that could increase the melting performance by 66.7%.
The combination of metal foams and PCMs [
11] is another approach that has been investigated recently. For example, Talebizadehsardari et al. [
12] examined the discharging of an air heater filled with PCM-metal foam composite. Authors found that a well-designed geometry of heat transfer passages can change the discharging time from 13.6 h to 6 h. The impact of the storage size [
13] on the thermal energy storage and discharging behavior [
14] in domestic applications have also been examined.
Some researchers tried to promote the heat transfer of PCMs by adding nanoadditives to phase change materials and produce nano-enhanced phase change materials (NePCMs) with improved thermal conduct. Sheikholeslami et al. [
15] employed a Snowflake-shape fin configuration to improve the solidification of a PCM in a TES unit and reported that the presence of the Snowflake fins could notably increase the solidification rate without imposing a significant influence on the thermal energy storage capacity of the unit. Ma et al. [
16] employed a NePCM to improve the solidification rate of PCM in a wavy thermal energy storage duct. The duct walls were filled with NePCM while the cold air was blowing into the wavy surface of the channel. The authors reported that the increase of the amplitude of channel waves reduces the discharging time of the TES unit. Moreover, the presence of nanoadditives were pronounced when the channel surface was wavy. The impact of using nanoadditives for heat transfer in channel shape TES units [
17] has also been examined. Very recently, Irwan et al. [
18] reviewed the phase change process of NePCMs.
The literature review shows that either using fins or nanoadditives could improve the charging/discharging time of a TES unit. The combination of these two approaches could also be effective. It is clear that the presence of nanoparticles changes the thermophysical properties of PCM while the fins could suppress the convective flows in molten areas of TES. However, there is not any research that systematically evaluates a design of TES units to fully benefit from the advantage of nanoadditives and the geomatical shape of fins. Thus, the present research aims to address the impact of using fins and various types of NePCMs to minimize the charging time of a TES unit. The Taguchi optimization approach would be employed to find the optimum type of nanoparticles and fins arrangements.
3. Numerical Approach, Grid Dependency and Validations
In this investigation, controlling equations for the phase change flow are solved by employing the finite element numerical approach implemented in the Galerkin technique, coded as user-defined functions. The transitional forms of the governing equations, called weak forms, are established in the phase change material zone, the fins zone, and the HTF zone. To approximate the field variables, Lagrange elements of various orders are employed. To iteratively solve the residual equations, controlling the convergence, the PARallel DIrect SOlver (PARDISO) [
21,
22] is employed. The applied Newtonian damping factor for the solver is 0.8 and the relative tolerance is 10
−4. Backward differentiation formula (BDF) is utilized to handle the time dependent computations. More details about the utilized method and solution approach could be found in [
23,
24].
The computational domains defined for HTF and fins are meshed by structural rectangular grids. However, un-structural triangular grids are employed to mesh the NePCM domain. A useful tactic to reach an accurate solution with a low computational cost is the use of an optimum grid having a high-quality. Various meshes with different grid sizes are applied to check the impact of grid sizes on the simulated results. Several meshes with different grid sizes are applied to check the impact of grid sizes on the simulated results.
Table 3 lists the grids with the different number of elements used for meshing.
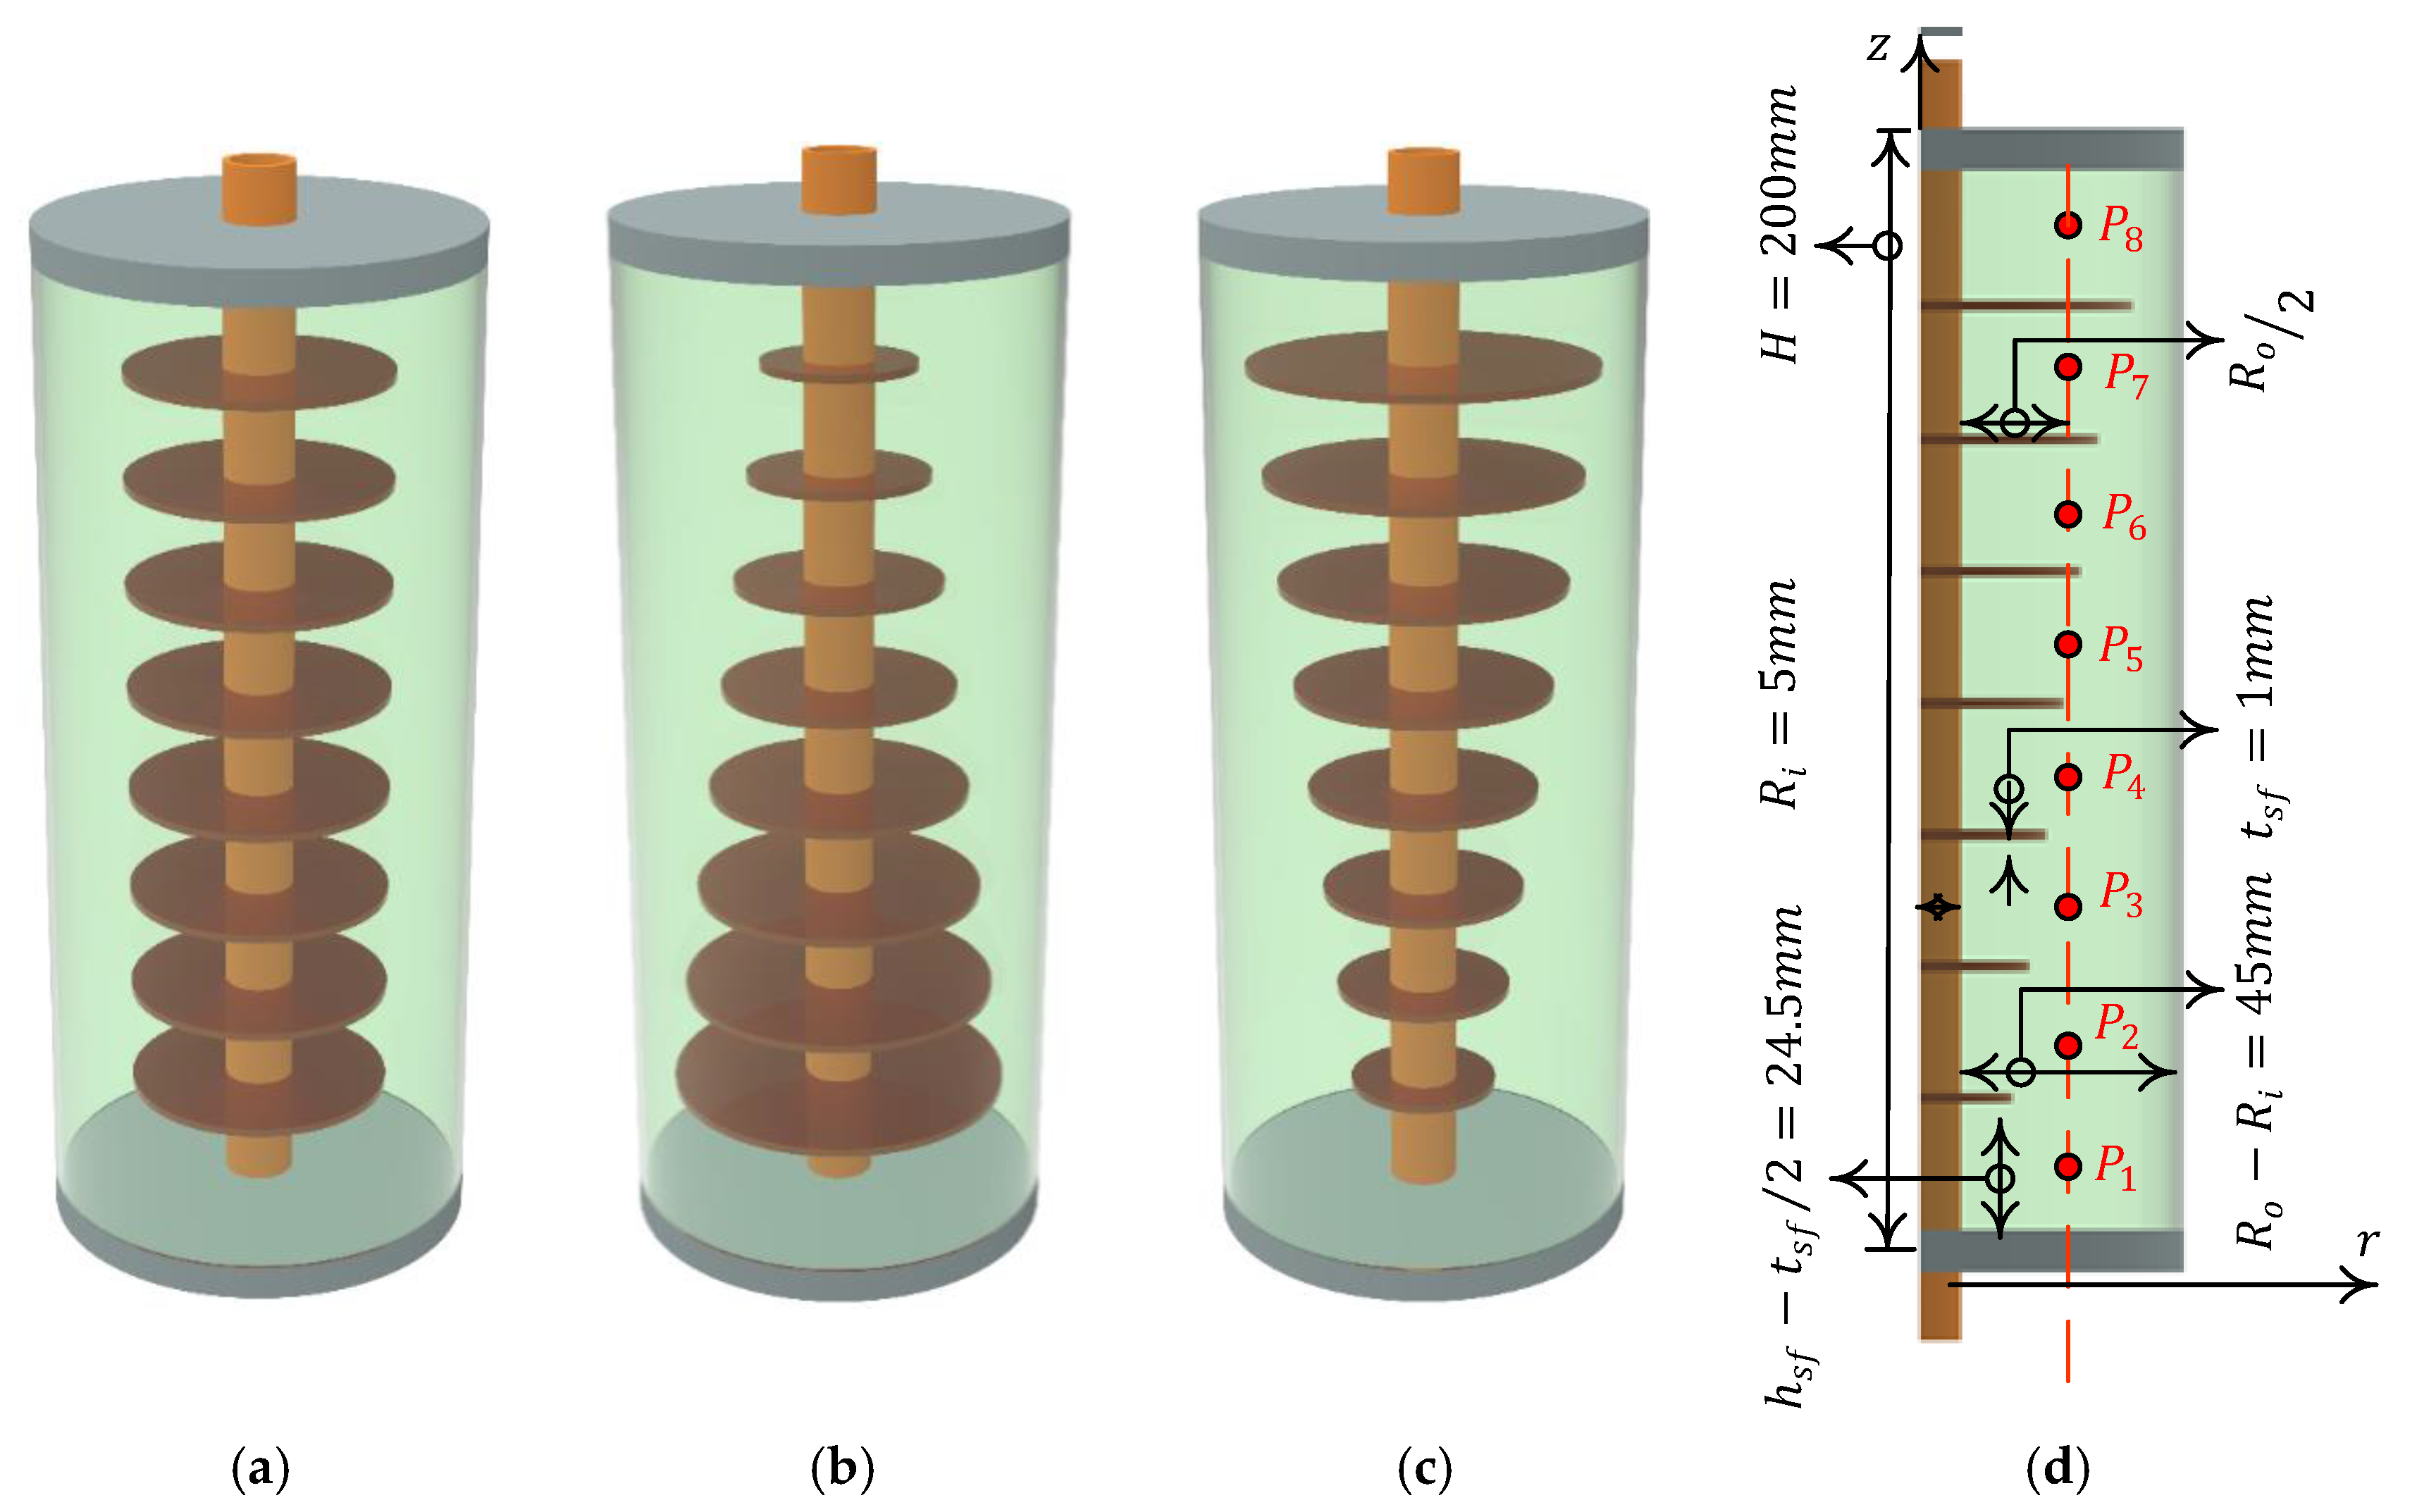
Figure 2a,b illustrates the dependency of the MVF and temperature calculated at P
5 to the mesh size. As these figures depict, no considerable changes in the MVF and temperature are observed when changing the mesh sizes. Although using a finer mesh could increase the computational cost, the solver was sensitive to the mesh size, and for a coarse mesh, one should take small steps to keep the convergence of numerical solutions. Indeed, the melting takes place in a narrow space and the distance between mesh elements should be adequately small so the elements should capture the changes. Hence, the mesh of C4 was computed smoothly, and therefore, the grid with 51,660 elements is chosen as the appropriate grid for the simulations.
To assess the reliability of the numerical algorithm, the numerical and experimental studies discussed in [
25] are employed. The current results are first compared with those reported in experimental-numerical work performed by Kumar et al. [
25]. In their study, the analysis of the melting flow of lead inside a square enclosure, experimentally and numerically, was conducted.
Figure 3 illustrates the progressive melting fronts over time for the conducted work by Kumar et al. [
25] and the present model.
In the second comparative analysis, the temperature distribution resulted from the current simulation is evaluated by employing that reported in [
26] and plotted in
Figure 4. This figure shows the isolines of natural convection in a portioned cavity heated from the left and cooled from right. The top and bottom are well insulated. The regular enclosure containing two vertical fins was filled by air.
Figure 5 shows the melting fraction for in a cavity filled with 1% wt. graphene nanoplatelets dispersed in 1-tetradecanol as experimented in [
27]. The cavity was rectangular with a size of (25 mm) × width (20 mm), which led to an aspect ratio of 0.8. The NePCM was at an initial super cold temperature of 36 °C. During the melting, the heated wall was kept at an isothermal temperature of 47 °C while the fusion temperature was 37 °C. The melting fraction as a function of time is compared with the numerical results of the present study. The three comparative analyses discussed above confirm the reliability of the employed model.
4. Results and Discussion
The design parameters of the TES unit are the volume concentration of nanoparticles (0 <
υna < 4.5%), the aspect ratio of the PCM enclosure (0.1 <
AR < 1.45), and the type of nanoparticles. The Taguchi optimization method is adopted to explore the combination of possible designs and find the best values of these design parameters to maximize the melting rate. Following the Taguchi method, each design parameter should be divided into levels. Here, four levels are selected for each parameter. The selected levels are depicted in
Table 4. Four types of nanoparticles are also selected, which are Al
2O
3, GO, Ag, and Cu.
The Taguchi method uses orthogonal tables to efficiently explore the design space. Since there are three design parameters and four levels, the possible design combinations are 4
3. Here the standard orthogonal table of L16 was selected, which is summarized in
Table 5. The volume concentration for cases 1–4 of
Table 5 are zero, and thus, there is no difference between the type of nanoparticles. However, the aspect ratio is changing and thus these cases are not identical.
The simulations were executed for each case of
Table 5, and the melting rate, stored energy, and temperature uniformity of the PCM enclosure were computed. The melting time of 5.5 h (19,800 s) was adopted for the design target. This is a typical time for charging a TES unit.
The computed values of the molten portion (MVF), total stored energy (ES), and temperature uniformity were written in
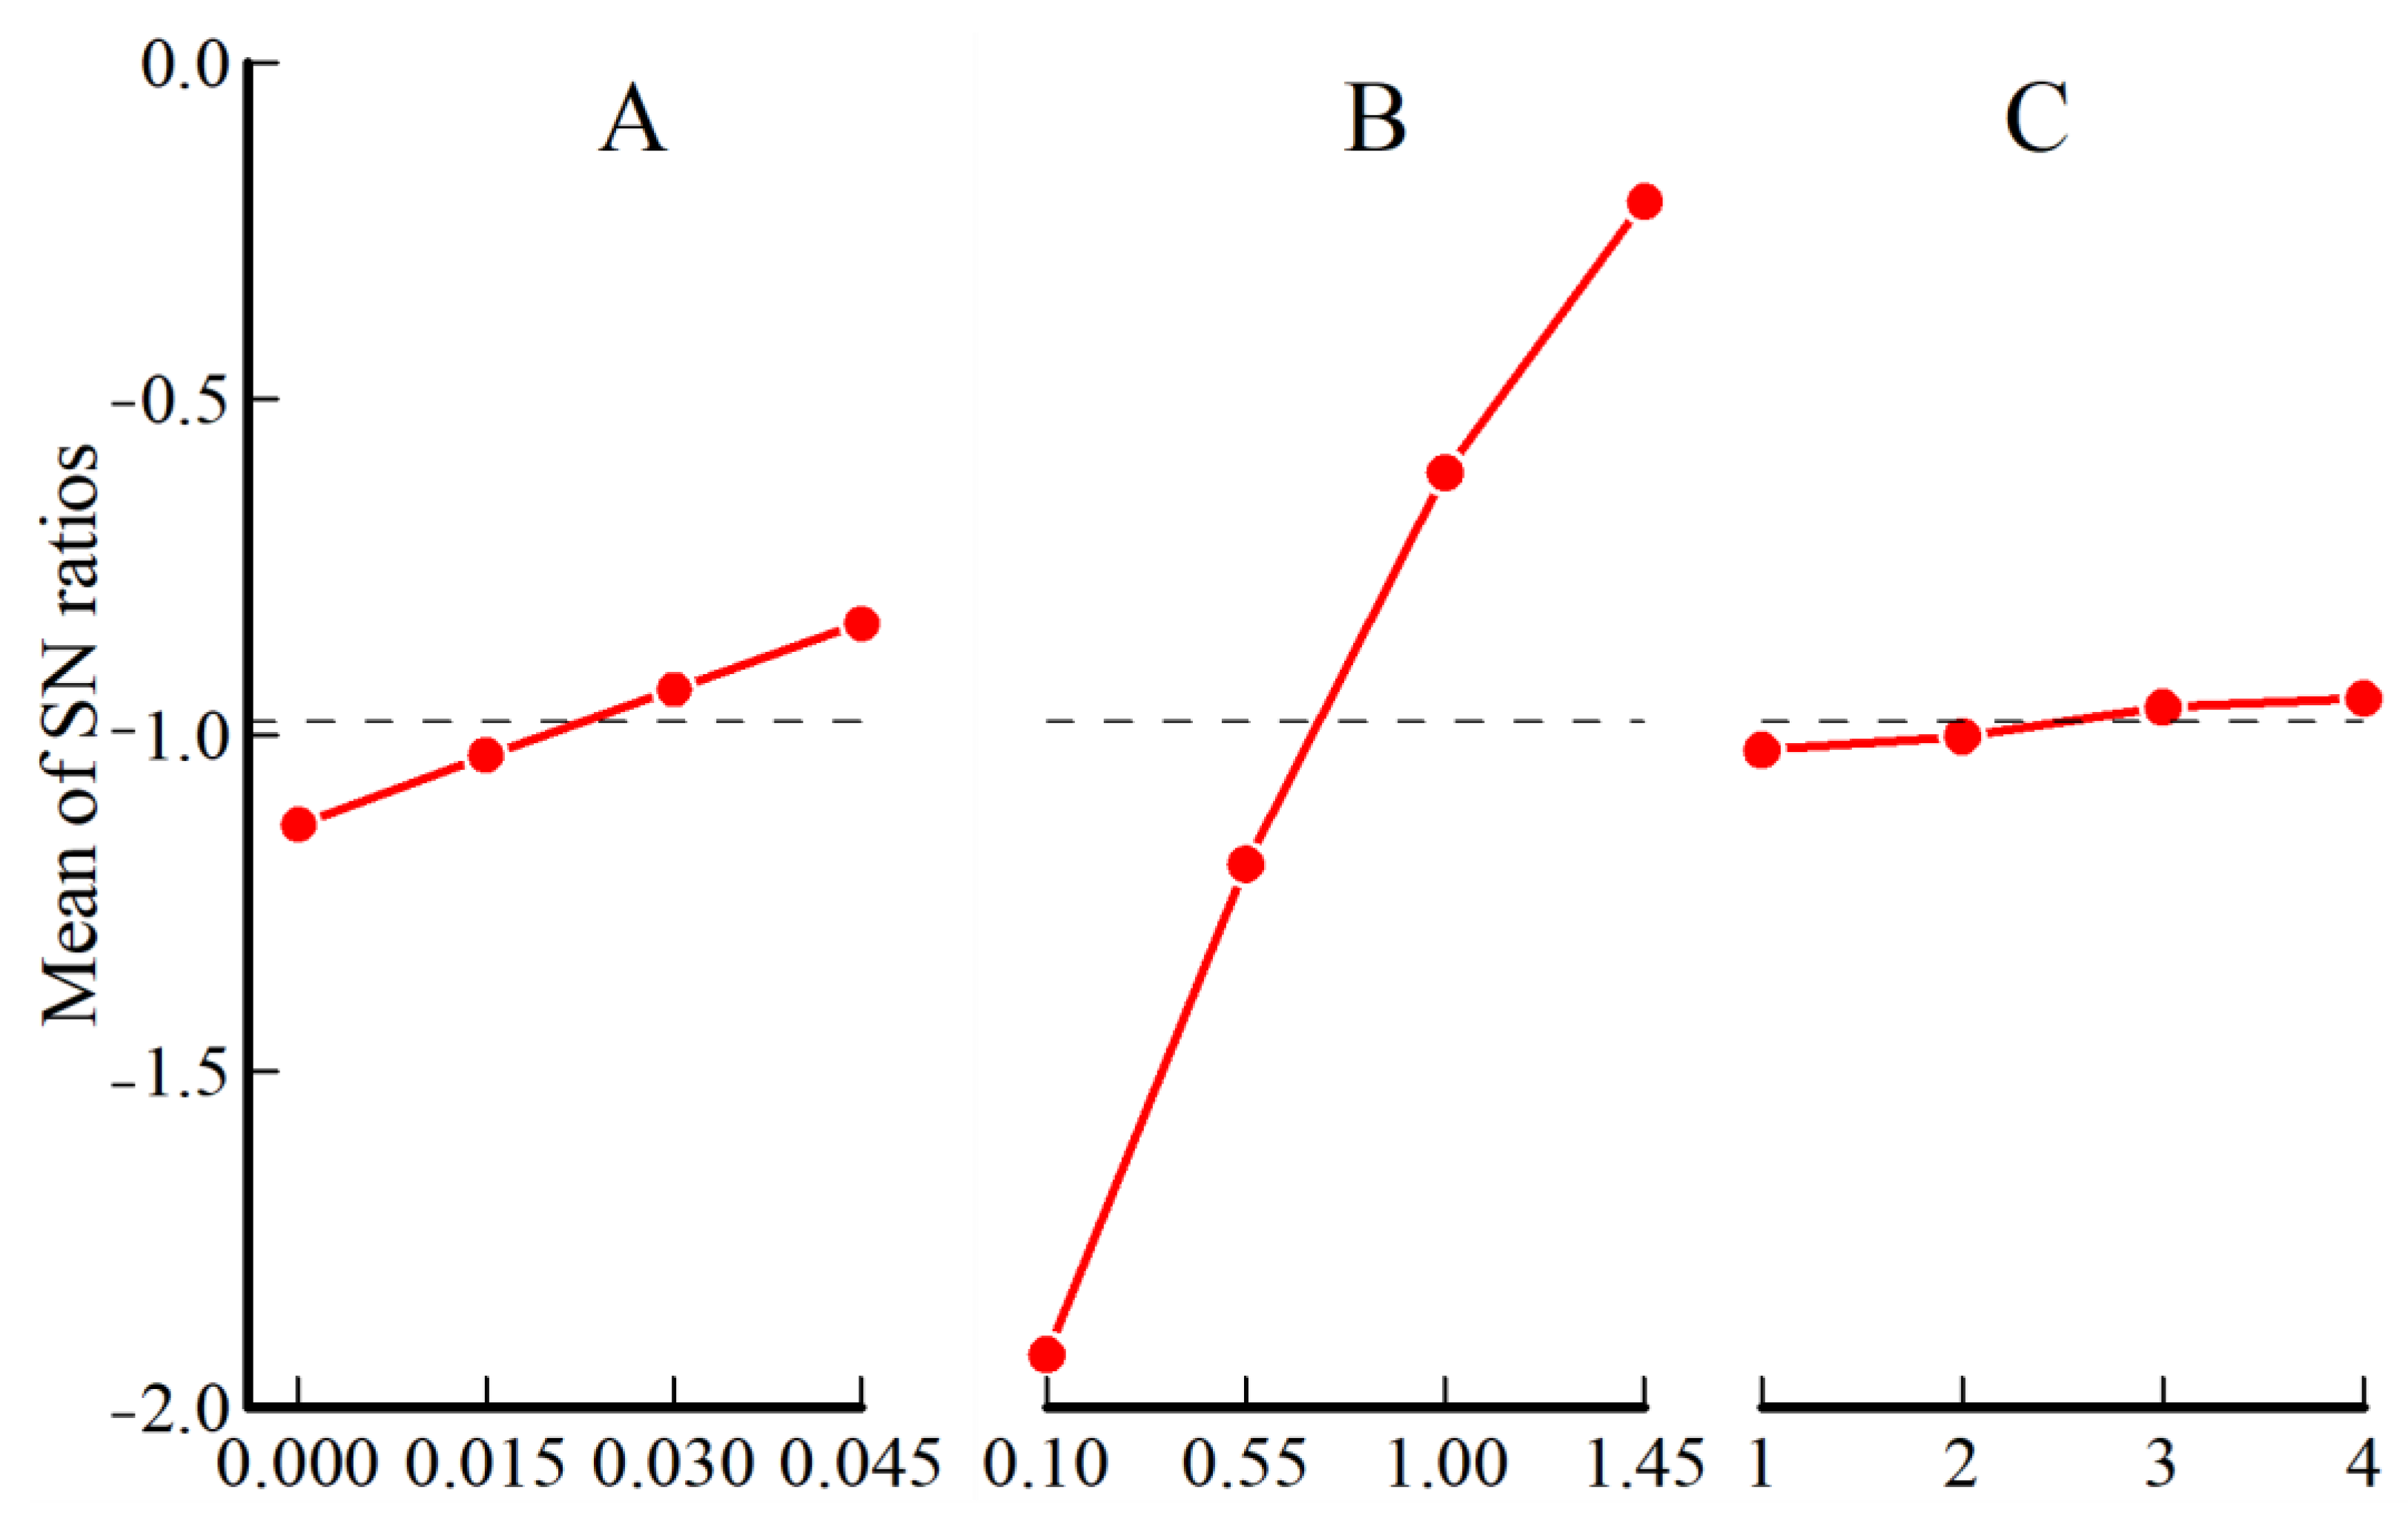
Table 5. The molten portion (MVF) was adopted as the target parameter with the aim of “the larger, the better”. Using the Taguchi method, the values of signal to noise (S/N) were computed and inserted in
Table 5. A large value of S/N shows the advantage of a case for the selected target (higher MVF). Now, the computed S/N ratios were utilized to plot S/N ratios for each design parameter, as illustrated in
Figure 6.
Following the Taguchi method, a level corresponding to the highest value of S/N for each design parameter should be selected as the optimum level. Thus,
υna = 0.045,
AR = 1.45, and Cu nanoparticles were selected as the optimum design case.
Table 6 shows the estimated MVF at 19,800 s, which is 0.995. The simulations were done for the same case, and the actual MVF was computed as 0.984, which is close to the estimated value. This case is very close to case 16 of
Table 5 for Al
2O
3. However, the Cu nanoparticles could be more compatible with the copper material of fins, and thus, the case of Cu nanoparticles was selected as the optimum nanoparticles. The optimum case shows a 20% more melting rate than a poorly designed case of 1 (from
Table 5).
The S/N ratio denotes a design advantage for a test case. The larger S/N ratio, the more influential the parameter’s level. Moreover, the larger the variation of S/N, the more effective the parameter.
Figure 6 shows that the variation of S/N is highest for aspect ratio (
AR) and lowest for the type of nanoparticles. The volume fraction of nanoparticles is the second most important, influential design parameter. It is clear that the increase of volume fraction of nanoparticles and aspect ratio increases the MVF.
A further investigation of the impact of variation of volume fractions of Cu nanoparticles and aspect ratio on the melting behavior was done. The investigation is designed to explore the melting behavior around the optimum design case. Thus, six cases of
Table 7 were adopted, and the melting process for these cases was simulated.
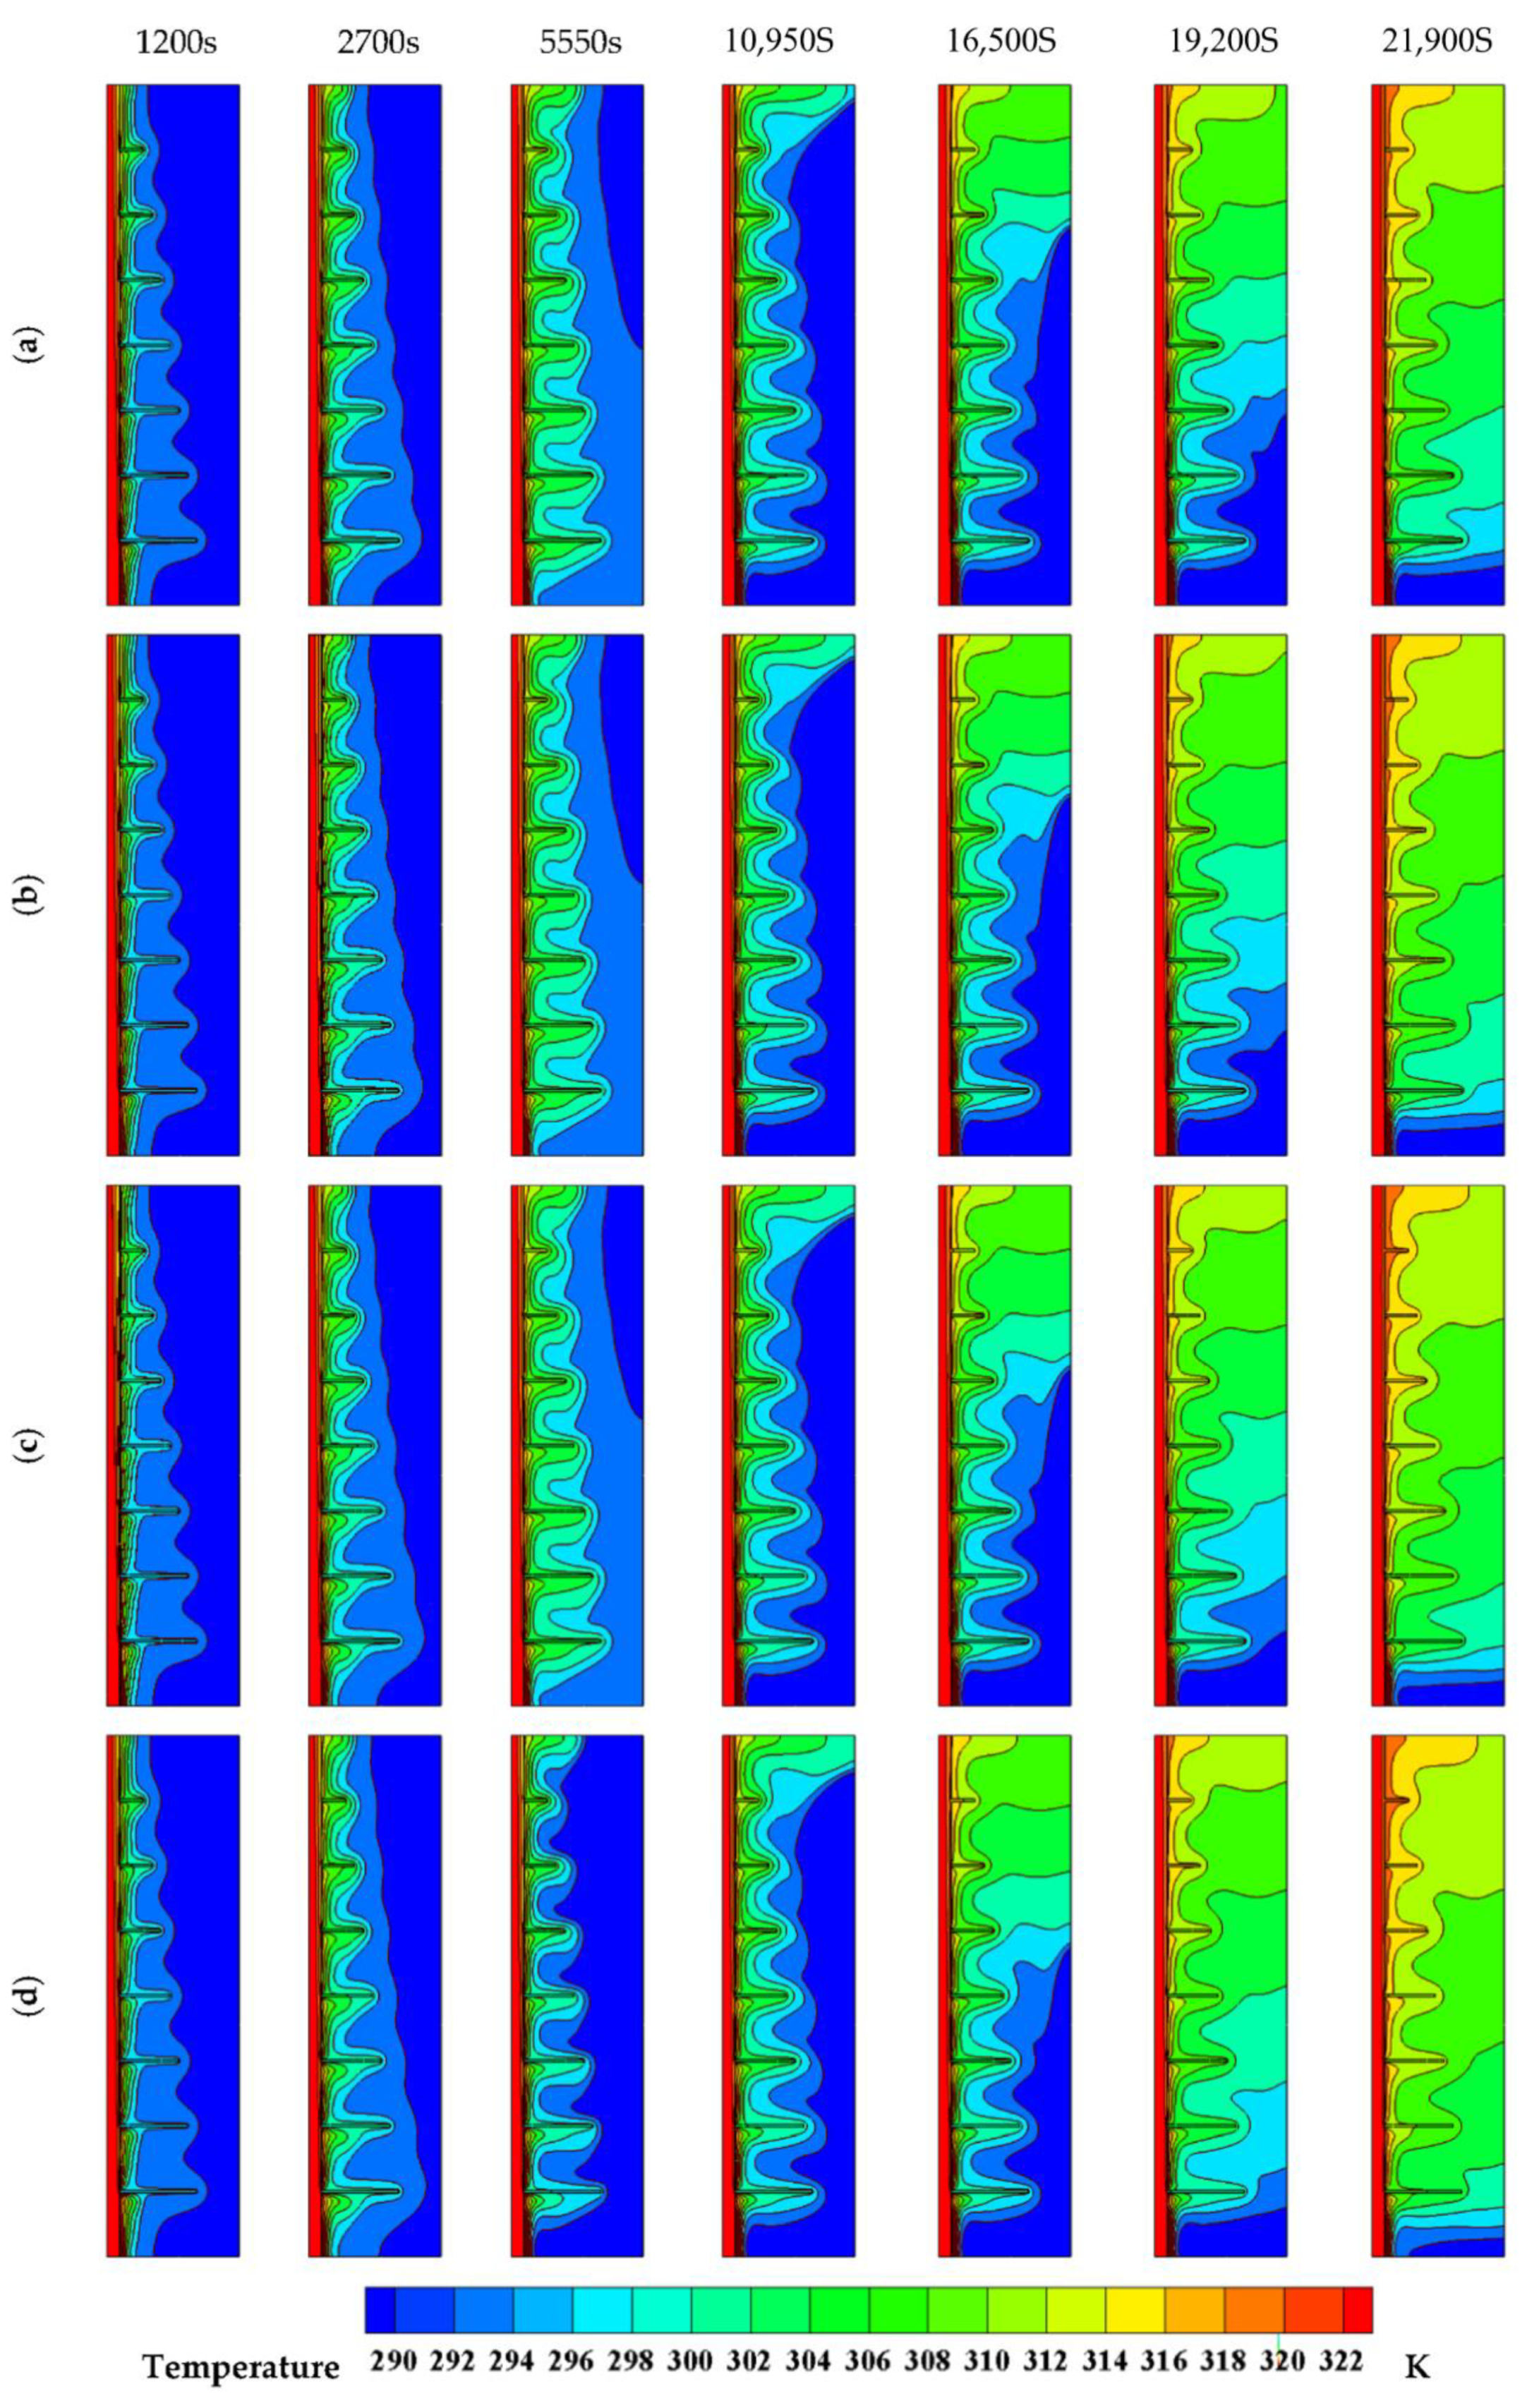
Figure 7 shows the temperature distribution in the enclosure for various volume fractions of nanoparticles and different melting times when
AR = 1.45. At a short time of 1200 s, the tube’s solid wall is at a hot temperature, and almost the entire enclosure is at a cold temperature. The heat transfer between HTF fluid and PCM in the enclosure develops mostly at the bottom parts of PCM. In the beginning of heat transfer, the PCM is in a super-cold solid state. Thus, there is no natural convection circulation in the PCM domain. The HTF fluid enters the TES unit as the bottom, and hence, the most robust heat transfer rate occurs at the bottom. The PCM around the fins is hot, which shows the impact of fins at this stage. Moreover, since
AR = 1.45, the fins at the bottom are much longer than the top. At the time step of 1200 s, the impact of variation of
υna on the temperature field is not obvious. As time passes, the melting advances, and the temperature gradients extend to an un-melted area. The impact of the presence of nanoparticles becomes obvious after long periods of time, where the melting advances.
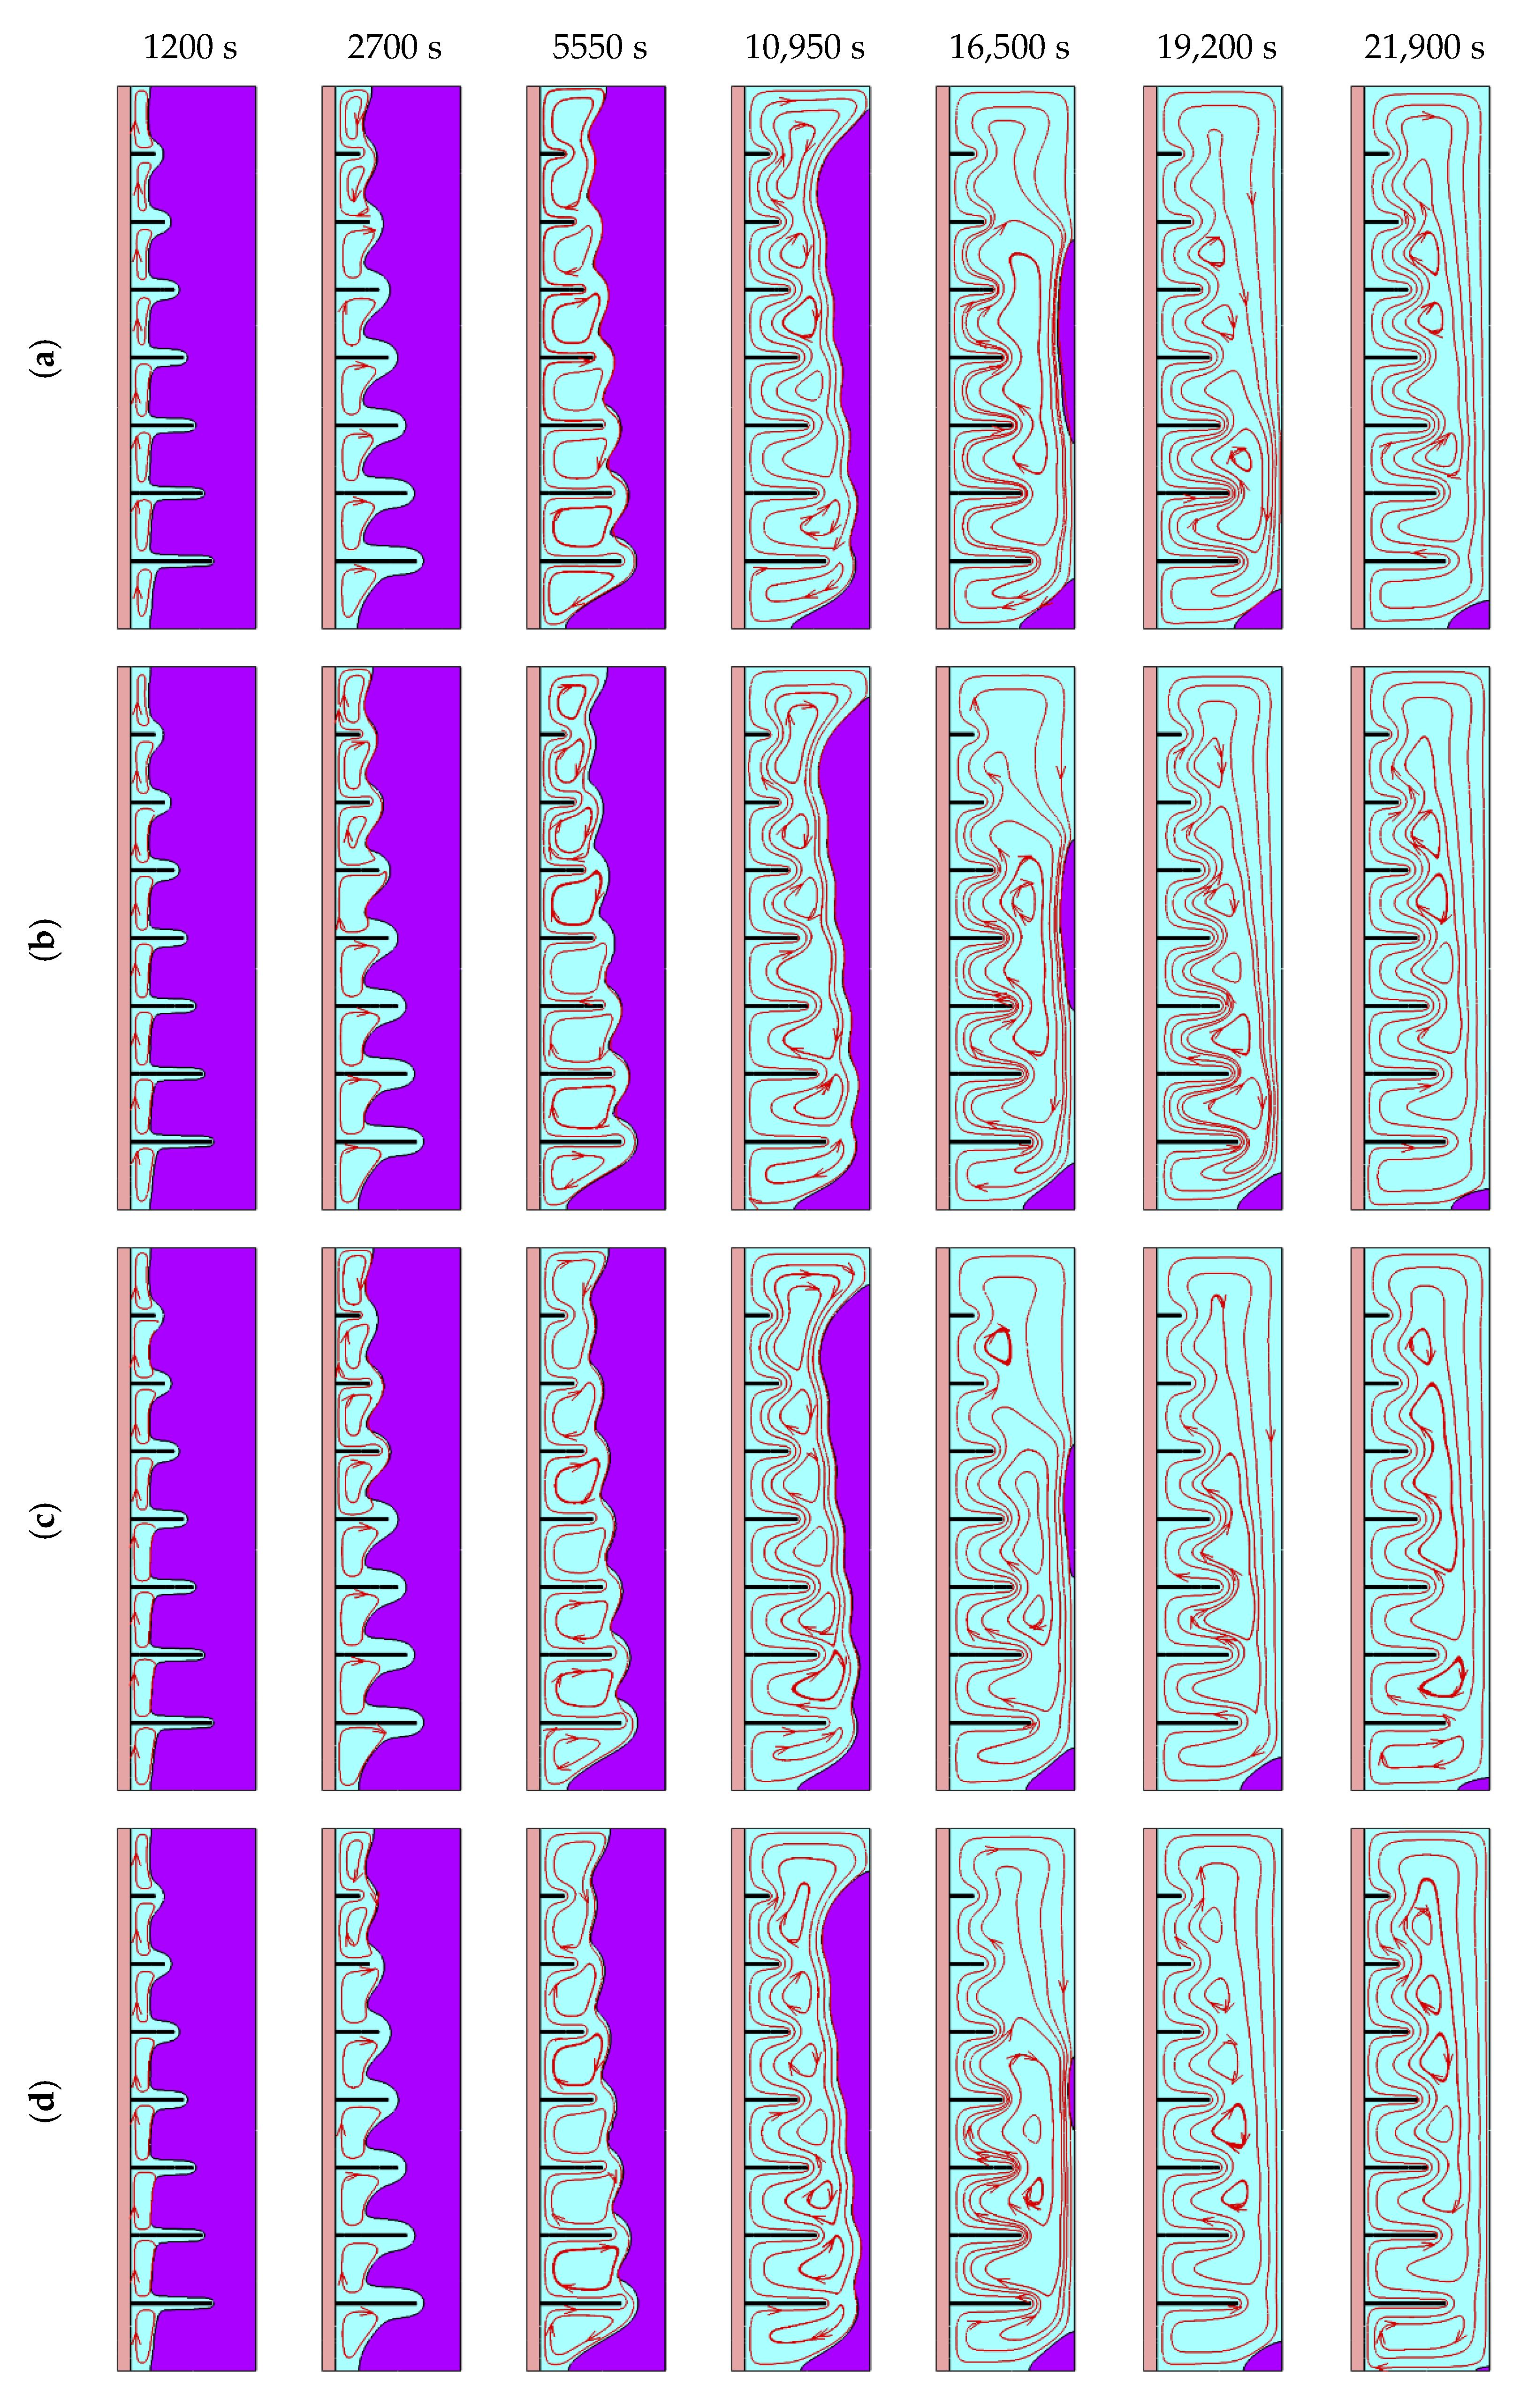
Figure 8 shows the streamlines and melting interface in the PCM domain. The melting starts around the fins and advances inside the enclosure during the time. A comparison between the parents on melting interface and solid regions for various concentrations of nanoparticles shows that the increase of concentration increases the melting rate and reduces the remaining solid regions.
Figure 9a,b depicts the MVF and total stored energy during the melting process.
Figure 9a shows that the higher the concentration of nanoparticles, the larger the melting rate. An increase in nanoparticle concentration also decreases the charging time. These findings are in good agreement with the melting shapes observed in the contours of
Figure 8.
Figure 9b also indicates that the rise of nanoparticle concentration increases the rate of stored energy. The presence of nanoparticles mostly influences the stored energy in the middle of the charging process.
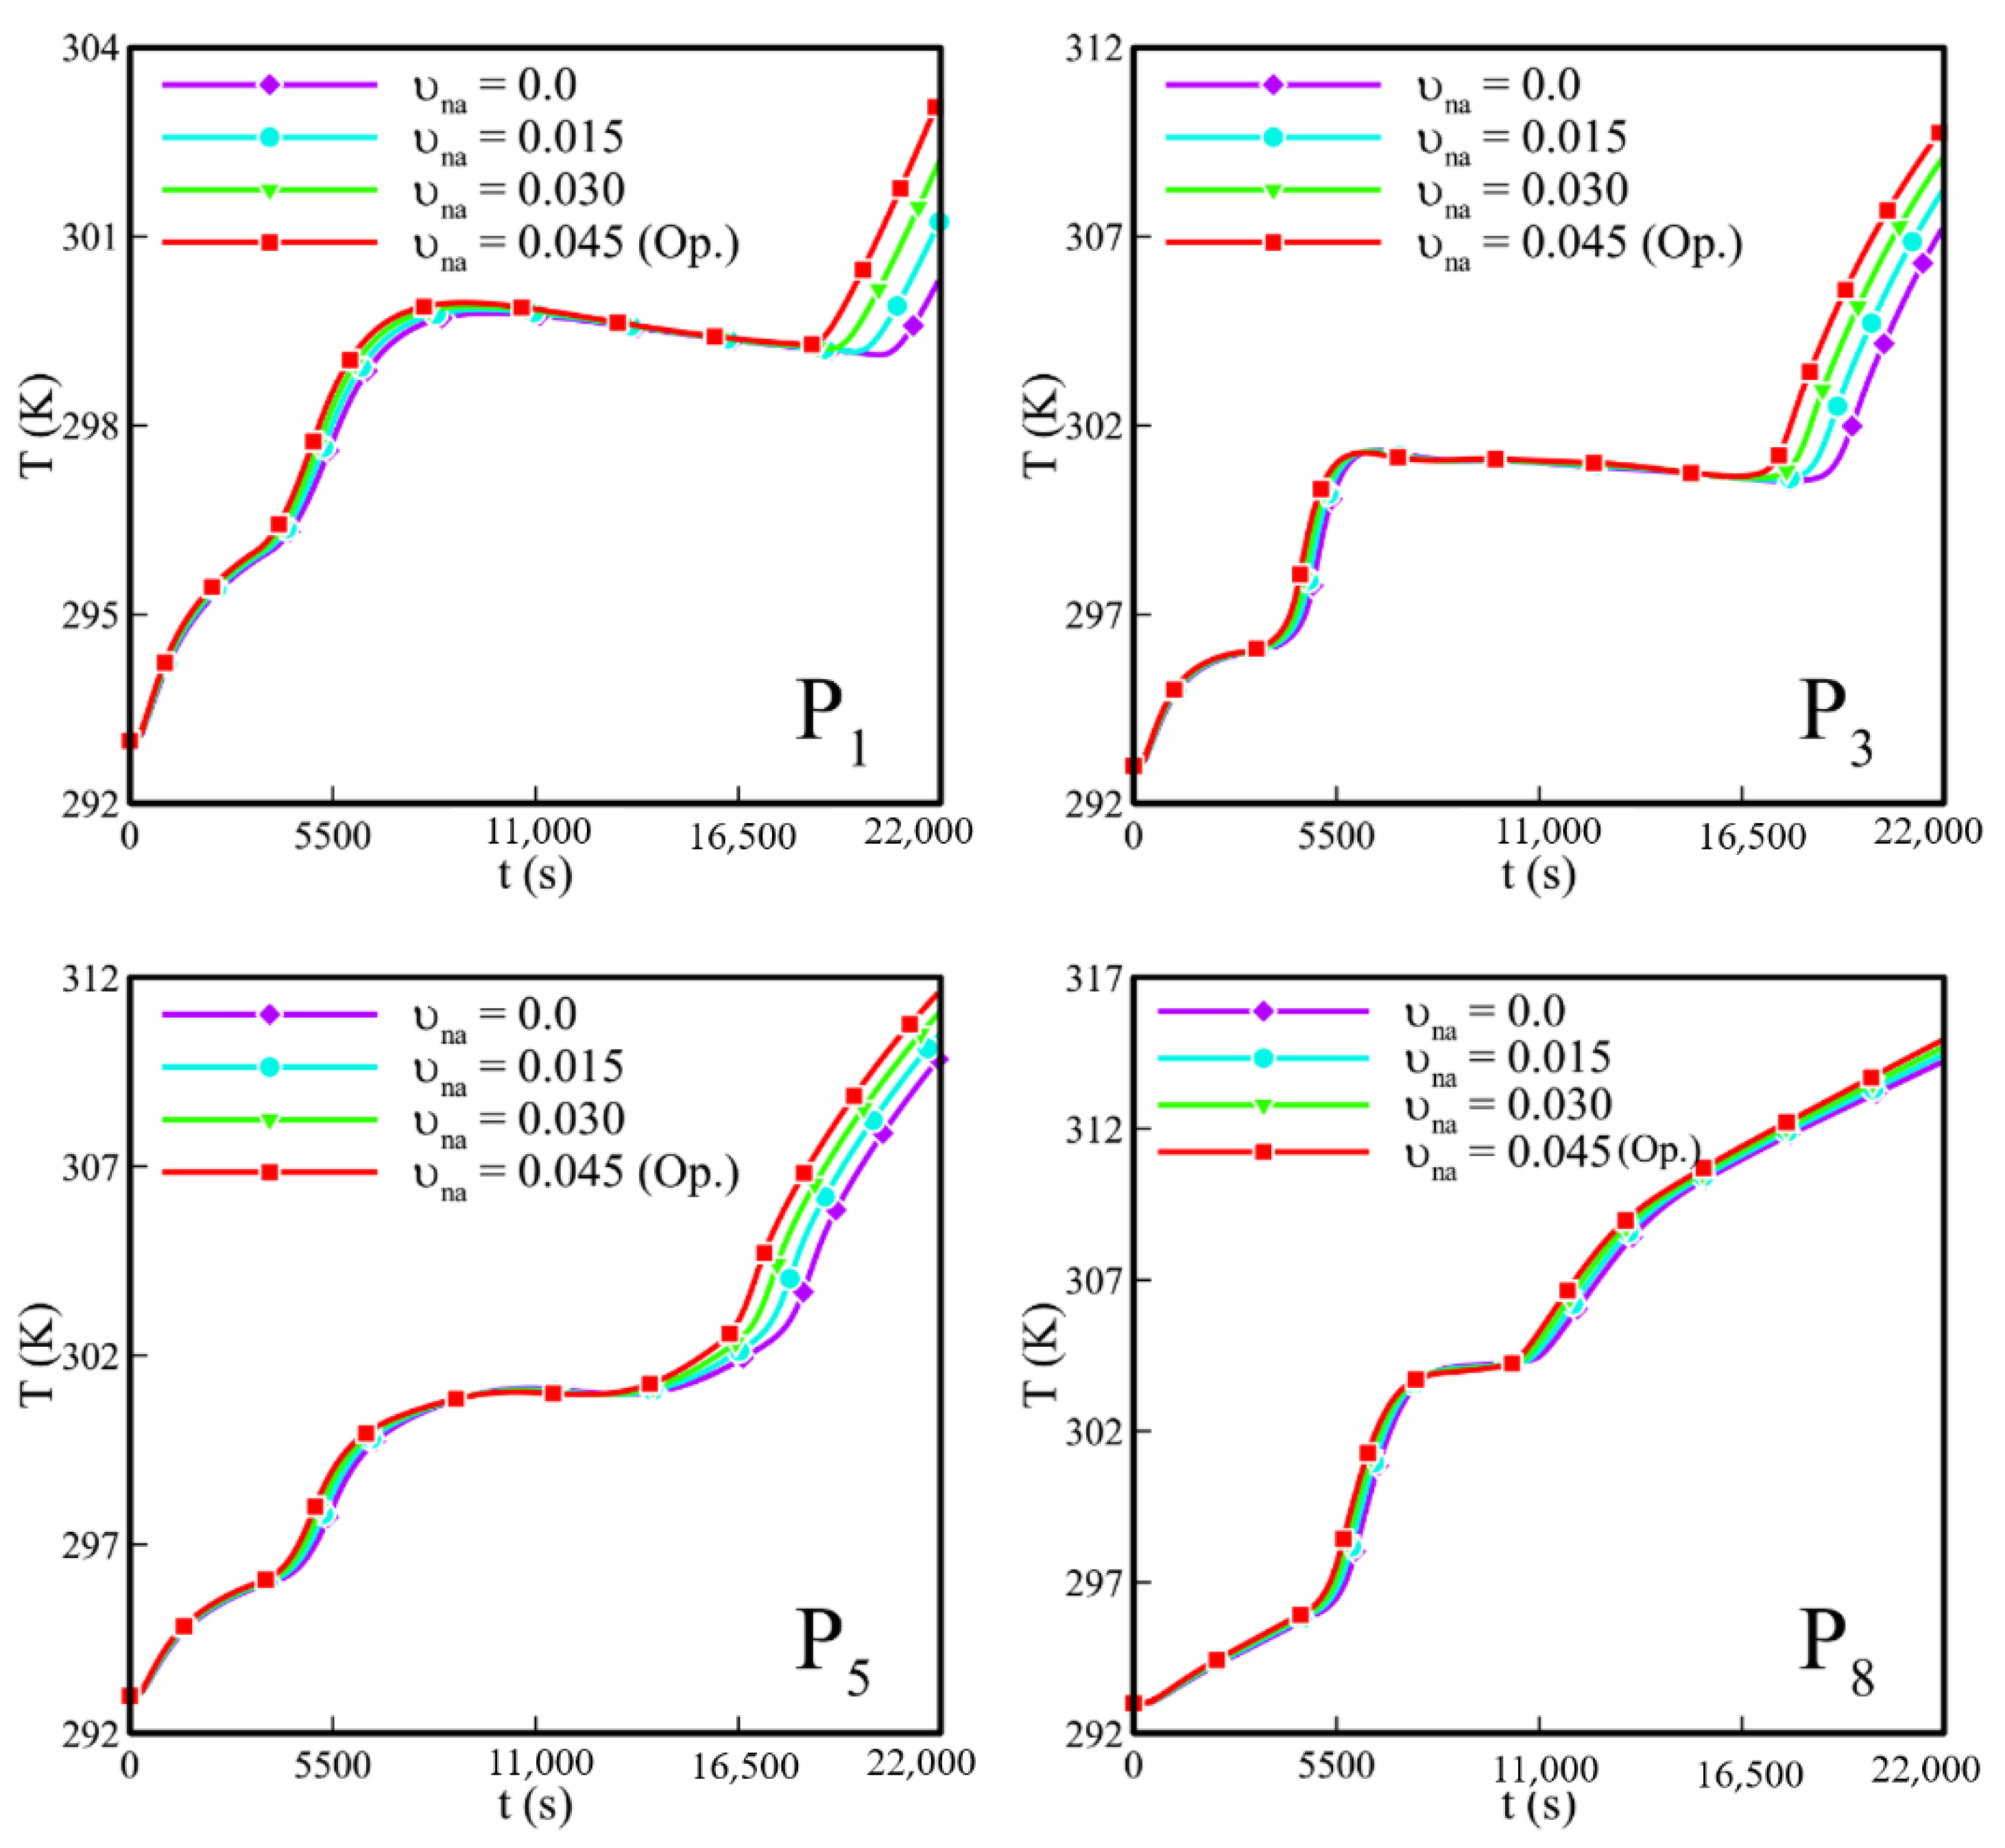
Figure 10 displays the temperature evolution of monitoring points in the enclosure during the melting process. This figure shows that there are three main stages for temperature evolution of monitor points. First, there is a semi-linear increase of temperature, which is related to the pure conduction regime in the supper cold PCM. Then, there is a semi-flattened temperature change in which the temperature stays constant at a temperature about the fusion temperature. This is where the phase change occurs, and the energy melts the PCM instead of raising its temperature. After this stage, there is a semi-linear increase of temperature, which corresponds to the temperature variation in the molten PCM and in the presence of natural convection effects.
Figure 10 shows the impact of variation of Cu nanoparticles on the temperature profiles. As seen, at the first stage, which is pure conduction, the increase of nanoparticle concentration slightly increases the temperature of monitor points. The presence of the nanoparticles increases the thermal conductivity of the NePCM, and thus the heat could be more easily transfer from the HTF tube inside the PCM. Thus, at a constant time, the temperature of the monitor points is higher for a larger volume fraction of nanoparticles. The presence of nanoparticles does not change the magnitude of the second part (the melting part) of the profiles since the fusion temperature does not change. However, the increase of concentration of nanoparticles accelerates the beginning of the third stage (heat transfer in molten PCM). Two reasons could contribute positively to this observation. First, an increase in nanoparticles concentration improves the heat transfer rate, and thus the melting finishes faster. The second reason is the fact that the presence of nanoparticles slightly reduces the latent heat of phase change, which consequently leads to a faster phase change.
Figure 11 shows the temperature uniformity index (
σ) in the PCM region during the phase change for various concentrations of nanoparticles. The increase of concentration of nanoparticles induces minimal impact on the temperature uniformity of TES in the early stages of melting. Indeed, in
Figure 10, it was observed that the variation of nanoparticle concentration slightly changes the temperature profiles in the solid PCM and during the melting stage. Thus, this observation is in agreement with
Figure 9. There is a notable difference in the temperature uniformity of TES at the final stage of melting. This is because at the end of the melting process, where there is no or minimal solid PCM remaining, the overall temperature of the enclosure tends to the temperature of HTF fluid. The full charging occurs faster for a high concentration of nanoparticles, and thus, σ also drops quickly.
Figure 12 shows the isotherm contours of the TES unit for various aspect ratios (
AR). When the
AR is smaller than unity, the bottom fins are short, and the top fins are long. In the case of
AR = 1, the length of the fins is equal. For the case of
AR > 1, the bottom fins are longer than the top fins. The total mass of the fins is constant in all cases, and the only difference is the variation of the geometrical shape and arrangement.
Figure 12 shows the significant impact of
AR on the temperature distribution in the enclosure.
Figure 13 illustrates the melting contours and streamlines in the enclosure for various aspect ratios. When
AR = 0.1, it is clear that the melting advances to the right from the top, where the fins have the highest length. Thus, the top region is fully melted at the final stage of melting while the bottom region is at a solid-state. The hot molten PCM moves toward the top, where there is no PCM to be melted. However, when
AR = 1.45, the long bottom fins melt a significant amount of PCM at the bottom. Then, the natural convection heat transfer occurs. The hot molten PCM moves toward the top region where there is plenty of cold PCM and contributes to the melting of the top regions of the enclosure where the fins were short. Thus, the natural convection notably aids the melting of PCM in the case of
AR = 1.45.
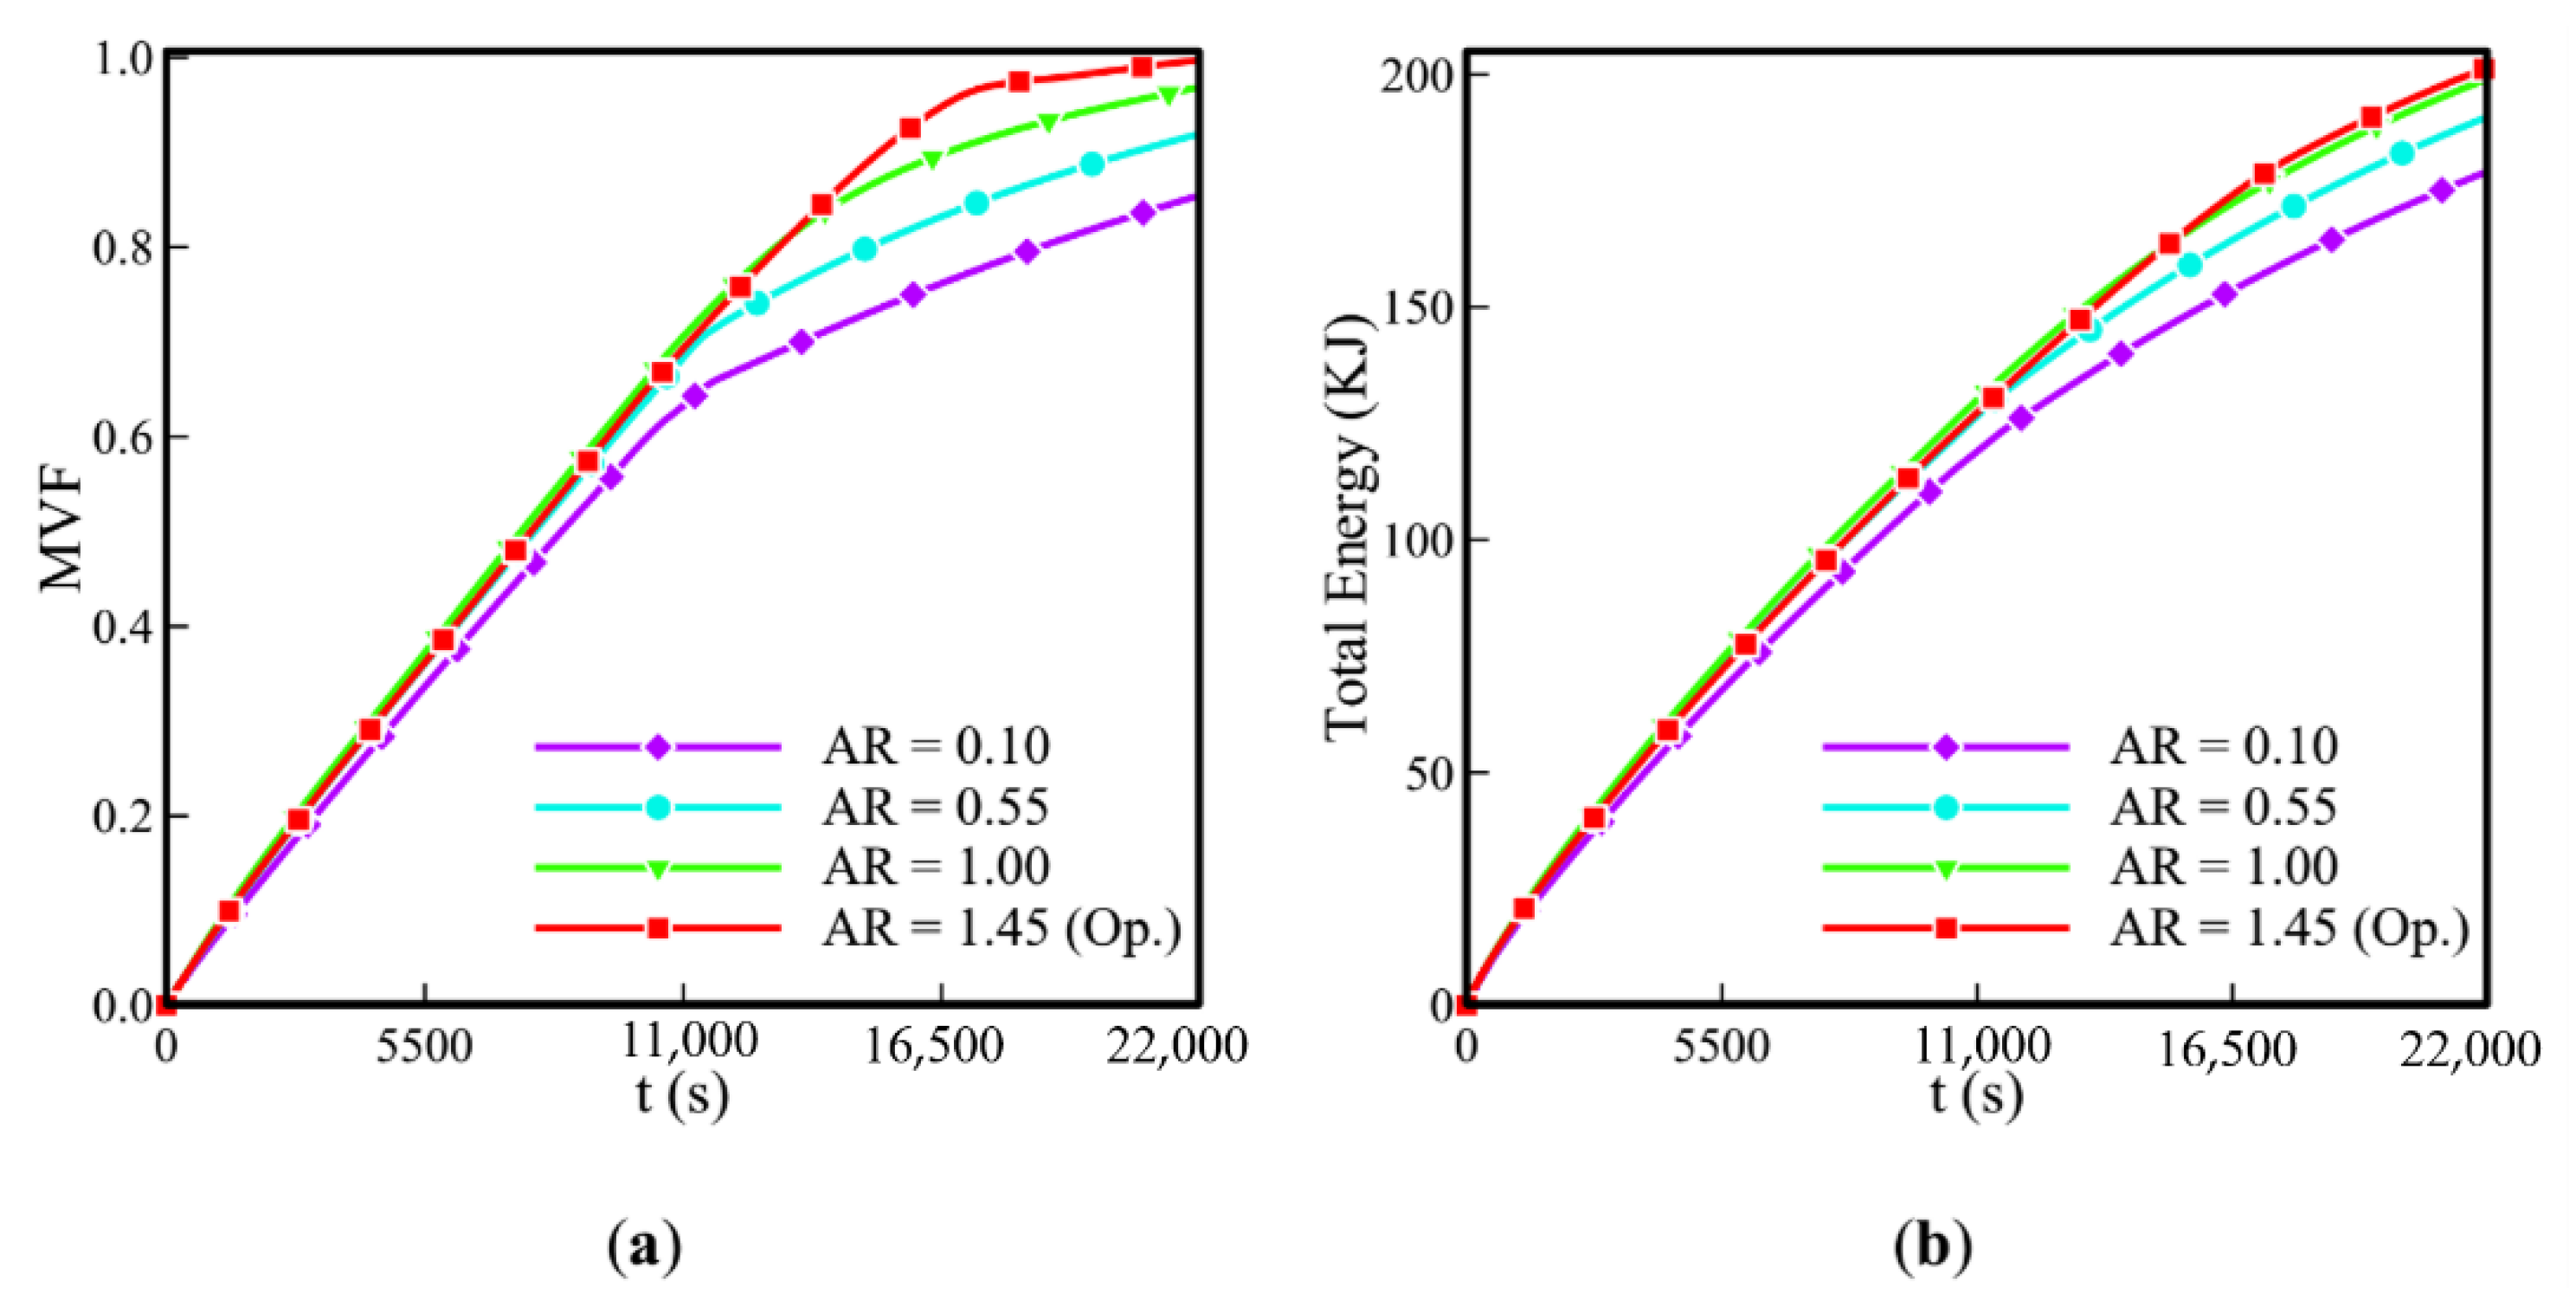
Figure 14 illustrates the melting profiles and stored energy for various values of
AR. As seen, the increase in
AR increases both MVF and stored energy. The depicted melting behavior of
Figure 13 confirms the behavior of this figure very well. Since the concentration of nanoparticles is fixed as
υna = 0.045, the increase of MVF could directly increase the total stored energy. These could be slight fluctuations that are due to the sensible part of stored energy, and their impact on toral stored energy is minimal.
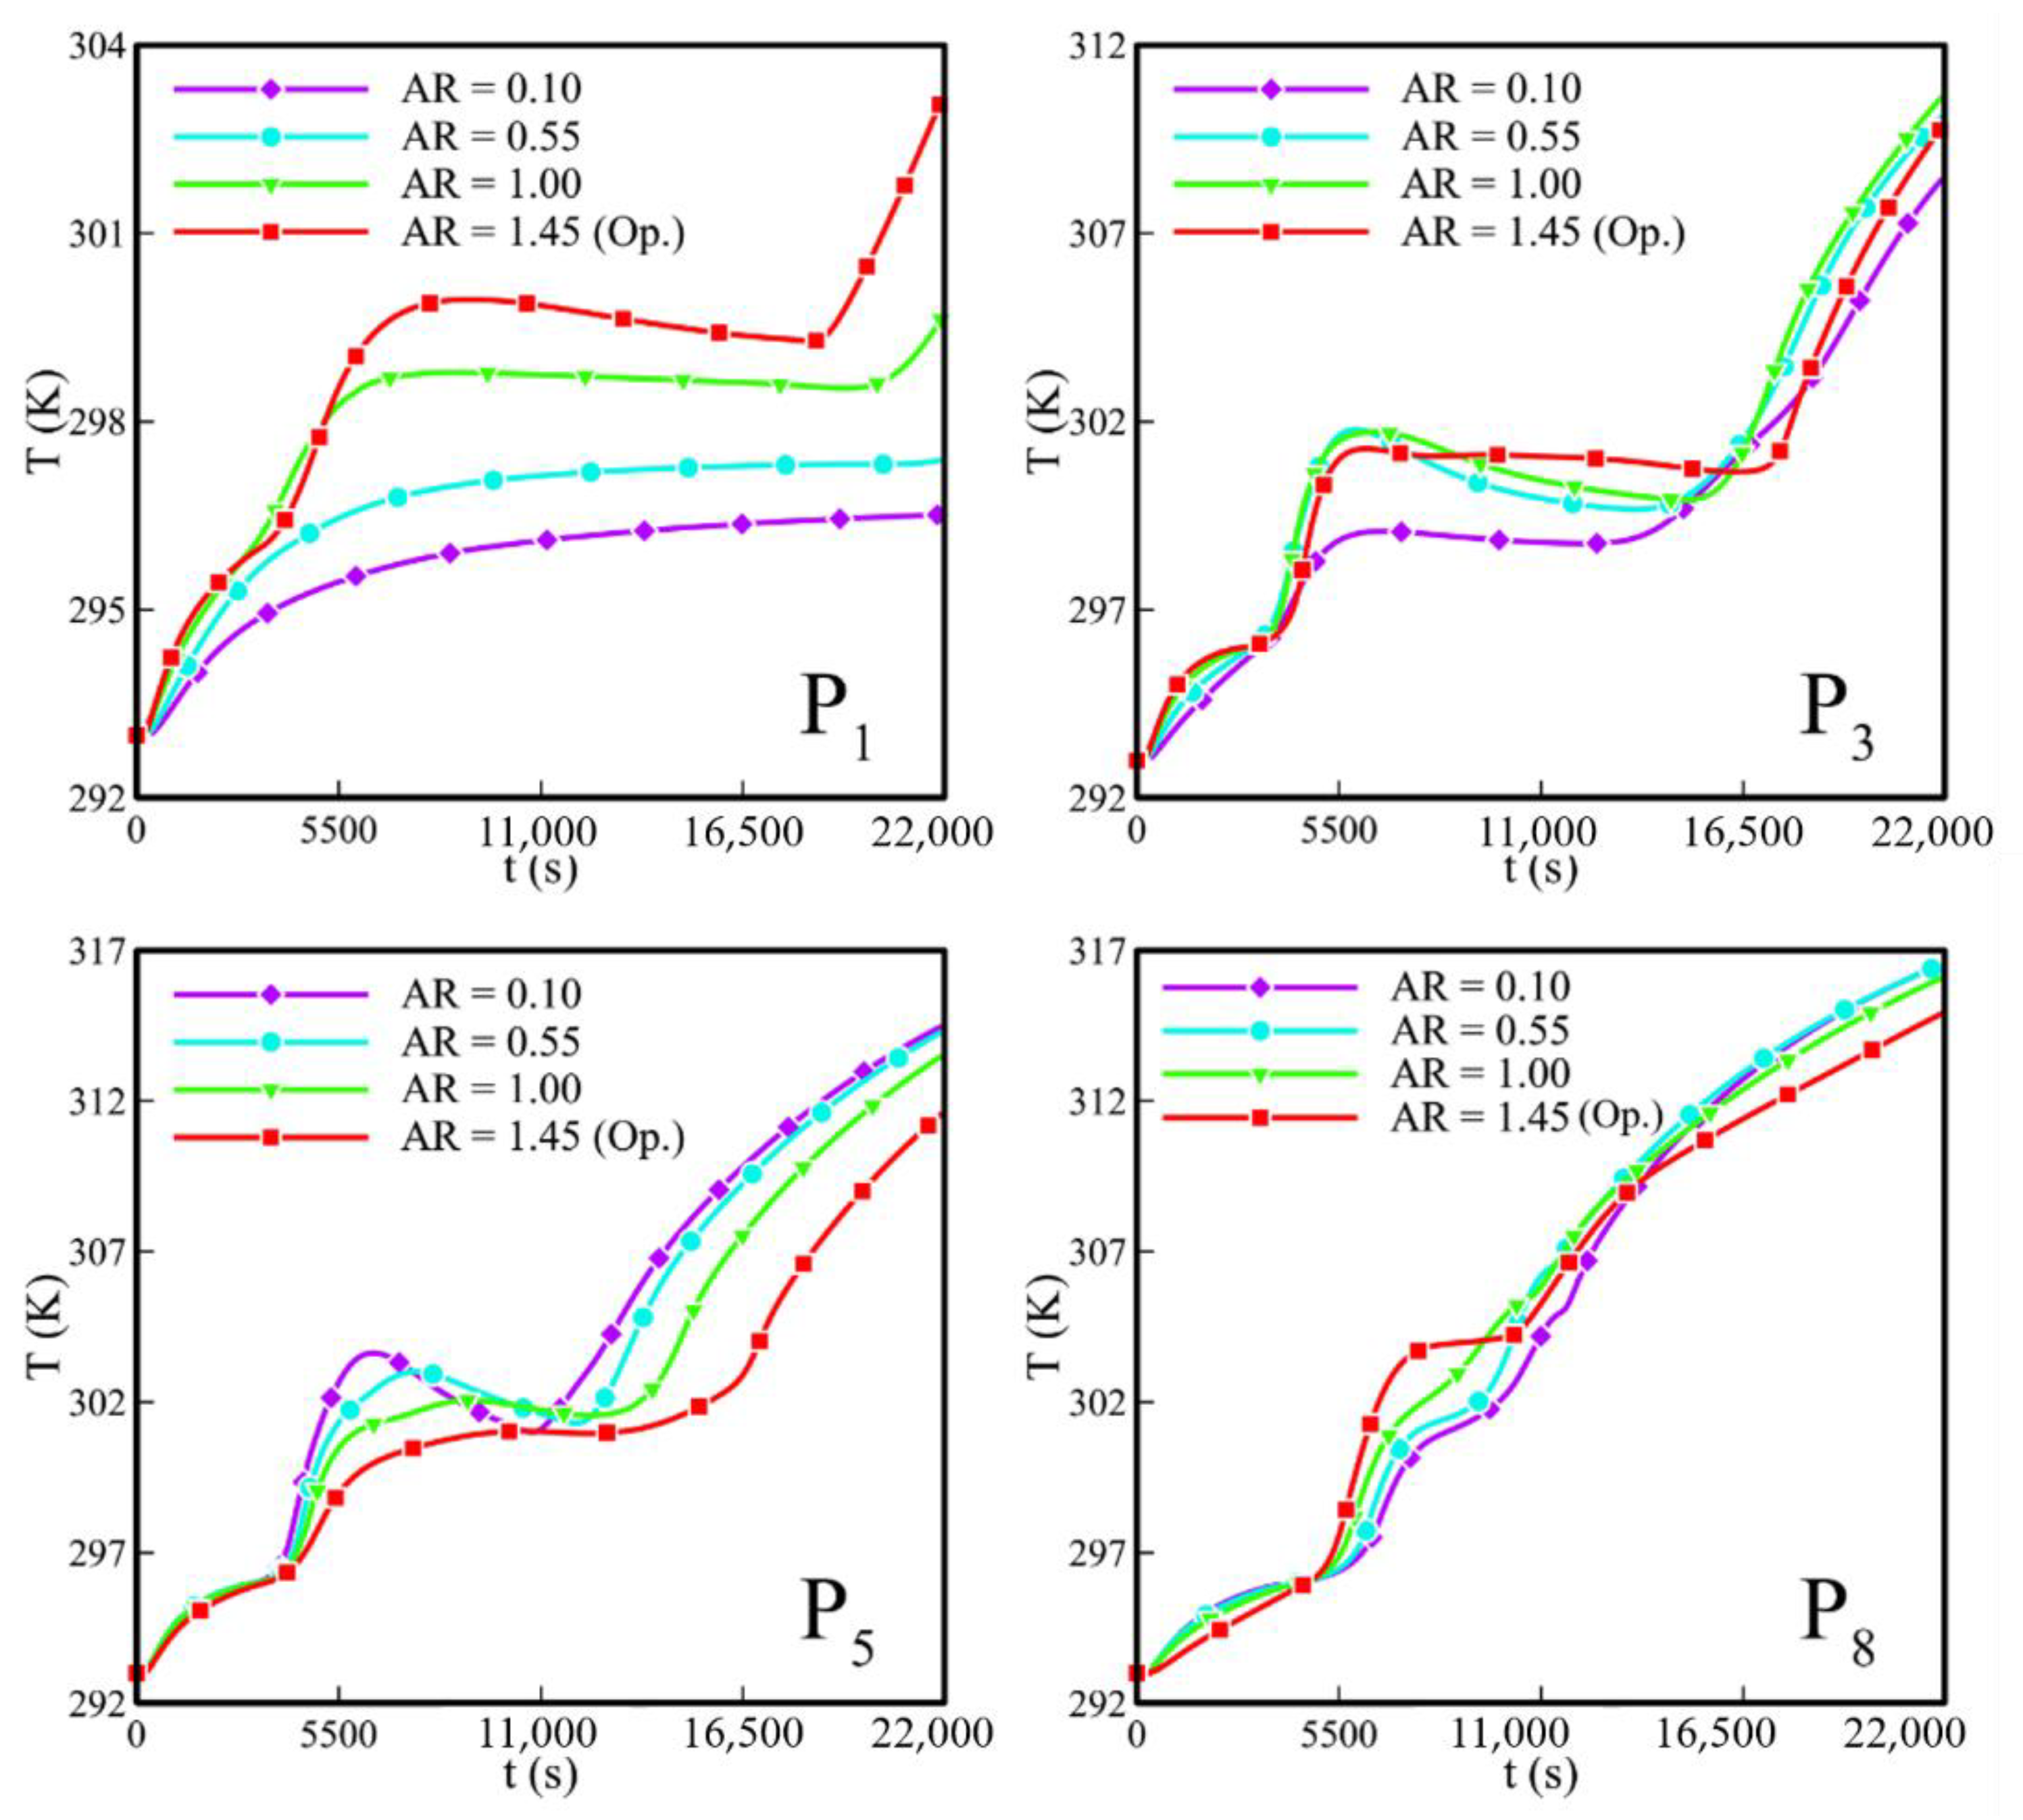
Figure 15 shows the temperature profiles of monitor points for various values of
AR. The bottom point is under significant influence of
AR, since the bottom is a conduction-dominant region, and the variation of the length of the fins directly affects the conduction heat transfer in this part of the enclosure. The temperature history of P3 shows that the melting behavior of this point is almost independent of
AR. This is because the variation of changes in the fin’s lengths next to this point is minimal. The temperature of P5 in the liquid region is the lowest for case
AR = 1.45 because the melting rate for this case is maximum, and the transferred energy from the HTF fluid mostly consumes by the latent heat. P8 shows a smooth transition between stages since this point is at the top, and regardless of the length of the fins, there is a slight natural convection effect at this point, and the PCM will melt quickly.
Figure 16 displays the temperature non-uniformity (
σ) for various values of
AR. The variation of fins shape (
AR) induces minimal impact of σ at early times. This is because all PCM is solid at first, and the heat transfer is conduction dominant. Thus, the location of fins is not important in the general behavior of heat transfer. However, in the middle and final stages of charging, the natural convection flows occur, and the arrangement of fins lead to significant differences. At the final stage of charging, the TES unit with
AR = 1.45 charges faster, and thus, the temperature of molten PCM quickly approaches the HTF temperature, and
σ drops quickly.


 ,
, 


