Article

Research on Evaluation Method of Freight Transportation Environmental Sustainability

School of Traffic and Transportation, Beijing Jiaotong University, Beijing 100044, China
*
Authors to whom correspondence should be addressed.
Sustainability 2021, 13(5), 2913; https://doi.org/10.3390/su13052913
Submission received: 30 January 2021 / Revised: 1 March 2021 / Accepted: 1 March 2021 / Published: 8 March 2021
(This article belongs to the Section Environmental Sustainability and Applications)

Abstract

:
As an important part of daily economic activities, freight transportation produces various pollutions during the transportation process, which will have a negative effect on the sustainable development of the environment. In this paper, the entropy weight technique for order of preference by similarity to ideal solution (TOPSIS) combination method was used for specific calculations, in order to judge whether transportation is environmentally sustainable. On the basis of selecting and classifying several the important factors of freight transportation, the entropy weight method was used to calculate and analyze the data of inland river transportation over 8 recent years. The weight of each influencing factor was determined, then the TOPSIS method was used to compare the environmental data of 8 years, and the environmental sustainability of the target river transport section was calculated by comparing the results. The method proposed in this paper is the first example of using the entropy weight–TOPSIS combination method to evaluate environmental sustainability in the field of freight transportation, also solving the problems of the impact of subjective factors in existing methods and the difficulty of dealing with multiple factors.

1. Introduction

Climate change is a global issue of general concern to the international community. In recent years, the impact of global climate change has become increasingly apparent. Joint response to climate change and joint promotion of green and low-carbon development have become mainstream in the world today. The transportation industry is a field with serious pollution emissions, and the environmental sustainability of transportation is an important foundation for ecological sustainability. The sustainable development of freight transportation has basic, leading, and service characteristics in global sustainable development. Therefore, research on the environmental sustainability of freight transportation is of great significance in the transportation field. Furthermore, it is also indispensable for global sustainability. In order to conduct an objective and quantitative analysis of the sustainability of freight transportation, and provide a basis for the choice of transportation methods and the formulation of transportation policies. The environmental sustainability of freight transportation was researched in this paper.
As an important part of freight transportation, inland water transportation discharges a large number of pollutants into the atmosphere during transportation. This paper uses inland water transportation as an example to verify the proposed sustainability evaluation method. Firstly, the freight volume, turnover volume of the freight, carbon oxides emissions, hydrocarbons emissions, nitrogen oxides emissions, and particulate matter emissions of the river transport segment are selected as consideration factors. Secondly, the entropy method is used to determine the weight of each factor, and the technique for order of preference by similarity to ideal solution (TOPSIS) method is used to determine the environmental sustainability of each year based on the weight of the factors. Finally, an analysis of the sustainable development of this river transport segment is carried out. In the research of this article, authors determine the weight of each factor in the sustainability of freight transportation, and provides a method for judging freight transportation sustainability, which provides research ideas for future related evaluations.

2. Literature Review

In the field of environmental sustainability research on transportation, some scholars have conducted research on the impact of the use of biofuels in transportation on environmental sustainability [1]. The socially sustainable development of the freight system was under research [2]. An indicator-based algorithm to measure transportation sustainability was proposed by American researchers [3]. Scholars found a positive reciprocal influence between event sustainability and sustainable transportation [4]. Some research paid attention to developing the life cycle sustainability assessment methodology for fossil transportation fuels [5]. There were scholars who tried to explore the use of bioenergy in transportation [6]. An Indian researcher proposed a framework for freight transportation social sustainability. The importance weight of the indicators are computed with a novel multi-criteria decision-making (MCDM) method-fuzzy best–worst method (FBWM) [7]. The scholars from Poland carried out a series of computational experiments with the application of selected a MCDM ranking method to solve a joint decision problem of selecting a supplier and designing the supply chain/logistic corridor [8]. The conclusion can be given that there are many and mature researches on evaluation indicators in the transportation field. Additionally, the research methods and ideas can be used as references for our article.
At present, scholars from various countries have a lot of research on the use of the entropy weight method. In recent years, its application fields and scenarios have become wider, and it has been widely used in fields such as agriculture, industry, the economy, computers, energy, transportation, and others. Among those, researchers have used the entropy weight method to study a series of environmental issues, mainly focusing on many evaluations, such as the impact of floods [9,10,11], the water quality of groundwater and surface water [12,13], the impact of environmental pollution, the vulnerability of building landslides [14], the impact of climate disasters [15], and the analysis of the interaction between population and environment [16]. The entropy weight method also had many applied types of research in economics. In recent years, the research were mainly focused on the selection of suppliers and order distribution [17], enterprise product quality evaluation [18], soft power analysis [19], community sustainability assessments of public rental housing [20], user behavior analysis [21], social development analysis [22], and social impact evaluation [23]. In the research of energy and related fields, scholars used the entropy weight method to optimize the design of the hybrid energy system [24], comprehensively evaluate power grid planning [25], evaluate park energy utilization [26], a comprehensive risk assessment of electricity [27], calculation of petroleum standard indicators [28], and in a diesel engine emission evaluation [29]. In traffic and transportation, scholars have used the entropy weight method to evaluate the transportation of dangerous goods [30], and analyze road traffic conditions [31]. In other practical application fields, scholars also used the entropy weight method to determine weight coefficients in ionospheric combination prediction [32], construction project management evaluation [33], decision support for heavy machine re-manufacturing [34], and so on. There have been many studies on the entropy weight method itself, such as the study on Shannon entropy [35], the study on the combination of Analytical Hierarchy Process (AHP) and entropy weight method [36,37], the study on the combination of entropy weight method and fuzzy algorithm [38], and research on the combination of the ideal point method and entropy weight method [39,40]. At the same time, Kumar Raman et al. systematically reviewed and sorted the development process of the entropy weight method [41]. Gündoğdu et al. introduced a new hybrid model based on picture fuzzy sets and linear assignment and its first real-world application on a public transport development problem [42]. Moslem and Çelikbilek proposed an integrated grey AHP and grey Multi Objective Optimization Method by Ratio Analysis (MOORA) model in their study to evaluate the public transport service quality [43], and the researchers also have several papers related to BWM in the transportation field [44,45,46].
In the application of the TOPSIS method, many scholars have used it in the research of logistical supply chains, such as logistic center location [47], supplier selection [48], supply chain risk management [49], and research on logistics solutions and budget issues [50,51]. In the research of management, the TOPSIS method is often used, such as the analysis of corporate driving factors [52], the selection of device location [53], the selection of personnel [54], the selection of information technology solutions [55], and the problem of location selection [56]. The main research achievements in the environment are earthquake disaster analysis [57], environmental indicator evaluation [58], solid waste management [59], and drought assessment [60]. In recent years, the improvement of the TOPSIS method has progressed. Yoon introduced the behavioral tendency of decision-makers to improve the TOPSIS method [61]. Akram explored the application of the TOPSIS method in group decision making [62], Zhang introduced grey relational analysis [63], Hanif introduced the Case Based Reasoning (CBR) method [64], and Sangaiahde integrated fuzzy Decision Making Trial and Evaluation Laboratory (DEMATEL), TOPSIS, and Elimination Et Choix Traduisant la REaite (ELECTRE) methods [65]. Gündoğdu gave a comparative analysis with intuitionistic fuzzy TOPSIS (IF-TOPSIS) [66]. Sarkar researched an integrated approach consisting of AHP (analytical hierarchy process) and TOPSIS to solve MCDM problems with completely unknown weights of criteria [67].
This section introduces the current research status of the entropy weight method and the TOPSIS method. The entropy weight–TOPSIS method has not been combined and applied in research and practical applications of environmental sustainability of transportation, and this paper undertake an exploration and discussion of this.

3. Materials and Methods

3.1. Influence Factor Analysis

There are many types of attributes, including benefit attributes, cost attributes, and interval attributes. The benefit attribute has a positive influence on the result, the cost attribute has a negative influence on the result, and the interval attribute can be accepted in a certain interval. The sustainable development of freight transportation includes its own sustainable development and environmental sustainability. The pollution factors are the factors that characterize the environmental sustainability of transportation. Besides the pollution factors, in order to take into account the sustainability of other freight transportation aspects, the development of freight volume and turnover volume of freight are the representations of other freight transportation sustainability characteristics, that two factors are sustainable if other transportation aspects are sustainable.
From the perspective of sustainable development, the smaller the emission of various pollution factors, the better. In practice, under the influence of various factors, each pollutant emission cannot reach their minimums at the same time. Therefore, each influence factor needs to be weighed separately in order to obtain a reasonable and practical comprehensive environmental sustainability level in the calculation results.
(1)
Freight volume
Freight volume is an important indicator to measure the transportation capacity of a transport segment, reflecting the transportation capacity of the target transport segment. It is an important factor used to measure the development level of the transport segment. The larger the freight volume, the greater the capacity of the transport segment. At the same time, this factor also reflects the freight demand of the transport segment and whether there is a stable source of demand for freight transportation. It is an important factor for judging whether the transport segment can develop sustainably. The larger the freight volume, the higher the sustainability of the transport segment, so it is defined as a benefit attribute. The freight volume is denoted as FV, the unit is 10 kilotons. The increase of freight volume will lead to an increase in the use of vehicles, thereby increasing the pollution emissions of vehicles.
(2)
Turnover volume of freight
The turnover volume of freight not only includes the number of transport cargos, but also includes the transport distance, so it can fully reflect the transport capacity. The two factors need to be evaluated comprehensively, in order to fully and correctly reflect the transportation situation and economic benefits. If the research emphasizes one of the factors while ignoring the other, it will cause one-sidedness. Generally speaking, if the transportation is reasonable and the quality meets the requirements, the greater the freight volume and the turnover volume, the greater the capability of transportation, so it is defined as a benefit attribute. The turnover volume of freight is denoted as TV, the unit is billion-tons-km. Increases in the turnover volume of the freight will lead to an increase in the use of vehicles, thereby increasing the pollution emissions of vehicles.
(3)
Carbon oxides emissions
Carbon oxides are colorless, odorless, toxic gases, and the largest emissions of air pollutants. Fossil fuel combustion, petroleum refining, steel smelting, and solid waste incineration all emit large amounts of carbon oxides. In the process of transportation, a large amount of carbon oxides emissions will be generated. Once the emission of carbon oxides gases exceeds the atmospheric standard, it will cause the greenhouse effect, increasing the global temperature, threatening human survival, and having a negative impact on the sustainability of environmental development. Carbon oxides emissions is defined as a cost attribute and it is denoted as CO, the unit is tons.
(4)
Hydrocarbon emissions
In the process of transportation, incomplete combustion of hydrocarbon compounds will be produced. In the combustion chamber of vehicles, there are some fuel vapors that have not been ignited, which are discharged into the atmosphere along with the exhaust gas (or gasoline vapor leakage from other parts of the engine, such as a gasoline tank vapor leakage, etc.). Among them, aldehydes (such as formaldehyde) and polycyclic aromatic hydrocarbons are harmful to the human body. Hydrocarbons and nitrogen oxides undergo photochemical reactions under sunlight and have a negative impact on the sustainability of environmental development. Hydrocarbon emissions is defined as a cost attribute and is denoted as HC, the unit is tons.
(5)
Nitrogen oxides emissions
Nitrogen oxides refer to compounds composed of only two elements: nitrogen and oxygen, including a variety of compounds such as nitrous oxide (N2O), nitric oxide (NO), nitrogen dioxide (NO2), nitrous oxide (N2O3), dinitrogen tetroxide (N2O4), and dinitrogen pentoxide (N2O5), and are mostly produced by the combustion of fossil fuels in transportation. Nitrogen oxides in the atmosphere easily react with oxygen in the air to produce NO2, so nitrogen oxides in the atmosphere generally exist in the form of NO2. When the temperature is high or there are clouds and fog, NO2 further interacts with water molecules to form the second most important acid in acid rain, nitric acid (HNO3). Nitrogen oxides emissions is defined as a cost attribute and is denoted as NO, the unit is tons.
(6)
Particulate matter emissions
Particulate matter emissions are generally caused by the combustion of energy and the dust of the cargo during transportation. Due to the long residence time and long transportation distance of particulate matter in the atmosphere, it has a great impact on human health and the quality of the atmospheric environment. It has a negative impact on the development of environmental sustainability and human health. Particulate matter emissions is defined as a cost attribute and it is denoted as PM, the unit is tons.
Based on the actual statistical data, this paper selects Chongqing, China, 8 years before the outbreak of COVID-19 as the research object to eliminate the influence of external factors on freight transportation. The freight volume, turnover volume of freight, carbon oxides emissions, hydrocarbons emissions, nitrogen oxides emissions, and particulate matter emissions of the river transport segment are selected as consideration factors. The attribute values of 2012–2019 are shown in Table 1.

3.2. Standardize

First, the data are standardized and non-quantitatively toughened, and the sustainability factor measured by data is scaled to make it fall into a small specific interval. To remove the unit restriction of the data, the original data is transformed into a dimensionless value, so that the factors of different units can be compared and weighed. The original data matrix is set as:
Y = ( 7771.34 968.4 47.452 17.431 237.258 8.716 9660 1219.27 59.744 21.947 298.721 10.973 11 , 762.04 1557.67 76.326 28.038 381.629 14.019 12 , 874 1739.95 85.258 31.319 426.288 15.66 14 , 360 1982.91 97.163 35.692 485.813 17.846 14 , 117 1631.33 79.935 29.364 399.676 14.682 15 , 039.6 1700.08 83.304 30.601 416.52 15.301 11 , 649 1876.1 91.929 33.77 459.645 16.885 )
In this paper, the Z-score method is used to standardize the original data, and the conversion formula of the Z-score method standardization is shown as follows:
z = y y ¯ σ
where y indicates the original data, y ¯ indicates the mean value of the original data, σ indicates the standard deviation of the original data, z indicates the standardized value of the original data.
After the standardized calculation, descriptive statistics of the original data are shown in Table 2.
After standardization, each data retains two decimal places, and the matrix is recorded as:
Z = ( z i j ) 8 × 6 = ( 0.00 0.00 0.00 0.00 0.00 0.00 0.26 0.25 0.25 0.25 0.25 0.25 0.55 0.58 0.58 0.58 0.58 0.58 0.70 0.76 0.76 0.76 0.76 0.76 0.91 1.00 1.00 1.00 1.00 1.00 0.87 0.65 0.65 0.65 0.65 0.65 1.00 0.72 0.72 0.72 0.72 0.72 0.53 0.89 0.89 0.89 0.89 0.89 )

3.3. Determining the Weight of Influencing Factors

In this paper, the entropy weight method is used to determine the weight of each influencing factor. According to the explanation of the basic principles of information theory, information is a measure of system order, and entropy is a measure of system disorder. According to the definition of information entropy, for a certain item factor, the entropy value can be used to measure the degree of a certain factor’s discreteness. The smaller the information entropy value of the factor, the greater the degree of the factor’s discreteness, the greater impact of the factor on the comprehensive evaluation (i.e., weight), if the value of a factor is all equal, the factor does not play a role in the comprehensive evaluation. Therefore, the tool of information entropy can be used to calculate the weight of each factor and provide a basis for a comprehensive evaluation of multiple factors.
Based on standardized data, a factor data matrix is constructed based on the information entropy of sustainability factor data. Set the information entropy of each factor to E j , and the calculation formula is:
E j = 1 ln n i = 1 n p i j ln p i j
p i j = z i j i = 1 n z i j
where n indicates the number of years, and in this paper, it is 8. If p i j = 0 , then defined lim p i j 0 p i j ln p i j = 0 . According to the calculation formula of information entropy, the information entropy of six factors is calculated as E 1 , E 2 , E 3 , E 4 , E 5 , E 6 . Based on the information entropy, calculate the weights of six factors as:
W i = 1 E i 6 E i , i = 1 , , 6
The result of the calculation is shown in Table 3.

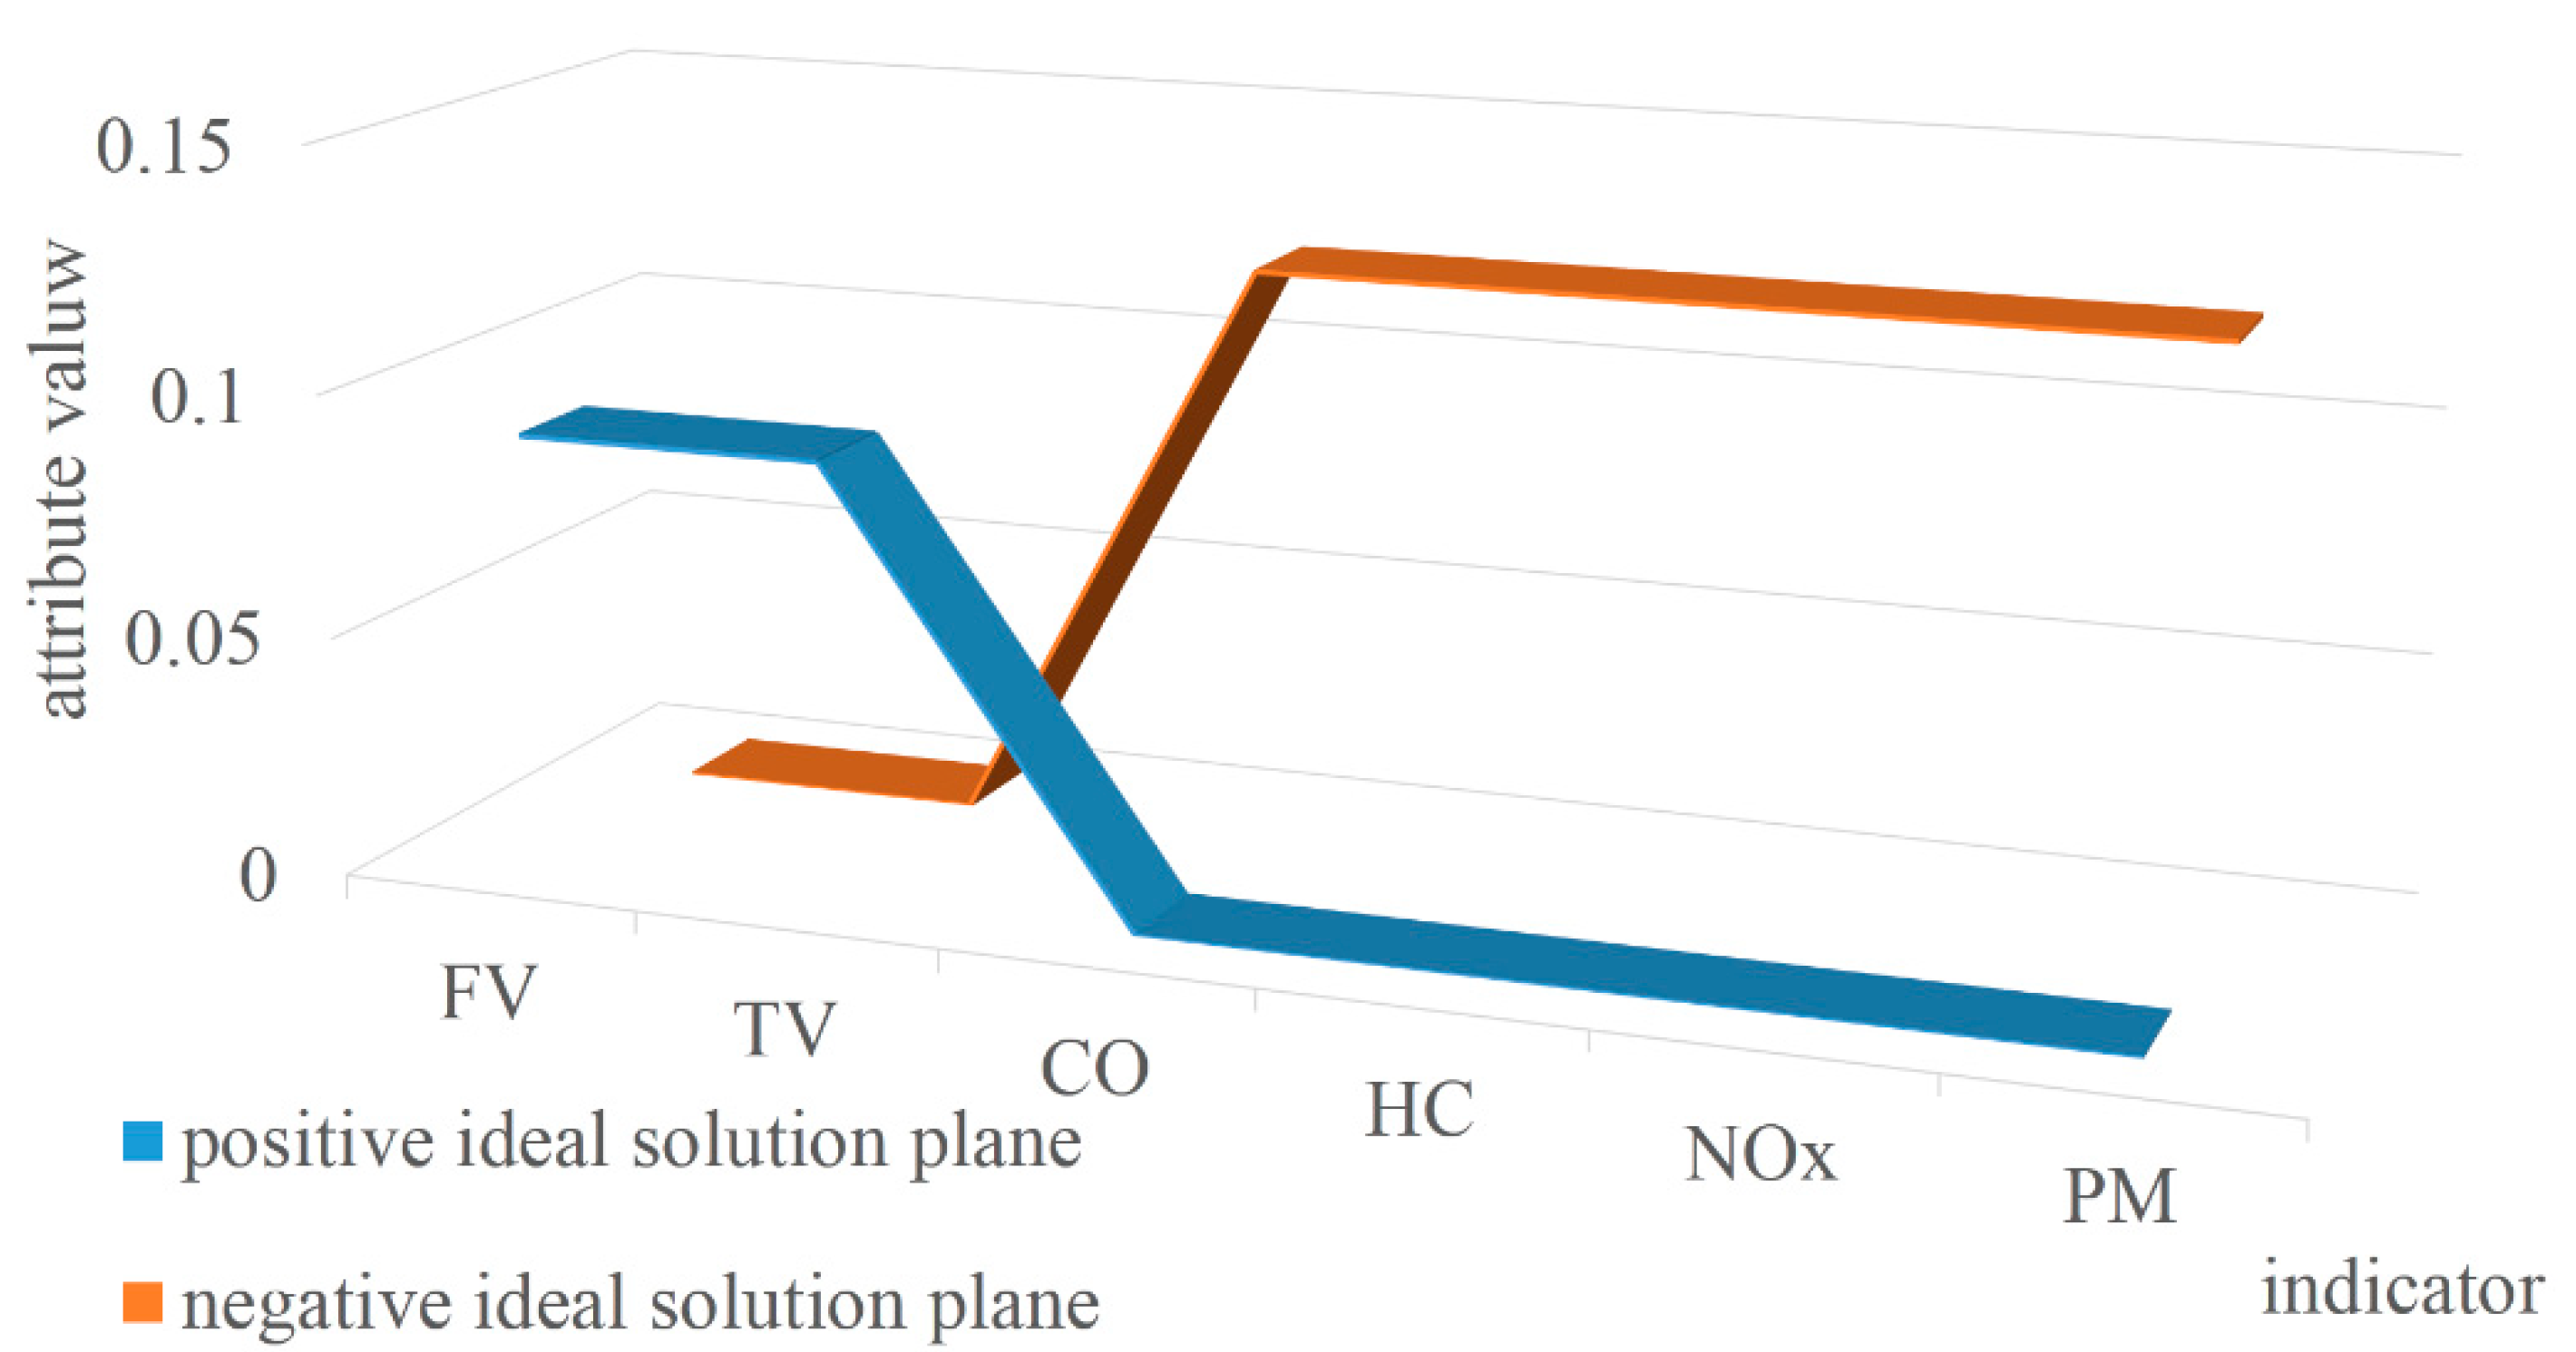
4. TOPSIS Application and Results

4.1. Step 1

The same trend processing can make any scheme with the better standardized attribute value have a larger attribute value after processing.
Normalize benefit attributes and cost attributes are established in a corresponding matrix. Convert the values in the table to the interval [0, 1].
The standardized decision matrix is recorded as: Z = ( z i j ) 8 × 6 .
The transformed decision matrix is recorded as: A = ( a i j ) 8 × 6 .
Set z j max as the maximum value in j column of the decision matrix, and z j min as the minimum value in j column of the decision matrix.
If z j is a benefit attribute, then:
a i j = z i j z j min z j max z j min
In this paper, freight volume and turnover volume of freight transport are benefit attributes.
If z j is a cost attribute, then:
a i j = z j max z i j z j max z j min
In this paper, the emissions of CO, HC, NOx, and PM are cost attributes.
Although this paper does not involve interval attributes, for completeness of theoretical system, supplementary explanations on interval attributes are provided.
If there are interval attributes, set the optimal attribute interval be [ z j 0 , z j d ] , z j u is the intolerable lower bound, and z j v is the intolerable upper bound, then:
a i j = { 1 ( z j 0 z i j ) z j 0 z j u , z j u z i j z j 0 1 , z j 0 z i j z j n 1 ( z i j z j d ) z j 0 z j u , z j d z i j z j v 0 , o t h e r s
The worst attribute value after transformation is 0, and the best attribute value is 1. After the same trend processing, each data retains two decimal places, and the matrix is recorded as:
A = ( 0 0 1 1 1 1 0.26 0.25 0.75 0.75 0.75 0.75 0.55 0.58 0.42 0.42 0.42 0.42 0.7 0.76 0.24 0.24 0.24 0.24 0.91 1 0 0 0 0 0.87 0.65 0.35 0.35 0.35 0.35 1 0.72 0.28 0.28 0.28 0.28 0.53 0.89 0.11 0.11 0.11 0.11 0 0 0 0 0 0 )

4.2. Step 2

Normalize the data matrix after the same trend processing and establish the corresponding matrix. The data is subjected to secondary standardization processing and set the matrix after secondary standardization processing as: X = ( x i j ) 8 × 6 .
In this matrix,
x i j = a i j i = 1 8 a i j 2 , j = 1 , , 6
Then, construct a weighted normalization matrix:
V = X W i = ( 0 0 0.12 0.12 0.12 0.12 0.02 0.02 0.09 0.09 0.09 0.09 0.05 0.05 0.05 0.05 0.05 0.05 0.06 0.07 0.03 0.03 0.03 0.03 0.08 0.09 0 0 0 0 0.08 0.06 0.04 0.04 0.04 0.04 0.09 0.06 0.03 0.03 0.03 0.03 0.05 0.08 0.01 0.01 0.01 0.01 )
After weighted normalization, the factor data characteristics of the 8 years are shown as Figure 1:

4.3. Step 3

Determine the positive and negative ideal solution.
V + = { ( max V i j j J + ) , ( min V i j j J ) } = ( V 1 + , V 2 + , , V 6 + ) = ( 0.09 , 0.09 , 0 , 0 , 0 , 0 )
V = { ( min V i j j J + ) , ( max V i j j J ) } = ( V 1 , V 2 , , V 6 ) = ( 0 , 0 , 0.12 , 0.12 , 0.12 , 0.12 )
where J + is the benefit attribute, and J is the cost attribute. The positive ideal solution plane and the negative ideal solution plane as shown in Figure 2 can be obtained.

4.4. Step 4

For all 8 years, the higher level of sustainability is closer to the positive ideal point plane and further away from the negative ideal point plane. The calculation method is:
S i + = j = 1 6 ( V i j V j + ) 2 , i = 1 , , 8
S i = j = 1 6 ( V i j V j ) 2 , i = 1 , , 8
where S i + indicates the distance between each comprehensive evaluation value and the positive ideal solution plane. S i indicates the distance between each comprehensive evaluation value and the negative ideal solution plane.
The calculated results are shown as Table 4:

4.5. Step 5

Calculate the relative proximity and make a judgment, the year with the higher relative proximity is the year with the higher sustainability level.
C i = S i S i + + S i , i = 1 , , 8
where C i indicates the relative proximity. The calculation result is: C 1 = 0 , C 2 = 0.24 , C 3 = 0.58 , C 4 = 0.74 , C 5 = 0.96 , C 6 = 0.69 , C 7 = 0.76 , C 8 = 0.84 . The result is shown in Figure 3.

5. Discussion

From the calculation results, it can be seen that in the 8 years from 2012 to 2019, the lowest sustainability level is in 2012 and the highest sustainability level is in 2016. The reason for the result of 2012 is that the main factors of freight volume and the turnover volume of freight are much lower than those of other years. Although this makes the pollution emission factors of 2012 very low, it is difficult to compensate for the impact of low volumes.
In 2016, various factors were relatively balanced. Due to the promotion of clean energy and other reasons, the pollution level was partially controlled while ensuring a steady increase in transportation volume that year.
The sustainability levels in 2017 and 2018 were not as high as in 2016 and 2019 because the relationship between freight volume and the turnover volume of freight in these two years have fluctuated greatly, which could be the impact of the adjustment of the transportation structure. In 2019, the sustainability level of the transportation and environment system of this segment gradually increased.
Measuring from the overall trend of the past 8 years, under the perspective of freight transportation and environmental friendliness, it can be concluded that sustainability is steadily improving and meeting the current needs of environmental protection and freight transportation.
With more widespread use of clean energy, and the government’s treatment of pollutant emissions from transportation vehicles, in the next few years the environmental sustainability level of transportation will further increase, and the corresponding trend can also be seen in the calculation results of this paper. However, due to the impact of COVID-19, freight demand after 2020 will drop significantly, and it will still take some time to return to the previous level. Therefore, if the method proposed in this paper is used to calculate the data after 2020, the sustainability level will have a negative impact.

6. Conclusions

Based on the entropy weight–TOPSIS method, this paper constructed a calculation method for measuring the environmental sustainability level of freight transportation, which is the first use of this method in the field of sustainability research in freight transportation. The entropy method was used to objectively weigh the six main factors that affect the sustainable development of freight transportation. Using actual data from the last 8 years of inland water transport along a segment of Chongqing for empirical observation and calculation, reasonable calculation results were obtained.
This method avoided the influence of subjective evaluations on the weighting of influence factors to a great extent. Furthermore, because the environmental sustainability of freight transportation problem is a multi-target plan, the accuracy and scientific evaluation of the results are guaranteed by introducing the TOPSIS method to distinguish the attributes of each factor. The research in this article will provide a reference for future research on the sustainability of freight transportation, from the perspective of environment and transportation mode selection.
The main contributions of this study can be summarized as follows:
  • It summarized the factors that need to be generally considered in the environmental sustainability of transportation.
  • It objectively weighed the influencing factors to reduce the decision deviation caused by external interference.
  • The TOPSIS method was introduced into the field of environmental sustainability of transportation for the first time, providing a new evaluation method.

Author Contributions

Conceptualization, D.H. and M.H.; data curation, D.H.; formal analysis, D.H.; funding acquisition, M.H.; validation, D.H.; writing—original draft, D.H. and M.H.; writing—review and editing, D.H. and M.H. All authors have read and agreed to the published version of the manuscript.

Funding

This research received no external funding.

Institutional Review Board Statement

Not applicable.

Informed Consent Statement

Not applicable.

Data Availability Statement

The data and analyses from the current study are available from the corresponding authors upon reasonable request.

Conflicts of Interest

The authors declare no conflict of interest.

References

  1. Chang, W.R.; Hwang, J.J.; Wu, W. Environmental impact and sustainability study on biofuels for transportation applications. Renew. Sustain. Energy Rev. 2017, 67, 277–288. [Google Scholar] [CrossRef]
  2. Kumar, A.; Anbanandam, R. Development of social sustainability index for freight transportation system. J. Clean. Prod. 2019, 210, 77–92. [Google Scholar] [CrossRef]
  3. Mahdinia, I.; Habibian, M.; Hatamzadeh, Y.; Gudmundssonb, H. An indicator-based algorithm to measure transportation sustainability: A case study of the US states. Ecol. Indic. 2018, 89, 738–754. [Google Scholar] [CrossRef]
  4. Chirieleison, C.; Montrone, A.; Scrucca, L. Event sustainability and sustainable transportation: A positive reciprocal influence. J. Sustain. Tour. 2020, 28, 240–262. [Google Scholar] [CrossRef]
  5. Ekener, E.; Hansson, J.; Larsson, A.; Peck, P. Developing Life Cycle Sustainability Assessment methodology by applying values-based sustainability weighting-Tested on biomass based and fossil transportation fuels. J. Clean. Prod. 2018, 181, 337–351. [Google Scholar] [CrossRef]
  6. Cavalett, O.; Norem, S.S.; Cherubini, F. Energy and environmental aspects of using eucalyptus from Brazil for energy and transportation services in Europe. Sustainability 2018, 10, 4068. [Google Scholar] [CrossRef] [Green Version]
  7. Kumar, A.; Ramesh, A. An MCDM framework for assessment of social sustainability indicators of the freight transport industry under uncertainty. A multi-company perspective. J. Enterp. Inf. Manag. 2020, 33, 1023–1058. [Google Scholar] [CrossRef]
  8. Alazzawi, A.; Żak, J. MCDM/A Based Design of Sustainable Logistics Corridors Combined with Suppliers Selection. The Case Study of Freight Movement to Iraq. Transp. Res. Proc. 2020, 47, 577–584. [Google Scholar] [CrossRef]
  9. Xu, H.; Ma, C.; Lian, J.; Xu, K.; Chaima, E. Urban flooding risk assessment based on an integrated k-means cluster algorithm and improved entropy weight method in the region of Haikou, China. J. Hydrol. 2018, 563, 975–986. [Google Scholar] [CrossRef]
  10. Gorgij, A.D.; Kisi, S.O.; Moghaddam, A.A.; Taghipour, A. Groundwater quality ranking for drinking purposes, using the entropy method and the spatial autocorrelation index. Environ. Earth Sci. 2017, 76, 269. [Google Scholar] [CrossRef]
  11. Morimoto, T. Spatial analysis of social vulnerability to floods based on the MOVE framework and information entropy method: Case study of Katsushika Ward, Tokyo. Sustainability 2019, 11, 529. [Google Scholar]
  12. Islam, A.; Ahmed, N.; Bodrud-Doza, M.; Chu, R. Characterizing groundwater quality ranks for drinking purposes in Sylhet district, Bangladesh, using entropy method, spatial autocorrelation index, and geostatistics. Environ. Sci. Pollut. R. 2017, 24, 26350–26374. [Google Scholar] [CrossRef] [PubMed]
  13. Sahoo, M.M.; Patra, K.C.; Swain, J.B.; Khatua, K.K. Evaluation of water quality with application of Bayes’ rule and entropy weight method. Eur. J. Environ. Civ. Eng. 2016, 21, 730–752. [Google Scholar] [CrossRef]
  14. Zhao, H.; Yao, L.; Mei, G.; Liu, T.; Ning, Y. A fuzzy comprehensive evaluation method based on AHP and entropy for a landslide susceptibility map. Entropy 2017, 19, 396. [Google Scholar] [CrossRef]
  15. Fang, R.; Shang, R.; Wang, Y.; Guo, X. Identification of vulnerable lines in power grids with wind power integration based on a weighted entropy analysis method. Int. J. Hydrog. Energy 2017, 42, 20269–20276. [Google Scholar] [CrossRef]
  16. Romero, I.; Delgado, A. Applying grey systems and shannon entropy to social impact assessment and environmental conflict analysis. Int J. Appl. Eng. Res. 2017, 12, 14327–14337. [Google Scholar]
  17. Feng, J.; Gong, Z. Integrated linguistic entropy weight method and multi-objective programming model for supplier selection and order allocation in a circular economy: A case study. J. Clean. Prod. 2020, 277, 122597. [Google Scholar] [CrossRef]
  18. Ren, Z. Evaluation Method of Port Enterprise Product Quality Based on Entropy Weight TOPSIS. J. Coast. Res. 2020, 103, 766–769. [Google Scholar] [CrossRef]
  19. Wang, B.; Liu, J. Comprehensive Evaluation and Analysis of Maritime Soft Power Based on the Entropy Weight Method (EWM). J. Phys. Conf. Ser. 2019, 1168, 032108. [Google Scholar] [CrossRef]
  20. Wu, G.; Duan, K.; Zuo, J.; Zhao, X.; Tang, D. Integrated sustainability assessment of public rental housing community based on a hybrid method of AHP-entropy weight and cloud model. Sustainability 2017, 9, 603. [Google Scholar]
  21. Gong, Y.; Chen, L. Trust Evaluation of User Behavior Based on Entropy Weight Method. In Proceedings of the 10th International Conference on Computer Engineering and Networks (CENet), Xi’an, China, 16–18 October 2020; pp. 670–675. [Google Scholar]
  22. Delgado, A.; Ayala, B.; Carbajal, C. An approach to analyses social development in South America by Shannon entropy theory. In Proceedings of the 2019 IEEE Chilean Conference on Electrical, Electronics Engineering, Information and Communication Technologies (CHILECON), Valparaiso, Chile, 13–27 November 2019; pp. 1–5. [Google Scholar]
  23. Delgado, A.; Carbajal, C.; Reyes, H.; Romero, I. Social Impact Assessment on a Mining Project in Peru Using the Grey Clustering Method and the Entropy-Weight Method. In Proceedings of the IEEE Colombian Conference on Applications in Computational Intelligence (ColCACI), Barranquilla, Colombia, 4–7 June 2019; pp. 116–128. [Google Scholar]
  24. Lu, J.; Wang, W.; Zhang, Y.; Cheng, S. Multi-objective optimal design of stand-alone hybrid energy system using entropy weight method based on HOMER. Energies 2017, 10, 1664. [Google Scholar] [CrossRef] [Green Version]
  25. Zhao, G.; Wang, D. Comprehensive evaluation of AC/DC hybrid microgrid planning based on analytic hierarchy process and entropy weight method. Appl. Sci. 2019, 9, 3843. [Google Scholar] [CrossRef] [Green Version]
  26. Zhou, S.; Tan, M.; Wang, X.; Yang, Y.-B. Comprehensive Effectiveness Evaluation Based on Entropy Weight Method for Energy Utilization Schemes of Smart Parks. In Proceedings of the International Conference on Electrical Engineering and Automation (EEA), Hong Kong, China, 24–26 June 2016; pp. 326–332. [Google Scholar]
  27. Liao, X.; Xue, M.; Mao, X.; Pan, Y.; Sun, G.; Wei, Z. Risk Assessment of Integrated Electricity—Heat Energy System with Cross Entropy and Objective Entropy Weight Method. In Proceedings of the 5th Asia Conference on Power and Electrical Engineering (ACPEE), Chengdu, China, 4–7 June 2020; pp. 94–99. [Google Scholar]
  28. Xu, T.; Qin, C.; Zhang, H.; Qu, Y.; Fang, W. Study on Petroleum Standard Attention Index Calculation based on the Entropy Weight Method. In Proceedings of the 4th International Symposium on Resource Exploration and Environmental Science (REES), Ordos, China, 25–26 April 2020; p. 514. [Google Scholar]
  29. Muqeem, M.; Sherwani, A.F.; Ahmad, M.; Khan, Z.A. Application of the Taguchi based entropy weighted TOPSIS method for optimisation of diesel engine performance and emission parameter. Int. J. Heavy Veh. Syst. 2018, 26, 69–94. [Google Scholar] [CrossRef]
  30. Huang, W.; Zhang, Y.; Yu, Y.; Xu, Y.; Xu, M.; Zhang, R.; De Dieu, G.J.; Yin, D.; Liu, Z. Historical data-driven risk assessment of railway dangerous goods transportation system: Comparisons between Entropy Weight Method and Scatter Degree Method. Reliab. Eng. Syst. Safe 2021, 205, 1–8. [Google Scholar] [CrossRef]
  31. Guo, S. Application of entropy weight method in the evaluation of the road capacity of open area. In Proceedings of the International Conference on Materials Science, Energy Technology, Power Engineering (MEP), Hangzhou, China, 15–16 April 2017; Volume 1839, p. 020120. [Google Scholar]
  32. Bai, H.; Feng, F.; Wang, J.; Wu, T. A Combination Prediction Model of Long-Term Ionospheric foF2 Based on Entropy Weight Method. Entropy 2020, 22, 442. [Google Scholar] [CrossRef] [PubMed] [Green Version]
  33. Zhao, J.; Wu, D.; Zhang, Y.; Wang, M. Extension evaluation of green building Project Management performance based on entropy weight method. J. Eng. Manag. 2018, 32, 125–130. [Google Scholar]
  34. Du, Y.; Zheng, Y.; Wu, G.; Tang, Y. Decision-making method of heavy-duty machine tool remanufacturing based on AHP-entropy weight and extension theory. J. Clean. Prod. 2020, 252, 119607. [Google Scholar] [CrossRef]
  35. Song, M.; Zhu, Q.; Peng, J.; Santibanez Gonzalez, D.R.E. Improving the evaluation of cross efficiencies: A method based on Shannon entropy weight. Comput. Ind. Eng. 2017, 112, 99–106. [Google Scholar] [CrossRef]
  36. Han, Y.M.; Fang, D.; Zhang, H.Y.; Li, Y. Efficiency evaluation of intelligent swarm based on AHP entropy weight method. In Proceedings of the 3rd International Conference on Computer Information Science and Artificial Intelligence (CISAI), Inner Mongolia, China, 25–27 September 2020; p. 012072. [Google Scholar]
  37. Qi, X.; Zhou, M. Integrated energy service demand evaluation based on AHP and entropy weight method. In Proceedings of the International Conference on Energy, Environment and Bioengineering (ICEEB), Xi’an, China, 7–9 August 2020; p. 01046. [Google Scholar]
  38. Wu, Z.; Chen, G.; Yao, J. The Stock Classification Based on Entropy Weight Method and Improved Fuzzy C-means Algorithm. In Proceedings of the 4th International Conference on Big Data and Computing (ICBDC), Guangzhou, China, 10–12 May 2019; pp. 130–134. [Google Scholar]
  39. Lu, J.; Wei, C.; Wu, J.; Wei, G. TOPSIS method for probabilistic linguistic MAGDM with entropy weight and its application to supplier selection of new agricultural machinery products. Entropy 2019, 21, 953. [Google Scholar] [CrossRef] [Green Version]
  40. Santos, B.M.; Godoy, L.P.; Campos, L.M.S. Performance evaluation of green suppliers using entropy-TOPSIS-F. J. Clean. Prod. 2019, 207, 498–509. [Google Scholar] [CrossRef]
  41. Kumar, R.; Singh, S.; Bilga, P.; Jatin, K.; Singh, J.; Singh, S.; Scutaru, M.-L.; Pruncu, C.I. Revealing the Benefits of Entropy Weights Method for Multi-Objective Optimization in Machining Operations: A Critical Review. J. Mater. Sci. Technol. 2021, 10, 1471–1492. [Google Scholar]
  42. Gündoğdu, F.K.; Duleba, S.; Moslem, S.; Aydin, S. Evaluating public transport service quality using picture fuzzy analytic hierarchy process and linear assignment model. Appl. Soft. Comput. 2021, 100, 106920. [Google Scholar] [CrossRef]
  43. Moslem, S.; Çelikbilek, Y. An integrated grey AHP-MOORA model for ameliorating public transport service quality. Eur. Transp. Res. Rev. 2020, 12, 1–13. [Google Scholar] [CrossRef]
  44. Moslem, S.; Gul, M.; Farooq, D.; Celik, E.; Ghorbanzadeh, O.; Blaschke, T. An Integrated Approach of Best-Worst Method (BWM) and Triangular Fuzzy Sets for Evaluating Driver Behavior Factors Related to Road Safety. Mathematics 2020, 8, 414. [Google Scholar] [CrossRef] [Green Version]
  45. Moslem, S.; Farooq, D.; Ghorbanzadeh, O.; Blaschke, T. Application of the AHP-BWM Model for Evaluating Driver Behavior Factors Related to Road Safety: A Case Study for Budapest. Symmetry 2020, 12, 243. [Google Scholar] [CrossRef] [Green Version]
  46. Ortega, J.; Moslem, S.; Tóth, J.; Péter, T.; Palaguachi, J.; Paguay, M. Using Best Worst Method for Sustainable Park and Ride Facility Location. Sustainability 2020, 12, 10083. [Google Scholar] [CrossRef]
  47. Li, Y.; Liu, X.; Chen, Y. Selection of logistics center location using Axiomatic Fuzzy Set and TOPSIS methodology in logistics management. Expert Syst. Appl. 2011, 38, 7901–7908. [Google Scholar] [CrossRef]
  48. Abdel-Basset, M.; Mohamed. R. A novel plithogenic TOPSIS-CRITIC model for sustainable supply chain risk management. J. Clean. Prod. 2020, 247, 119586. [Google Scholar] [CrossRef]
  49. Rostamzadeh, R.; Ghorabaee, M.K.; Govindan, K.; Esmaeili, A.; Nobar, H.B.K. Evaluation of sustainable supply chain risk management using an integrated fuzzy TOPSIS- CRITIC approach. J. Clean. Prod. 2018, 175, 651–669. [Google Scholar] [CrossRef]
  50. Sirisawat, P.; Kiatcharoenpol, T. Fuzzy AHP-TOPSIS approaches to prioritizing solutions for reverse logistics barriers. Comput. Ind. Eng. 2018, 117, 303–318. [Google Scholar] [CrossRef]
  51. Walczak, D.; Rutkowska, A. Project rankings for participatory budget based on the fuzzy TOPSIS method. Eur. J. Oper. Res. 2017, 260, 706–714. [Google Scholar] [CrossRef]
  52. Gandhi, N.S.; Thanki, S.J.; Thakkar, J.J. Ranking of drivers for integrated lean-green manufacturing for Indian manufacturing SMEs. J. Clean. Prod. 2018, 171, 675–689. [Google Scholar] [CrossRef]
  53. Abdel-Basset, M.; Manogaran, G.; Gamal, A.; Smarandache, F. A group decision making framework based on neutrosophic TOPSIS approach for smart medical device selection. J. Med. Syst. 2019, 43, 38. [Google Scholar] [CrossRef] [PubMed]
  54. Kelemenis, A.; Askounis, D. A new TOPSIS-based multi-criteria approach to personnel selection. Expert Syst. Appl. 2010, 37, 4999–5008. [Google Scholar] [CrossRef]
  55. Oztaysi, B. A decision model for information technology selection using AHP integrated TOPSIS-Grey: The case of content management systems. Knowl. Based Syst. 2014, 70, 44–54. [Google Scholar] [CrossRef]
  56. Fu, Z.; Liao, H. Unbalanced double hierarchy linguistic term set: The TOPSIS method for multi-expert qualitative decision making involving green mine selection. Inf. Fusion 2019, 51, 271–286. [Google Scholar] [CrossRef]
  57. Nyimbili, P.H.; Erden, T.; Karaman, H. Integration of GIS, AHP and TOPSIS for earthquake hazard analysis. Nat. Hazards 2018, 92, 1523–1546. [Google Scholar] [CrossRef]
  58. Mi, Z.F.; Wei, Y.M.; He, C.Q.; Li, H.-N.; Yuan, X.-C.; Liao, H. Regional efforts to mitigate climate change in China: A multi-criteria assessment approach. Mitig. Adapt. Strateg. Glob. Change 2017, 22, 45–66. [Google Scholar] [CrossRef]
  59. Coban, A.; Ertis, I.F.; Cavdaroglu, N.A. Municipal solid waste management via multi-criteria decision making methods: A case study in Istanbul, Turkey. J. Clean. Prod. 2018, 180, 159–167. [Google Scholar] [CrossRef]
  60. Zengir, S.V.; Sobhani, B.; Asghari, S. Modeling and Monitoring of Drought for forecasting it, to Reduce Natural hazards Atmosphere in western and north western part of Iran, Iran. Air Qual. Atmos. Health 2020, 13, 119–130. [Google Scholar]
  61. Yoon, K.P.; Kim, W.K. The behavioral TOPSIS. Expert Syst. Appl. 2017, 89, 266–272. [Google Scholar] [CrossRef]
  62. Akram, M.; Adeel, A. TOPSIS Approach for MAGDM Based on Interval-Valued Hesitant Fuzzy N-Soft Environment. Int. J. Fuzzy Syst. 2018, 21, 993–1009. [Google Scholar] [CrossRef]
  63. Zhang, M.; Li, G.X. Combining TOPSIS and GRA for supplier selection problem with interval numbers. J. Cent. South. Univ. 2018, 25, 1116–1128. [Google Scholar] [CrossRef]
  64. Hanif, M.; Nishikant, M.; Sameer, K. A novel TOPSIS–CBR goal programming approach to sustainable healthcare treatment. Available online: https://link.springer.com/article/10.1007/s10479-018-2992-y (accessed on 1 January 2021).
  65. Sangaiah, A.K.; Gopal, J.; Basu, A.; Subramaniam, P.R. An integrated fuzzy DEMATEL, TOPSIS, and ELECTRE approach for evaluating knowledge transfer effectiveness with reference to GSD project outcome. Neural. Comput. Appl. 2017, 28, 111–123. [Google Scholar] [CrossRef]
  66. Gündoğdu, F.K.; Kahraman, C. Spherical fuzzy sets and spherical fuzzy TOPSIS method. J. Intell. Fuzzy Syst. 2019, 36, 337–352. [Google Scholar] [CrossRef]
  67. Sarkar, B.; Biswas, A. Pythagorean fuzzy AHP-TOPSIS integrated approach for transportation management through a new distance measure. Soft. Comput. 2021, 25, 1–17. [Google Scholar] [CrossRef]
Figure 1. The factor data characteristics.
Sustainability 13 02913 g001
Figure 2. Positive and negative ideal solution plane.
Sustainability 13 02913 g002
Figure 3. Relative proximity of 2012–2019.
Sustainability 13 02913 g003
Table 1. Factor attribute values.
YearFreight Volume (FV)Turnover Volume (TV)Carbon Oxides (CO)Hydrocarbon (HC)Nitrogen Oxides (NOX)Particulate Matter (PM)
20127771.34968.447.45217.431237.2588.716
201396601219.2759.74421.947298.72110.973
201411,762.041557.6776.32628.038381.62914.019
201512,8741739.9585.25831.319426.28815.66
201614,3601982.9197.16335.692485.81317.846
201714,1171631.3379.93529.364399.67614.682
201815,039.61700.0883.30430.601416.5215.301
201911,6491876.191.92933.77459.64516.885
Table 2. Descriptive statistics of the original data.
FactorMinimumMaximumMeanStandard
Deviation
FV7771.3415,039.6012,154.122490.01706
TV968.401982.911584.46337.46314
CO47.4597.1677.6316.53573
HC17.4335.6928.526.07430
NOX237.26485.81388.1982.67860
PM8.7217.8514.263.03715
Table 3. Information entropy and weight.
FactorInformation EntropyWeight
FV0.9033297030.171926858
TV0.9068805820.165611666
CO0.9068790590.165614374
HC0.9068827770.165607762
NOX0.9068804660.165611873
PM0.9068716980.165627466
Table 4. Distance from positive and negative ideal solutions.
Year S i + S i
20120.270
20130.210.07
20140.110.16
20150.070.2
20160.010.27
20170.090.19
20180.070.21
20190.050.24
Publisher’s Note: MDPI stays neutral with regard to jurisdictional claims in published maps and institutional affiliations.

