Abstract
Urban shrinkage has become a common feature for a growing number of European cities and urban regions. Cities in Europe have lost populations during the previous few decades, many of them in the post-communist countries. A similar phenomenon has been observed in smaller units: municipalities and villages. Shrinking towns/municipalities/villages grapple with insufficiently used housing infrastructure, a decrease in labor force, investment and in the number of jobs. This analysis examines the socio-spatial factors present in municipalities in the north-east of Poland, which are expected to experience the greatest population decrease by 2030. The study focused mainly on determinants with the greatest impact on the good life standards. It also sought to answer why the population growth forecasts for these units are so unpromising. The findings have shown that the majority of determinants adopted in the conceptual model describing the good life standards are below the reference values. The applied taxonomic measure of good life standards (TMGL) method allowed for identifying five municipality clusters representing “different speeds” at which these forecasts are fulfilled. Two clusters have dominant determinants in five criteria and three clusters, in two criteria adopted in the conceptual model. The findings indicate that approx. 35% of the municipalities under analysis have a chance for stabilization of the population size, provided local stakeholders take some targeted actions.
1. Introduction
Reducing poverty and inequalities and achieving economic welfare are all global challenges in line with the United Nations Sustainable Development Goals 1, 8 and 10 [1,2]. It is very difficult to achieve those goals in spatial entities inhabited by local communities and it requires both the residents and the decision-makers to be involved in the process. Failure to take the relevant actions results primarily in a considerable decrease in population size at some locations despite the global forecasts indicating a steady population increase until the year 2100 [3,4,5,6]. Globally, the largest population increase is forecast for Asia and Africa. However, the increase is inversely proportional to the level of development of a specific continent, country or region. Depopulation results in urban shrinkage [7,8], a phenomenon noticeable on the micro-scale, even leading to the disappearance of some villages [9]. The definitions of shrinkage have seen a shift in the literature since the latter half of the 20th century [10]. It applied mainly to critical demographic issues, such as a low fertility rate and an increase in the elderly population [11,12]. Only recently has the discourse focused on “the challenges” before urban shrinkage in terms of policy [13] and planning [14,15,16]. According to the definition, urban shrinkage/shrinking cities is an empirical phenomenon resulting from the specific interplay of different macro-processes at the local scale [7,17,18,19]. A population decrease there is larger than would result from the trends observed in the country/region/town. Other theoretical explanations of urban shrinkage have also been offered. Possible causes include depreciation of the national infrastructure (i.e., motorways) and suburbanization [20]. Pallagst [21] also suggests that the shrinkage is a response to deindustrialization since jobs are transferred from the centers to cheaper suburban areas. Other factors include (a) current urban development model—urbanization is a cyclical process and the town downfall will ultimately result in an increased growth rate [22]; (b) urban monostructures focused on one branch of economic growth are susceptible to rapid slumps [22]; (c) state-owned companies in the post-communist countries of Eastern Europe did not survive privatization, which resulted in shutting down factories and mass unemployment [22]; (d) Intelligent downfall, “planning less means fewer people, fewer buildings, less land development”: urban development is oriented towards improving the life quality of the current residents without taking into account their needs, thereby pushing more people out of the town center [20].
The term urban shrinkage/shrinking cities is therefore used to stress that fact that it is a multidimensional process with multidimensional consequences; it has an economic, demographic, geographic, social and physical dimension [19], which is evolving as a result of global and local reality. Much research has been conducted on metropolises/cities [23,24,25,26]. The phenomenon is also noticeable in smaller units, such as municipalities, small towns and villages [9]. According to historical sources, the process of their shrinkage has been observed since antiquity. The most common factors which make its intensity increase include emigration, economic crises, a deteriorating socio-economic status of the society [9], environment pollution, a peripheral location and economic marginalization, as well as epidemics [27,28].
Depopulation is an unfavorable phenomenon. It affects the aging of the society, leads to an unfavorable economic structure, depreciation of real estate, landless cultivation or abandonment of agricultural areas, in addition to a lack of inheritance of the cultural landscape. Such locations are also becoming unattractive for entrepreneurs due to the unfavorable age structure of the population. As a consequence, this leads to the deepening of infrastructure collapse and further depopulation [29,30,31,32]. This paper attempts to determine the main causes of shrinking municipalities (SM) in Poland. Poland has been a member of the European Union for 16 years and membership has had a substantial impact on its social, economic and infrastructural development. The question is: why are population-related forecasts so adverse at some locations despite the large financial investments in the region development? The study authors put forward two research questions: what is the level of socio-spatial determinants in the municipalities threatened with SM relative to the reference ones? Can the SMs under analysis be grouped in terms of how close they are to achieving the good life standards?
This paper is organized in the following manner: The introduction is followed by a presentation of the Polish perspective of rural and urban-and-rural municipality shrinkage, a description of information sources together with the study object, primary data used in the study and its methodology. These parts are followed by a presentation of the research results and discussion. The paper also includes graphics to support the phenomenon analysis. The final part presents the conclusions from the study findings.
Shrinking Municipality—Polish Perspective
It has been noted that the population decrease in some locations in Poland is much higher than the average. The population is projected to decrease in 1665 out of 2478 municipalities in Poland by 2030, with the decrease exceeding 5% in 1007 municipalities and 10% in 322 [33]. The majority of the municipalities with the largest forecast population decrease are situated in the east of Poland (the so-called “eastern wall”). These municipalities are situated mainly in the Podlaskie Voivodship (44% of the municipalities in the voivodship), Warmińsko-Mazurskie Voivodship, in the southern part of the Lubelskie Voivodship, close to the Russian border, in the eastern part of West Pomerania and in the mountainous area in the south-east of Poland (see Figure 1). According to forecasts, a good demographic situation is enjoyed by municipalities situated in the following Voivodships: Małopolskie, Pomorskie, Wielkopolskie and the central part of Mazowieckie. The regions (municipalities) with the largest forecast population increase are situated in the immediate neighborhood of the largest urban centers. The increase results from so-called “urban sprawl” [34]. It is a consequence of the attractiveness of large urban centers as labor markets.
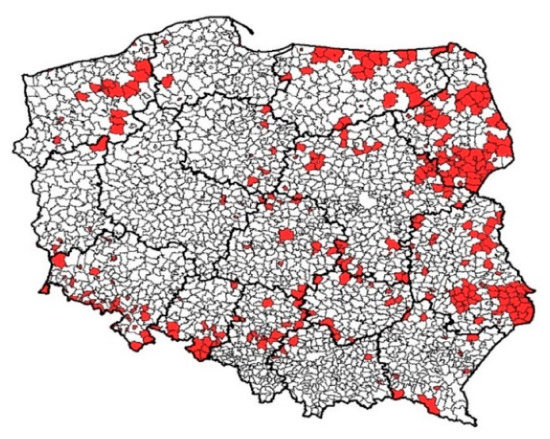
Figure 1.
Forecast of population decrease exceeding 10% in Polish municipalities. Source: [33].
Studies of locations with a high level of depopulation should focus on the life quality standards [35,36,37], as their unsatisfactory level often makes residents emigrate. Life quality is defined as the extent to which life meets the good life standards [38]. Evaluation of the place where one lives (home, work, leisure, health, entertainment, etc.) is the central element of the objective (spatial) dimension of life quality. Good life standards change from one epoch to another, they depend on the social group, level of wealth, the needs of a group under study as well as historical and cultural factors. Young people, “singles”, families with children, elderly people—they all perceive good life standards differently. There are also noticeable differences between the needs of village and small-town residents and those of large cities [2]. Young people value lively and vibrant places with good transport facilities, short commuting times to work, school or places of entertainment [39]. Families with children search for places not only situated close to their place of work, but which are also safe, with access to schools, kindergartens, playgrounds, shops and health clinics [40]. Elderly people expect to find places with good access to services, including public health clinics [41]. The needs of all these groups are different.
These analyses focus on the extent to which municipalities fail to meet the good life standards. For people of working age, this failure often provides a stimulus for looking for other, satisfactory and friendly places to live, which meet their expectations. The level of good life standards is different in each country/region. It will be different in Africa than in Europe and different in the UK than in Poland. It will also vary depending on the level of financial resources. Poland’s accession to the EU and a stream of funds aimed at providing equal opportunities to the backward areas made the differences present two decades ago gradually disappear. This study examined municipalities in danger of the greatest depopulation based on a multi-criteria conceptual model (see Figure 2), which takes into account the following criteria: location, employment, security, living condition, health, social assistance, entertainment, level of development of technical infrastructure and effectiveness of local government.
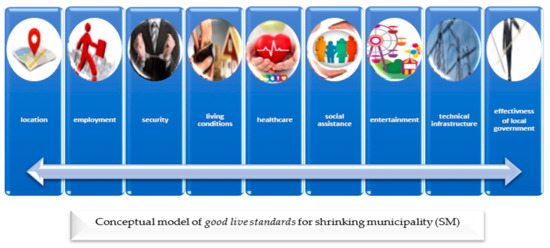
Figure 2.
Conceptual model of good life standards for a shrinking municipality (SM). Source: own study.
Each criterion of the conceptual model is represented by several determinants. The objects under study were compared to the reference object, which covered the mean level of factors prevalent in Poland. The choice of criteria was based on the needs of people of working age and the choice of determinants—on the availability of up-to-date data.
2. Materials and Methods
2.1. Materials
The study covered two voivodships in the north-east of Poland (see Figure 3). They are part of the so-called “eastern wall” (Warmia and Mazury and Podlaskie Voivodships). In total, 65 rural and urban-and-rural municipalities in danger of depopulation (over 10%) were analyzed. These included 21 municipalities in the Warmia and Mazury Voivodship and 44 in the Podlaskie Voivodship.
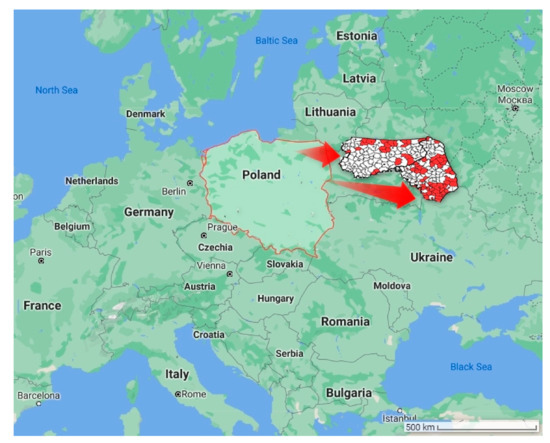
Figure 3.
Study area. Source: [33,42].
The Warmińsko-Mazurskie Voivodeship covers an area of 24,173 km2 (7.7% of the area of Poland) and it has a population of 1.42 million. It is called the “Land of a Thousand Lakes”, as there are over three thousand lakes. About 31% of its area is covered by forests. The GDP per capita accounts for 71.7% of the national average, which ranks the region as one of the poorest regions in Poland. The expenses of 11.2% of the Warmińsko-Mazurskie Voivodship residents are below the extreme poverty level (i.e., below the minimum subsistence level). The Podlaskie Voivodeship covers an area of 20,187 km2 (6.5% of the area of Poland) and it has a population of 1.2 million. It is the coldest place in Poland, as it is affected by strong currents of cold continental air and the annual average temperature is below 7 °C. As in the previous voivodship, the GDP per capita in this region accounts for 71.7% of the national average and the expenses of 11.0% of its residents are below the extreme poverty level.
This study used primary data obtained from such sources as the Statistics Poland [43], Head Office of Geodesy and Cartography [44], Institute of Soil Science and Plant Cultivation [45], Headquarters of the State Fire Service [46], Warsaw Police Headquarters [47], data gathered in situ [48,49,50] and indices calculated from primary data according to Formula (1). They are presented in Table 1.

Table 1.
Data used in the study.
2.2. Methods
The primary data were transposed as per the Formula (1):
—index;
—primary data;
—population of the municipality under analysis.
The number of variables was optimized by reduction of multidimensionality with the use of expert criteria and the correlation matrix [51], according to the Formula (2).
where —Pearson correlation coefficient (3) for all pairs of attributes.
where
x, y—random variables
—mean values
K—number of variables.
Grouping of municipalities with respect of taxonomic measure of good life standards (TMGL) was based on agglomeration by the Ward method—formulas (4) and (5) [52], with the use of the Euclidean distance [53]. Distances between clusters in these methods are determined by the analysis of variance. It consists of minimization of the sum of squares of deviations within clusters. A pair of clusters is chosen at each stage from among all those that can be connected, which gives a cluster of the minimal variability [54,55]. This yields groups of objects of the maximum homogeneity within a group and the maximum heterogeneity between groups. Raw data were used because it allowed for showing the natural properties of the determinants under analysis [56]. According to many authors [57,58,59], the standardization affects the distribution of objects in the Euclidean space and reduces the effectiveness of cluster analysis methods.
where
—the mean of the mth cluster for kth variable
—being the score on the kth variable (k = 1, 2, …, p) for the lth object (l = 1, 2, …, nm) in the mth cluster (m = 1, 2, …, g).
All the calculations were made with the licensed Statistica 13.1. Software (StatSoft Poland).
3. Results
Altogether, 65 municipalities situated in the Warmińsko-Mazurskie and Podlaskie Voivodships were analyzed, with 28 indices determined to describe the socio-spatial factors and included in the conceptual good life standard model (see Figure 3). The spatial factors described both the position relative to the economic center/higher level location (district/voivodship town) as well as internal factors (forest cover, soil quality, etc.).
The municipalities under study differ with respect to both the area (P2) and population (S7). The smallest municipality—Przytuły (Podlaskie Voivodship) occupies an area of 71.18 km2 and the largest—Pieniężno (Warmińsko-Mazurskie Voivodship) has an area of 242.94 km2. Dubicze Cerkiewne is the municipality with the smallest population—1484 people (2018) and Biała Piska is the largest—11,827 people (2018). The municipality of Dubicze Cerkiewne has the lowest population density (S9) (10 people/km2). Wiżajny is the municipality with the poorest soils (P1) (the index of 43.7/100) and Barciany has the best soils (84.2/100). The municipality of Ruciane Nida has the largest forest cover (P6) (71.7%). In terms of the transport availability, there is no public transport in eight of the municipalities under study (P5), which is why residents have to use their own cars. The largest number of bus links to the nearest higher level economic center (county/voivodship town) can be found in Bielsk Podlaski (24 lines). The municipality of Michałowo is the farthest from the district town (P3)—64 km and the municipality of Szepietowo is the closest (7 km). Figure 4 shows the distance between particular municipalities and the economic centers of the higher level and the time it takes to travel there. The municipality numbers and positions are listed in Appendix A).
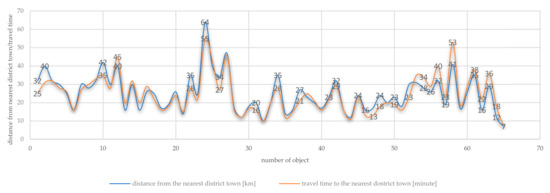
Figure 4.
The distance between the seat of the municipality (P3) and the nearest economic center of a higher level [km] (e.g., district/voivodship town) and the travel time (P4) [minute] for individual object. Number and name of object can be found in Appendix A. Source: own study on [44,45].
Socio-economic factors make up another group included in the conceptual model of the good life standards. It is larger and it covers the life quality criteria that are most vital from the human perspective. These include employment (unemployment rate—S8, number of the employed—S13, number of jobs—S10), security (local natural hazards—S11, criminal offenses—S12), living conditions (number of flats—S14, average flat area—S15), healthcare (number of health clinics—S16, number of pharmacies—S17, number of medical consultations—S18), social assistance (number of social assistance beneficiaries—S19, number of people receiving housing benefits—S23), technical infrastructure (consumers of natural gas—S24, % of buildings connected to the water supply network—S25 and to the sewage network—S26), entertainment (number of libraries—S20, number of sport club members—S22, number of supermarkets/markets—S21) and effectiveness of local government (amount of funds from the EU received in 2014–2020—S27, municipality income per capita—S28).
The mean unemployment rate (S8) varies. The mean unemployment rate during the period of 2004–2019 in Poland was 11.8% [60]. When it comes to the area under study, the highest unemployment rate was recorded in the municipality of Lelkowo (Warmińsko-Mazurskie Voivodship)—33.3% and the lowest—in the municipality of Przytuły (Podlaskie Voivodship)—3.1%. This index was higher than the reference value in nearly 32% of the municipalities under study (see Figure 5).
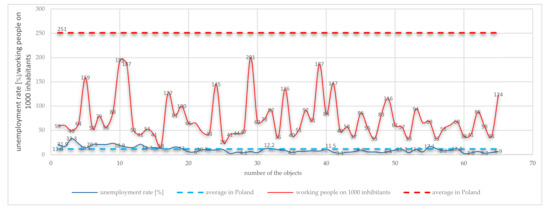
Figure 5.
The unemployment rate (S8) average for 2004–2019 and working people on 1000 inhabitants (S13) relative to the reference value for individual object. Number and name of object can be found in Appendix A. Source: own study on [56].
Business activity development level is very low in the municipalities under study. There are 1080 business entities per 10,000 residents (S10) in Poland. None of the SMs under study achieved the reference value, with the municipality of Bisztynek being the closest (950). The number of business entities is under 50% of the reference value in the other SMs. Security is one of the most important factors taken into account when the place of living is chosen, especially by families. Two security-related attributes were considered in this study—the number of criminal offences/1000 residents (traffic-related, economic) (S12) and local hazards/municipality (natural) (S11). It is a destimulating criterion (a high index has a negative impact on the good life standards). S11 is below the reference value. The municipalities of Pieniężno, Orzysz and Ruciane-Nida are the least secure. Considering the second index related to crime (S12), the reference value (20.75) was exceeded in two municipalities—Janowo (22.16) and Janowiec Kościelny (22.16). Both objects are situated in the Warmińsko-Mazurskie Voivodship (see Figure 6) close to the border with the Mazowieckie Voivodship.
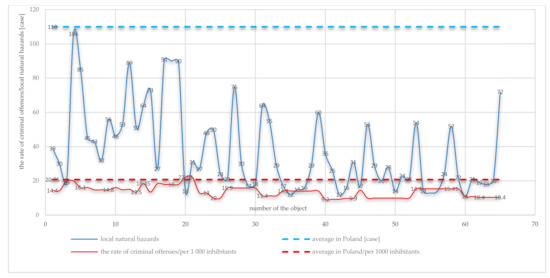
Figure 6.
The rate of criminal offences/per 1000 inhabitants (S12) in individual municipalities and the number of natural hazards (S11) relative to the reference value (average for 10 years) for individual object. Number and name of object can be found in Appendix A. Source: own study on [41,56].
In general, the housing conditions (S14/S15) in the objects under study are highly satisfactory (see Figure 7). However, a more thorough analysis shows that it is a consequence of the area depopulation, which leaves many flats empty [11,12] and creates problems for their owners, usually individuals. The S15 index exceeds the reference value for 21 municipalities. The greatest problem concerning empty flats is encountered in the municipality of Kobylim-Borzymy (the index is more than three times higher than the reference value).
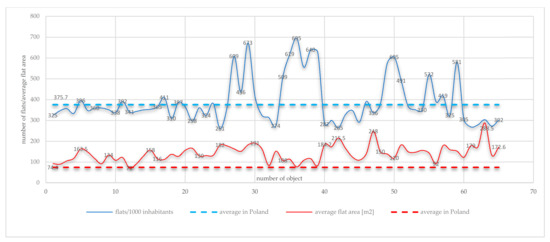
Figure 7.
The number of flats per 1000 residents (S14) and the average flat area (S15) relative to the reference value for individual object. Number and name of object can be found in Appendix A. Source: own study on [38,56].
Accessibility of places where residents can seek medical advice is an important aspect of life in places outside large economic centers (number of health clinics, number of residents per pharmacy, number of medical consultations). In each municipality there is a pharmacy (S17) where one can buy medicines. In one municipality, the number of residents per pharmacy is three times higher than the reference value (Barciany—6275, with the reference value—2651). There is not a health clinic in every municipality (S16), which makes people use such facilities situated in the neighboring municipalities.
The largest number of medical consultations was recorded in the municipality of Michałowo (Podlaskie Voivodship)—15.8—and it is nearly twice as large as the reference value (8.4).
The level of technical infrastructure in the municipalities under study is very low (see Figure 8). There is a water supply network (S25) in each of the municipalities under study, but only 46% of the buildings are connected to the network in the municipality of Szudziałowo and nearly 100% of the buildings in the municipality of Korsze. The situation is much worse when it comes to the sewage system (S26). The set under analysis includes municipalities (Przytuły, Milejczyce, Perlejewo, Kulesze Kościelne) without a central sewage system. The residents have to use the sewage installations made on their own—usually cesspits or individual wastewater treatment plants. The reference value for the sewage system (number of buildings connected to the sewage system) is 50.6% and this level is achieved only in four municipalities—Narewka, Ruciane Nida, Janowo and Srokowo. Due to the climate in Poland, people have to use heating systems. They are usually powered by gas (S24), although there are increasingly more systems which use renewable energy (photovoltaics, heat pumps, etc.) because they are subsidized by the government. The percentage of buildings connected to such systems in the municipalities under study is very small—a gas supply network was available only in nine of them. Coal-fired boilers, with emissions contributing to smog formation, are still the most popular heating devices in Poland [61,62].
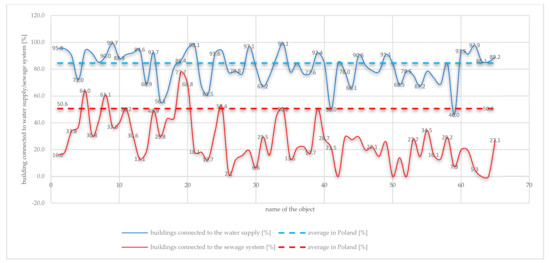
Figure 8.
Access to a water supply network (S25) and a sewage network (S26) in individual municipalities [%] relative to the reference value for individual object. Number and name of object can be found in Appendix A. Source: own study on [38].
The active involvement of local authorities in funds acquisition for actions aimed at stemming the urban shrinkage is of key importance [63,64]. Local authorities initiate actions in their municipalities, seek funds to finance the development of the area, of business activity and training aimed at reducing unemployment. Two measures related to this criterion were taken into consideration in the area under study—EU funds acquired in 2014–2020 (S27) and the municipality income per capita (S28). The analyses show that local governments’ effectiveness in acquiring EU funds for municipality development is low. The municipalities closest to the reference value (PLN 17,201 per capita) include Sidra (PLN 16,471 per capita), as well as Perlejewo, Szczuczyn, Grodzisk, Narew, Pieniężno and Reszel (see Figure 9). This index is lower than 20% of the reference value in the other SMs, which means that the local government effectiveness in this regard is very poor. The situation is a little better when it comes to the S28 index. The municipality income per capita (S28) is below the reference value in 30% of the municipalities under study. It is similar or slightly higher in the other municipalities. The municipality of Mielnik stands out because the income per capita in it reaches 170% of the reference value.
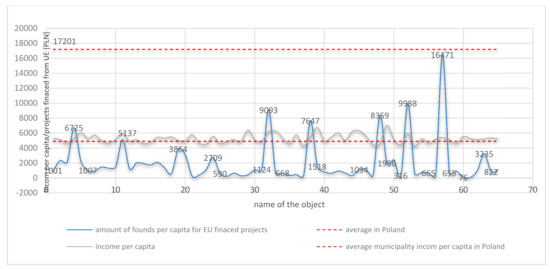
Figure 9.
The municipality income per capita (S28) and the amount of founds per capita for EU financed projects (S27) relative to the reference values (for 2014–2020) for individual object. Number and name of object can be found in Appendix A. Source: own study on [38,43].
Solving the second research problem, i.e., identifying clusters of municipalities similar in terms of the criteria under analysis, required reducing the dimensionality by the expert method and a correlation matrix (Appendix B). The reduction aimed to choose only those variables which can be used to discriminate against individual observations because they are included in a specific cluster [56] Descriptive determinants and those with a neutral impact (municipality area—P2, forest cover—P6, population—S7, population density—S9) as well as correlated variables with a similar information range—P3 (distance from the nearest higher level town), S21 (number of markets), S22 (number of sport club members), S23 (number of people receiving housing benefits), S24 (natural gas consumers) were excluded from further analyses. In total, 65 SM objects were clusterized and each was described with seven criteria (19 determinants). This allowed for identifying groups of SM (shrinking municipality) of various speeds. Five clusters were identified by this method (formula 4 and 5). The first cluster included 20 SM, the second—16 SM, the third—21 SM, the fourth—6 SM and the fifth—2 SM (see Figure 10).
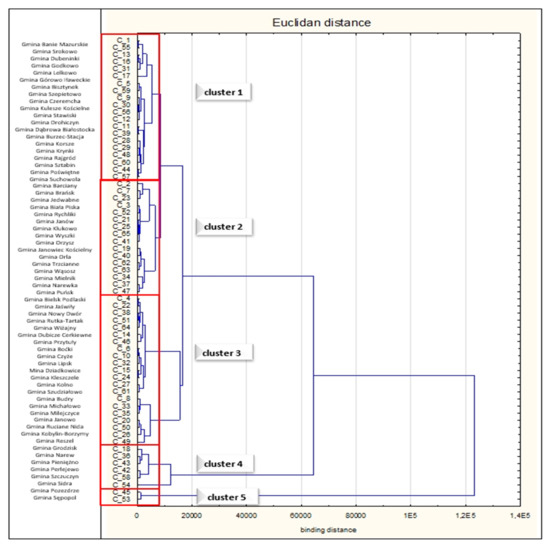
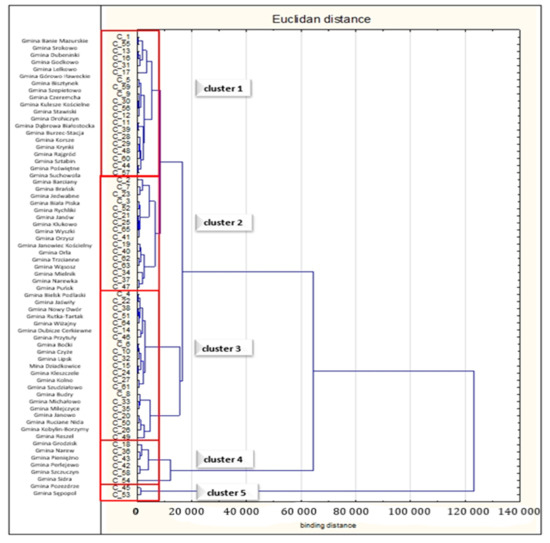
Figure 10.
The clusterization result for TMGL. Source: prepared by the author on Statistica 13.1.
Table 2 shows the result of a comparison of individual clusters in the nine criteria under analysis. The determinants were divided into stimulants and destimulants (the higher the index, the worse condition of the SM) of the good living standards (see Table 2).
Table 2.
Comparison results for the criteria of the conceptual model of good life standards for the SM.
The comparison results show that the municipalities grouped in two clusters, 3 and 5, are significantly close to the reference values and they even achieved better results for some determinants than the reference model (see Table 2).
Cluster 3 and cluster 5 are the most promising. Cluster 5 includes only two municipalities (Pozezdrze and Sępopol), which have the best indices in five criteria (see Table 2). In consequence, it has the best chance of mitigating the scenario in the population-related forecast. This cluster has the best indices for location, living conditions, healthcare, entertainment and technical infrastructure. Soils in these municipalities are good (P1) and cultivated [65] because the agriculture land is leased to active farmers, due to their location features (distance to higher-level towns and the number of bus lines) one can find a job outside one’s place of residence. The housing conditions are good, the population health is relatively good (a low number of medical consultations) and the technical infrastructure level (water supply and sewerage networks) is also good. Agriculture is developing (soils are good) and the natural and landscape values (lakes, forests, varied land relief, low pollution level, nature parks) favor tourism development. In the municipality of Pozezdrze there are bunkers and fortifications (Himmler’s field headquarters), tourist routes, castles and 19th century mansions, sacral objects and monuments [66] The municipality of Sępopol is a craft and service center, with services for agriculture dominating in the past. The downfall of the local food processing industry took place after 1990 [67]. The situation in cluster 3 is very similar. The level of the determinants under study is the best in five criteria: location, employment, security, health and social assistance (see Table 2). Unlike in cluster 5, it has a good location and healthcare, as well as positive indices regarding employment, safety and social assistance. The unemployment rate is lower than the reference value (11.79) and it is below the reference value booth in terms of natural hazards (S11) and crime rate (S12). The level of social assistance (S19) is the lowest in this cluster. Both clusters can be regarded as including first speed municipalities (approx. 35% of the municipalities under study). The probability that the depopulation forecasts for these municipalities will not be fulfilled is the greatest. It is much lower in clusters 1, 2 and 4. Each of the clusters is distinguished by two criteria. Cluster 1—employment and healthcare (see Table 2). The number of business entities index (S10) is higher than in the other clusters, but it accounts only for 30% of the reference value. The number of health clinics in this group of municipalities is also the largest. Among the determinants that distinguish cluster 2 include employment and effectiveness of local government. The municipality income per capita (S28) is higher than the reference value and the employment rate (S13) is lower, but it is higher than in the other clusters. Cluster 4 is distinguished by the safety and effectiveness of local government. The latter criterion is particularly important because the municipal authorities noticed the trend and took actions to acquire funds for development.
4. Discussion
The phenomenon of urban shrinkage was noted several decades ago. It involves a considerable population decrease compared to the trends in other regions. It was noted that not only in cities/urban areas, but also in smaller units in terms of area and population, such as municipalities and villages [68,69,70]. The objects affected by this phenomenon are influenced by demographic, economic and political factors in ways which lead to their disappearance. According to current estimates, approx. 40% of European towns are losing their populations [71]. Therefore, it is a problem in many European regions [72]. Rink et al. [73] report that the major causes of urban shrinkage in most East European towns include economic decline, which has been observed since 1989. One can agree with this opinion. The acquisition of funds for the area development, new investments in infrastructure and creating new jobs have a positive impact on the population’s welfare [70]. In contrast, their absence results in people looking for other, more attractive places to live.
Loss of population and the resulting transformations present a serious challenge to local stakeholders. It is because the elderly population grows and the group of people of working age shrinks. Therefore, society in an SM requires different services. These trends have serious consequences regarding the adaptation of buildings, transport, services and the physical environment, particularly healthcare, social welfare, transport (location) and services [74,75,76]. This can be noted in the objects under study. However, additional financial support is required to meet the needs of the transforming population. Many decision-makers find it difficult to accept the financial outlay increase for this purpose [7,72]. Despite many EU and national programs for small and medium-sized towns and villages, the municipalities under study benefited from them to a very small extent. One municipality (Sidra) achieved nearly the level of the reference object and five (Perlejewo, Szczuczyn, Grodzisk, Narew, Pieniężno and Reszel) stood out against the others. However, they were included in cluster 4, with municipalities not classified as first speed for the non-fulfilment of the forecasts due to very low indices in all the other criteria.
In many countries subject to the phenomenon of depopulation, research is conducted on the specificity of managing shrinking regions, especially from the perspective of maintaining their economic vitality. The formulated rules mainly concern [77,78,79,80,81]:
- (1)
- getting used to the prospect of shrinking population and economic potential;
- (2)
- the need for long-term thinking—decision-makers and planners should take this process into account in works related to the development and maintenance of infrastructure;
- (3)
- better cooperation between local government units in order to reduce costs and improve the quality of provided public services (creation of joint centers of administrative and social services);
- (4)
- preferences for “compact growth”, i.e., development focused on relatively densely populated areas without encouraging an excessive dispersion of the population;
- (5)
- holistic thinking taking into account the interdependencies between the activities carried out, being aware of the existing synergies.
The practical application of these principles should be adapted to local conditions and needs.
According to Schlappa, Neil [72], new local governments need to be elected in many locations to stimulate the dialogue with local stakeholders (entrepreneurs, public sector and civil society) and to identify the real development opportunities suited to the local reality. These needs can be diverse since the good life standards are perceived in various ways. Focusing on local needs is of key importance. For example, supporting local entrepreneurs and policies aimed at redesigning services and infrastructure to suit the age and needs of the local population. Therefore, the ideas and strategies being implemented should concern both elderly people and children. People are willing to settle in locations with the healthy surroundings, the friendly landscape, the local identity and free from natural hazards [82,83], where the physical and social environment is being created and improved continuously, where community resources are expanded to enable people to support each other and to develop their potential.
In general, actions to strengthen the demographic potential should be undertaken as part of a comprehensive and long-term social policy, consistently implemented at the national, regional and local level. Without comprehensive action, it will not be possible to stop or mitigate the negative demographic trends [84]
5. Conclusions
The phenomenon of urban shrinkage is noticeable all over Europe—not only in towns, but also in units of smaller area and population. Depopulation of some locations is attributed to many factors, but it is usually caused by economic and political factors. The local authorities, realizing that the shrinkage is taking place, can provide a stimulus for modernization, both with respect to the infrastructure and to the municipality management.
An analysis of the extent to which good life standards are met was performed in municipalities situated in two regions of the so-called “eastern wall” of Poland. These regions have the largest number of municipalities with forecast depopulation indexes above 10% by 2030. The conceptual model of the good life standards for the rural and urban-and-rural municipalities was proposed, including such criteria as location, employment, security, health, social assistance, entertainment, living conditions, technical infrastructure and effectiveness of local government and a reference object was created for comparison. The research questions formulated for the study enabled the authors to diagnose the condition of the objects with respect to the socio-spatial criteria and the similarity between them. The majority of the municipalities under study failed to achieve the reference values in nearly all the criteria. Homologous municipalities and municipalities of two speeds were identified by the grouping methods. The first speed municipalities (about 35%) dominate in five criteria and they allow for the optimistic assumption that if actions are taken to develop a feasible strategy, it is possible to stop or mitigate the fulfilment of the depopulation forecast. However, this cannot be achieved without the involvement of local entrepreneurs, public authorities, the community and targeted settlement policies.
Author Contributions
Conceptualization, K.K.-B.; methodology, K.K.-B.; software, K.K.-B.; validation, K.K.-B.; formal analysis, K.K.-B.; investigation, K.K.-B.; resources, K.K.-B., K.S.; data curation, K.K.-B., K.S.; writing—original draft preparation, K.K.-B.; writing—review and editing, K.K.-B.; visualization, K.K.-B.; supervision, K.K.-B.; project administration, K.K.-B.; funding acquisition, K.K.-B. All authors have read and agreed to the published version of the manuscript.
Funding
This research received no external funding.
Institutional Review Board Statement
Not applicable.
Informed Consent Statement
Not applicable.
Data Availability Statement
Publicly available datasets were analyzed in this study. This data can be found here: https://bdl.stat.gov.pl/BDL/dane/teryt/jednostka (accessed on 20 September 2020). https://mapadotacji.gov.pl/ (accessed on 20 September 2020) https://www.gov.pl/web/kgpsp/ (accessed on 20 September 2020) http://policja.pl (accessed on 20 September 2020). http://gugik.gov.pl (accessed on 20 September 2020). Data resulting from the analysis is contained within the article (Appendix A and Appendix B).
Conflicts of Interest
The authors declare no conflict of interest.
Appendix A. Map with the Location, Names, and Numbers of the Analyzed Municipalities

Appendix B. Correlation Matrix
| P1 | P3 | P4 | P5 | S8 | S10 | S11 | S12 | S13 | S14 | S15 | S16 | S17 | S18 | S19 | S20S | S21 | S22 | S23 | S24 | S25 | S26 | S27 | S28 | |
| P1 | 1.000 | 0.062 | 0.060 | 0.140 | 0.503 | 0.355 | 0.198 | 0.163 | 0.071 | −0.276 | −0.031 | 0.105 | 0.208 | −0.090 | 0.198 | 0.200 | 0.135 | 0.007 | 0.259 | 0.174 | 0.136 | 0.059 | 0.058 | −0.161 |
| P3 | 0.062 | 1.000 | 0.893 | 0.210 | 0.211 | 0.068 | 0.046 | 0.110 | 0.053 | −0.066 | −0.112 | 0.113 | −0.082 | 0.364 | 0.095 | 0.244 | 0.065 | 0.049 | 0.062 | 0.033 | −0.162 | 0.121 | −0.047 | −0.186 |
| P4 | 0.060 | 0.893 | 1.000 | 0.200 | 0.176 | 0.033 | 0.086 | 0.137 | −0.036 | −0.158 | −0.058 | 0.173 | −0.068 | 0.315 | 0.146 | 0.181 | 0.039 | 0.010 | 0.071 | 0.038 | −0.119 | 0.102 | −0.055 | −0.157 |
| P5 | 0.140 | 0.210 | 0.200 | 1.000 | 0.212 | 0.335 | 0.313 | −0.011 | −0.006 | −0.032 | 0.086 | 0.023 | 0.092 | −0.069 | 0.007 | 0.146 | 0.171 | 0.157 | 0.185 | 0.042 | 0.112 | 0.065 | 0.042 | −0.207 |
| S8 | 0.503 | 0.211 | 0.176 | 0.212 | 1.000 | 0.242 | 0.386 | 0.410 | 0.071 | −0.137 | −0.461 | 0.125 | 0.050 | 0.066 | 0.362 | 0.317 | 0.227 | 0.224 | 0.403 | 0.131 | 0.201 | 0.403 | 0.032 | −0.170 |
| S10 | 0.355 | 0.068 | 0.033 | 0.335 | 0.242 | 1.000 | 0.535 | 0.237 | 0.439 | −0.060 | −0.137 | 0.471 | 0.176 | 0.228 | −0.004 | 0.433 | 0.490 | 0.551 | 0.563 | 0.190 | 0.020 | 0.328 | −0.012 | −0.077 |
| S11 | 0.198 | 0.046 | 0.086 | 0.313 | 0.386 | 0.535 | 1.000 | 0.294 | 0.258 | −0.145 | −0.204 | 0.505 | 0.039 | 0.238 | 0.188 | 0.380 | 0.560 | 0.480 | 0.560 | 0.216 | 0.156 | 0.451 | 0.083 | 0.015 |
| S12 | 0.163 | 0.110 | 0.137 | −0.011 | 0.410 | 0.237 | 0.294 | 1.000 | 0.061 | 0.123 | −0.288 | 0.173 | 0.088 | −0.048 | 0.282 | 0.283 | 0.237 | 0.089 | 0.330 | 0.075 | 0.052 | 0.365 | 0.020 | −0.108 |
| S13 | 0.071 | 0.053 | −0.036 | −0.006 | 0.071 | 0.439 | 0.258 | 0.061 | 1.000 | 0.185 | −0.080 | 0.316 | 0.167 | 0.297 | 0.039 | 0.311 | 0.447 | 0.370 | 0.374 | 0.418 | −0.104 | 0.373 | −0.020 | 0.356 |
| S14 | −0.276 | −0.066 | −0.158 | −0.032 | −0.137 | −0.060 | −0.145 | 0.123 | 0.185 | 1.000 | −0.236 | −0.166 | −0.325 | −0.095 | 0.014 | −0.073 | −0.059 | −0.177 | −0.131 | 0.015 | −0.065 | −0.071 | 0.028 | 0.104 |
| S15 | −0.031 | −0.112 | −0.058 | 0.086 | −0.461 | −0.137 | −0.204 | −0.288 | −0.080 | −0.236 | 1.000 | −0.079 | 0.183 | −0.070 | −0.105 | −0.128 | −0.059 | −0.194 | −0.099 | −0.014 | 0.053 | −0.251 | −0.034 | −0.127 |
| S16 | 0.105 | 0.113 | 0.173 | 0.023 | 0.125 | 0.471 | 0.505 | 0.173 | 0.316 | −0.166 | −0.079 | 1.000 | 0.139 | 0.489 | 0.211 | 0.380 | 0.583 | 0.423 | 0.610 | 0.320 | −0.144 | 0.375 | 0.027 | 0.080 |
| S17 | 0.208 | −0.082 | −0.068 | 0.092 | 0.050 | 0.176 | 0.039 | 0.088 | 0.167 | −0.325 | 0.183 | 0.139 | 1.000 | −0.093 | 0.112 | 0.022 | 0.141 | 0.152 | 0.263 | 0.000 | 0.048 | 0.153 | −0.134 | 0.112 |
| S18 | −0.090 | 0.364 | 0.315 | −0.069 | 0.066 | 0.228 | 0.238 | −0.048 | 0.297 | −0.095 | −0.070 | 0.489 | −0.093 | 1.000 | −0.076 | 0.181 | 0.335 | 0.418 | 0.234 | 0.116 | −0.116 | 0.231 | 0.059 | 0.084 |
| S19 | 0.198 | 0.095 | 0.146 | 0.007 | 0.362 | −0.004 | 0.188 | 0.282 | 0.039 | 0.014 | −0.105 | 0.211 | 0.112 | −0.076 | 1.000 | 0.270 | 0.226 | −0.128 | 0.433 | 0.304 | −0.022 | 0.371 | −0.067 | 0.155 |
| S20 | 0.200 | 0.244 | 0.181 | 0.146 | 0.317 | 0.433 | 0.380 | 0.283 | 0.311 | −0.073 | −0.128 | 0.380 | 0.022 | 0.181 | 0.270 | 1.000 | 0.456 | 0.159 | 0.523 | 0.273 | 0.122 | 0.336 | −0.037 | 0.009 |
| S21 | 0.135 | 0.065 | 0.039 | 0.171 | 0.227 | 0.490 | 0.560 | 0.237 | 0.447 | −0.059 | −0.059 | 0.583 | 0.141 | 0.335 | 0.226 | 0.456 | 1.000 | 0.469 | 0.709 | 0.560 | 0.025 | 0.509 | 0.071 | 0.159 |
| S22 | 0.007 | 0.049 | 0.010 | 0.157 | 0.224 | 0.551 | 0.480 | 0.089 | 0.370 | −0.177 | −0.194 | 0.423 | 0.152 | 0.418 | −0.128 | 0.159 | 0.469 | 1.000 | 0.446 | 0.133 | −0.006 | 0.344 | 0.162 | 0.070 |
| S23 | 0.259 | 0.062 | 0.071 | 0.185 | 0.403 | 0.563 | 0.560 | 0.330 | 0.374 | −0.131 | −0.099 | 0.610 | 0.263 | 0.234 | 0.433 | 0.523 | 0.709 | 0.446 | 1.000 | 0.438 | 0.143 | 0.500 | −0.006 | −0.001 |
| S24 | 0.174 | 0.033 | 0.038 | 0.042 | 0.131 | 0.190 | 0.216 | 0.075 | 0.418 | 0.015 | −0.014 | 0.320 | 0.000 | 0.116 | 0.304 | 0.273 | 0.560 | 0.133 | 0.438 | 1.000 | 0.010 | 0.314 | 0.121 | 0.228 |
| S25 | 0.136 | −0.162 | −0.119 | 0.112 | 0.201 | 0.020 | 0.156 | 0.052 | −0.104 | −0.065 | 0.053 | −0.144 | 0.048 | −0.116 | −0.022 | 0.122 | 0.025 | −0.006 | 0.143 | 0.010 | 1.000 | 0.141 | −0.039 | −0.074 |
| S26 | 0.059 | 0.121 | 0.102 | 0.065 | 0.403 | 0.328 | 0.451 | 0.365 | 0.373 | −0.071 | −0.251 | 0.375 | 0.153 | 0.231 | 0.371 | 0.336 | 0.509 | 0.344 | 0.500 | 0.314 | 0.141 | 1.000 | −0.064 | 0.082 |
| S27 | 0.058 | −0.047 | −0.055 | 0.042 | 0.032 | −0.012 | 0.083 | 0.020 | −0.020 | 0.028 | −0.034 | 0.027 | −0.134 | 0.059 | −0.067 | −0.037 | 0.071 | 0.162 | −0.006 | 0.121 | −0.039 | −0.064 | 1.000 | 0.158 |
| S28 | −0.161 | −0.186 | −0.157 | −0.207 | −0.170 | −0.077 | 0.015 | −0.108 | 0.356 | 0.104 | −0.127 | 0.080 | 0.112 | 0.084 | 0.155 | 0.009 | 0.159 | 0.070 | −0.001 | 0.228 | −0.074 | 0.082 | 0.158 | 1.000 |
References
- United Nations. Sustainable Development Goals—About. Available online: https://www.un.org/sustainabledevelopment/sustainable-development-goals/ (accessed on 20 November 2020).
- Murty, V.K.; Shankar, S.S. Towards a Scalable Architecture for Smart Villages: The Discovery Phase. Sustainability 2020, 12, 7580. [Google Scholar] [CrossRef]
- Fox, T.; Wzrost Liczby Ludności—Podstawowe Wyzwanie XXI Wieku (Population growth—The Basic Challenge of the 21st Century). NATO Review 14 February 2011. Available online: https://www.nato.int/docu/review/pl/articles/2011/02/14/wzrost-liczby-ludnosci-podstawowe-wyzwanie-xxi-wieku/index.html (accessed on 25 October 2020).
- Vollset, S.E.; Goren, E.; Yuan, C.-W.; Cao, J.; Smith, A.A.E.; Hsiao, T.; Bisignano, C.; Azhar, G.S.; Castro, E.; Chalek, J.; et al. Fertility, mortality, migration, and population scenarios for 195 countries and territories from 2017 to 2100: A forecasting analysis for the Global Burden of Disease Study. Lancet 2020, 396, 1285–1306. [Google Scholar] [CrossRef]
- Roser, M.; Ritchie, H.; Ortiz-Ospina, E. World Population Growth. 2013. Available online: https://ourworldindata.org/world-population-growth (accessed on 20 September 2020).
- Roser, M.; Ritchie, H.; Ortiz-Ospina, E. World Population Growth. 2019. Available online: https://ourworldindata.org/world-population-growth (accessed on 20 September 2020).
- Herrmann, D.L.; Shuster, W.D.; Mayer, A.L.; Garmestani, A.S. Sustainability for Shrinking Cities. Sustainability 2016, 8, 911. [Google Scholar] [CrossRef]
- Wolff, M.; Wiechmann, T. Urban growth and decline: Europe’s shrinking cities in a comparative perspective 1990–2010. Eur. Reg. Stud. 2017, 25, 122–139. [Google Scholar] [CrossRef]
- Bański, J.; Wesołowska, M. Disappearing Villages in Poland—Selected Socioeconomic Processes and Spatial Phenomena. Eur. Ctry. 2020, 12, 2. [Google Scholar] [CrossRef]
- Peters, D.J.; Hamideh, S.; Zarecor, K.E.; Ghandour, M. Using entrepreneurial social infrastructure to understand smart shrinkage in small towns. J. Rural Stud. 2018, 64, 39–49. [Google Scholar] [CrossRef]
- Mallach, A.; Haase, A.; Hattori, K. The shrinking city in comparative perspective: Contrasting dynamics and responses to urban shrinkage. Cities 2017, 69, 102–108. [Google Scholar] [CrossRef]
- Mallach, A. What we talk about when we talk about shrinking cities: The ambiguity of discourse and policy response in the United States. Cities 2017, 69, 109–115. [Google Scholar] [CrossRef]
- Dewar, M.; Thomas, J.M. (Eds.) The City After Abandonment; A Volume in the Series City in the Twenty-First Century; University of Pennsylvania Press: Philadelphia, PA, USA, 2013; p. 400. [Google Scholar]
- Rybczynski, W.; Linneman, P.D. How to save our shrinking cities. Public Interest 1999, 135, 30–44. [Google Scholar]
- Hollander, J.B.; Pallagst, K.; Schwarz, T.; Popper, F.J. Planning shrinking cities. Prog. Plan. 2009, 72, 223–232. [Google Scholar]
- Pallagst, K. Viewpoint: The Planning Research Agenda: Shrinking Cities—A Challenge for Planning Cultures. Town Plan. Rev. 2010, 81, 5. [Google Scholar] [CrossRef]
- Haase, A.; Rink, D.; Grossmann, K.; Bernt, M.; Mykhnenko, V. Conceptualizing Urban Shrinkage. Environ. Plan. A 2014, 46, 1519–1534. [Google Scholar] [CrossRef]
- Blanco, H.; Alberti, M.; Olshansky, R.; Chang, S.; Wheeler, S.M.; Randolph, J.; London, J.B.; Hollander, J.B.; Pallagst, K.; Schwarz, T.; et al. Shaken, shrinking, hot, impoverished, and informal: Emerging research agendas in planning. Prog. Plan. 2009, 72, 195–250. [Google Scholar] [CrossRef]
- Martinez-Fernandez, C.; Audirac, I.; Fol, S.; Cunningham-Sabote. Shrinking Cities: Urban Challenges of Globalization. Int. J. Urban Reg. Res. 2012, 36, 213–225. [Google Scholar] [CrossRef] [PubMed]
- Hollander, J. Moving Toward a Shrinking Cities Metric: Analyzing Land Use Changes Associated with Depopulation in Flint, Michigan. Cityscape 2010, 12, 133–152. [Google Scholar] [CrossRef]
- Pallagst, K. Shrinking cities in the United States of America: Three cases, three planning stories. Future Shrinking Cities 2009, 1, 81–88. [Google Scholar]
- Bontje, M. Facing the challenge of shrinking cities in East Germany: The case of Leipzig. GeoJournal 2005, 61, 13–21. [Google Scholar] [CrossRef]
- Pallagst, K.; Wiechmann, T.; Martinez-Fernandez, C. Shrinking cities. In International Perspectives and Policy Implications; Taylor & Francis: New York, NY, USA, 2014; p. 315. [Google Scholar]
- Xie, Y.; Gong, H.; Lan, H.; Zeng, S. Examining the shrinking city of Detroit in the context of socio-spatial inequalities. Landsc. Urban Plan. 2018, 177, 350–361. [Google Scholar] [CrossRef]
- Couch, C.; Cocks, M. Housing Vacancy and the Shrinking City: Trends and Policies in the UK and the City of Liverpool. Hous. Stud. 2013, 28, 499–519. [Google Scholar] [CrossRef]
- Lee, J.; Newman, G. Forecasting Urban Vacancy Dynamics in a Shrinking City: A Land Transformation Model. ISPRS Int. J. Geo-Inf. 2017, 6, 124. [Google Scholar] [CrossRef]
- Dyer, C.; Jones, R. (Eds.) Deserted Villages Revisited; University of Hertfordshire Press: Hatfield, PA, USA, 2010; p. 233. [Google Scholar]
- Di Figlia, L. Turnaround: Abandoned villages, from discarded elements of modern Italian society to possible resources. Int. Plan. Stud. 2016, 21, 278–297. [Google Scholar] [CrossRef]
- Wójcik, M. Odnowa wsi jako przedmiot badań geograficzno-osadniczych (Rural renewal as a study field of settlement geography). Rural Stud. 2017, 48, 7–18. [Google Scholar] [CrossRef]
- Runge, J. Kierunki i konsekwencje przemian obszarów wiejskich w Polsce: Próba uogólnienia. W: K. Gasidło, A. Twardoch (red.), Na wsi, czyli gdzie? Available online: https://rebus.us.edu.pl/handle/20.500.12128/8687 (accessed on 8 March 2021).
- Manakou, A. The Phenomenon of Rural Depopulation in the Swedish Landscape: Turning the Trends (Dissertation). 2018. Available online: http://urn.kb.se/resolve?urn=urn:nbn:se:bth-16290 (accessed on 11 December 2020).
- Jaszczak, A.; Kristianova, K.; Vaznonienė, G.; Zukovskis, J. Phenomenon of abandoned villages and its impact on transformation of rural landscapes. Manag. Theory Stud. Rural Bus. Infrastruct. Dev. 2018, 40, 467–480. [Google Scholar] [CrossRef]
- Potyra, M.; Waligórska, M. Prognoza ludności gmin na lata 2017–2030 (Municipal population forecast for 2017–2030). Available online: https://stat.gov.pl/obszary-tematyczne/ludnosc/prognoza-ludnosci/prognoza-ludnosci-gmin-na-lata-2017-2030-opracowanie-eksperymentalne,10,1.html (accessed on 12 December 2020).
- Kocur-Bera, K.; Pszenny, A. Conversion of Agricultural Land for Urbanization Purposes: A Case Study of the Suburbs of the Capital of Warmia and Mazury, Poland. Remote Sens. 2020, 12, 2325. [Google Scholar] [CrossRef]
- Sirgy, M.J. The psychology of quality of life. In Hedonic Well-Being, Life Satisfaction, and Eudaimonia; Springer: Dordrecht, The Netherlands, 2012; p. 621. [Google Scholar]
- Murgaš, F. Kvalita života a jej priestorová diferenciácia v okresoch Slovenska (Quality of life and its spatial differentiation in districts of Slovakia—in Slovak). Geografický časopis 2009, 61, 121–138. [Google Scholar]
- Murgaš, F. Geographical conceptualization of quality of life. Ekológia (Bratislava) 2016, 35, 309–319. [Google Scholar] [CrossRef]
- Veenhoven, R. Happiness. In Encyclopaedia of Quality of Life and Well-Being Research; Michalos, A.C., Ed.; Springer: Dordrecht, The Netherlands, 2014; pp. 2637–2641. [Google Scholar]
- Ostrowski, M. Deweloperzy wskazują na co ich klienci zwracają uwagę przy zakupie mieszkania (Developers indicate what their clients pay attention to when buying a flat). Sonda. Nieruchom. Aktualności Firmy Deweloperskie 2017. Available online: https://rynekpierwotny.pl/ (accessed on 11 December 2020).
- Kowalczyk-Kustra, O. Co determinuje wybór lokalizacji do zamieszkania? (What determines the choice of location for living?). Available online: https://prnews.pl/co-determinuje-wybor-lokalizacji-do-zamieszkania-11166 URL (accessed on 11 December 2020).
- Final report. DART: Declining, Ageing and Regional Transformation, 2012, (Potsdam: Investitionsbank des Landes Brandenburg). Available online: https://keep.eu/projects/454/Declining-Ageing-and-Regional-EN/URL (accessed on 15 January 2021).
- Google Maps. Available online: http://google.com/maps/ (accessed on 29 September 2020).
- Statistical Data. Available online: http://gus.gov.pl (accessed on 20 September 2020).
- Area Data. Available online: http://gugik.gov.pl (accessed on 20 September 2020).
- Quality of Soil Data. Available online: http//iunig.pulawy.pl (accessed on 20 September 2020).
- Threat Data. Available online: https://www.gov.pl/web/kgpsp/ (accessed on 27 September 2020).
- Crime Data. Available online: http://policja.pl (accessed on 27 September 2020).
- EU Subsidy Map. Available online: https://mapadotacji.gov.pl/ (accessed on 27 September 2020).
- Distance Data. Available online: https://odleglosci.info/trasa (accessed on 28 September 2020).
- Bus Data. Available online: http://jakdojade.pl (accessed on 29 September 2020).
- Talavera, L. Dependency-Based Feature Selection for Clustering Symbolic Data. Intell. Data Anal. 2000, 4, 1–13. [Google Scholar] [CrossRef]
- Everitt, B.S.; Lanau, S.; Leese, M.; Stahl, D. Cluster Analysis, 5th ed.; Wiley: London, UK, 2011; Volume 38, pp. 1–110. [Google Scholar]
- Abonyi, J.; Feil, B. Cluster Analysis for Data Mining and System Identification; Birkhauser: Berlin, Germany, 2007; Volume 24, pp. 1–46. [Google Scholar]
- Stanisz, A. Przystępny kurs statystyki z zastosowaniem STATISTICA PL na przykładach z medycyny; Statsoft: Kraków, Poland, 2007. [Google Scholar]
- Migała-Warchoł, A. Wykorzystanie analizy skupień do klasyfikacji powiatów województwa podkarpackiego według wybranych wskaźników rozwoju społeczno-gospodarczego. Metod. Ilościowe W Bad. Ekon. 2011, XII/2, 249–258. [Google Scholar]
- Korzeniewski, J. Metody selekcji zmienny w analizie skupień (Variable selection methods in cluster analyze). Łódź 2012, 190. [Google Scholar] [CrossRef]
- Cormack, R. A review of classification (with discussion). J. R. Stat. Soc. 1971, 134, 321–361. [Google Scholar] [CrossRef]
- Stoddard, M. Standardization of measures prior to cluster analysis. Biometrics 1979, 35, 765–773. [Google Scholar] [CrossRef] [PubMed]
- Milligan, G. Clustering Validation: Results and Implications for Applied Analyses. In Clustering and Classification, Red; Arabie, P., Hubert, L., de Soete, G., Eds.; World Scientific: Singapore, 1996. [Google Scholar]
- Description Data. Available online: http://polskawliczbach.pl (accessed on 30 November 2020).
- Frankowski, J. Attention: Smog alert! Citizen engagement for clean air and its consequences for fuel poverty in Poland. Energy Build. 2020, 207, 109525. [Google Scholar] [CrossRef]
- Woźniak, J.; Krysa, Z.; Dudek, M. Concept of government-subsidized energy prices for a group of individual consumers in Poland as a means to reduce smog. Energy Policy 2020, 144, 111620. [Google Scholar] [CrossRef]
- Kim, S. Design strategies to respond to the challenges of a shrinking city. J. Urban Des. 2019, 24, 49–64. [Google Scholar] [CrossRef]
- Weaver, R. Palliative planning in an American shrinking city—Some thoughts and preliminary policy analysis. Community Dev. 2017, 48, 436–450. [Google Scholar] [CrossRef]
- Spatial Information System. Available online: http://www.geoportal.gov.pl (accessed on 23 February 2021).
- Pozezdrze Atractions. Available online: http://pozezdrze.pl/atrakcje (accessed on 8 January 2021).
- Sepopol. Available online: www.e-podroznik.pl (accessed on 10 December 2020).
- Staples, M. The disappearing village. Aust. Folk. 2010, 25, 9–21. [Google Scholar]
- Marras, C.; Pau, F.; Zanata, R. Resound/Su Sonu Torrau in Assolo—A case study on soundscape enhancement as a means to impact on the depopulation process in a disappearing village of Sardinia—A Sense of Place. Balance-Unbalance 2017. Available online: http://balance-unbalance2017.org (accessed on 5 January 2021).
- Carabatsos, E.G. The Disappearing Village: Anderson, Glaspell, and the Modern American Landscape. Bachelor Thesis, Wesleyan University, Middletown, CT, USA, 2010. [Google Scholar] [CrossRef]
- Wiechman, T. Europe: Islands of growth in a sea of shrinkage, In Shrinking Areas: Front Runners in Innovative Citizen Participation; Haase, A., Ed.; EUKN: The Hague, The Netherlands, 2012. [Google Scholar]
- Schlappa, H.; Neill, W.J.V. Cities of Tomorrow—Action Today. In URBACT II Capitalization. From Crisis to Choose Re-Imagining the Future in Shrinking Cities; URBACT 5: Paris, France, 2013. [Google Scholar]
- Rink, D.; Haase, A.; Bernt, M.; Großmann, K. Addressing Urban Shrinkage across Europe—Challenges and Prospects Shrink Smart Research Brief No. 1, November 2010 On behalf of the Shrink Smart Consortium. Helmholtz Center for Environmental Research—UFZ, Leipzig. Available online: https://shrinksmart.ufz.de/data/D9%20Research%20Brief%20214223.pdf (accessed on 5 January 2021).
- Council of the European Union and Hungarian Presidency. The Impact of European Demographic Trends on Regional and Urban Development; Council of the European Union and Hungarian Presidency: Budapest, Hungary, 2011. [Google Scholar]
- Schwedler, H.U. Polishing Diamonds: Utilising ‘Undiscovered’ Potentials in Shrinking Cities (Unpublished Working Paper of the URBACT Workstream on Shrinking Cities and Demographic Change). Friendly Cities: A Framework for Action; UNICEF Innocenti Research Center: Florence, Italy, 2012. [Google Scholar]
- European Commission, Committee of the Regions, and AGE Platform Europe. How to Promote Active Ageing in Europe; AGE Platform Europe: Brussels, Belgium, 2011. [Google Scholar]
- ESPON. Shrinking Rural Regions in Europe. Towards Smart and Innovative Approaches to Regional Development Challenges in Depopulating Rural Regions. 2017. Available online: https://www.espon.eu/sites/default/files/attachments/ESPON%20Policy%20Brief%20on%20Shrinking%20R ural%20Regions.pdf (accessed on 24 February 2020).
- ADAPT2DC, European Strategy for Regional Responses to Demographic Changes. 2014. Available online: https://www.soc.cas.cz/sites/default/files/publikace/europeanstrategy_adapt2dc.pdf (accessed on 24 February 2021).
- ADAPT2DC, New Innovative Solutions to Adapt Governance and Management of Public Infrastructures to Demographic Change. 2014. Available online: https://www.soc.cas.cz/sites/default/files/publikace/adapt2dc_wp6_e-book_20140517.pdf (accessed on 24 February 2021).
- EU Committee of Regions. The Impact of Demographic Change on European Regions, Brussels. 2016. Available online: https://espas.secure.europarl.europa.eu/orbis/sites/default/files/generated/document/en/Impact_demographi c_change_european_regions.pdf (accessed on 24 February 2021).
- Szukalski, P. Depopulacja: Dlaczego o niej nie mówimy? Demografia i Gerontologia Społeczna—Biuletyn Informacyjny. Available online: http://dspace.uni.lodz.pl (accessed on 24 February 2021).
- Van Oostrom, M. What People Want, Where People Live: New Housing Policy in the Netherlands. J. Hous. Built Environ. 2001, 16, 307–318. [Google Scholar] [CrossRef]
- EU 2016. The Impact of Demographic Change on European Regions. Available online: https://espas.secure.europarl.europa.eu/ (accessed on 23 February 2021).
- NIK 2020. Coraz mniej mieszkańców—niekorzystny trend na Opolszczyźnie. Available online: https://www.nik.gov.pl/aktualnosci (accessed on 23 February 2021). (In Polish)
Publisher’s Note: MDPI stays neutral with regard to jurisdictional claims in published maps and institutional affiliations. |
© 2021 by the authors. Licensee MDPI, Basel, Switzerland. This article is an open access article distributed under the terms and conditions of the Creative Commons Attribution (CC BY) license (http://creativecommons.org/licenses/by/4.0/).