Article

Financial Analysis for Improving River Water Quality through Introduction of Organic Agriculture

Department of Agricultural and Resource Economics, Kangwon National University, Chuncheon 24341, Korea
*
Author to whom correspondence should be addressed.
Sustainability 2021, 13(5), 2960; https://doi.org/10.3390/su13052960
Submission received: 30 January 2021 / Revised: 26 February 2021 / Accepted: 3 March 2021 / Published: 9 March 2021

Abstract

:
With scientific awareness of the main source of water pollution from conventional agriculture along the Dagu River Basin, Qingdao, China, this study aims to identify economic efficiency in introducing an environmentally friendly agricultural policy instrument. For more exact financial analysis, considered were benefits obtained by residents and farmers from water quality improvement and conversion cost from conventional to organic agriculture. A bivariate probit model was used to estimate the mean willingness to pay (WTP) for improving the water quality of the river and determinants affecting residents’ WTP were identified. Empirical results show that mean WTPs are CNY 5.71 (USD 0.83) and CNY 26.47 (USD 3.84) per month per household, respectively. The opportunity cost of volunteering activity hours is CNY 222.77 (USD 32.39) per month per household. Application to the residents of Qingdao would obtain aggregate total benefits from improving the river water quality of CNY 7.54 billion (USD 1.09 billion)- CNY 8.23 billion (USD 1.19 billion) per year. Farmers’ profit obtained by value transfer and price index adjustment is CNY 46.61 billion (USD 6.75 billion) from organic agriculture, which is more profitable. After the implementation of organic agriculture policy, therefore, the total benefits of farmers and residents are much higher than the total cost of conversion to organic agriculture. The study results could provide a preponderant economic indicator to policy decision makers for water quality improvement projects.

1. Introduction

Water is one of the most important natural resources and necessary for any form of life to survive. Providing water for rural and urban residents [1], rivers play a significant multidimensional function in human well-being. However, rivers have been heavily polluted mostly in many developing countries because of agriculture, industry, and urban development [2]. Improving river water quality can help reduce health risks and restore lost water supply services due to continuous pollution [2].
Agricultural run-off has become a main source of water pollution as non-point source pollution [3,4] because of the excessive use of fertilizers, herbicides, and pesticides in agricultural production [5]. The Chinese government has been implementing policies related to the protection of water quality. The Law on Prevention and Control of Water Pollution applied in 1984 is to reduce and control water pollution, protect and enhance the environment and ensure the positive use of water resources [6]. Environmental Quality Standard for Surface Water (GB3838-2002) enforced in 2012 is to prevent water pollution and protect surface water. The National Census of Pollution Source shows that agriculture is the major source of environmental and water pollution, but a unified legal framework for comprehensive water and agricultural management has not yet been formed [7].
Chinese consumers are increasingly demanding organic foods with increasing concern for food safety due to excessive pesticide residues [8]. Agricultural policies pay more attention to the quality-oriented sustainable approach. In this context, this study proposes to convert from conventional to organic agriculture as one of the alternative measures to improve water quality, which is suggested in Lee et al. [9]. During the transition period, however, it may need huge conversion costs and compensation for agricultural income gaps. Then, a decision-making criterion could be needed with a trade-off relationship between the benefits for river water quality improvement and the conversion costs to organic agriculture.
With a limited budget constraint, it is very important to evaluate the benefits and costs of the river water quality improvement project before the budget allocation. A cost-benefit analysis (CBA) is an economic instrument that uses the feasibility of public investment as a basis for policymaking [10]. In the US, all major regulations must be followed by a regulatory analysis estimating the benefits and costs of the rules, and the agency must show that the economic benefits are higher than the costs, unless prohibited by the legislative authority of a specific policy [11]. In England, all investment proposals should be justified by CBA [12]. Therefore, it is recommended to estimate the public value of improving river water quality.
The benefits of improving water quality will not be traded on the actual market [13]. It is difficult to estimate the monetary value of non-market goods without price [14]. A widely used approach is to ask people to state their willingness to pay (WTP) for environmental goods [15]. The contingent valuation method (CVM) is known as the most common method for monetary quantification of non-market values [16]. CVM includes creating a hypothetical market by using survey questionnaires to elicit respondents’ preferences by assessing their WTPs for river water quality improvement projects [15]. Although previous studies in China have estimated the WTP for water quality improvement using CVM [17,18,19,20], no CVM study on the conversion of agricultural practices in China still exists [9].
The purpose of this study is to investigate economic efficiency in water quality improvement of the Dagu River. Under the current situation of water pollution, two stakeholder groups could be considered—residents and farmers. Residents of Qingdao might be sufferers of water pollution, while farmers might be polluters and sufferers. With water quality improvements, thus, residents would turn out to be the beneficiaries. On the other hand, farmers would be sufferers since they have to change the current conventional agricultural practice with chemical pesticides and fertilizers with the introduction of organic agriculture. They would, however, be also become the beneficiaries of clean river water. Therefore, this study explores whether or not the introduction of organic agriculture as a policy instrument for water quality improvement is economically efficient.
This study was designed to quantify residents’ WTPs for improving river water quality by shifting from conventional to organic agriculture. Double-bounded dichotomous choice (DBDC) and open-ended (OE) questions of CVM were used to elicit residents’ WTPs. For those who want water quality improvement with volunteering work under poor income constraint, the opportunity cost approach was applied. For the farmers’ side, possible agricultural income gaps from conversion to organic agriculture were calculated through value transfer from the previous study and its price index adjustment. Accordingly, the study can provide a preponderant economic indicator of policymakers’ decision-making of water-related infrastructure projects.

2. Materials and Methods
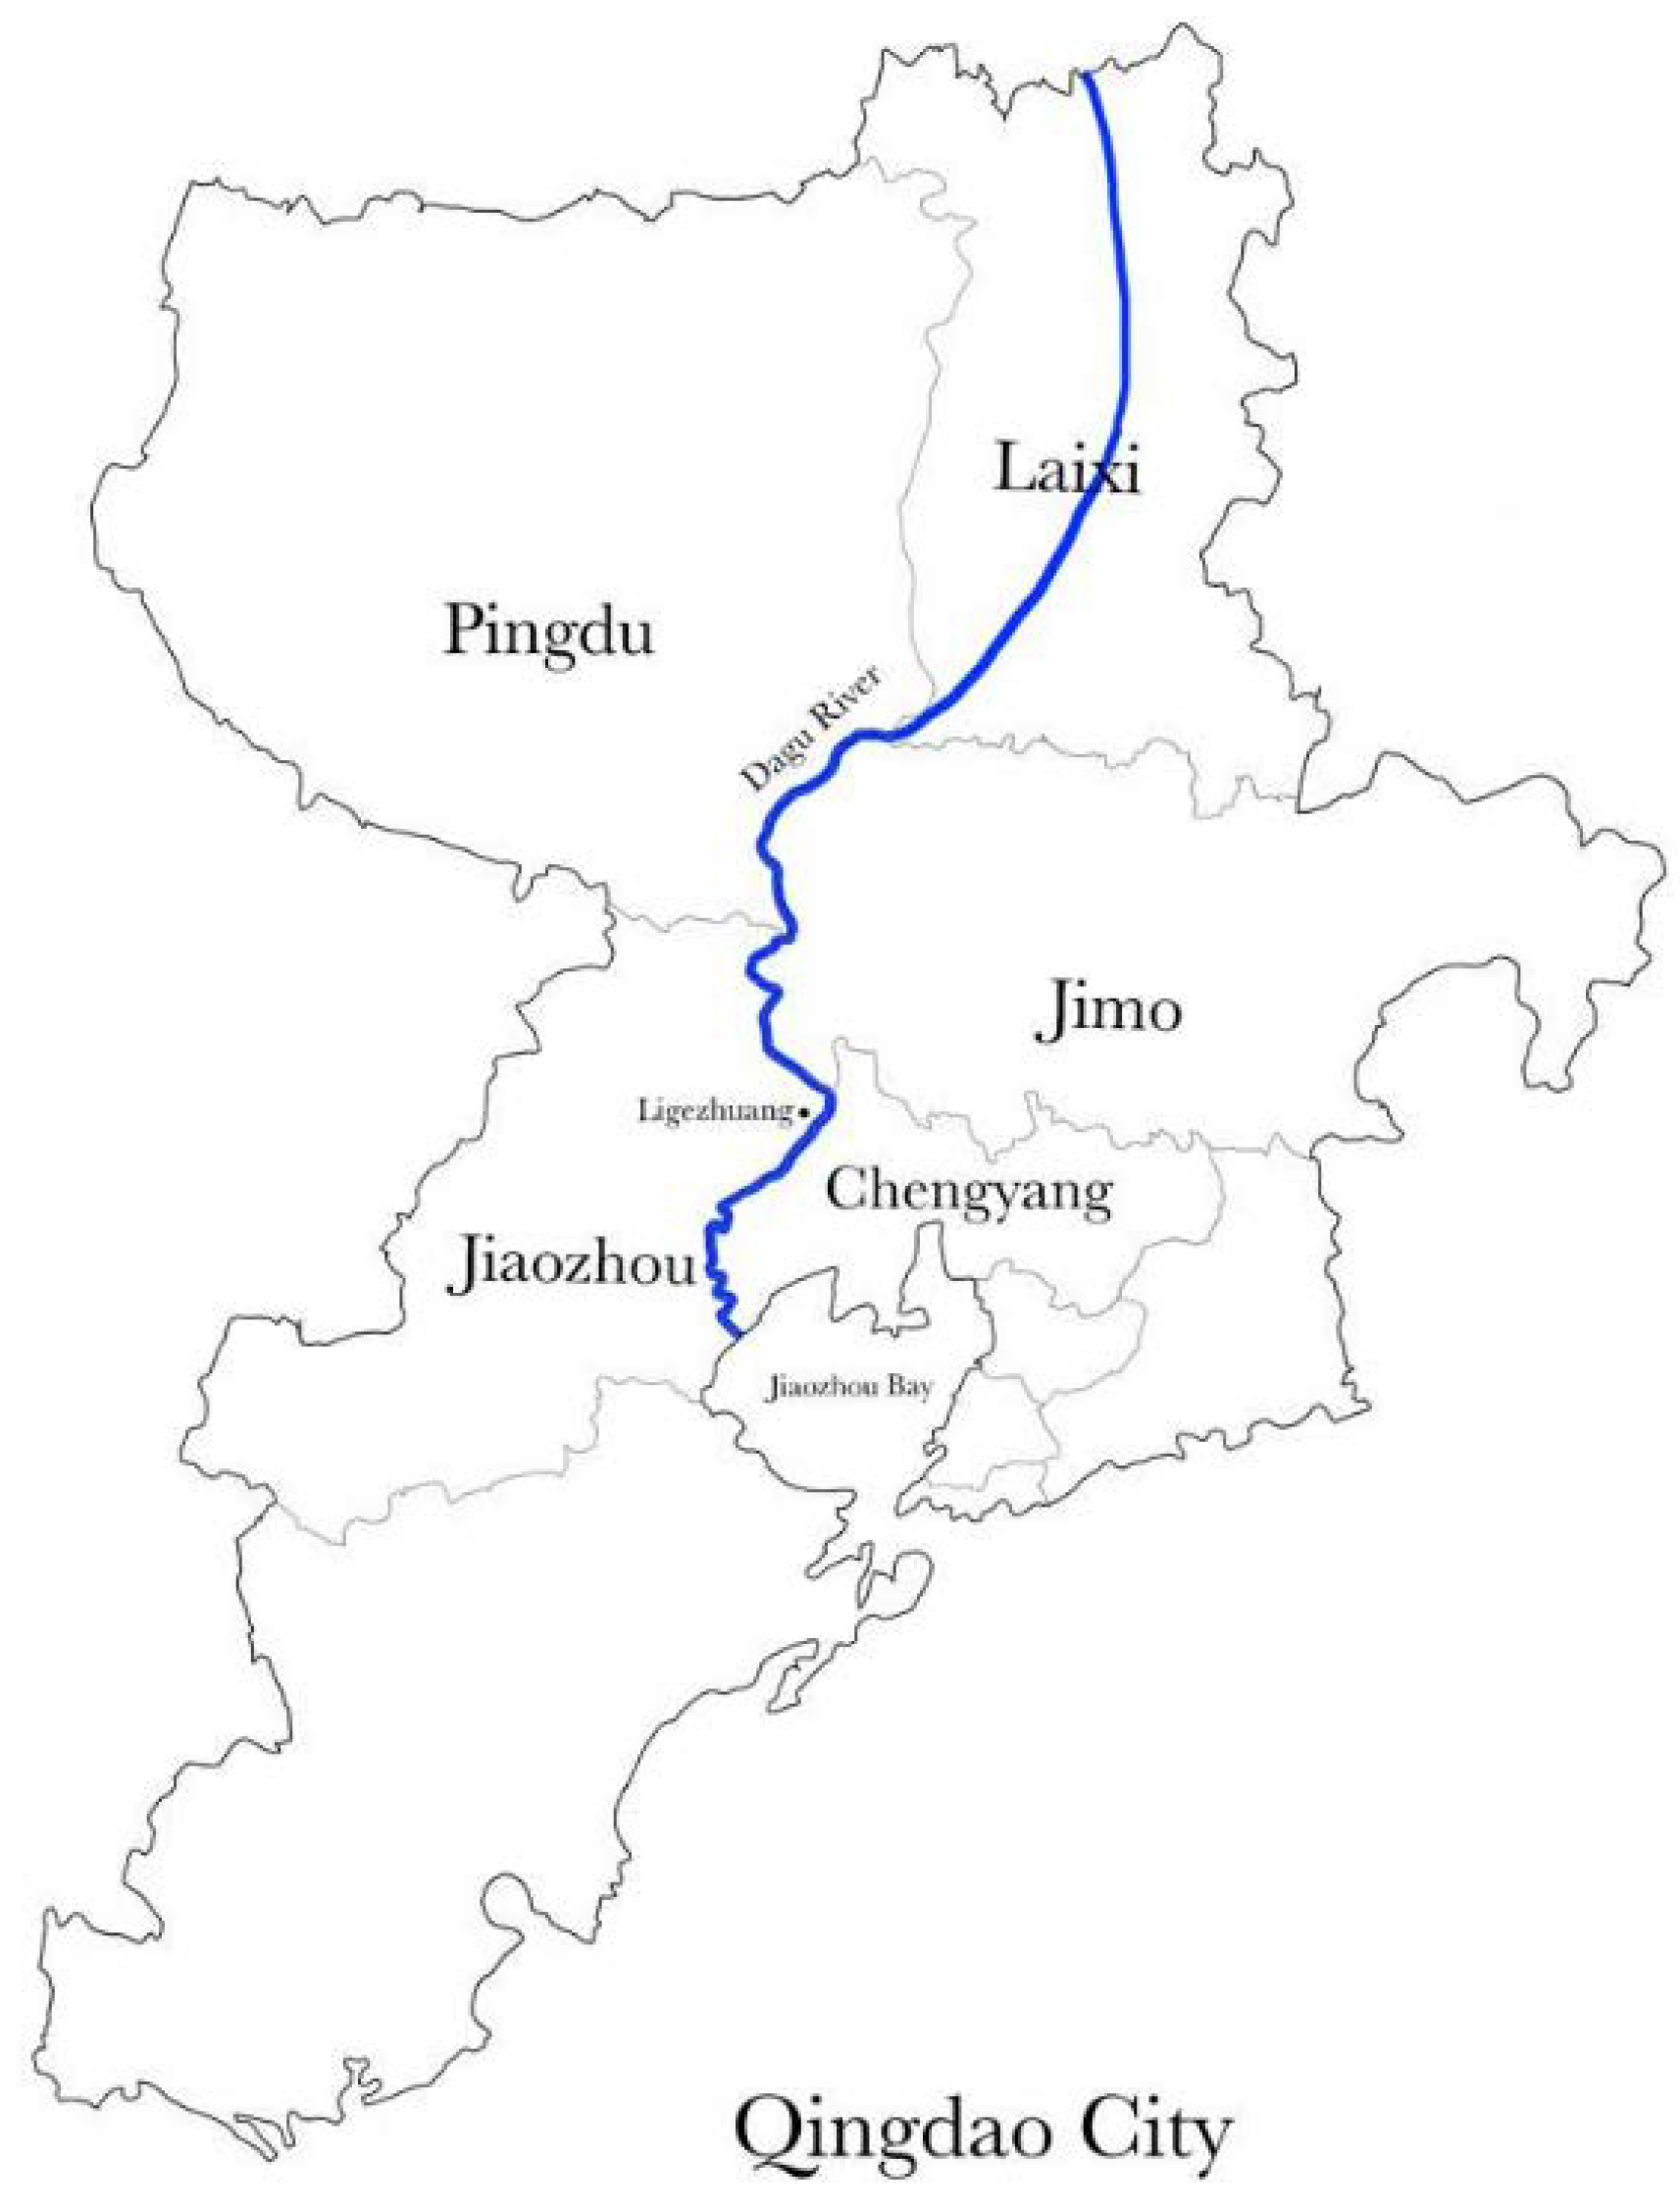
2.1. Study Site

The Dagu River Basin is situated on the north side of Jiaozhou Bay in Shandong Province, China [21]. The river originates from Fushan Town in Zhaoyuan, then flows through Laixi, Pingdu, Jimo, Jiaozhou, and Chengyang of Qingdao, and finally flows into Jiaozhou Bay [22] (Figure 1). The total length is 179.9 km, and the total basin area is 4655.3 km2 [23].
In the basin, there are eight large and medium-sized reservoirs including Chanzhi and Yinfu [24]. Qingdao covers an area of 11,293 km2, has seven districts and three county-level cities, and has a population of approximately 9.5 million in 2019 [25]. Since 1981, local residents have been relying on the groundwater of the Dagu River as their drinking water source [26]. It is the largest and most stable water source in Qingdao, accounting for about 45% of the total water consumption [27], and is known as the Qingdao’s Mother River.
Due to the poor flood control capacity of the Dagu River, pollution in some river sections, and low level of urbanization on both sides of the river, the development of the Dagu River Basin has been restricted [28]. From 2012 to 2015, the Qingdao Municipal Government, therefore, implemented the “Dagu River Governance Project,” with a cumulative investment of about CNY 0.7 billion (USD 0.1 billion, approximately USD 1 = CNY 6.9 in 2019) [29]. Specifically, it includes seven goals such as flood control, water resource development, road transportation, ecological construction, environmental protection, modern agricultural base construction, small-town construction, and new rural demonstration construction [28]. This is the first large-scale comprehensive governance of the Dagu River Basin in the history of Qingdao water conservancy [28].
Especially in recent years, human activities, however, have led to eutrophication and heavy metal pollution in the Dagu River [30,31]. Xiong et al. [21] found that NO3 pollution, mainly from fertilizers and pesticides, caused the pollution of the groundwater in the Dagu River Basin. About 75% of the land in the Dagu River Basin is used for agriculture, and the main crops are wheat, peanuts, corn, vegetables, and fruit trees [26]. Agriculture has been regarded as the main pollution source of the Dagu River [26].

2.2. Research Design

The survey of this research is designed based on the CVM to quantify benefits obtained from improving the water quality of the Dagu River. In order to secure the validity of the survey, the drafted questionnaire was pre-tested to minimize potential problems and was revised. The questionnaire should allow respondents to clearly understand each question, especially the hypothetical scenario, payment vehicle, and willingness to pay [32]. The questionnaire was drafted in Korean, translated into Chinese, and edited into an online format [33]. With reference to the results of 16 pre-testing questionnaires, the final questionnaire was formed. The questionnaire consists of three parts, namely, (1) socio-economic characteristics of respondents, (2) attitude toward water quality, and (3) willingness to pay for river water quality improvement.
The first part is the detailed information of socio-economic characteristics, such as gender, age, marital status, household size, distance to the river, residence, education level, job, and household income. The second part is related to the importance of water resource, frequency and purpose of visit, evaluation of current water quality and surrounding environment, pollution experience and cause, need for river water quality improvement of the river, level of expected improvement, evaluation of government efforts, participation in the environmental activity.
The last part deals with a hypothetical scenario for improving water quality. Supposed was the Qingdao Municipal Government would intend to improve the water quality of the Dagu River (Table A1 and Table A2) through the introduction of organic agriculture policy. Residents would be asked to pay additional environmental taxes so that this project could be successfully implemented. The environmental tax was used as a payment vehicle to reveal the respondents’ WTPs because it is a mandatory payment to avoid free-riding [9]. Respondents’ WTPs are elicited in two different format questions—one is the DBDC question with fixed bid value, and the other is the OE question of maximum WTP. For DBDC questions, the initial bids in the pre-test survey were set based on 0.3% annual per capita disposable income CNY 42,019 [34] in Qingdao in 2019. The initial bids are 5, 10, 15, 20. The sets of the lower and upper bids are, in turn, half and double of the initial bids, as follows: (2.5, 10), (5, 20), (7.5, 30), and (10, 40). It is found that the highest WTP is usually 1 or 2. It may be that the initial values were too higher for respondents to afford. Finally, based on the local average monthly tap water fee CNY 10–12 (USD 1.4–1.7), four types of initial bids were re-determined as follows: 2, 5, 8, 11. Their follow-up values are offered by decrease and increase of CNY 1, in turn, as follows: (1, 3), (4, 6), (7, 9), and (10, 12). These bid values are randomly distributed. At the end of the questionnaire, an opportunity cost question on working hours willing to spend for volunteering activity [35] to improve the water quality of the Dagu River was asked.

2.3. Data Collection

Data were collected by an online survey. Commonly used survey methods include telephone surveys, mail surveys, face-to-face interviews, and online surveys [36]. Since some of them have limits to use such as difficulty in explanation without visible information for phone surveys, the low response rate for email surveys, and high costs for face-to-face interviews, their uses have been decreasing. On the other hand, online surveys have been increasingly used. An online survey has many advantages. First, it is designed in a software system, and respondents can fill it in anywhere, which is very convenient [37,38]. Second, it greatly reduces the time cost of data collection and data input [38]. Third, respondents have enough time to think about their answers, especially privacy questions.
Residents in Ligezhuang located along the Dagu River were chosen as the respondents. Those who reside far away from the river may express zero value or give up this survey since they may rarely understand the current status of the river [32]. Although it may not be convincing to choose a town as the representative of the entire city [39], it can cover some of the socio-economic characteristics of Qingdao.
The survey was conducted from January 2020 to February 2020. The questionnaire was designed so that it took about 4 min to be completed, and rewards were provided to the respondents who participated in the survey. A total of 349 questionnaires were collected, 68 of which were deleted with inconsistent content, and 281 observations (obs.) were finally used for analysis.

2.4. Econometric Model

A double-bounded dichotomous choice (DBDC) has a binary answer of “Yes” and “No”. A bivariate probit model was used to analyze the data by the statistical software, Stata (StataCorp LP, v.2015). The first equation is used to analyze the results of the first WTP, b i d 1 , and the second equation is used to analyze the results of the follow-up WTP, b i d 2 [40]. The empirical structure model is as follows:
B i d 1 _ y n = α 0 + α 1 b i d 1 + α 2 X + α 3 Z + ε 1 B i d 2 _ y n = β 0 + β 1 b i d 2 + β 2 X + β 3 Z + ε 2 ,
where B i d 1 _ y n is a dummy variable, such that B i d 1 _ y n = 1 if the respondent is willing to pay b i d 1 and B i d 1 _ y n = 0 if the respondent is not willing to pay. The same applies to the follow-up WTP, b i d 2 . Variables of b i d 1 and b i d 2 are the first and second WTP bids, respectively. The symbol X represents a vector of socio-demographic variables, Z represents a vector of other variables related to river water quality improvement. α 0 , β 0 are constant terms, α 1 , α 2 , α 3 and β 1 , β 2 , β 3 are regression coefficients, ε 1 , ε 2 are error terms.
Thus, the probability of responses has four outcomes, which are “Yes–Yes (YY),” “Yes–No (YN),” “No–Yes (NY),” “No–No (NN).” The four answers are represented by P i Y Y , P i Y N , P i N Y , P i N N , respectively.
P i Y Y = 1   ( i th   respondent s   response   is   Yes Yes ) P i Y N = 1   ( i th   respondent s   response   is   Yes No ) P i N Y = 1   ( i th   respondent s   response   is   No Yes ) P i N N = 1   ( i th   respondent s   response   is   No No )
Based on these, the DBDC log-likelihood function is:
ln L = i = 1 N   [ I i Y Y ln P i Y Y + I i Y N ln P i Y N + I i N Y ln P i N Y + I i N N ln P i N N ] ,
where I i Y Y , I i Y N , I i N Y , I i N N , are binary-valued indicator variables. The mean W T P D B D C is calculated according to the method of Krinsky and Robb [41], with a 95% confidence interval and 5000 repetitions. The mean W T P D B D C can be obtained as
m e a n   W T P D B D C = α β   ,
where α is the estimated constant term or other independent variables, and β is the coefficient of the bid values to respondents.
For OE format, the question produces a set of maximums W T P i i = 1 i for n   respondents in the survey. The mean W T P O E can be estimated as
m e a n   W T P O E = W T P i n
The total economic benefit is obtained by multiplying the mean WTP by the total population size. The following formula is used:
T o t a l   v a l u e = m e a n   W T P D B D C , O E × T o t a l   h o u s e h o l d s

3. Results

3.1. Socio-Economic Characteristics

Table 1 shows a summary of the socio-economic characteristics of the respondents. Regarding gender, 46.0% of the respondents are male, and 54.0% of them are female. Overall, 68.0% of the respondents are between 20 years old to 39 years old, and 82.2% of them are married. Family members are greater than and or equal to three, and families with less than or equal to five members account for 58.7% of the sample. Of the respondents, 55.5% have lived in the survey area for more than 10 years, and 61.6% live within 3 km from the river (within 30 min. on foot). Respondents with middle school and high school levels account for 64.4%. Housewives accounted for 21.4%, company staff 25.6%, and self-employed 19.2% of the respondents. Most of the respondents’ monthly household income is less than CNY 5000, accounting for 68.7% of the sample.
The data were selected randomly, which is necessary to verify the representativeness of the sample [36,38]. Table 2 shows a comparison of some substantial socio-economic characteristics of the sample and those of the population, and it is found that there is not much difference between them. The survey data can, thus, represent the actual population characteristics of Qingdao.

3.2. WTP Response

The distribution of responses to WTP in the DBDC questions is shown in Table 3. According to the initial bid, the questionnaires are classified as to be four types—A, B, C, and D. It is found that as the initial bid increased, the number of respondents who answered Yes–Yes decreased, while the number of respondents who answered No–No increased [42]. For example, when the initial bid is CNY 2, the Yes–Yes answer is 37.3%, and when the initial bid is CNY 11, it is 11.8%. For No–No answer, when the initial bid is CNY 2, it is 13.2%, and when the initial bid is CNY 11, it is 33.6%, which is two times that of CNY 2. This trend shows that the quality of the data obtained from this survey is appropriate for WTP analysis [42]. In addition, the proportion of respondents who answered No–No is very high at 44.1%. This means that they might be free riders or they might not have enough money for it even though they are aware of water pollution.
Figure 2 lists the distribution of the maximum WTP values for improving the water quality of the Dagu River by OE question. CNY 1 per month is the most frequent amount (66 obs.), then CNY 10 (46 obs.), and CNY 5 (37 obs.). Overall, 34 people answered zero, and 27 people did not answer.
On the question of whether to support improving water quality and willing to pay the additional tax, Table 4 summarizes the responses to this question. Overall, 8.9% of the sample, i.e., 25 respondents appealed negative answers. Among them, 13 respondents think the government should take responsibility. Four respondents cannot afford the extra amount. The other four respondents suspected that the money paid would not be used to improve water quality.

3.3. Model Estimation Results

Based on economic theory and previous empirical findings, several explanatory variables were selected for analysis. Table 5 shows the estimation results of the bivariate probit model. In the CVM study, the important variable is “income.” In this model, income and residents’ WTP are positively correlated and statistically significant, which proves the validity and reliability of our research [43]. The negative sign of the coefficient of the bid amount means that the higher the bid amount, the more likely it is to answer “No” to WTP. This indicates that in the CVM survey using multiple bid amounts, the WTP data in this study can be used for analysis [44]. Water quality is statistically significant and negatively correlated with WTP. Satisfaction with the government and environmental activities are statistically significant and have a positive relationship with WTP.

3.4. Comparison of Mean WTPs

The estimations of the mean WTPs from DBDC and OE format questions are shown in Table 6. The Mean WTP of DBDC questions is CNY 5.71 (USD 0.83) per month per household and statistically significant at 1% level, accounting for 0.16% of annual per capita disposable income in Qingdao [34]. This result is similar to the 0.20% obtained by Jianjun et al. [20]. The mean WTP with OE question is CNY 26.47 (USD 3.84) per month per household with a min WTP of zero and a max WTP of CNY 3000 (USD 435).
The average time of volunteering activity to improve the water quality of the Dagu River is 3.06 h per week (Table 7). With the application of the minimum hourly wage CNY 18.2 (USD 2.64) in Qingdao in 2019, the opportunity cost of volunteering work hours would be CNY 222.77 (USD 32.29) per month per household. The actual mean WTPs would, thus, be estimated as mean WTPs plus the opportunity cost of volunteering hours. The mean WTP would be, in reality, ranging from CNY 228.48 (USD 33.11) per month to CNY 249.24 (USD 36.12) per month per household, respectively.

3.5. Aggregate Total WTP

Multiplying each total mean WTP by the total number of Qingdao households will produce the aggregate total benefits (Table 8). The number of Qingdao households was 2,750,800 in 2019 [45], and hence the aggregate total benefits per year would range between CNY 7.54 billion (USD 1.09 billion) and CNY 8.23 billion (USD 1.19 billion), respectively. This means that households of Qingdao would be annually benefited from improving water quality in the Dagu River.

3.6. Financial Analysis

Finally, this study conducted a financial feasibility analysis to compare the total benefit for improving river water quality through organic agriculture and the conversion cost from conventional to organic agriculture. Lee et al. [46] conducted a survey of 68 environmentally friendly farming farmers in South Korea in 2012 and calculated the annual average cost, revenue, and profit per hectare. The data from environmentally friendly farming is applied to the organic agriculture data in this study. Considering the price indexes and exchange rate by value transfer [47], these data were converted into 2019 data (Table 9). Total profit and total costs are CNY 69,843 (USD 10,122) and CNY 57,165 (USD 8,285) per hectare per year, in turn. Applying the total sown area of farm crops of 667,300 hectares in Qingdao in 2019 [34], the total profit from the introduction of organic agriculture can be calculated to be CNY 46.61 billion (USD 6.75 billion).
As shown in Table 10, residents would have benefited from CNY 7.54 billion–CNY 8.23 billion (USD 1.09 billion–USD 1.19 billion) from water quality improvement through the introduction of organic agriculture. Consisting of both those of consumers and profits of farmers, accordingly, the benefit will be CNY 54.15 billion–CNY 54.84 billion (USD 7.85 billion–USD 7.95 billion).
Comparing the benefit and the cost with implementation of organic agriculture policy, therefore, net benefit will be CNY 16.00 billion–CNY 16.68 billion (USD 2.32 billion–USD 2.42 billion), which is economically efficient. However, the break-even point in the case of conversion to organic farming is reported to be between three to six years after its introduction [48,49], which means the net befit from the introduction of organic agriculture policy would be sharply increasing since conversion cost is disappearing.

4. Discussion

4.1. Preliminary Survey Results

The initial part of the survey included many questions about respondents’ attitudes and behaviors toward improving water quality. First, using the 5-point Likert scale, the question about the importance of water quality protection was asked, 95.7% of respondents checked “very important,” which indicates that the public has a high awareness of water resource safety [50]. For the question of whether the water quality of the Dagu River needs to be improved, 83.3% of respondents evaluated it to be “very necessary,” which means that most respondents want to obtain good water quality and have positive attitudes toward improving water quality [51]. Overall, 91.1% of respondents are willing to pay additional taxes, which means that the current water quality of the Dagu River does not meet residents’ needs. The Qingdao Municipal Government is recommended to actively consider implementing projects to improve water quality.
Industrial sewage has the highest response of 34.9% to the question of the causes of water pollution in the Dagu River, while agricultural pollution accounts for just 4.6%. This result, however, cannot be supported by other scientific studies [26,52]. This might be caused by that the public might not pay attention to it because the impact of agriculture on water pollution is invisible [53]. Therefore, this research is very important in combining river water quality improvement with changing farming methods.

4.2. Determinants of WTP

The demographic characteristics of age, gender, marriage status, household size, education level, and job have no statistically significant influence on WTP [38,51,54]. Others such as distance to the river and residence have no statistically significant effect on WTP, which is inconsistent with other studies [55,56,57]. With the statistical significance, a positive relationship between income and residents’ WTP has been also confirmed in previous studies [43,44,55]. This means that respondents with higher income will pay more to have better water quality. The first bid amount is negatively related to the probability of being willing to pay the first bid amount, and the second bid amount is the same as the first one [40]. Awareness of current river water quality is negatively related to residents’ WTP. This means that if the current water quality is considered to be good, the residents’ WTP for improving water quality will be less. As the basic water quality level increases, the diminishing marginal value of water quality improvement is in line with economic theory [11]. Satisfaction with the government has a significantly positive impact on WTP. This implies that respondents with higher trust in local government agencies have higher WTP. This is consistent with Chatterjee et al. [58]. Finally, environmental activity is positively related to WTP. Respondents who have participated in environmental protection activities have higher WTP [50].

4.3. Financial Analysis

Previous studies showed that changes in agriculture have great benefits for improving river water quality. Lant and Roberts [59] found that the value of improving river quality by removing riparian cropland exceeded the value of these lands. Choi et al. [60] found that the benefits of abandoning highland agriculture to improve water quality are more than the benefits of highland agriculture activities.
The lack of information on the economic values of improving river water quality is a barrier to the budget allocation of river water quality improvement projects [61]. If the benefit of the project exceeds its cost considering all stakeholders, then the project is evaluated to be economically efficient. If not, however, the project will not be supported by all stakeholders and might be difficult to be implemented [36]. Therefore, the economic benefit evaluation of the river water quality improvement project can help determine the priority.

5. Conclusions

This study estimated residents’ WTP for improving the water quality of the Dagu River by the conversion from conventional to organic agriculture and conducted a financial analysis. The residents would have benefited from CNY 7.54 billion (USD 1.09 billion)–CNY 8.23 billion (USD 1.19 billion) per year from water quality improvement. The farmers’ benefit of CNY 46.61 billion (USD 6.75 billion) per year through organic agriculture was calculated with value transfer and price index adjustment. The total cost to implement organic agriculture would spend CNY 38.15 billion (USD 5.53 billion) per year during its conversion. As a result, the aggregate total benefits from both residents and farmers turned out to be great enough to cover the conversion cost [62], which is economically absolutely efficient. The introduction of an organic agriculture policy to improve the water quality of the Dagu River should, therefore, be substantially taken into positive consideration.
Information about costs and benefits is absolutely needed to do a financial analysis. If two stakeholder groups exist as winners and losers by the specific project, e.g., consumers and producers, the evaluation process would be complicated since the implementation of some projects might make a stakeholder group winner, while the other would be a loser. This study can be that case. The introduction of an organic agriculture policy might give farmers negative influences in terms of agricultural farm income, which might result in a bad policy for farmers and a good policy for consumers. Thus, it would be very critical to know whether or not the policy would be financially feasible to farmers [63]. Both parties should be satisfied with the policy, which is Pareto improvement.
This study has considered both sides—consumers and producers—to minimize evaluation errors. For consumers as residents of Dagu River Basin, quantitatively estimated were benefits for improving river water quality. In addition to this, the opportunity cost of volunteering activity [64] was calculated since some residents want volunteer works to improve the river water quality for various reasons, mainly income constraints. In fact, 44.14% of residents are unwilling to pay an additional tax to improve water quality. For producers as farmers, value transfer from the previous study was applied for conversion costs to organic agriculture and its revenues.
We tried to include all possible approaches to have more precise results. Nevertheless, some limitations exist. In this survey, first, an environmental tax was used as a payment vehicle. Since most Chinese people are not familiar with environmental taxes, they may make inappropriate responses in the questionnaire. Payment instruments must conform to reality and be suitable for the constructed resource and market [65]. Water bill is a very familiar instrument for payment of water fee [65]. Because the purpose of improving river water quality is to ensure safe drinking water, it is better to use water bills as a payment vehicle. Second, randomly selected samples may also cause sample bias. Because there are many factories in the surveyed area, many respondents are non-locals. They have no emotional awareness of the Dagu River, which may lead to wrong responses. Therefore, future surveys will only target locals or separate locals from non-locals. Third, this survey was conducted during a special period of COVID-19, which might cause an increase in environmental awareness.

Author Contributions

Conceptualization, methodology, software, X.Z.; validation, H.-J.S.; formal analysis, investigation, resources, data curation, X.Z.; writing—original draft preparation, writing—review and editing, X.Z. and H.-J.S.; supervision, H.-J.S.; funding acquisition, X.Z. and H.-J.S. All authors have read and agreed to the published version of the manuscript.

Funding

This research was funded by the China Scholarship Council and the 2016 Research Grant from Kangwon National University, Korea Republic.

Institutional Review Board Statement

Not applicable.

Informed Consent Statement

Not applicable.

Acknowledgments

We would like to express our sincere appreciation to the reviewers as well as the editor.

Conflicts of Interest

The authors declare no conflict of interest.

Appendix A

Table A1. Environmental quality standards for surface water (GB 3838-2002).
ClassificationContents
Grade ISatisfy the standard as headwaters and national nature conserves
Grade IISatisfy the living and drinking needs in crowed areas from Class I water source areas, life habitats of precious aquatic living things, fish and shrimp spawning and feeding area
Grade IIISatisfy the living and drinking needs in crowed areas from Class 2 water source areas, hibernaculum, migration pass-way, aquaculture and swimming areas
Grade IVSatisfy the needs of the general factories and skin non-touch recreational grounds
Grade VSatisfy the needs of agricultural and the landscape utilizations
Ministry of Environmental Protection of the People’s Republic of China [66].

Appendix B

Table A2. Environmental quality standard values for surface water (unit: mg/L).
Classification Grade IGrade IIGrade IIIGrade IVGrade V
PH 6–9
DO90% (or 7.5)6532
COD1515203040
BOD5334610
NH3 - N0.150.51.01.52.0
P
(L-lake; R-reservoir)
0.02
(L/R 0.01)
0.1
(L/R 0.025)
0.2
(L/R 0.05)
0.3
(L/R 0.1)
0.4
(L/R 0.2)
N0.20.51.01.52.0
Fecal coliform
a(number/L)
200200010,00020,00040,000
Ministry of Environmental Protection of the People’s Republic of China.

References

  1. Loomis, J.; Kent, P.; Strange, L.; Fausch, K.; Covich, A. Measuring the total economic value of restoring ecosystem services in an impaired river basin: Results from a contingent valuation survey. Ecol. Econ. 2000, 33, 103–117. [Google Scholar] [CrossRef]
  2. Vásquez, W.F.; de Rezende, C.E. Willingness to pay for the restoration of the Paraíba do Sul River: A contingent valuation study from Brazil. Ecohydrol. Hydrobiol. 2019, 19, 610–619. [Google Scholar] [CrossRef]
  3. Li, X.; Liu, W.; Yan, Y.; Fan, G.; Zhao, M. Rural Households’ Willingness to Accept Compensation Standards for Controlling Agricultural Non-Point Source Pollution: A Case Study of the Qinba Water Source Area in Northwest China. Water 2019, 11, 1251. [Google Scholar] [CrossRef] [Green Version]
  4. Xepapadeas, A. The economics of non-point-source pollution. Annu. Rev. Resour. Econ. 2011, 3, 355–373. [Google Scholar] [CrossRef] [Green Version]
  5. Chen, Y.-h.; Wen, X.-w.; Wang, B.; Nie, P.-y. Agricultural pollution and regulation: How to subsidize agriculture? J. Clean. Prod. 2017, 164, 258–264. [Google Scholar] [CrossRef]
  6. Yan, F.; Daming, H.; Kinne, B. Water resources administration institution in China. Water Policy 2006, 8, 291–301. [Google Scholar] [CrossRef]
  7. Dai, L. Regulating water pollution in China and the European Union in terms of agricultural pollution. J. Water Law 2015, 24, 150–155. [Google Scholar]
  8. Xie, B.; Wang, L.; Yang, H.; Wang, Y.; Zhang, M. Consumer perceptions and attitudes of organic food products in Eastern China. Br. Food J. 2015. [Google Scholar] [CrossRef]
  9. Lee, S.; Nguyen, T.T.; Kim, H.N.; Koellner, T.; Shin, H.-J. Do consumers of environmentally friendly farming products in downstream areas have a WTP for water quality protection in upstream areas? Water 2017, 9, 511. [Google Scholar] [CrossRef] [Green Version]
  10. Vining, A.; Weimer, D.L. An assessment of important issues concerning the application of benefit-cost analysis to social policy. J. Benefit Cost Anal. 2010, 1, 1–40. [Google Scholar] [CrossRef] [Green Version]
  11. Viscusi, W.K.; Huber, J.; Bell, J. The economic value of water quality. Environ. Resour. Econ. 2008, 41, 169–187. [Google Scholar] [CrossRef] [Green Version]
  12. OFWAT. Setting Price Limits for 2010–15: Framework and Approach; OFWAT: Birmingham, UK, 2008. [Google Scholar]
  13. Hanemann, W.M. The economic conception of water. In Water Crisis: Myth or Reality; Taylor and Francis: London, UK, 2006; Volume 61, pp. 74–76. [Google Scholar]
  14. Ikeuchi, A.; Tsuji, K.; Yoshikane, F.; Ikeuchi, U. Double-bounded dichotomous choice CVM for public library services in Japan. Proc. Soc. Behav. Sci. 2013, 73, 205–208. [Google Scholar] [CrossRef] [Green Version]
  15. Mitchell, R.C.; Carson, R.T.; Carson, R.T. Using Surveys to Value Public Goods: The Contingent Valuation Method; Resources for the Future: Washington, DC, USA, 1989. [Google Scholar]
  16. Wattage, P.; Smith, A.; Pitts, C.; McDonald, A.; Kay, D. Integrating environmental impact, contingent valuation and cost-benefit analysis: Empirical evidence for an alternative perspective. Impact Assess. Proj. Apprais. 2000, 18, 5–14. [Google Scholar] [CrossRef]
  17. Day, B.; Mourato, S. Willingness to Pay for Water Quality Maintenance in Chinese Rivers; Centre for Social and Economic Research on the Global Environment: London, UK, 1998. [Google Scholar]
  18. Ge, Y.; Liang, L.; Wu, F.; Wang, B. Studies on Willingness to Pay and Payment Level for Ecological Compensation of the Yellow River Based on CVM-Taking Shandong Province as an Example, Proceedings of the 2009 International Conference on Management and Service Science, Beijing, China, 20–22 September 2009; IEEE: Piscataway, NJ, USA, 2009; pp. 1–4. [Google Scholar]
  19. Wang, H.; He, J.; Kim, Y.; Kamata, T. Willingness-to-pay for water quality improvements in Chinese rivers: An empirical test on the ordering effects of multiple-bounded discrete choices. J. Environ. Manag. 2013, 131, 256–269. [Google Scholar] [CrossRef] [PubMed]
  20. Jianjun, J.; Wenyu, W.; Ying, F.; Xiaomin, W. Measuring the willingness to pay for drinking water quality improvements: Results of a contingent valuation survey in Songzi, China. J. Water Health 2016, 14, 504–512. [Google Scholar] [CrossRef] [PubMed] [Green Version]
  21. Xiong, G.; An, Q.; Fu, T.; Chen, G.; Xu, X. Evolution analysis and environmental management of intruded aquifers of the Dagu River Basin of China. Sci. Total Environ. 2020, 719, 137260. [Google Scholar] [CrossRef] [PubMed]
  22. Xi, M.; Kong, F.; Li, Y.; Kong, F. Temporal-spatial variation of DOC concentration, UV absorbance and the flux estimation in the Lower Dagu River, China. Front. Earth Sci. 2017, 11, 660–669. [Google Scholar] [CrossRef]
  23. Baidu. Available online: https://baike.baidu.com/item/%E5%A4%A7%E6%B2%BD%E6%B2%B3/2022592?fr=aladdin (accessed on 27 August 2020).
  24. Xiudong, H.; Jun, S.; Changzhou, F. Current situation and Optimization of hydrological network in Dagu River Basin. China Water Resour. 2016, 60–61. (In Chinese) [Google Scholar]
  25. Wikipedia. Available online: https://en.wikipedia.org/wiki/Qingdao (accessed on 27 August 2020).
  26. Asian Development Bank. Water Resources Protection and Informed Decision Making an Example of the Dagu Aquifer in Qingdao, People’s Republic of China; Asian Development Bank: Mandaluyong, Philippines, 2017. [Google Scholar]
  27. Feng, J.-G.; Li, G.-H.; Gao, Z.-J.; Cheng, G.-F.; Cui, J.-L. Water Quality Variations in Temporal and Spatial of Dagu River Groundwater Reservoir. DEStech Trans. Environ. Energy Earth Sci. 2017. [Google Scholar] [CrossRef]
  28. Central Government Portal. Available online: http://www.gov.cn/gzdt/2012-02/09/content_2061987.htm (accessed on 27 August 2020).
  29. Qingdao Daily. Available online: http://www.dailyqd.com/news/2015-09/15/content_275149.htm (accessed on 27 August 2020).
  30. Xu, F.; Liu, Z.; Cao, Y.; Qiu, L.; Feng, J.; Xu, F.; Tian, X. Assessment of heavy metal contamination in urban river sediments in the Jiaozhou Bay catchment, Qingdao, China. Catena 2017, 150, 9–16. [Google Scholar] [CrossRef]
  31. Wang, X.C.; Feng, H.; Ma, H.Q. Assessment of metal contamination in surface sediments of Jiaozhou Bay, Qingdao, China. CLEAN Soil Air Water 2007, 35, 62–70. [Google Scholar] [CrossRef]
  32. Agyemang, E. Local people’s willingness to contribute towards water quality improvement in Offin River in Atwima Mponua District, Ghana. Master’s Thesis, University of Science and Technology (KNUST), Kumasi, Ghana, 2017. [Google Scholar]
  33. Tyack, N.; Ščasný, M. Social valuation of genebank activities: Assessing public demand for genetic resource conservation in the czech republic. Sustainability 2018, 10, 3997. [Google Scholar] [CrossRef] [Green Version]
  34. Qingdao Statistical Yearbook. Available online: http://qdtj.qingdao.gov.cn/n28356045/upload/200911163829224843/200911163930755057.pdf (accessed on 27 August 2020).
  35. Becker, G.S. The Economic Approach to Human Behavior; University of Chicago press: Chicago, IL, USA, 1976. [Google Scholar]
  36. Kim, J.-H.; Choi, K.-R.; Yoo, S.-H. Public Perspective on Increasing the Numbers of an Endangered Species, Loggerhead Turtles in South Korea: A Contingent Valuation. Sustainability 2020, 12, 3835. [Google Scholar] [CrossRef]
  37. Baker, R.P.; Bradburn, N.M.; Johnson, R.A. Computer-assisted personal interviewing: An experimental evaluation of data quality and cost. J. Off. Stat. 1995, 11, 413–431. [Google Scholar]
  38. Jalilov, S.-M. Value of Clean Water Resources: Estimating the Water Quality Improvement in Metro Manila, Philippines. Resources 2018, 7, 1. [Google Scholar] [CrossRef] [Green Version]
  39. Roy, J.; Chattopadhyay, S.; Mukherjee, S.; Kanjilal, M.; Samajpati, S.; Roy, S. An economic analysis of demand for water quality: Case of Kolkata. Econ. Polit. Wkly. 2004, 39, 186–192. [Google Scholar]
  40. Mulangu, F.; Kraybill, D. A cost–benefit analysis of improved irrigation when faced with the risks of climate change on Mount Kilimanjaro. Water Resour. Econ. 2015, 10, 31–44. [Google Scholar] [CrossRef]
  41. Krinsky, I.; Robb, A.L. On approximating the statistical properties of elasticities. Rev. Econ. Stat. 1986, 715–719. [Google Scholar] [CrossRef] [Green Version]
  42. Woo, J.; Lim, S.; Lee, Y.-G.; Huh, S.-Y. Financial feasibility and social acceptance for reducing nuclear power plants: A contingent valuation study. Sustainability 2018, 10, 3833. [Google Scholar] [CrossRef] [Green Version]
  43. Imandoust, S.B.; Gadam, S.N. Are people willing to pay for river water quality, contingent valuation. Int. J. Environ. Sci. Technol. 2007, 4, 401–408. [Google Scholar] [CrossRef] [Green Version]
  44. Kim, J.; Lee, H.-J.; Huh, S.-Y.; Yoo, S.-H. Households’ willingness to pay for developing marine bio-hydrogen technology: The case of South Korea. Int. J. Hydr. Energy 2019, 44, 12907–12917. [Google Scholar] [CrossRef]
  45. Shandong Provincial Bureau of Statistics. Available online: http://tjj.shandong.gov.cn/col/col6279/index.html (accessed on 27 August 2020).
  46. Lee, S.; Nguyen, T.T.; Poppenborg, P.; Shin, H.-J.; Koellner, T. Conventional, partially converted and environmentally friendly farming in South Korea: Profitability and factors affecting farmers’ choice. Sustainability 2016, 8, 704. [Google Scholar] [CrossRef] [Green Version]
  47. Shin, H.-J.; Kim, H.N.; Jeon, C.-H.; Jo, M.-W.; Nguyen, T.T.; Tenhunen, J. Benefit transfer for water management along the Han River in South Korea using Meta-Regression Analysis. Water 2016, 8, 492. [Google Scholar] [CrossRef] [Green Version]
  48. Morvan, X.; Verbeke, L.; Laratte, S.; Schneider, A.R. Impact of recent conversion to organic farming on physical properties and their consequences on runoff, erosion and crusting in a silty soil. Catena 2018, 165, 398–407. [Google Scholar] [CrossRef]
  49. He, X.; Qiao, Y.; Liang, L.; Knudsen, M.T.; Martin, F. Environmental life cycle assessment of long-term organic rice production in subtropical China. J. Clean. Prod. 2018, 176, 880–888. [Google Scholar] [CrossRef]
  50. Hu, Z.; Morton, L.W.U.S. Midwestern residents perceptions of water quality. Water 2011, 3, 217–234. [Google Scholar] [CrossRef]
  51. Grazhdani, D. Contingent Valuation of Residents’ Attitudes and Willingness-to-Pay for Non-point Source Pollution Control: A Case Study in AL-Prespa, Southeastern Albania. Environ. Manag. 2015, 56, 81–93. [Google Scholar] [CrossRef]
  52. Ward, N.; Lowe, P. Shifting values in agriculture: The farm family and pollution regulation1. J. Rural Stud. 1994, 10, 173–184. [Google Scholar] [CrossRef]
  53. Wang, Y.; Yang, J.; Liang, J.; Qiang, Y.; Fang, S.; Gao, M.; Fan, X.; Yang, G.; Zhang, B.; Feng, Y. Analysis of the environmental behavior of farmers for non-point source pollution control and management in a water source protection area in China. Sci. Total Environ. 2018, 633, 1126–1135. [Google Scholar] [CrossRef] [PubMed]
  54. Yi, S. Willingness-to-Pay for Sustainable Aquaculture Products: Evidence from Korean Red Seabream Aquaculture. Sustainability 2019, 11, 1577. [Google Scholar] [CrossRef] [Green Version]
  55. Šebo, J.; Gróf, M.; Šebová, M. A contingent valuation study of a polluted urban lake in Košice, Slovakia: The case of the positive distance effect. J. Environ. Manag. 2019, 243, 331–339. [Google Scholar] [CrossRef] [PubMed]
  56. Johnston, R.J.; Besedin, E.Y.; Holland, B.M. Modeling Distance Decay Within Valuation Meta-Analysis. Environ. Resour. Econ. 2019, 72, 657–690. [Google Scholar] [CrossRef]
  57. Shang, Z.; Che, Y.; Yang, K.; Jiang, Y. Assessing local communities’ willingness to pay for river network protection: A contingent valuation study of Shanghai, China. Int. J. Environ. Res. Public Health 2012, 9, 3866–3882. [Google Scholar] [CrossRef] [PubMed] [Green Version]
  58. Chatterjee, C.; Triplett, R.; Johnson, C.K.; Ahmed, P. Willingness to pay for safe drinking water: A contingent valuation study in Jacksonville, FL. J. Environ. Manag. 2017, 203, 413–421. [Google Scholar] [CrossRef] [PubMed]
  59. Lant, C.L.; Roberts, R.S. Greenbelts in the Cornbelt: Riparian wetlands, intrinsic values, and market failure. Environ. Plan. A 1990, 22, 1375–1388. [Google Scholar] [CrossRef] [Green Version]
  60. Choi, I.-C.; Kim, H.N.; Shin, H.-J.; Tenhunen, J.; Nguyen, T.T. Willingness to pay for a highland agricultural restriction policy to improve water quality in South Korea: Correcting anomalous preference in contingent valuation method. Water 2016, 8, 547. [Google Scholar] [CrossRef] [Green Version]
  61. Keeler, B.L.; Wood, S.A.; Polasky, S.; Kling, C.; Filstrup, C.T.; Downing, J.A. Recreational demand for clean water: Evidence from geotagged photographs by visitors to lakes. Front. Ecol. Environ. 2015, 13, 76–81. [Google Scholar] [CrossRef] [Green Version]
  62. Mariappan, K.; Zhou, D. A Threat of Farmers’ Suicide and the Opportunity in Organic Farming for Sustainable Agricultural Development in India. Sustainability 2019, 11, 2400. [Google Scholar] [CrossRef] [Green Version]
  63. D’souza, G.; Cyphers, D.; Phipps, T. Factors Affecting the Adoption of Sustainable Agricultural Practices. Agric. Resour. Econ. Rev. 1993, 22, 159–165. [Google Scholar] [CrossRef] [Green Version]
  64. Matsumoto, S. The Opportunity Cost of Pro-Environmental Activities: Spending Time to Promote the Environment. J. Fam. Econ. Issues 2014, 35, 119–130. [Google Scholar] [CrossRef]
  65. Loomis, J.B. Balancing public trust resources of Mono Lake and Los Angeles’ water right: An economic approach. Water Resour. Res. 1987, 23, 1449–1456. [Google Scholar] [CrossRef]
  66. Ministry of Environmental Protection of the People’s Republic of China. Environmental Quality Standards for Surface Water; GB 3838-2002; Ministry of Environmental Protection of the People’s Republic of China: Beijing, China, 2002. [Google Scholar]
Figure 1. The location of the Dagu River.
Sustainability 13 02960 g001
Figure 2. Distribution of maximum willingness to pay (WTP) amounts in open-ended (OE) questions.
Sustainability 13 02960 g002
Table 1. Descriptive statistics of socio-economic characteristics of the respondents.
TypeCategoriesFrequencyPercentage (%)
GenderMale
Female
129
152
46.0
54.0
Age20–29
30–39
40–49
50–59
68
123
61
29
24.2
43.8
21.7
10.3
MarriageSingle
Marriage
50
231
17.8
82.2
Household size1
2
3
4
5
6
7
8
30
21
53
40
28
23
10
1
14.6
10.2
25.7
19.4
13.6
11.2
4.9
0.5
Distance to river0–500 m
500–3000 m
3000–6000 m
6000–18,000 m
More than 18,000 m
50
123
47
32
29
17.8
43.8
16.7
11.4
10.3
ResidenceLess than 1 year
1–10 year
More than 10 years
29
96
156
10.3
34.2
55.5
EducationPrimary school
Middle school
High school
Undergraduate
Graduate
16
101
80
80
4
5.7
35.9
28.5
28.5
1.4
Job Housewife
Self-employed
Company staff
Government officer
Farmer
No job
Other
60
54
72
20
10
16
49
21.4
19.2
25.6
7.1
3.6
5.7
17.4
Monthly household incomeLess than 3000
3000–5000
5001–8000
8001–10,000
10,001–15,000
More than 15,001
85
108
51
20
5
12
30.3
38.4
18.2
7.1
1.8
4.3
Table 2. Comparison of sample and population.
VariablesSample Statistics (%)Population Statistics (%) *
Gender
Male46.050.4
Female54.049.6
Household size (person)32.8
Education
College29.914.9
High school28.517.3
Middle school35.938.4
Primary school5.719.6
* The sixth National Population Census (Qingdao Statistical Yearbook [34]). Household size (person) is one of variables showing a number of persons in a household.
Table 3. Distribution of responses to the double-bounded dichotomous choice (DBDC) questions.
Questionnaire VersionBid Values (CNY) (Initial, Upper, Lower)Number of Responses (%)
Yes–YesYes–NoNo–YesNo–NoTotal
A(2, 3, 1)41 (37.3)8 (34.8)7 (70.0)15 (13.2)71
B(5, 6 4)31 (28.2)8 (34.8)026 (23.0)65
C(8, 9, 7)25 (22.7)6 (26.1)3 (30.0)34 (30.2)68
D(11, 12, 10)13 (11.8)1 (4.3)038 (33.6)52
Total 110 (43.0)23 (9.0)10 (3.9)113 (44.1)256
Table 4. Reasons for rejecting WTP.
Support and Willingness to Pay Frequency (%)
Yes256 (91.1)
No25 (8.9)
Total281 (100)
Reasons for No25
There is no economic capacity for additional tax4
The government should be responsible13
The extra money will not be used to improve the water quality of the river4
Sufficient tax has been paid2
Others 2
Table 5. Bivariate probit estimation results on the first bid and the second.
VariablesBid 1 (Yes or Not)
Coefficient
Bid 2 (Yes or Not)
Coefficient
Bid1/Bid2−0.13 *** (0.03)−0.13 *** (0.03)
Water quality−0.46 *** (0.10)-0.38 *** (0.09)
Environmental activity0.47 *** (0.17)0.45 *** (0.17)
Income0.23 *** (0.07)0.23 *** (0.07)
constant−0.03 (0.39)−0.20 (0.38)
Wald statistic = 65.09; Log likelihood = −234.12; Number of obs. = 256
*** 1%.
Table 6. Mean WTPs of DBDC and OE.
DBDC Mean WTP
(Month/Household)
Lower Bound WTP
(Month/Household)
Upper Bound WTP
(Month/Household)
p-ValueCI/Mean
CNY 5.71
(USD 0.83)
CNY 4.09
(USD 0.59)
CNY 7.02
(USD 1.02)
0.0002 ***0.51
OE Mean WTP
(month/household)
Min WTP
(month/household)
Max WTP
(month/household)
CNY 26.47
(USD 3.84)
CNY 0CNY 3000
(USD 435)
CI: WTP estimates with 95% confidence interval. Averagely USD 1= CNY 6.9 in 2019. *** 1%.
Table 7. Total Mean WTP (opportunity cost of volunteering activity hours plus Mean WTP).
Mean Volunteering Activity Hours
(H/Week)
Opportunity Cost (Month)Total Mean WTP
(Month/Household)
3.06 1CNY 222.77
(USD 32.29)
CNY 228.48–CNY 249.24
(USD 33.11–USD 36.12)
1 Minimum hourly wage is CNY 18.2 in Qingdao in 2019. The minimum hourly wage is applicable to part-time workers.
Table 8. Aggregate total benefits.
Total Mean WTP
(Year/Household)
Number of Households
(2019)
Aggregate Total Benefits
(Year)
CNY 2741.76–CNY 2,990.882,750,800CNY 7.54 billion–CNY 8.23 billion
(USD 397.36–USD 433.46)(USD 1.09 billion–USD 1.19 billion)
Table 9. Cost–benefit data for environmentally friendly farming in South Korea by Lee et al. [46].
YearTotal CostRevenueTotal Profit
2012 1KRW 12.85 millionKRW 28.54 millionKRW 15.70 million
2019 2CNY 57,165CNY 126,963CNY 69,843
1 Survey data collected from 68 farmers in 2012. All units are ha/year. 2 Averagely KRW 100 = CNY 0.59 in 2019. In 2019, South Korea’s Consumer Price Index (CPI) is 4%, and China’s CPI is 2.9%.
Table 10. Financial analysis for organic agriculture per year.
Residents (Consumer Side)
Aggregated Benefit for Improving Water Quality
Organic Agriculture (Producer Side) *
Total ProfitTotal Cost
CNY 7.54 billion–CNY 8.23 billion
(USD 1.09 billion–USD 1.19 billion)
CNY 46.61 billion
(USD 6.75 billion)
CNY 38.15 billion
(USD 5.53 billion)
* Sown area of farm crops is 667,300 hectares in Qingdao in 2019.
Publisher’s Note: MDPI stays neutral with regard to jurisdictional claims in published maps and institutional affiliations.

