Article

Heat and Fluid Flow Analysis and ANN-Based Prediction of A Novel Spring Corrugated Tape

1
Department of Physics, College of Science, King Faisal University, PO Box 400, Al-Ahsa 31982, Saudi Arabia
2
Department of Physics, Laboratory of Fluid Mechanics, Faculty of Sciences of Tunis, Tunis 2092, Tunisia
3
Department of Mechanical Engineering, Birla Institute of Technology and Science Pilani, Pilani Campus, Vidhya Vihar, Pilani 333031, India
*
Author to whom correspondence should be addressed.
Sustainability 2021, 13(6), 3023; https://doi.org/10.3390/su13063023
Submission received: 29 December 2020 / Revised: 3 March 2021 / Accepted: 5 March 2021 / Published: 10 March 2021

Abstract

:
A circular tube fitted with novel corrugated spring tape inserts has been investigated. Air was used as the working fluid. A thorough literature review has been done and this geometry has not been studied previously, neither experimentally nor theoretically. A novel experimental investigation of this enhanced geometry can, therefore, be treated as a new substantial contribution in the open literature. Three different spring ratio and depth ratio has been used in this study. Increase in thermal energy transport coefficient is noticed with increase in depth ratio. Corrugated spring tape shows promising results towards heat transfer enhancement. This geometry performs significantly better (60% to 75% increase in heat duty at constant pumping power and 20% to 31% reduction in pumping power at constant heat duty) than simple spring tape. This paper also presented a statistical analysis of the heat transfer and fluid flow by developing an artificial neural network (ANN)-based machine learning (ML) model. The model is evaluated to have an accuracy of 98.00% on unknown test data. These models will help the researchers working in heat transfer enhancement-based experiments to understand and predict the output. As a result, the time and cost of the experiments will reduce. The results of this investigation can be used in designing heat exchangers.

1. Introduction

Energy is the essence of today’s world. The entire world is run by the force of energy. The advancement and innovations in the last two decades make life easier as never before. With the rise of technology usage, the need for energy is also rising. As per the report of VGB Powertech [1], the energy consumption has increased by 66% in the past two decades. The drastic increase in the demand for energy enhanced the consumption of non-renewable fuel, which led to an increase in the pollution as well as cost of fuel. This has caused researchers around the world to concentrate on energy conservation. One of the easiest ways of energy conservation is to increase the efficiencies of various equipment by employing the various techniques (passive and active) to increase the efficacy and reduce the losses.
A heat exchanger (HE) is a device which can exchange the energy between multiple fluids by direct or indirect contact. The fluids at different temperature transfer the energy between them, and hence, the energy exchange takes place. To further increase the heat transfer rate between the fluids, some additional attachment in the form of swirl generators [2,3,4,5,6,7,8,9,10], surface roughness [11,12,13,14,15,16,17] and other modifications [18,19,20,21,22] in the design of the heat exchangers are required. The purpose of using such a modification is to enhance the turbulence in the flow field, which leads to a disturbance in the boundary layer, promotion of secondary flow and better mixing of hot elements with cold field elements [5,23,24,25,26]. These modifications also reduce the size of heat exchangers for the same heat exchange capacity. Moreover, the use of materials with higher thermal conductivity, such as steel, copper, brass, aluminum, etc., also promotes the heat transfer rate.
Rashidi et al. [27] reviewed various articles related to enhanced techniques which employed inserts with nanofluids for heat transfer (HT) enhancement and concluded that combined techniques are more effective over single techniques with a slight increase in the pressure drop (PD). Silva and Salviano [28] reported on the solar water heater with longitudinal vortex generator to enhance the thermal performance. They found that at a 30° angle of attack, the thermal enhancement factor is highest while the maximum heat transfer was reported with 45°. Gorjaei and Shahidian [29] experimentally explored the thermal enhancement in a tube fitted with twisted tapes and nanofluid and reported an increase in the heat transfer rate as well as Darcy friction inside the tube. Dadvand et al. [30] employed a flexible beam kind of vortex generator in the downstream of the fluid domain having a cylindrical obstruction and reported an approximately 18% increase in the Nusselt number (Nu), while a 42% decrease in the Darcy friction was reported. The overall thermal performance was also enhanced. Arulprakasajothi et al. [31] conducted experiments in the transitional flow regime with conical inserts of different twist ratios fitted inside a cylindrical tube and found that conical strip with a twist ratio of 2 introduced more swirls when compared with other twist ratio inserts. Gnanavel et al. [32] investigated the thermal performance of a double pipe heat exchanger fitted with rectangular cut twisted tape inserts with different nanofluid flowing through it and reported an enhancement in the thermal performance of the heat exchanger with an increase in the flow velocity. In another numerical investigation by Gnanavel et al. [33], a similar kind of study was done with circular fin inserts. Keklikcioglu et al. [34] performed experiments with small length spring tapes coiled conically and welded to a wire fitted inside a cylindrical duct in which an ethylene glycol–water mixture flowed. The study was focused on the turbulent flow regime and results revealed that spring tapes introduced more irreversibility inside the fluid domain as a result enhancement in thermal performance. Klemeš et al. [35] reviewed the various articles on the heat transfer improvement in heat exchangers and the optimization tools used. They concluded that there is a need to investigate the gap between theoretical approach and practical implementation. Saffarian et al. [36] conducted a numerical investigation on the different flow paths of a flat plate collector and Al2O3 and CuO with water as the working nanofluid. It was found that a wavy and spiral flow path shows maximum enhancement in heat transfer rate while the pressure drop was observed to be maximum with the wavy path. Sheikholeslami et al. [37] computationally explained the impact of twisted tape within twisted tape for heat transfer augmentation in a cylindrical duct. It is revealed that introduction of secondary tape inside the fluid domain promotes the secondary flow, which result in enhanced entropy in the flow field, and hence, a higher heat transfer rate. Gholami et al. [38] investigated the influence of adding nanofluid and dimples on the free convective heat transfer in a vertical channel. The results obtained from the investigation revealed augmentation in the thermal performance. Li et al. [39] reported on the heat transfer enhancement in a microchannel using a shark-skin bionic modified surface and reported an increase in the thermal performance with an increase in the Reynold number. Yu et al. [40] investigated the influence of triangular baffles on the thermal performance of the air-based PVT collector and reported an increase in both the outlet temperature as well as heat gain at the outlet of the collector. Chen et al. [41] reported on the factor influencing the heat transfer in ground water heat exchanger and found that an increase in the inlet temperature resulted in a higher heat transfer rate. Giwa et al. [42] studied the influence of thermo-physical properties, temperature and volume concentration of nanoparticle on the thermal and flow behavior and employed difficult machine learning techniques to predict the thermo-physical properties of nanofluid. Osman et al. [43] conducted experimental assessment to evaluate the convective heat transfer coefficient in transitional flow regimes. Alumina-water was employed as the working fluid. The results obtained from the investigation shows enhancement in Nu and the heat transfer coefficient. Other, similar investigations include [44,45,46,47,48].
A new technique known as machine learning has evolved in recent times which is very helpful in the field of predicting the results with accuracy. It is defined as the method of data analysis that allows the computer to automate the model building. Machine learning is a system that learns from its past data to predict future results and to improve the accuracy using the previous predictions. Machine learning has applications in various industries and is proving its caliber with predicting the results with higher accuracy [49,50,51,52,53,54]. For example, ML is used to analyze a vast volume of data derived from experiments, field measurements and numerical simulations in the field of fluid mechanics [55,56]. A data analysis based on machine learning not only increases the throughput and precision of the flow interpretation, but also opens up new possibilities, such as flow property prediction using quality data and past experiences [57].
The field of thermal science and engineering has also discussed how machine learning is used to promote data processing. Machine learning will act as a useful tool for predicting the results for the complex heat transfer and fluid flow problem in transitional and turbulent flow regimes. Researchers across the globe have found machine learning to be very useful. Lindqvist et al. [58], Baghban et al. [59], Kwon et al. [60] and Krishnayatra et al. [61] employed a machine learning approach for the development of correlations and predicting the thermal performance for heat exchangers. Baghban et al. [59] employed the machine learning approach for predicting the thermal performance of a coiled heat exchanger. The multilayer perceptron artificial neural network, adaptive neuro-fuzzy inference system and least squares support vector machine model were employed to predict the Nusselt number; they reported that the least squares support vector machine model predicted the results with the best accuracy. Kwon et al. [60] employed a random forest algorithm for predicting the heat transfer coefficient by training and testing the machine learning model and reported that the machine learning model predicts the heat transfer coefficient with a high accuracy, i.e., of 96.6%. Ahmadi et al. [62] employed neural networking for predicting the friction factor in a car radiator while using CuO-water nanofluid as a working agent. Golzar et al. [63] utilized the machine learning-based technique of artificial neural networking and Monte-Carlo sensitivity analysis for predicting the temperature of wastewater. Koroleva et al. [64] applied artificial neural networking for optimizing the rib roughness parameters in an internally roughened circular tube. Abdollahi and Shams [65] engaged the Pareto optimal strategy to optimize the design parameters of a winglet vortex generator to achieve the highest heat transfer enhancement at the lowest pressure drop condition. Sotgiu et al. [66] employed machine learning for predicting the turbulent heat fluxes in the Reynolds-averaged Navier-Stokes equations and reported that initial results are appreciable, predicting the heat fluxes in a more complex flow. Karkaba et al. [67] employed large space exploration applications to optimize the design of vortex generators for maximum performance and heat transfer enhancement. Gerdroodbary [68] formulated a model using neural networking to predict the heat flux for magnetohydrodynamic nanofluid flow. Jovic et al. [69] explored the potentiality of adaptive neuro-fuzzy methodology in the predicting of heat transfer enhancement for the mini channel heat sink with higher accuracy. Machine learning techniques, such as fuzzy inference system (FIS), support vector machine (SVM) and artificial neural network (ANN), have found application in predicting thermal properties, such as effective thermal conductivity [70,71,72,73], thermal boundary resistance [74], recapitulate entropy [75], specific heat [76], dynamic viscosity [77,78,79,80] etc.
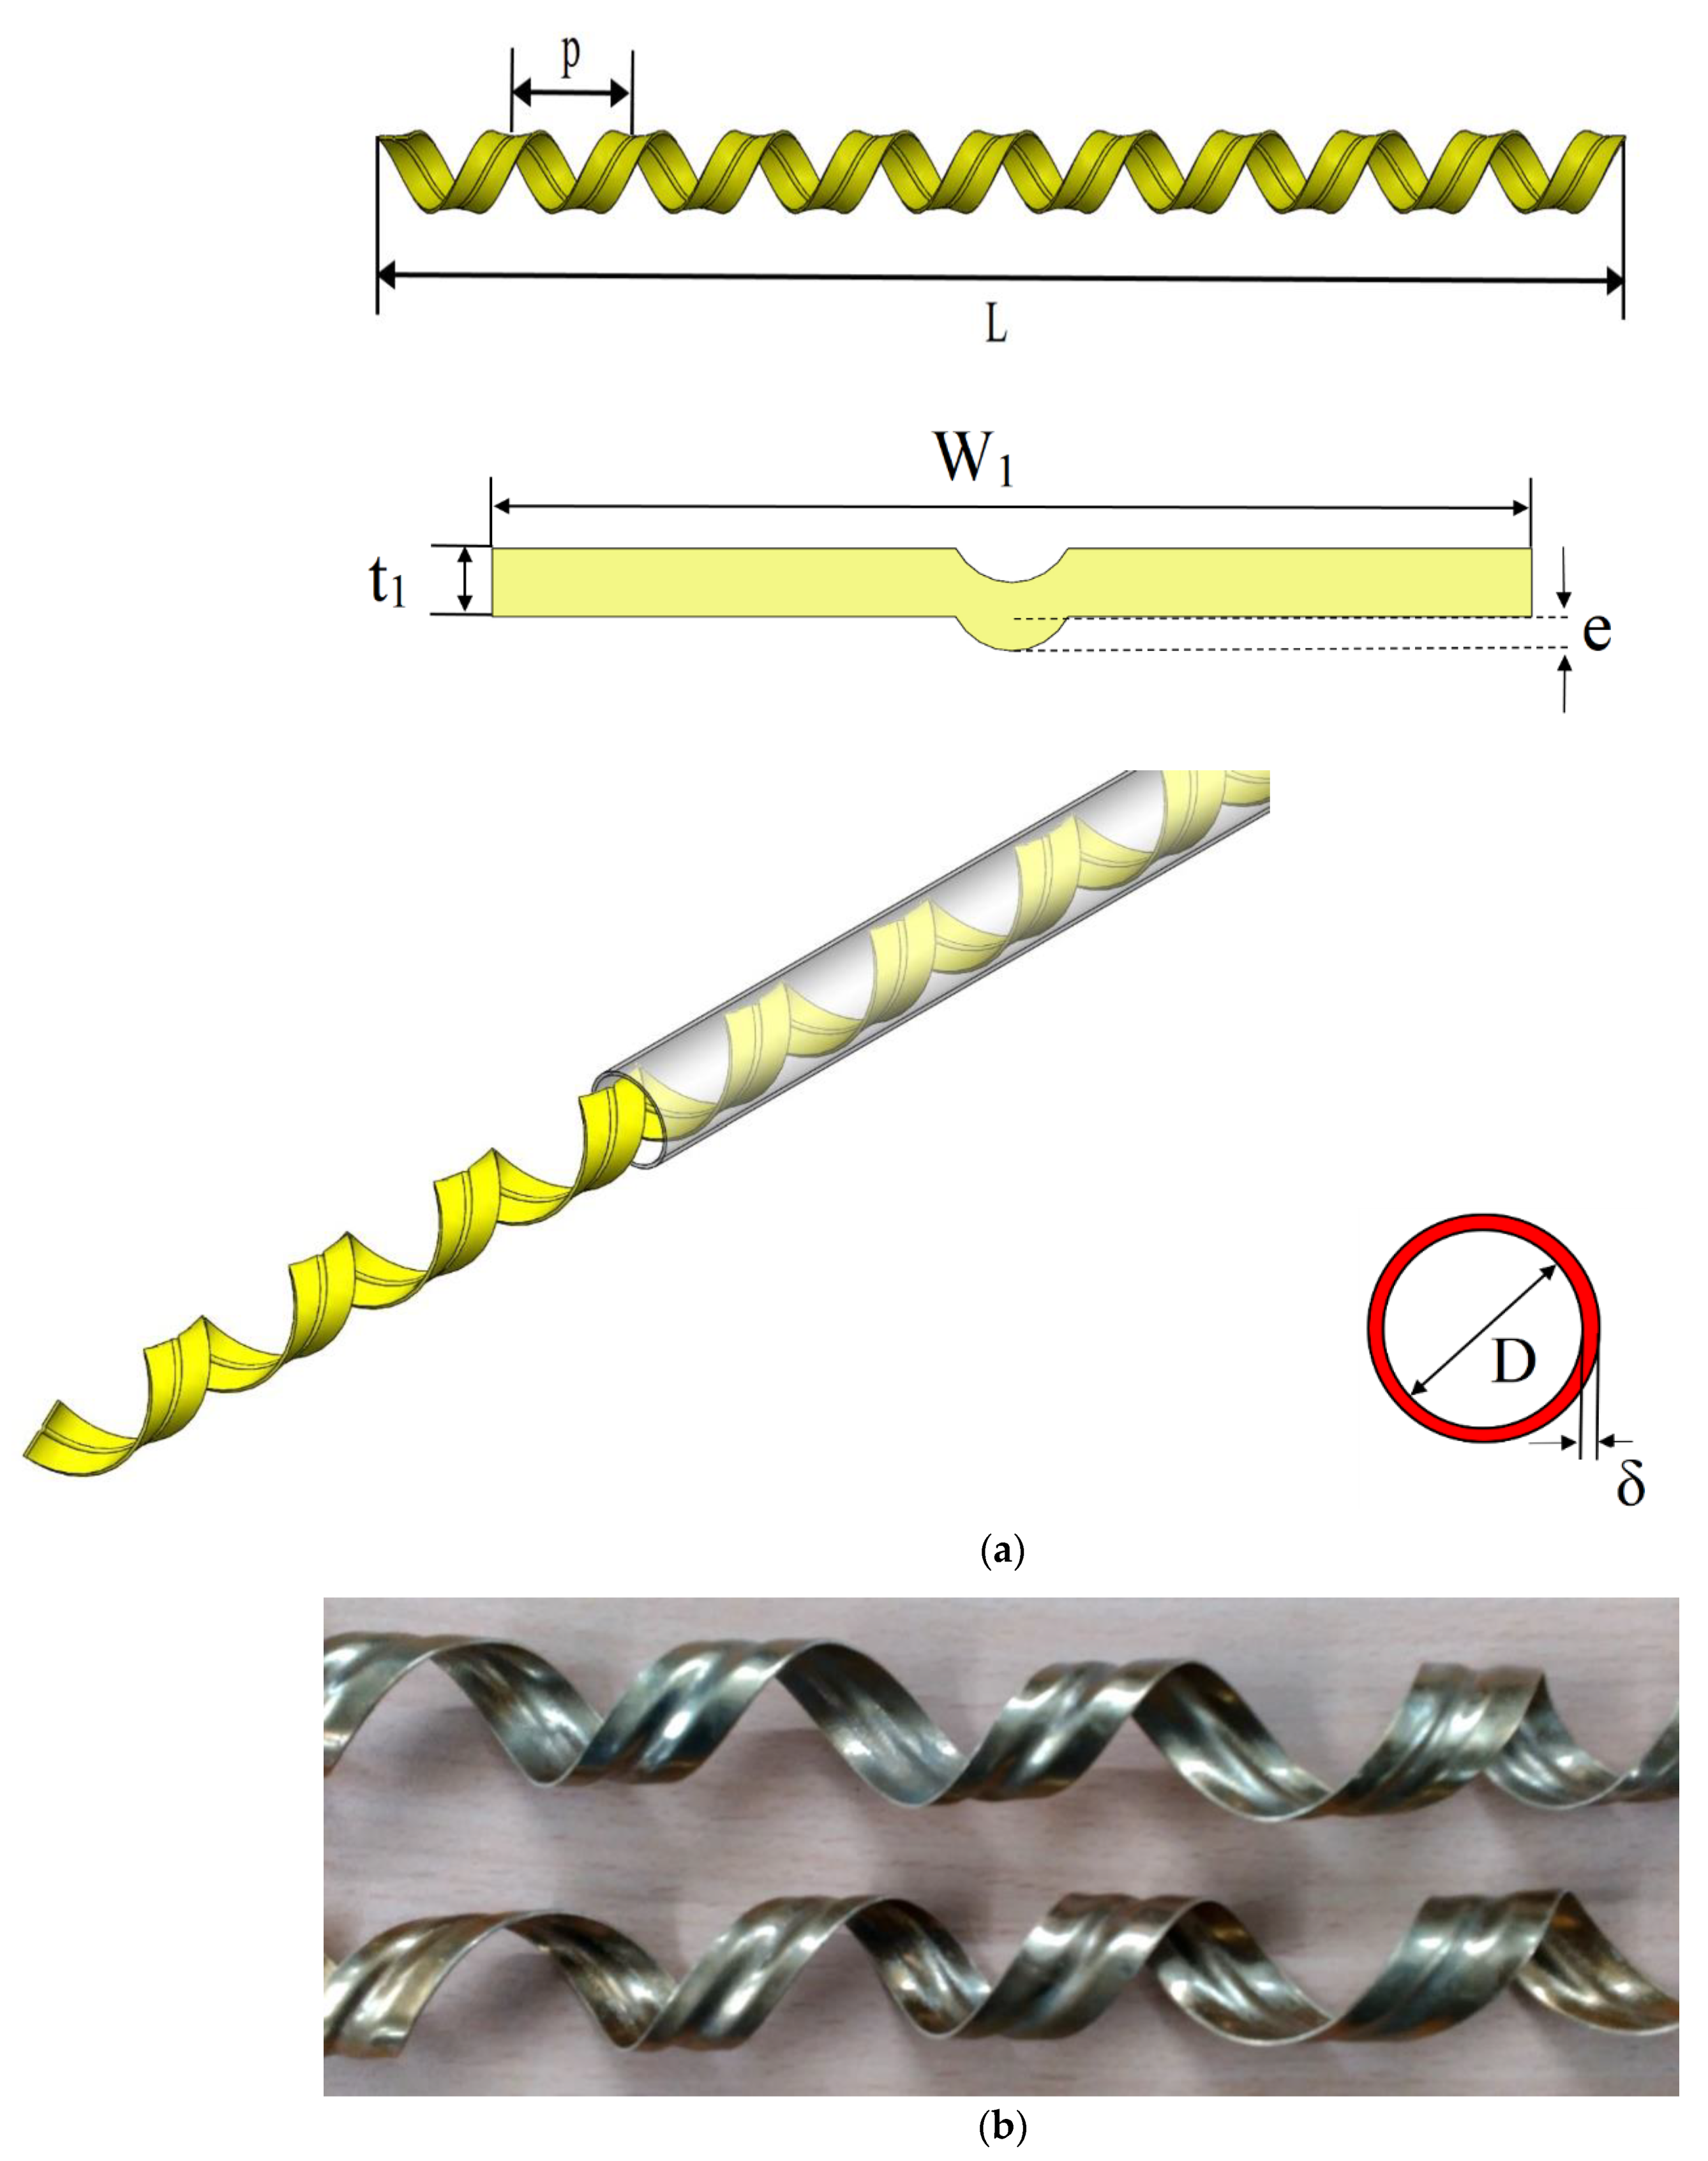
A thorough literature review has been done, and this geometry, as shown in Figure 1, has not been studied previously, neither experimentally nor numerically. A novel experimental investigation of this enhanced geometry can, therefore, be treated as a new substantial contribution in the open literature. This paper also presented a statistical analysis of the heat transfer and fluid flow by developing an artificial neural network (ANN)-based machine learning (ML) model. The model is trained based on the features of experimental data, which provides an estimation of the experimental output based on user-defined input parameters. These models will help the researchers working in heat transfer enhancement-based experiments to understand and predict the output. As a result, the time and cost of the experiments will reduce.

2. Experimental Setup, Procedure and Data Reduction

Figure 2 shows the pictographic representation of the experimental test rig employed for the experimental assessment. All the important parts have been leveled in Figure 2 for ease of understanding. Air enters the test section with the help of a blower of 7 kW capacity, which then travels through the calming section and enters the test section with uniform distribution. A rotameter with a range of 120 to 540 l/h is employed to measure the mass flow rate of the working fluid. A calibrated U-tube manometer with a measuring range of 0–150 mm of Hg is used to measure the pressure difference in the test section. The measuring range of the major measuring instruments is given in Table 1. The test section is made of a long circular metallic tube with a diameter of 20 mm and a length of 2 m. The outer surface of the test section is properly insulated to ensure no heat loss to the environment. A total of 36 thermocouples are attached to the surface of the test section at seven equidistant stations to measure the surface temperature of the test section. The system takes approximately 2 h to reach a steady-state condition. The steady state is assumed when fluctuations in the reading were negligible. Further details regarding the experimental setup and produce can be found in the authors’ previous work [6,8,10,18,19,20,21].
Experimental investigation has been done for various configurations of hybrid tapes, as given in Table 2.
The Nusselt number (Nu) can be calculated as follows, where k denotes the thermal conductivity of air [61]:
N u = h c D k
The Darcy friction coefficient, f, is further evaluated using the following formula [62,63]:
f = Δ p L D 1 2 ρ V 2
For calculating the ReDh, the authors referred to Bhattacharyya et al. [21]:
R e D h =   4 × π × D × µ
The thermo-hydraulic performance factor (η) was calculated as per Bhattacharyya et al. [20], which gave an understanding of the combined performance increases:
η = N u / N u 0 ( f / f 0 ) 0.33

3. Results and Discussion

The results obtained for the smooth tube for the Nusselt number and friction factor are validated with the well-established correlations of the Dittus-Boelter correlation [81], the Meyer et al. [82] correlation was used for the Nusselt number and Blasius Correlation [82] for the friction factor.
The Dittus-Boelter correlation [81] expressed the Nusselt number as follows:
N u = 0.023   R e D h 0.8 P r 0.4
Range: 3000 < Re < 106; 0.7 < Pr < 120
Moreover, Meyer et al. [82] correlated the Nusselt number as follows:
N u = 0.013   R e D h 0.867 P r 1 3
Range: 2445 < Re < 410,600; 0.5 < Pr < 276
The correlation for the friction factor given by Blasius [82] is given by:
f = 0.3164 R e D h 1 4
Range: 4000 < Re < 105
Figure 3 and Figure 4 show the validation analysis of the present study with previously established and acclaimed correlations for the Nusselt number [81,82] and friction factor [82]. The results obtained for the smooth tube for the Nusselt number and friction factor are in good accordance with previous studies. The Nusselt number deviates only 6% with the Dittus-Boelter correlation and 4% with the Meyer et al. correlation, while the friction factor differs only 4% from the data obtained using the Blasius Correlation.

3.1. Influence on the Nusselt Number

The Nusselt number is a dimensionless parameter which gives the ratio of convection and conductive heat transfer for the fluid. Increase in the value of Nusselt number represents the enhancement in the convective heat transfer.
Figure 5a depicts the relationship of Nusselt number (Nu) and Reynolds number (Re) in a conduit fitted with novel spring corrugated tape for fixed ‘t’ and variable ‘h.’ It is clear from Figure 5a that an increase in Re results in a higher Nu value. Further enhancement in the average Nusselt number is visible when inserts (spring tape) are employed for the investigation. For a given Reynolds number, the value of the Nusselt number is higher for the channel fitted with inserts than that of a smooth channel, which depicts augmentation of heat transfer in the presence of inserts. The maximum enhancement in the Nusselt number is reported for tape, with t = 1.0 and h = 0.25. For a fixed spring ratio ‘t’, decreasing the value of depth ratio ‘h’ results in a decreased Nusselt number.
Figure 5b depicts that the Nusselt number is the function of the Reynolds number in a conduit fitted with novel spring corrugated tape for a fixed ‘h’ and variable ‘t’. Once again, one can see from Figure 5b that an increase in the Reynolds number results in the higher Nusselt number value. For a given Reynolds number, the value of the Nusselt number is higher for the channel fitted with inserts than that of the smooth channel which depicts augmentation of heat transfer in the presence of inserts. The maximum enhancement in the Nusselt number is reported for twisted tape with t = 1.0 and h = 0.25. For a fixed h = 0.25, increasing the value of ‘t’ results in a decreased Nusselt number.
Figure 5c depicts the relationship of Nusselt number and Reynolds number in a conduit fitted with novel spring corrugated tape for all possible cases. As expected, the maximum enhancement in Nusselt number is reported for spring tape with t = 1.0 and h = 0.25, while minimum enhancement is noted for spring tape with t = 2.0 and h = 0.
In conclusion, the grooved surface introduced disturbance in the flow field. The depth of the groove brings in irregular disturbance in the flow field. The grooved surface also disrupts the boundary layer, which results in a higher heat transfer rate. The further enhancement in heat transfer is due to the complexity in the flow field due to the presence of spring tape, which makes the flow more complex by generating secondary flow, recirculation and swirls, thereby enhancing the heat transfer rate.

3.2. Influence on the Friction Factor

The thermal performance of the thermal flow system also depends upon the friction factor. Higher friction factor results in a low thermal performance. Hence, one should consider the frictional losses seriously. The presence of inserts (corrugated spring tape) in the flow field helps in the augmentation of heat transfer, but it will also escalate the friction factor. The resulting pressure drop directly led to enhanced power for the same output. The various causes of pressure drops are enhanced contact between fluid and insert, reduction in dynamic pressure, formation of vortices in the flow field, generation of secondary vortex, etc. Figure 6a–c show that the friction factor (f) is the function of Re for different combinations of configuration and parameters. As expected in the turbulent flow regime, the friction factor shows a decreasing trend with an increase in the Re.
Figure 6a presented the plot for the friction factor as a function of Re for corrugated spring tape having a fixed spring ratio ‘t’ and variable depth ratio ‘h.’ Increase in the friction factor is noticed when the spring tape is employed. The highest friction factor has been noticed for t = 1.0 and h = 0.25. For a fixed t = 1.0, decreasing the value of h results in decreased friction factor.
Figure 6b shows the plot for friction factor (f) versus Re for corrugated spring tape having a fixed ‘h’ and variable ‘t’. Increase in friction factor is noticed when spring tape is employed. The highest friction factor has been noticed for t = 1.0 and h = 0.25. For a fixed h = 0.25, increasing the value of ‘t’ results in a decreased friction factor.
Figure 6c depicts the relationship of friction factor and Reynolds number in a conduit fitted with novel spring corrugated tape for all possible cases. The maximum friction factor is reported for spring tape having t = 1.0 and h = 0.25, while the minimum friction factor is noted for spring tape having t = 2.0 and h = 0.

3.3. Influence on the Thermal Performance Factor

Thermo-hydraulic performance factor symbolized by ‘η’ is represented by Equation (4) and is defined as the ratio of the Nusselt number enhancement (Nu/Nu0) and friction factor enhancement (f/f0). This factor is the best parameter to evaluate the actual enhancement in the thermal performance of a heat exchanger [20,21]. Figure 7a–c shows the various plot for thermo-hydraulic performance as a function of Re for different combinations of parameters.
Figure 7a shows the plot for the thermal performance factor (η) as a function of Re for corrugated spring tape with a fixed spring ratio ‘t’ and variable depth ratio ‘h.’ It is clear from Figure 7a that ‘η’ is above unity for all the cases, which prove the applicability of the present enhanced geometry. It is also clear from Figure 7a that an increase in the Reynolds number results in a diminishing thermal performance factor. The highest η is noted for t = 1.0 and h = 0.25 for all Re. A decrease in the value of h results in a decreased value of η.
Figure 7b shows the thermal performance factor (η) as a function of Re for corrugated spring tape having fixed ‘h’ and variable ‘t.’ The highest η is noted for t = 1.0 and h = 0.25 for all Re. Increase in the value of ‘t’ result in decreased value of η.
Figure 7c depicts the relationship of η and Reynolds number in a conduit fitted with novel spring corrugated tape for all possible cases. The highest η is noted for t = 1.0 and h = 0.25 for all Re, while the smallest η is noted for spring tape with t = 2.0 and h = 0. The hydro-thermal characteristics depend on fluid properties, flow conditions as well as geometric parameters of the fin geometry.
It is very important to compare the present geometry with the previously published geometry performance. Thus, the thermohydraulic performance of the present configurations is compared with previously studied geometries [83,84,85,86,87] and plotted in the Figure 8. By looking into Figure 8 one can easily understand that the present geometry offered superiority over other studied geometries.

4. ANN-Based Heat Transfer Prediction

In this section, the influence of using ANN is described exhaustively. After the experiment, we have received a good amount of data to be considered for future prediction generalization. The generated data were used to train an ANN model which afterward provided us a prediction of new inputs. The user-defined model architecture is discussed in Section 4.1 and the computational environment is described in Section 4.2.

4.1. Model

The initial step of the ANN-based approach is collecting and analyzing the experimental data that were taken to train the model. The architecture of the ANN-based approach for prediction was used. To understand the detailed architecture of the ANN-based model, let us first walk through the workflow of ANN.

4.1.1. Workflow of ANN

At the initial stage, the dataset is divided into three categories: training data, validation data and test data. A “neuron” in ANN is a single computing cell and the model is composed of several neurons. Each neuron has activation functions that are mathematical equations of the weighted sum of the outputs of the previous layer with a bias added to it. Different types of activation functions are binary-step functions, linear and non-linear activation functions are analyzed. The activation functions which are chosen in this work are as follows:
  • Linear: A straight line function where activation is proportional to the input (which is the weighted sum from the neuron). It can be written as:
    A(x) = cx.
  • Relu: It stands for Rectified Linear Units. The formula is deceptively simple: max (0, z). Despite its name and appearance, it is not linear and provides the same benefits as Sigmoid but with better performance. It can be written as:
    A ( z )   =   z   if   z   >   0   or A ( z )   =   0   if   z     0
The detailed workflow of ANN is described in the following five steps:
  • The training and validation set is imported as the input layer. The validation set is used to tune the parameters of a classifier, for example, to choose the number of hidden units in a neural network.
  • The input vector x = (x1(0),x2(0),…,xn(0)) is passed through the hidden layers of the neural network to produce an output:
    yk = f(zk)
    for an L layered neural network with 1 k < L . Here, f(x) is a nonlinear function, also known as the activation function.
    Z k = i = 1 n W i ( k 1 )   X i ( k 1 ) +   b ( k 1 )
    is a weighted input signal for a layer where 1 ≤ kL and bk is the bias obtained from the previous layer. After computation of (L−1) hidden layers, the final output i.e., the Lth layer’s output, is calculated as:
    yL = w(L−1)·y(L−1)
The choice of the activation function is variable depending on the required problem to be solved.
  • Subsequently, the error is measured using the predicted value and the real available value. The error is calculated as:
    e = a − yL
    where a is the real value and yL is the predicted value. This is also known as the cost function. A variety of cost functions are available like Mean Squared Error (MSE), Root Mean Squared Error (RMSE), etc. Choices are made based on the type of problem being solved. Barron [88] investigated various error functions to show how they affect the performance of a model.
  • Next, backpropagation is used, which is an important mathematical tool for improving the accuracy of predictions in ML. ANN uses backpropagation to compute a gradient descent with respect to the weights and biases of the connections with every neuron. For all weights of neurons in a level k, the gradient descent is updated as:
    w i k   ( new ) = w i k   ( old ) α   g ( e ) g ( w )
    b i k   ( new ) = b i k   ( old ) α   g ( e ) g ( w )
    where 1 k < L and 1 i n and α is the convergence factor. g ( x ) is the first order derivation of function g ( x ) .
  • The above steps are repeated until the error is minimized sufficiently and this is done by finding the optimal weights and biases.

4.1.2. Full NN Model Architecture

This is a five-layered neural network-based ML model to predict the Nusselt number, friction factor and thermohydraulic efficiency. Several tests are done using different numbers of neurons and hidden layers. Among them, a model with four hidden layers, each having 30–40 neurons, is determined to have good accuracy. The neural network with four hidden layers with 40 neurons in each hidden layer has the best accuracy, and hence, this configuration is suggested for comparison of the accuracy and calculation speed. The result is being shown in Table 3. To run the training, the batch size is taken as 12 and epoch size as 200. The change in training loss with an increase in epoch numbers is shown in Figure 9a,b. For leverage validation, the values from the test set are considered. Corresponding outputs are predicted and are shown with the actual experimental output values (Table 4). The values that are considered for this validation are mainly the lower and upper bounds values of the actual experimental inputs.

4.2. Computational Situation

All the experiments were run on Google Colab Notebook with an Nvidia GPU version 1.4.0 enabled, and Keras 2.4.0 was used as an API to train and test the neural network models, thus favoring a way to clone hardware configuration. The best model is reported after experimenting with different configuration of the models.

4.3. Predictions Using ANN

Figure 10a–c shows the assessment between the predicted and actual experimental value of the test data for Nu, f and η, respectively. From Figure 10a–c, one can understand that the ANN model fits the dataset acceptably. The performance of the models has reported an accuracy of more than 97% on the test dataset.
The detailed statistical analysis of the generated data is shown in Table 5, which includes a count of the data, mean, and standard deviation that elaborates the range or the distribution of the generated data.
The newly generated parameters for prediction are shown in Table 6. The Nusselt number, friction factor and thermohydraulic efficiency results of generated data are shown in Table 7, Table 8, Table 9 and Table 10. The inputs are new to the model, and hence, the accuracy is measured to their outcomes.
The present model for Nu, f and η will ease a huge workload by determining the required outputs. With given test data as mentioned in Table 7, Table 8, Table 9 and Table 10, the researchers working with some similar experimental work will get help to tune their parameters according to their needs and get their required result. It is important to note and consider an error factor of ±3–5% while considering the results.

5. Conclusions

The experiment was conducted to investigate the thermal performance of a circular channel with corrugated spring tape inserts. For this study, the following conclusions were drawn:
  • An enhancement in Nu was recorded with an increase of Re for all the cases.
  • The heat transfer was found to rise with an increased depth ratio. Likewise, the average Nu declined with a rise in the spring ratio.
  • The present geometrical configuration significantly better than the simple spring tape (60% to 75% increase in heat duty at constant pumping power and 20% to 31% reduction in pumping power at constant heat duty, without corrugation).
  • An ANN model was used for the regression analysis to predict the thermal energy transport coefficient, pressure penalty and thermohydraulic efficiency.
  • The models were evaluated to have an accuracy of 97.00% on unknown test data and the proposed model was able to reasonably forecast the Nu, f and η. The results obtained from the analysis can be conveniently used to design highly efficient tube type heat exchangers.
  • From the above results, it can be concluded that the use of corrugated spring tape is an effective technique to enhance the thermal energy transport coefficient.
  • These models will help the investigators working in heat transfer enhancement-based experiments to understand and predict the output.

Author Contributions

Conceptualization, B.S. and S.B.; methodology, B.S. and S.B.; software, S.B.; validation, M.W.A. and N.H.; formal analysis, B.S., S.B. and N.H.; investigation, B.S., S.B., N.H. and M.W.A.; resources, B.S.; data curation, B.S., S.B. and M.W.A.; writing—original draft preparation, B.S., S.B., N.H. and M.W.A.; writing—review and editing, B.S., S.B., N.H. and M.W.A.; visualization, B.S., S.B., N.H. and M.W.A.; supervision, B.S. and S.B.; project administration, B.S. and S.B.; funding acquisition, B.S. and M.W.A. All authors have read and agreed to the published version of the manuscript.

Funding

The authors gratefully acknowledge the Deanship of Scientific Research at King Faisal University for the financial support under Research Group Support Track (Grant No. 1811014).

Institutional Review Board Statement

Not applicable.

Informed Consent Statement

Not Applicable.

Data Availability Statement

Data is contained within the article.

Acknowledgments

The authors gratefully acknowledge the Deanship of Scientific Research at King Faisal University for the financial support under Research Group Support Track (Grant No. 1811014). They also would like to show their gratitude towards Sam Casting, MCKVIE and BITS Pilani, Pilani Campus (RIG Scheme) for their constant support and to Rahul Roy, Shramona Chakraborty and Devendra Kumar Vishwakarma as well for helping in this paper.

Conflicts of Interest

The authors declared that there are no conflicts of interest.

Nomenclature

Atube inner wall surface area, m2
bbreadth, m
cpheat capacity, J/kgK
Dinner diameter of test tube, m
fDarcy friction factor
hcconvective heat transfer coefficient, W/m2K
hdepth ratio
kfluid thermal conductivity, W/mK
Ltube length, m
mmass flow rate, kg/s
NuNusselt number
Δppressure drop, N/m2
PrPrandtl number
RwWall thermal resistance, K/W
qwWall heat flux
ReReynolds number
Ttemperature, K
t Spring ratios
δ tape thickness, m
Vbulk velocity for plain tube, m/s; voltage V
Greek Symbols
ρfluid density, kg/m3
Subscripts
bbulk
iinlet
ooutlet
owouter wall
winner wall
0plain tube (turbulator free)

References

  1. IEA. 2019|2020 Electricity Generation Contents. 2020. Available online: https://www.vgb.org/en/data_powergeneration.html?dfid=98054 (accessed on 29 December 2020).
  2. Bezaatpour, M.; Goharkhah, M. Convective heat transfer enhancement in a double pipe mini heat exchanger by magnetic field induced swirling flow. Appl. Therm. Eng. 2020, 167, 114801. [Google Scholar] [CrossRef]
  3. Thianpong, C.; Eiamsa-ard, P.; Wongcharee, K.; Eiamsa-ard, S. Compound heat transfer enhancement of a dimpled tube with a twisted tape swirl generator. Int. Commun. Heat Mass Transf. 2009, 36, 698–704. [Google Scholar] [CrossRef]
  4. Eiamsa-ard, S.; Promvonge, P. Enhancement of heat transfer in a tube with regularly-spaced helical tape swirl generators. Sol. Energy 2005, 78, 483–494. [Google Scholar] [CrossRef]
  5. Bhuiya, M.M.K.; Sayem, A.S.M.; Islam, M.; Chowdhury, M.S.U.; Shahabuddin, M. Performance assessment in a heat exchanger tube fitted with double counter twisted tape inserts. Int. Commun. Heat Mass Transf. 2014, 50, 25–33. [Google Scholar] [CrossRef]
  6. Bhattacharyya, S.; Sarkar, D.; Mahabaleshwar, U.S.; Soni, M.K.; Mohanraj, M. Experimental study of thermohydraulic characteristics and irreversibility analysis of novel axial corrugated tube with spring tape inserts. Eur. Phys. J. Appl. Phys. 2020, 92, 30901. [Google Scholar] [CrossRef]
  7. Bhattacharyya, S.; Benim, A.C.; Chattopadhyay, H.; Banerjee, A. Experimental investigation of heat transfer performance of corrugated tube with spring tape inserts. Exp. Heat Transf. 2019, 32, 411–425. [Google Scholar] [CrossRef]
  8. Bhattacharyya, S.; Bashir, A.I.; Dey, K.; Sarkar, R. Effect of novel short-length wavy-tape turbulators on fluid flow and heat transfer: Experimental study. Exp. Heat Transf. 2020, 33, 335–354. [Google Scholar] [CrossRef]
  9. Bhattacharyya, S.; Chattopadhyay, H.; Bandyopadhyay, S. Numerical study on heat transfer enhancement through a circular duct fitted with centre-trimmed twisted tape. Int. J. Heat Technol. 2016, 34, 401–406. [Google Scholar] [CrossRef]
  10. Bhattacharyya, S. The effects of short length and full length swirl generators on heat transfer and flow fields in a solar air heater tube. J. Therm. Anal. Calorim. 2020, 140, 1355–1369. [Google Scholar] [CrossRef]
  11. Singh, A.P.; Varun; Siddhartha. Effect of artificial roughness on heat transfer and friction characteristics having multiple arc shaped roughness element on the absorber plate. Sol. Energy 2014, 105, 479–493. [Google Scholar] [CrossRef]
  12. Lu, H.; Xu, M.; Gong, L.; Duan, X.; Chai, J.C. Effects of surface roughness in microchannel with passive heat transfer enhancement structures. Int. J. Heat Mass Transf. 2020, 148, 119070. [Google Scholar] [CrossRef]
  13. Ting, K.; Mozumder, A.K.; Das, P.K. Effect of surface roughness on heat transfer and entropy generation of mixed convection in nanofluid. Phys. Fluids 2019, 31, 093602. [Google Scholar] [CrossRef]
  14. Sagar, P.; Teotia, P.; Sahlot, A.D.; Thakur, H.C. Heat transfer analysis and optimization of engine fins of varying surface roughness. Mater. Today Proc. 2017, 4, 8565–8570. [Google Scholar] [CrossRef]
  15. Nilpueng, K.; Keawkamrop, T.; Ahn, H.S.; Wongwises, S. Effect of chevron angle and surface roughness on thermal performance of single-phase water flow inside a plate heat exchanger. Int. Commun. Heat Mass Transf. 2018, 91, 201–209. [Google Scholar] [CrossRef]
  16. Alammar, A.A.; Al-Mousawi, F.N.; Al-Dadah, R.K.; Mahmoud, S.M.; Hood, R. Enhancing thermal performance of a two-phase closed thermosyphon with an internal surface roughness. J. Clean. Prod. 2018, 185, 128–136. [Google Scholar] [CrossRef]
  17. Soontarapiromsook, J.; Mahian, O.; Dalkilic, A.S.; Wongwises, S. Effect of surface roughness on the condensation of R-134a in vertical chevron gasketed plate heat exchangers. Exp. Therm. Fluid Sci. 2018, 91, 54–63. [Google Scholar] [CrossRef]
  18. Bhattacharyya, S.; Chattopadhyay, H.; Guin, A.; Benim, A.C. Investigation of Inclined Turbulators for Heat Transfer Enhancement in a Solar Air Heater. Heat Transf. Eng. 2019, 40, 1451–1460. [Google Scholar] [CrossRef]
  19. Bhattacharyya, S.; Pathak, M.; Sharifpur, M.; Chamoli, S.; Ewim, D.R.E. Heat transfer and exergy analysis of solar air heater tube with helical corrugation and perforated circular disc inserts. J. Therm. Anal. Calorim. 2020. [Google Scholar] [CrossRef]
  20. Bhattacharyya, S.; Benim, A.C.; Pathak, M.; Chamoli, S.; Gupta, A. Thermohydraulic characteristics of inline and staggered angular cut baffle inserts in the turbulent flow regime. J. Therm. Anal. Calorim. 2020, 140, 1519–1536. [Google Scholar] [CrossRef]
  21. Bhattacharyya, S.; Chattopadhyay, H.; Banerjee, A.; Benim, A.C. Heat transfer and flow field in a circular twisted channel. In Proceedings of the MATEC Web of Conferences, Cracow, Poland, 21–24 May 2018; Volume 240. [Google Scholar]
  22. Saha, S.K.; Bhattacharyya, S.; Pal, P.K. Thermohydraulics of laminar flow of viscous oil through a circular tube having integral axial rib roughness and fitted with center-cleared twisted-tape. Exp. Therm. Fluid Sci. 2012, 41, 121–129. [Google Scholar] [CrossRef]
  23. Murugesan, P.; Mayilsamy, K.; Suresh, S. Turbulent heat transfer and pressure drop in tube fitted with square-cut twisted tape. Chin. J. Chem. Eng. 2010, 18, 609–617. [Google Scholar] [CrossRef]
  24. Bhattacharyya, S.; Chattopadhyay, H.; Haldar, A. Design of twisted tape turbulator at different entrance angle for heat transfer enhancement in a solar heater. Beni-Suef Univ. J. Basic Appl. Sci. 2018, 7, 118–126. [Google Scholar] [CrossRef]
  25. Promvonge, P. Thermal performance in square-duct heat exchanger with quadruple V-finned twisted tapes. Appl. Therm. Eng. 2015, 91, 298–307. [Google Scholar] [CrossRef]
  26. Pantzali, M.N.; Kanaris, A.G.; Antoniadis, K.D.; Mouza, A.A.; Paras, S.V. Effect of nanofluids on the performance of a miniature plate heat exchanger with modulated surface. Int. J. Heat Fluid Flow 2009, 30, 691–699. [Google Scholar] [CrossRef]
  27. Rashidi, S.; Eskandarian, M.; Mahian, O.; Poncet, S. Combination of nanofluid and inserts for heat transfer enhancement: Gaps and challenges. J. Therm. Anal. Calorim. 2019, 135, 437–460. [Google Scholar] [CrossRef]
  28. Silva, F.A.S.; Salviano, L.O. Heat Transfer Enhancement in a Flat-Plate Solar Water Heater Through Longitudinal Vortex Generator. J. Sol. Energy Eng. Trans. ASME 2019, 141, 1–6. [Google Scholar] [CrossRef]
  29. Rezaei Gorjaei, A.; Shahidian, A. Heat transfer enhancement in a curved tube by using twisted tape insert and turbulent nanofluid flow: An experimental study. J. Therm. Anal. Calorim. 2019, 137, 1059–1068. [Google Scholar] [CrossRef]
  30. Dadvand, A.; Hosseini, S.; Aghebatandish, S.; Khoo, B.C. Enhancement of heat and mass transfer in a microchannel via passive oscillation of a flexible vortex generator. Chem. Eng. Sci. 2019, 207, 556–580. [Google Scholar] [CrossRef]
  31. Arulprakasajothi, M.; Chandrasekhar, U.; Elangovan, K.; Yuvarajan, D. Influence of conical strip inserts in heat transfer enhancement under transition flow. Int. J. Ambient Energy 2020, 41, 511–516. [Google Scholar] [CrossRef]
  32. Gnanavel, C.; Saravanan, R.; Chandrasekaran, M. Heat transfer enhancement through nano-fluids and twisted tape insert with rectangular cut on its rib in a double pipe heat exchanger. Mater. Today Proc. 2020, 21, 865–869. [Google Scholar] [CrossRef]
  33. Gnanavel, C.; Saravanan, R.; Chandrasekaran, M. Heat transfer augmentation by nano-fluids and circular fin insert in double tube heat exchanger-A numerical exploration. Mater. Today Proc. 2020, 21, 934–939. [Google Scholar] [CrossRef]
  34. Keklikcioglu, O.; Dagdevir, T.; Ozceyhan, V. Second law analysis of a mixture of ethylene glycol/water flow in modified heat exchanger tube by passive heat transfer enhancement technique. J. Therm. Anal. Calorim. 2020, 140, 1307–1320. [Google Scholar] [CrossRef]
  35. Klemeš, J.J.; Wang, Q.W.; Varbanov, P.S.; Zeng, M.; Chin, H.H.; Lal, N.S.; Li, N.Q.; Wang, B.; Wang, X.C.; Walmsley, T.G. Heat transfer enhancement, intensification and optimisation in heat exchanger network retrofit and operation. Renew. Sustain. Energy Rev. 2020, 120. [Google Scholar] [CrossRef]
  36. Saffarian, M.R.; Moravej, M.; Doranehgard, M.H. Heat transfer enhancement in a flat plate solar collector with different flow path shapes using nanofluid. Renew. Energy 2020, 146, 2316–2329. [Google Scholar] [CrossRef]
  37. Sheikholeslami, M.; Jafaryar, M.; Said, Z.; Alsabery, A.I.; Babazadeh, H.; Shafee, A. Modification for helical turbulator to augment heat transfer behavior of nanomaterial via numerical approach. Appl. Therm. Eng. 2021, 182, 115935. [Google Scholar] [CrossRef]
  38. Gholami, M.; Nazari, M.R.; Talebi, M.H.; Pourfattah, F.; Akbari, O.A.; Toghraie, D. Natural convection heat transfer enhancement of different nanofluids by adding dimple fins on a vertical channel wall. Chin. J. Chem. Eng. 2020, 28, 643–659. [Google Scholar] [CrossRef]
  39. Li, P.; Guo, D.; Huang, X. Heat transfer enhancement, entropy generation and temperature uniformity analyses of shark-skin bionic modified microchannel heat sink. Int. J. Heat Mass Transf. 2020, 146, 118846. [Google Scholar] [CrossRef]
  40. Yu, J.S.; Kim, J.H.; Kim, J.T. Effect of triangular baffle arrangement on heat transfer enhancement of air-type PVT collector. Sustainability 2020, 12, 7469. [Google Scholar] [CrossRef]
  41. Chen, S.; Mao, J.; Han, X.; Li, C.; Liu, L. Numerical analysis of the factors influencing a vertical U-tube ground heat exchanger. Sustainability 2016, 8, 882. [Google Scholar] [CrossRef] [Green Version]
  42. Giwa, S.O.; Sharifpur, M.; Goodarzi, M.; Alsulami, H.; Meyer, J.P. Influence of base fluid, temperature, and concentration on the thermophysical properties of hybrid nanofluids of alumina–ferrofluid: Experimental data, modeling through enhanced ANN, ANFIS, and curve fitting. J. Therm. Anal. Calorim. 2020, 143, 4149–4167. [Google Scholar] [CrossRef]
  43. Osman, S.; Sharifpur, M.; Meyer, J.P. Experimental investigation of convection heat transfer in the transition flow regime of aluminium oxide-water nanofluids in a rectangular channel. Int. J. Heat Mass Transf. 2019, 133, 895–902. [Google Scholar] [CrossRef] [Green Version]
  44. Mahdavi, M.; Sharifpur, M.; Meyer, J.P. Discrete modelling of nanoparticles in mixed convection flows. Powder Technol. 2018, 338, 243–252. [Google Scholar] [CrossRef]
  45. Giwa, S.O.; Sharifpur, M.; Meyer, J.P. Effects of uniform magnetic induction on heat transfer performance of aqueous hybrid ferrofluid in a rectangular cavity. Appl. Therm. Eng. 2020, 170, 115004. [Google Scholar] [CrossRef]
  46. Sharifpur, M.; Solomon, A.B.; Ottermann, T.L.; Meyer, J.P. Optimum concentration of nanofluids for heat transfer enhancement under cavity flow natural convection with TiO2—Water. Int. Commun. Heat Mass Transf. 2018, 98, 297–303. [Google Scholar] [CrossRef]
  47. Giwa, S.O.; Sharifpur, M.; Meyer, J.P. Experimental study of thermo-convection performance of hybrid nanofluids of Al2O3-MWCNT/water in a differentially heated square cavity. Int. J. Heat Mass Transf. 2020, 148, 119072. [Google Scholar] [CrossRef]
  48. Adio, S.A.; Sharifpur, M.; Meyer, J.P. Influence of ultrasonication energy on the dispersion consistency of Al2O3–glycerol nanofluid based on viscosity data, and model development for the required ultrasonication energy density. J. Exp. Nanosci. 2016, 11, 630–649. [Google Scholar] [CrossRef] [Green Version]
  49. Erickson, B.J.; Korfiatis, P.; Akkus, Z.; Kline, T.L. Machine learning for medical imaging. Radiographics 2017, 37, 505–515. [Google Scholar] [CrossRef]
  50. Bell, J. Chapter 5—Artificial Neural Networks; OREILLY: Boston, MA, USA, 2014. [Google Scholar]
  51. Panchal, J.H.; Fuge, M.; Liu, Y.; Missoum, S.; Tucker, C. Special Issue: Machine Learning for Engineering Design. J. Mech. Des. 2019, 141. [Google Scholar] [CrossRef]
  52. Langley, P.; Simon, H.A. Applications of Machine Learning and Rule Induction. Commun. ACM 1995, 38, 54–64. [Google Scholar] [CrossRef]
  53. Al-Shedivat, M.; Dubey, A.; Xing, E. Contextual explanation networks. J. Mach. Learn. Res. 2020, 21, 18–19. [Google Scholar]
  54. Siau, K.; Wang, W. Building trust in artificial intelligence, machine learning, and robotics. Cut. Bus. Technol. J. 2018, 31, 47–53. [Google Scholar]
  55. Brunton, S.L.; Noack, B.R.; Koumoutsakos, P. Machine Learning for Fluid Mechanics. arXiv 2019, 52, 477–508. [Google Scholar] [CrossRef] [Green Version]
  56. Joss, L.; Müller, E.A. Machine Learning for Fluid Property Correlations: Classroom Examples with MATLAB. J. Chem. Educ. 2019, 96, 697–703. [Google Scholar] [CrossRef]
  57. Raissi, M.; Yazdani, A.; Karniadakis, G.E. Hidden fluid mechanics: Learning velocity and pressure fields from flow visualizations. Science 2020, 367, 1026–1030. [Google Scholar] [CrossRef] [PubMed]
  58. Lindqvist, K.; Wilson, Z.T.; Næss, E.; Sahinidis, N.V. A machine learning approach to correlation development applied to fin-tube bundle heat exchangers. Energies 2018, 11, 3450. [Google Scholar] [CrossRef] [Green Version]
  59. Baghban, A.; Kahani, M.; Nazari, M.A.; Ahmadi, M.H.; Yan, W.M. Sensitivity analysis and application of machine learning methods to predict the heat transfer performance of CNT/water nanofluid flows through coils. Int. J. Heat Mass Transf. 2019, 128, 825–835. [Google Scholar] [CrossRef]
  60. Kwon, B.; Ejaz, F.; Hwang, L.K. Machine learning for heat transfer correlations. Int. Commun. Heat Mass Transf. 2020, 116, 104694. [Google Scholar] [CrossRef]
  61. Krishnayatra, G.; Tokas, S.; Kumar, R. Numerical heat transfer analysis & predicting thermal performance of fins for a novel heat exchanger using machine learning. Case Stud. Therm. Eng. 2020, 21, 100706. [Google Scholar] [CrossRef]
  62. Ahmadi, M.H.; Ghazvini, M.; Maddah, H.; Kahani, M.; Pourfarhang, S.; Pourfarhang, A.; Heris, S.Z. Prediction of the pressure drop for CuO/(Ethylene glycol-water) nanofluid flows in the car radiator by means of Artificial Neural Networks analysis integrated with genetic algorithm. Phys. A Stat. Mech. Appl. 2020, 546, 124008. [Google Scholar] [CrossRef]
  63. Golzar, F.; Nilsson, D.; Martin, V. Forecasting wastewater temperature based on artificial neural network (ANN) technique and Monte Carlo sensitivity analysis. Sustainability 2020, 12, 6386. [Google Scholar] [CrossRef]
  64. Koroleva, A.P.; Kuzmenkov, N.V.; Frantcuzov, M.S. Application of machine learning methods for investigating the heat transfer enhancement performance in a circular tube with artificial roughness. J. Phys. Conf. Ser. 2020, 1675. [Google Scholar] [CrossRef]
  65. Abdollahi, A.; Shams, M. Optimization of shape and angle of attack of winglet vortex generator in a rectangular channel for heat transfer enhancement. Appl. Therm. Eng. 2015, 81, 376–387. [Google Scholar] [CrossRef]
  66. Sotgiu, C.; Weigand, B.; Semmler, K. A turbulent heat flux prediction framework based on tensor representation theory and machine learning. Int. Commun. Heat Mass Transf. 2018, 95, 74–79. [Google Scholar] [CrossRef]
  67. Karkaba, H.; Dbouk, T.; Habchi, C.; Russeil, S.; Lemenand, T.; Bougeard, D. Multi objective optimization of vortex generators for heat transfer enhancement using large design space exploration. Chem. Eng. Process. Process Intensif. 2020, 154, 107982. [Google Scholar] [CrossRef]
  68. Barzegar Gerdroodbary, M. Application of neural network on heat transfer enhancement of magnetohydrodynamic nanofluid. Heat Transf. Asian Res. 2020, 49, 197–212. [Google Scholar] [CrossRef]
  69. Jovic, S.; Kalaba, D.; Zivkovic, P.; Virijevic, A. Potential of adaptive neuro-fuzzy methodology for investigation of heat transfer enhancement of a minichannel heat sink. Phys. A Stat. Mech. Appl. 2019, 523, 516–524. [Google Scholar] [CrossRef]
  70. Wei, H.; Zhao, S.; Rong, Q.; Bao, H. Predicting the effective thermal conductivities of composite materials and porous media by machine learning methods. Int. J. Heat Mass Transf. 2018, 127, 908–916. [Google Scholar] [CrossRef]
  71. Zhang, Y.; Xu, X. Predicting the thermal conductivity enhancement of nanofluids using computational intelligence. Phys. Lett. Sect. A Gen. At. Solid State Phys. 2020, 384, 126500. [Google Scholar] [CrossRef]
  72. Komeilibirjandi, A.; Raffiee, A.H.; Maleki, A.; Alhuyi Nazari, M.; Safdari Shadloo, M. Thermal conductivity prediction of nanofluids containing CuO nanoparticles by using correlation and artificial neural network. J. Therm. Anal. Calorim. 2020, 139, 2679–2689. [Google Scholar] [CrossRef]
  73. Ahmadi, M.H.; Baghban, A.; Sadeghzadeh, M.; Hadipoor, M.; Ghazvini, M. Evolving connectionist approaches to compute thermal conductivity of TiO2/water nanofluid. Phys. A Stat. Mech. Appl. 2020, 540, 122489. [Google Scholar] [CrossRef]
  74. Wu, Y.J.; Fang, L.; Xu, Y. Predicting interfacial thermal resistance by machine learning. NPJ Comput. Mater. 2019, 5, 1–2. [Google Scholar] [CrossRef] [Green Version]
  75. Tawfik, S.A.; Isayev, O.; Spencer, M.J.S.; Winkler, D.A. Predicting Thermal Properties of Crystals Using Machine Learning. Adv. Theory Simul. 2020, 3, 1–6. [Google Scholar] [CrossRef]
  76. Alade, I.O.; Abd Rahman, M.A.; Saleh, T.A. Predicting the specific heat capacity of alumina/ethylene glycol nanofluids using support vector regression model optimized with Bayesian algorithm. Sol. Energy 2019, 183, 74–82. [Google Scholar] [CrossRef]
  77. Ahmadi, M.H.; Mohseni-Gharyehsafa, B.; Ghazvini, M.; Goodarzi, M.; Jilte, R.D.; Kumar, R. Comparing various machine learning approaches in modeling the dynamic viscosity of CuO/water nanofluid. J. Therm. Anal. Calorim. 2020, 139, 2585–2599. [Google Scholar] [CrossRef]
  78. Ramezanizadeh, M.; Ahmadi, M.H.; Nazari, M.A.; Sadeghzadeh, M.; Chen, L. A review on the utilized machine learning approaches for modeling the dynamic viscosity of nanofluids. Renew. Sustain. Energy Rev. 2019, 114, 109345. [Google Scholar] [CrossRef]
  79. Sadeghzadeh, M.; Ahmadi, M.H.; Kahani, M.; Sakhaeinia, H.; Chaji, H.; Chen, L. Smart modeling by using artificial intelligent techniques on thermal performance of flat-plate solar collector using nanofluid. Energy Sci. Eng. 2019, 7, 1649–1658. [Google Scholar] [CrossRef]
  80. Maddah, H.; Aghayari, R.; Ahmadi, M.H.; Rahimzadeh, M.; Ghasemi, N. Prediction and modeling of MWCNT/Carbon (60/40)/SAE 10 W 40/SAE 85 W 90(50/50) nanofluid viscosity using artificial neural network (ANN) and self-organizing map (SOM). J. Therm. Anal. Calorim. 2018, 134, 2275–2286. [Google Scholar] [CrossRef]
  81. Dittus, F.W.; Boelter, L.M.K. Heat Transfer in Automobile Radiators of Tubular Type, 443–461. Berkeley Univ. California. Publ. Eng 1930, 2, 13. [Google Scholar]
  82. Meyer, J.P.; Everts, M.; Coetzee, N.; Grote, K.; Steyn, M. Heat transfer coefficients of laminar, transitional, quasi-turbulent and turbulent flow in circular tubes. Int. Commun. Heat Mass Transf. 2019, 105, 84–106. [Google Scholar] [CrossRef]
  83. Wang, W.; Zhang, Y.; Li, B.; Li, Y. Numerical investigation of tube-side fully developed turbulent flow and heat transfer in outward corrugated tubes. Int. J. Heat Mass Transf. 2018, 116, 115–126. [Google Scholar] [CrossRef]
  84. Chang, S.W.; Yang, T.L.; Liou, J.S. Heat transfer and pressure drop in tube with broken twisted tape insert. Exp. Therm. Fluid Sci. 2007, 32, 489–501. [Google Scholar] [CrossRef]
  85. Promvonge, P. Thermal performance in circular tube fitted with coiled square wires. Energy Convers. Manag. 2008, 49, 980–987. [Google Scholar] [CrossRef]
  86. Mohammed, H.A.; Abbas, A.K.; Sheriff, J.M. Influence of geometrical parameters and forced convective heat transfer in transversely corrugated circular tubes. Int. Commun. Heat Mass Transf. 2013, 44, 116–126. [Google Scholar] [CrossRef]
  87. Eiamsa-ard, S.; Rattanawong, S.; Promvonge, P. Turbulent convection in round tube equipped with propeller type swirl generators. Int. Commun. Heat Mass Transf. 2009, 36, 357–364. [Google Scholar] [CrossRef]
  88. Barron, J.T. A general and adaptive robust loss function. In Proceedings of the IEEE Conference on Computer Vision and Pattern Recognition, Long Beach, CA, USA, 16–20 June 2019; pp. 4331–4339. [Google Scholar]
Figure 1. (a) Schematic diagram of corrugated spring tape and (b) photographic view of the spring tape.
Sustainability 13 03023 g001
Figure 2. Schematic diagram of the experimental setup.
Sustainability 13 03023 g002
Figure 3. Comparison of the present experimental Nu data with the correlation.
Sustainability 13 03023 g003
Figure 4. Comparison of the present experimental friction factor data with the correlation.
Sustainability 13 03023 g004
Figure 5. The Nusselt number as a function of the Reynolds number: (a) corrugated spring tapes for varying depth ratios while keeping the spring ratio fixed at 1.0, (b) corrugated spring tapes for varying spring ratios while keeping the depth ratio fixed at 0.25 and (c) comparison between all the tested configured parameters.
Sustainability 13 03023 g005
Figure 6. Friction factor as a function of the Reynolds number: (a) corrugated spring tapes for varying depth ratios while keeping the spring ratio fixed at 1.0, (b) corrugated spring tapes for varying spring ratios while keeping the depth ratio fixed at 0.25 and (c) comparison between all the tested configured parameters.
Sustainability 13 03023 g006aSustainability 13 03023 g006b
Figure 7. Thermohydraulic efficiency as a function of Reynolds number: (a) corrugated spring tapes for varying depth ratios while keeping the spring ratio fixed at 1.0, (b) corrugated spring tapes for varying spring ratios while keeping the depth ratio fixed at 0.25 and (c) comparison between all the tested configured parameters.
Sustainability 13 03023 g007aSustainability 13 03023 g007b
Figure 8. Plot showing the comparability of thermo-hydraulic performance (η) of the present investigation with previous studies.
Sustainability 13 03023 g008
Figure 9. Mean squared error as the function of epochs: (a) Nu, (b) f and (c) η.
Sustainability 13 03023 g009
Figure 10. Predicted and experimental values for corrugated spring tape: (a) Nu, (b) f and (c) η.
Sustainability 13 03023 g010
Table 1. Measuring range of instruments.
InstrumentRange
DC power supply0–1 500 W
Thermocouples−100–350 °C
Rotameter(i) 0–120 l/h, and
(ii) 0–540 l/h
U-tube Manometer0–150 mm Hg
Table 2. Various configurations of hybrid tapes.
Spring ratios (t = P/D) = 1.0, 2.0, and 3.0.
Depth ratio: (h = e/W) = 0.16, and 0.25.
Channel Diameter (D) = 0.02 m
Length of Channel (L) = 2.00 m
Tube thickness (δ) = 2.00 mm
Reynolds number: (Re) = 10,000 to 71,000.
Table 3. Training accuracy.
Output ParametersTest Error (%)
Nusselt Number98.25
Friction Factor97.89
Thermohydraulic Efficiency98.74
Table 4. Leverage Validation.
Actual Nusselt NumberPredicted Nusselt NumberSpring RatiosDepth RatioReynolds Number
137.729134.22610.00056,647.063
104.401103.04810.25013,657.714
46.66945.72420.00013,932.029
171.270173.04920.25056,530.302
Actual Friction FactorPredicted Friction FactorSpring RatiosDepth RatioReynolds Number
0.0250.02410.00070,670.947
0.0520.05210.25010,100.000
0.0330.03420.00010,325.645
0.0400.04120.25070,759.913
Actual Thermohydraulic EfficiencyPredicted Thermohydraulic EfficiencySpring RatiosDepth RatioReynolds Number
1.0861.08310.00020,280.421
1.0851.08510.25068,287.116
1.0581.05820.00010,325.645
1.0401.03520.25068,613.056
Table 5. Analysis of the generated data.
Spring RatioDepth RatioReynolds Number
Count776776776
Mean1.850.1931,428.57
Standard Deviation0.610.07319,798.55
Table 6. New generated parameters for prediction.
Sl. No.ParametersValues
1Spring Ratios0.5, 0.75, 1.25, 1.75, 2.25, 2.5, 2.75, and 3
2Depth Ratio0.1, 0.12, 0.17, 0.22, 0.27 and 0.30
3Reynolds number (Re)10,000, 15,000, 20,000, 25,000, 30,000, 50,000 and 70,000
Table 7. Predicted result of Nu, f and η with the generated data at a constant spring ratio of 0.5.
Sl. NoSpring RatiosDepth RatioNusselt NumberReynolds NumberFriction FactorEfficiency
10.50.115,00079.379960.035222171.1265842
20.50.120,00090.35960.0336314141.0964329
30.50.150,000151.327510.0285426830.98946524
40.50.170,000188.502660.0285585150.9411039
50.50.1210,00076.449160.0410028031.2566105
60.50.1215,00087.772880.039210721.1936426
70.50.1250,000161.645970.0319917241.0116853
80.50.1270,000195.887910.032004890.9546453
90.50.2710,000117.53470.0525790531.731573
100.50.2715,000128.207460.0513205271.5592642
110.50.2750,000195.002990.045856791.0967546
120.50.2770,000221.643250.0458656850.99121326
130.50.310,000118.0740360.0521242661.7174882
140.50.315,000128.152240.050871621.5457976
150.50.350,000194.971620.0454903771.0872625
160.50.370,000222.198230.045501070.9797186
Table 8. Predicted result of Nu, f and η with the generated data at a constant spring ratio of 0.75.
Sl. NoSpring RatiosDepth RatioNusselt NumberReynolds NumberFriction FactorEfficiency
10.750.110,00067.997440.0364948251.1545019
20.750.115,00078.825270.0347502231.1164212
30.750.150,000150.758440.0281460210.9856459
40.750.170,000187.990260.0282185260.93835825
50.750.1210,00075.7084960.0405062771.2372814
60.750.1215,00087.061830.03869771.1797061
70.750.1250,000160.941880.031562291.0071446
80.750.1270,000195.304980.0316397730.951452
90.750.2710,000115.35940.052165851.7006153
100.750.2715,000126.0302350.0509078731.5363052
110.750.2750,000193.656160.045351871.0875276
120.750.2770,000220.564420.0453593840.9855498
130.750.310,000115.871050.0517286771.6873885
140.750.315,000125.8950350.05047681.5236944
150.750.350,000193.473890.0449953861.0782328
160.750.370,000221.027880.044998290.9740696
Table 9. Predicted result of Nu, f and η with the generated data at a constant spring ratio of 2.75.
Sl. NoSpring RatiosDepth RatioNusselt NumberReynolds NumberFriction FactorEfficiency
12.750.110,00064.389680.0328345371.0981691
22.750.115,00075.111410.031365641.0711987
32.750.150,000146.708760.0254308660.9651202
42.750.170,000183.031880.0254140070.92323864
52.750.1210,00071.107240.036243661.1564618
62.750.1215,00082.249230.0346799121.1184247
72.750.1250,000155.224010.0284027770.9830122
82.750.1270,000189.70210.0283899160.93364227
92.750.2710,000101.193610.0482719761.5135043
102.750.2715,000111.372760.0469784661.3949823
112.750.2750,000180.698260.0409353931.0376029
122.750.2770,000210.356380.0406665540.9524145
132.750.310,000101.365780.048005951.5002298
142.750.315,000110.758130.0467337371.380851
152.750.350,000179.580520.0408955921.0287775
162.750.370,000210.035460.04056350.9411752
Table 10. Predicted result of Nu, f and η with the generated data at a constant spring ratio of 3.0.
Sl. NoSpring RatiosDepth RatioNusselt NumberReynolds NumberFriction FactorEfficiency
130.110,00064.0248640.032405271.0953414
230.115,00074.698140.0309728511.0688862
330.150,000146.405870.0251586330.96376675
430.170,000182.361190.0250609370.9221999
530.1210,00070.680530.0357221741.1523054
630.1215,00081.7398150.0342012641.1152515
730.1250,000154.669660.028055070.9813919
830.1270,000188.91340.027960310.93236125
930.2710,00099.770540.04770521.4983823
1030.2715,000109.915050.0464004241.3836051
1130.2750,000179.015010.040388741.0341384
1230.2770,000208.945160.040036340.9498908
1330.310,00099.9377060.0474673551.48402
1430.315,000109.264680.0461846371.3687065
1530.350,000177.788680.0404005421.0253074
1630.370,000208.547330.039995330.93863714
Publisher’s Note: MDPI stays neutral with regard to jurisdictional claims in published maps and institutional affiliations.

