
Building a Model of Integration of Urban Sharing and Public Transport Services


Abstract
:1. Introduction
2. Literature Review
2.1. Urban Sharing Services Parameters
2.2. Users and Integration of Sharing Services
- Lifestyle: person’s activeness level, demographics (diversified age-dependent transport needs), social media (Chung et al. [66]), education level, technological literacy (Kuijer et al. [67]), accessibility of stops (Kopp et al. [68]), traveling destination (Echaniz et al. [41]), fact of holding a driving license (Krueger et al. [69]);
3. Classification and Parameterization of Sharing Services
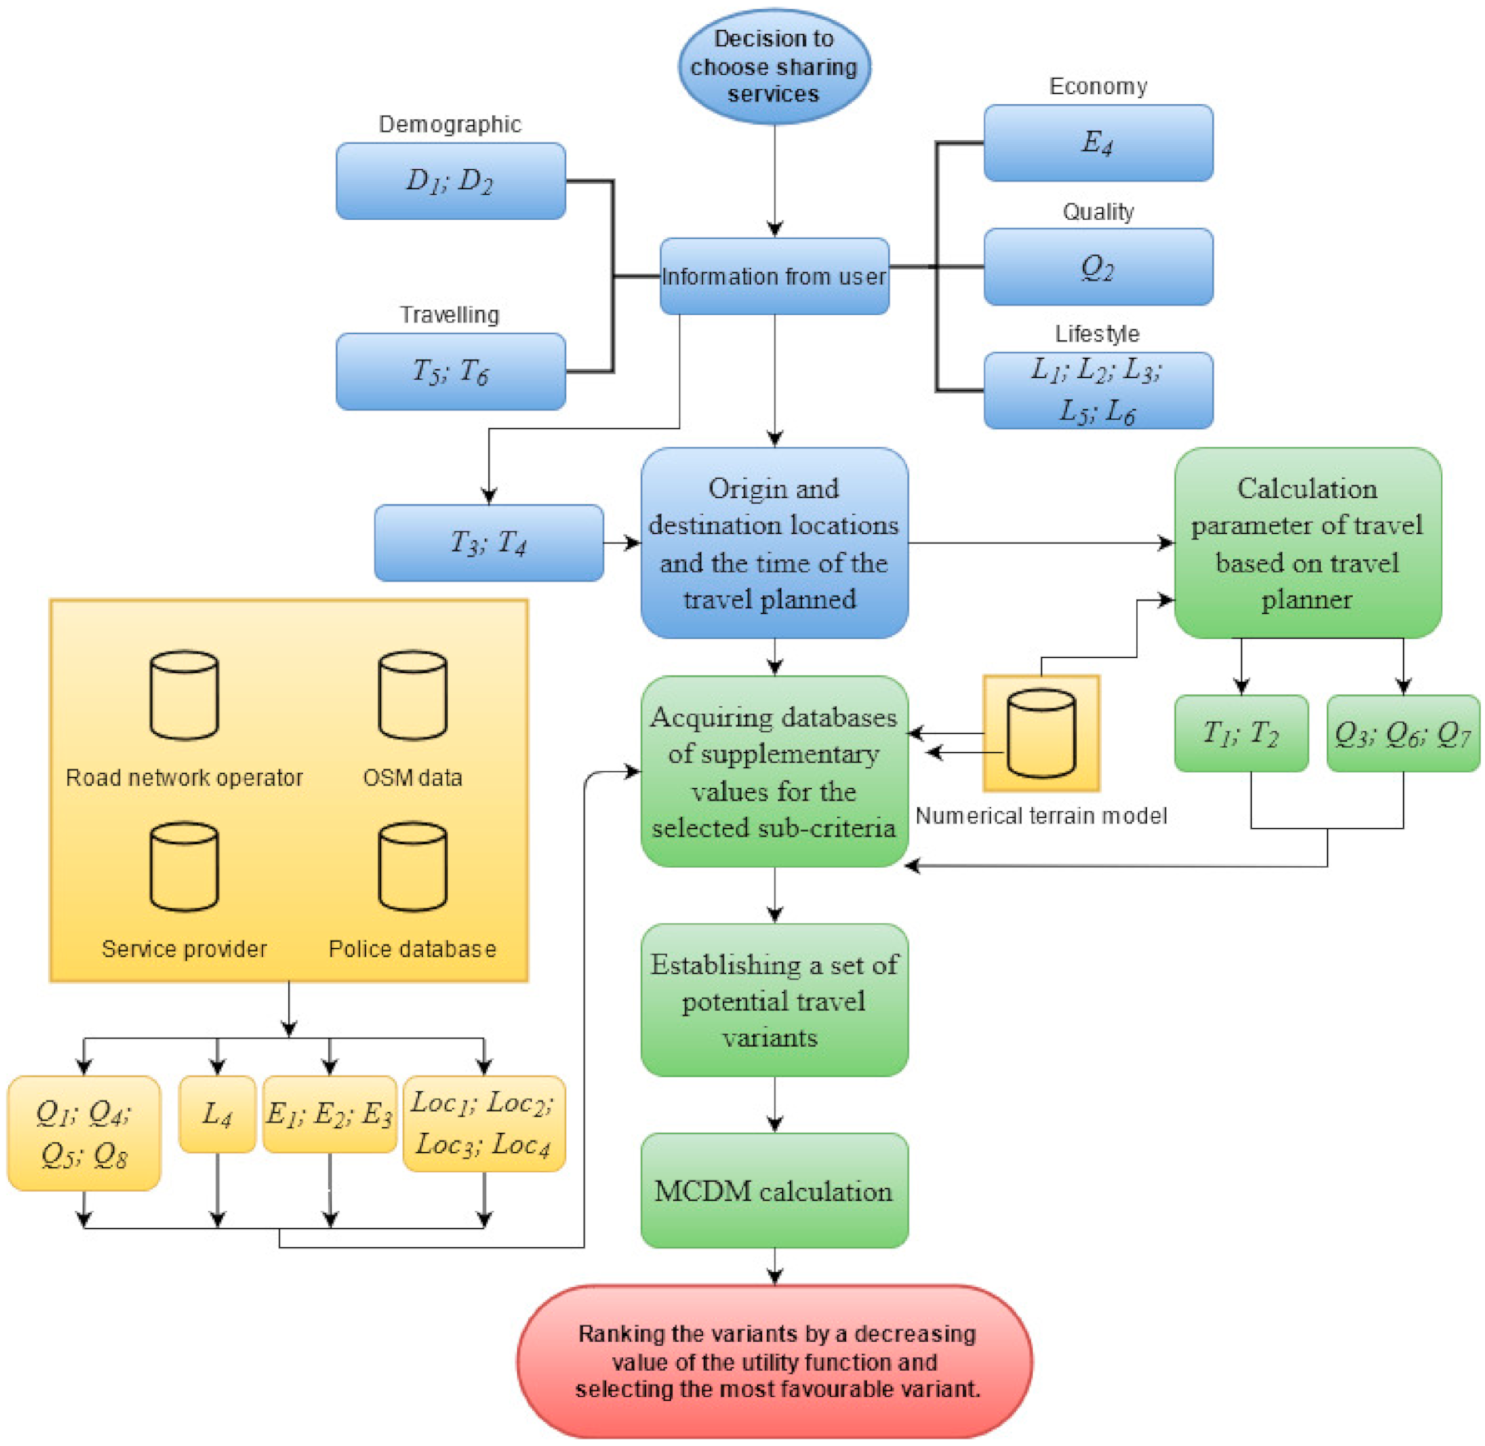
4. Integration Method Including Optimization of the Use of Sharing Services
- K—set of global criteria used in the model.
4.1. Normalising the Values of the Sub-Criteria Weights and Determining Normalised Weights for the Global Criteria
4.2. Establishing a Set of Solution Variants (Potential Travel Variants)
4.3. Normalising the Sub-Criteria Values and Establishing the Global Criteria Values for All Travel Variants
5. Example and Discussion
6. Conclusions
Author Contributions
Funding
Institutional Review Board Statement
Informed Consent Statement
Data Availability Statement
Acknowledgments

Conflicts of Interest
Appendix A

| Parameter’s Impact on Utility | |||||
|---|---|---|---|---|---|
| Parameter | Bike Sharing | Car Sharing | Scooters | Travel Sharing Services | Public Transport |
| Loc1 | Percentage share of bicycle paths in the route planned: 100%—1 80%—0.75 60%—0.50 40%—0.25 Less than 40%—0 | There is a highly developed road and street network in the city. There are no infrastructural problems. 1 | (Schellong et al. [13]) Percentage share of bicycle paths in the route planned (depending on the municipal policy): 100%—1 80%—0.75 60%—0.50 40%—0.25 Less than 40%—0 | There is a highly developed road and street network in the city. There are no infrastructural problems. 1 | There is a highly developed road and street network in the city. There are no infrastructural problems. 1 |
| Loc2 | Inclination of the route planned (Broach et al. [80]): 0%—1 1–2%—0.75 2–4%—0.50 4–6%—0.25 More than 6%—0 For electric bicycles—1 | No effect of terrain inclination on the use of motor vehicles. 1 | No effect of terrain inclination on the use of electric scooters. 1 | No effect of terrain inclination on the use of motor vehicles. 1 | No effect of terrain inclination on the use of motor vehicles. 1 |
| Loc3 | Bicycle can be left anywhere—1 Must be docked—0 | Parking space guaranteed at a publicly accessible place—1 Large number of parking spaces near the destination—0.50 Small number of parking spaces near the destination—0 | (Schellong et al. [13]) Scooter can be left anywhere—1 Must be returned to a dedicated zone—0 | Parking space guaranteed at a publicly accessible place—1 Large number of parking spaces near the destination—0.50 Small number of parking spaces near the destination—0 | No problem—1 |
| Loc4 | For human-powered bicycles, depending on distance in kilometers: 48 and more—0 40–48—0.2 32–40—0.4 24–32—0.6 16–24—0.8 0–16—1 For electric vehicles, on account of long charging time (for maximum range of ca. 150 km) (Langford et al. [81]): SOC above 80%—1 SOC of 60–80%—0.75 SOC of 40–60%—0.50 SOC of 20–40%—0.25 SOC below 20%—0 | For conventionally propelled vehicles—1 For electric vehicles, on account of long charging time (for maximum range of ca. 350 km) (Schlüter et al. [82]): SOC above 80%—1 SOC of 60–80%—0.75 SOC of 40–60%—0.50 SOC of 20–40%—0.25 SOC below 20%—0 | For human-powered bicycles—1 For electric vehicles, on account of long charging time (for maximum range of ca. 40 km) (Schellong et al. [13]): SOC above 80%—1 SOC of 60–80%—0.75 SOC of 40–60%—0.50 SOC of 20–40%—0.25 SOC below 20%—0 | For electric vehicles—0 For traditional engine vehicles—0.50 No need to charge/refuel—1 | No impact: factor out of passenger’s consideration—1 |
| D1 | Age (Böcker et al. [83]): 0–20—0.50 21–30—1 31–40—0.75 40–60—0.25 More than 60—0 | Age (Kim et al. [84]): 0–20—0 21–30—1 31–40—0.75 40–60—0.25 More than 60—0 | Age (Degele et al. [85]): 0–20—0.75 21–30—1 31–40—0.75 40–60—0.50 More than 60—0 | No effect—1 | No effect—1 |
| D2 | Frequency of use by gender (Langford et al. [81]): Men—1 Women—0.75 | Frequency of use by gender (Kim et al. [84]): Men—1 Women—0.25 | Frequency of use by gender (Ciociola et al. [86]): Men—1 Women—0.50 | No variable—1 | No variable—1 |
| T1 | Time (min) (Du et al. [87]): <5—1 5–10—1 10–20—0.75 20–30—0.50 30>—0 | Time (min) (Martin et al. [88]): <10—0.75 10–20—1 20–30—0.50 30–40—0 40>—0.25 | Time (min) (Noland [89]): <5—1 5–10—1 10–20—1 20–30—0.50 30>—0 | Time (min) <10—0.25 10–20—0.50 20–30—1 30–40—1 40>—1 | Time (min) (Soczówka et al. [89]): 0–10—0.50 10–15—0.75 15–25—1 25–35—0.75 35–45—0.50 45–60—0.25 60>—0 |
| T2 | Distance (m) (Ye et al. [90]): 500—0.75 800—0.50 1000—1 1500—0.25 | Distance (km) (Xu et al. [91]): <10 km—1 10–20—0.75 20–40—0.50 >40—0.25 | Distance (km) (Schellong et al. [13]): 0.5–1—1 1–2—0.75 2–3—0.50 3–4—0.25 More than 4—0 | Distance (km) (Schellong et al. [13]): 2–1 5—1>15—0 | Distance (km) (Schellong et al. [13]): 1–8—1 8–12—0.75 12–15—0.50 15–20—0.25 More than 20—0 |
| T3 | Walking distance from bicycle or dock (min) (Kim et al. [64]): 0–2—1 2–4—0.75 4–8—0.50 8–10—0.25 10 and more—0 | Walking distance from car (min) (Ferrero et al. [28]): 0–3—1 3–6—0.75 6–9—0.50 9–12—0.25 12 and more—0 | Walking distance from scooter or scooter parking zone (min) (Ferrero et al. [28]): 0–1—1 1–2—0.75 2–3—0.50 3–4—0.25 4 and more—0 | No factor—1 | Walking distance from stop to destination (min) (Soczówka et al. [92]): 0–5—1 5–10—0.75 10–15—0.50 15–20—0.25 20 and more—0 |
| T4 | Walking distance from dock to destination (min) (Kim et al. [64]): 0–2—1 2–4—0.75 4–8—0.50 8–10—0.25 10 and more—0 For dockless bicycles—1 | Walking distance from parking (min) (Ferrero et al. [28]): 0–3—1 3–6—0.75 6–9—0.50 9–12—0.25 12 and more—0 | Walking distance from vehicle leaving place to destination (min) (Schellong et al. [13]): 0–1—1 1–2—0.75 2–3—0.50 3–4—0.25 4 and more—0 For dockless stand-up scooters—1 | Assuming that the vehicle can be left at any generally accessible parking area—1 | Walking distance from stop to destination (min) (Soczówka et al. [92]): 0–5—1 5–10—0.75 10–15—0.50 15–20—0.25 20 and more—0 |
| T5 | Travel planned well in advanced and vehicle booked—1 Spontaneous travel—0 | Travel planned well in advanced and vehicle booked—1 Spontaneous travel—0 | Travel planned well in advanced and vehicle booked—1 Spontaneous travel—0 | Travel planned well in advanced and vehicle booked—1 Spontaneous travel—0 | Travel planned slightly in advance—1 Unplanned travel—0 |
| T6 | Light-weight shopping—1 Other—0 Cargo bicycle available—1 | Shopping—1 Large shopping—0.75 Large size cargo—0 | No cargo—1 Rucksack—0.75 Other—0 | Shopping—1 Large shopping—0.75 Large size cargo—0 | No cargo—1 Rucksack—0.75 Large shopping—0.50 Other—0 |
| E1 | Data from service provider (miscellaneous depending on services and country) | Data from service provider (miscellaneous depending on services and country) | Data from service provider (miscellaneous depending on services and country) | Data from service provider (miscellaneous depending on services and country) | Data from service provider (miscellaneous depending on services and country) |
| E2 | None—1 | Data from service provider (miscellaneous depending on services and country) | None—1 | Data from service provider (miscellaneous depending on services and country) | None—1 |
| E3 | Data from service provider (miscellaneous depending on services and country) Having discounts—1 No discounts—0 | Data from service provider (miscellaneous depending on services and country) Having discounts—1 No discounts—0 | Data from service provider (miscellaneous depending on services and country) Having discounts—1 No discounts—0 | Data from service provider (miscellaneous depending on services and country) Having discounts—1 No discounts—0 | Data from service provider (miscellaneous depending on services and country) Having discounts—1 No discounts—0 |
| E4 | none | Depending on number of people: 5—1 4—0.75 3—0.50 2—0.25 1—0 | none | Depending on number of people: 5—1 4—0.75 3—0.50 2—0.25 1—0 | none |
| Q1 | Sunny weather with good temperatures—1 Sunny weather with low temperatures—0.75 Windy weather—0.50 Rainy—0.25 Snowy—0 | No weather impact on use—1 | Sunny weather with good temperatures—1 Sunny weather with low temperatures—0.75 Windy weather—0.50 Rainy—0.25 Snowy—0 | No weather impact on use—1 | No weather impact on use—1 |
| Q2 | (Xu et al. [91]) High willingness to change transport modes to reach the next destination—1 Unwillingness to change transport modes—0 | (Zoepf et al. [93]) High willingness to change transport modes to reach the next destination—1 Unwillingness to change transport modes—0 | (Xu et al. [91]) High willingness to change transport modes to reach the next destination—1 Unwillingness to change transport modes—0 | (Zoepf et al. [93]) High willingness to change transport modes to reach the next destination—1 Unwillingness to change transport modes—0 | (Zoepf et al. [93]) High willingness to change transport modes to reach the next destination—1 Unwillingness to change transport modes—0 |
| Q3 | Bicycles provide high flexibility; congestion has no significant impact on traveling—1 | High traffic volume—0 Medium traffic volume—0.50 Low traffic volume—1 | Stand-up scooters provide high flexibility; congestion has no significant impact on traveling—1 | High traffic volume—0 Medium traffic volume—0.50 Low traffic volume—1 | High traffic volume—0 Medium traffic volume—0.50 Low traffic volume—1 |
| Q4 | Number of robberies/thefts above average for the area of analysis or fatalities—0.25 Number of robberies/thefts around average value (±5%) for the analyzed area—0.50 Number of robberies/thefts below the average for the analyzed area—0.75 No robbery/theft and casualties—1 | Negligible influence of the parameter—a person traveling on the route remains in a closed vehicle—1 | Number of robberies/thefts above average for the area of analysis or fatalities—0.25 Number of robberies/thefts around average value (±5%) for the analyzed area—0.50 Number of robberies/thefts below the average for the analyzed area—0.75 No robbery/theft and casualties—1 | Negligible influence of the parameter—a person traveling on the route remains in a closed vehicle—1 | Number of robberies/thefts above average for the area of analysis or fatalities—0.25 Number of robberies/thefts around average value (±5%) for the analyzed area—0.50 Number of robberies/thefts below the average for the analyzed area—0.75 No robbery/theft and casualties—1 |
| Q5 | Number of collisions above the average for the area of analysis or fatalities—0.25 Number of collisions around (±5%) the mean value for the analysis area—0.50 Number of collisions below the average for the analyzed area—0.75 No collisions and no casualties—1 | Number of collisions above the average for the area of analysis or fatalities—0.25 Number of collisions around (±5%) the mean value for the analysis area—0.50 Number of collisions below the average for the analyzed area—0.75 No collisions and no casualties—1 | Number of collisions above the average for the area of analysis or fatalities—0.25 Number of collisions around (±5%) the mean value for the analysis area—0.50 Number of collisions below the average for the analyzed area—0.75 No collisions and no casualties—1 | No influence (another person is driving the vehicle)—1 | No influence (another person is driving the vehicle)—1 |
| Q6 | None—1 | None—1 | None—1 | None—1 | Time (min) 0–2—1 2–4—0.75 4–6—0.50 6–8—0.25 8 and more—0 |
| Q7 | No need to ride on footpaths—1 Riding on footpaths necessary—0.50 Riding on crowded footpaths necessary—0 | None—1 | No need to ride on footpaths—1 Riding on footpaths necessary—0.50 Riding on crowded footpaths necessary—0 | None—1 | None—1 |
| Q8 | Mobile application for paying is available—1 Payment at the dock only—0 | Payment by mobile application—1 | Mobile application for paying is available—1 Payment at the dock only—0 | Payment by mobile application—1 | Payment by mobile application—1 Conventional ticket-based payment—0 |
| L1 | Conventional bicycle—1 Electric bicycle—0.75 | Conventional car—0 Electric car—1 | Electric stand-up scooter—1 | Electric vehicle travel sharing—1 Conventional vehicle travel sharing—0.75 | Electric vehicle travel sharing—1 Conventional vehicle travel sharing—0.50 |
| L2 | (Xu et al. [91]) Car owned—0.25 Car not owned—1 | Number of cars owned (Zoepf et al. [93]): 0—1 1—0.50 2 and more—0 | Car owned—0 Car not owned—1 | Car ownership: Car owned—0 Car not owned—1 | Car ownership: Car owned—0 Car not owned—1 |
| L3 | (Xu et al. [91]) Bicycle owned—0.50 Bicycle not owned—1 | No impact—1 | No impact—1 | No impact—1 | No impact—1 |
| L4 | Application with information on available vehicles and booking feature—1 No information—0 | Application with information on available vehicles and booking feature—1 No information—0 | Application with information on available vehicles and booking feature—1 No information—0 | Application with information on available rides and booking feature—1 No information—0 | Application with information on rides and delays—1 Application with information on rides—0.75 No mobile information—0 |
| L5 | No impact—1 | Driving license held—1 No driving license—0 | No impact—1 | No impact—1 | No impact—1 |
| L6 | Improving fitness—1 | No impact | Improving fitness—0.50 | No impact | No impact |
References
- Kepaptsoglou, K.; Meerschaert, V.; Neergaard, K.; Papadimitriou, S.; Rye, T.; Schremser, R.; Vleugels, I. Quality Management in Mobility Management: A Scheme for Supporting Sustainable Transportation in Cities. Int. J. Sustain. Transp. 2012, 6, 238–256. [Google Scholar] [CrossRef]
- Zarabi, Z.; Gerber, P.; Lord, S. Travel Satisfaction vs. Life Satisfaction: A Weighted Decision-Making Approach. Sustainability 2019, 11, 5309. [Google Scholar] [CrossRef] [Green Version]
- Griggs, D.; Stafford-Smith, M.; Gaffney, O.; Rockström, J.; Öhman, M.C.; Shyamsundar, P.; Noble, I. Sustainable develop-ment goals for people and planet. Nature 2013, 495, 305–307. [Google Scholar] [CrossRef] [PubMed]
- Okraszewska, R.; Romanowska, A.; Wołek, M.; Oskarbski, J.; Birr, K.; Jamroz, K. Integration of a multilevel transport sys-tem model into sustainable urban mobility planning. Sustainability 2018, 10, 479. [Google Scholar] [CrossRef] [Green Version]
- Kampf, R.; Lizbetin, J.; Lizbetinova, L. Requirements of a transport system user. Commun. Sci. Lett. Univ. Zilina 2012, 14, 106–108. [Google Scholar]
- UN HABITAT III. United Nations Conference on Housing and Sustainable Urban Development. Policy Pap. 2016, 9, 35. [Google Scholar]
- Jorge, D.; Correia, G. Carsharing systems demand estimation and defined operations: A literature review. Eur. J. Transp. In-frastruct. Res. 2013, 13, 201–220. [Google Scholar]
- Quak, H.; De Koster, R. The impacts of time access restrictions and vehicle weight restrictions on food retailers and the envi-ronment. Eur. J. Transp. Infrastruct. Res. 2006, 6, 131–150. [Google Scholar]
- Boitor, M.R.; Antov, D.; Iliescu, M.; Antso, I.; Mäe, R. Sustainable Urban Transport Planning. Rom. J. Transp. Infrastruct. 2013, 2, 39–50. [Google Scholar] [CrossRef] [Green Version]
- Golightly, D.; Houghton, R.; Hughes, N.; Sharples, S. Human factors in exclusive and shared use in the UK transport system. Gov. Off. Sci. 2019, 1–63. [Google Scholar]
- Chen, F.; Turoń, K.; Kłos, M.; Czech, P.; Pamuła, W.; Sierpiński, G. Fifth-generation bike-sharing systems: Examples from Poland and China. Sci. J. Sil. Univ. Technol. 2018, 99, 5–13. [Google Scholar] [CrossRef]
- Shaheen, S.; Chan, N.; Bansal, A.; Cohen, A. Shared Mobility: A Sustainability and Technologies Workshop. In Definitions, Industry Developments, and Early Understanding; Transportation Sustainability Research Center: Berkeley, CA, USA, 2015; p. 30. [Google Scholar]
- Schellong, D.; Sadek, P.; Schaetzberger, C.; Barrack, T. The promise and pitfalls of e-scooter sharing. Europe 2019, 12, 15. [Google Scholar]
- Fishman, E. Bikeshare: A Review of Recent Literature. Transp. Rev. 2016, 36, 92–113. [Google Scholar] [CrossRef]
- Saberi, M.; Ghamami, M.; Gu, Y.; Shojaei, M.H.; Fishman, E. Understanding the impacts of a public transit disruption on bicycle sharing mobility patterns: A case of Tube strike in London. J. Transp. Geogr. 2018, 66, 154–166. [Google Scholar] [CrossRef]
- Laporte, G.; Meunier, F.; Calvo, R.W. Shared mobility systems: An updated survey. Ann. Oper. Res. 2018, 271, 105–126. [Google Scholar] [CrossRef] [Green Version]
- Caspi, O.; Smart, M.J.; Noland, R.B. Spatial associations of dockless shared e-scooter usage. Transp. Res. Part D Transp. Environ. 2020, 86, 102396. [Google Scholar] [CrossRef]
- Wang, R.; Liu, C. Bicycle-transit integration in the United States, 2001–2009. J. Public Transp. 2013, 16, 95–119. [Google Scholar] [CrossRef]
- Faghih-Imani, A.; Eluru, N.; El-Geneidy, A.M.; Rabbat, M.; Haq, U. How land-use and urban form impact bicycle flows: Evidence from the bicycle-sharing system (BIXI) in Montreal. J. Transp. Geogr. 2014, 41, 306–314. [Google Scholar] [CrossRef]
- Abolhassani, L.; Afghari, A.P.; Borzadaran, H.M. Public preferences towards bicycle sharing system in developing countries: The case of Mashhad, Iran. Sustain. Cities Soc. 2019, 44, 763–773. [Google Scholar] [CrossRef]
- Mattia, G.; Mugion, R.G.; Principato, L. Shared mobility as a driver for sustainable consumptions: The intention to re-use free-floating car sharing. J. Clean. Prod. 2019, 237, 117404. [Google Scholar] [CrossRef]
- Aguilera-García, Á.; Gomez, J.; Sobrino, N. Exploring the adoption of moped scooter-sharing systems in Spanish urban areas. Cities 2020, 96, 102424. [Google Scholar] [CrossRef]
- Kaan, L.; Olinick, E.V. The Vanpool Assignment Problem: Optimization models and solution algorithms. Comput. Ind. Eng. 2013, 66, 24–40. [Google Scholar] [CrossRef]
- Daraio, C.; Diana, M.; Di Costa, F.; Leporelli, C.; Matteucci, G.; Nastasi, A. Efficiency and effectiveness in the urban public transport sector: A critical review with directions for future research. Eur. J. Oper. Res. 2016, 248, 1–20. [Google Scholar] [CrossRef] [Green Version]
- Kim, K. Can carsharing meet the mobility needs for the low-income neighborhoods? Lessons from carsharing usage patterns in New York City. Transp. Res. Part A Policy Pract. 2015, 77, 249–260. [Google Scholar] [CrossRef]
- Yannis, G.; Kopsacheili, A.; Dragomanovits, A.; Petraki, V. State-of-the-art review on multi-criteria decision-making in the transport sector. J. Traffic Transp. Eng. 2020, 7, 413–431. [Google Scholar] [CrossRef]
- Sochor, J.; Arby, H.; Karlsson, I.M.; Sarasini, S. A topological approach to Mobility as a Service: A proposed tool for un-derstanding requirements and effects, and for aiding the integration of societal goals. Res. Transp. Bus. Manag. 2018, 27, 3–14. [Google Scholar] [CrossRef]
- Ferrero, F.; Perboli, G.; Rosano, M.; Vesco, A. Car-sharing services: An annotated review. Sustain. Cities Soc. 2018, 37, 501–518. [Google Scholar] [CrossRef]
- Giesecke, R.; Surakka, T.; Hakonen, M. Conceptualising Mobility as a Service. In Proceedings of the 2016 Eleventh International Conference on Ecological Vehicles and Renewable Energies (EVER), Monte Carlo, Monaco, 6–8 April 2016; pp. 1–11. [Google Scholar]
- Chan, N.D.; Shaheen, S.A. Ridesharing in North America: Past, Present, and Future. Transp. Rev. 2012, 32, 93–112. [Google Scholar] [CrossRef]
- Cieśla, M.; Sobota, A.; Jacyna, M. Multi-Criteria Decision Making Process in Metropolitan Transport Means Selection Based on the Sharing Mobility Idea. Sustainability 2020, 12, 7231. [Google Scholar] [CrossRef]
- Orr, B.; MacArthur, J.; Dill, J. The Portland E-Scooter Experience; TREC Friday Seminar Series. 163. 2019. Available online: https://pdxscholar.library.pdx.edu/trec_seminar/163/ (accessed on 10 March 2021).
- Li, W.; Kamargianni, M. Providing quantified evidence to policy makers for promoting bike-sharing in heavily air-polluted cities: A mode choice model and policy simulation for Taiyuan-China. Transp. Res. Part A Policy Pract. 2018, 111, 277–291. [Google Scholar] [CrossRef]
- Wang, L.; Li, C.; Chen, M.Z.Q.; Wang, Q.-G.; Tao, F. Connectivity-Based Accessibility for Public Bicycle Sharing Systems. IEEE Trans. Autom. Sci. Eng. 2018, 15, 1521–1532. [Google Scholar] [CrossRef]
- Verbas, İ.Ö.; Mahmassani, H.S. Optimal allocation of service frequencies over transit network routes and time periods: Formulation, solution, and implementation using bus route patterns. Transp. Res. Rec. 2013, 2334, 50–59. [Google Scholar] [CrossRef]
- Corcoran, J.; Li, T.; Rohde, D.; Charles-Edwards, E.; Mateo-Babiano, D. Spatio-temporal patterns of a Public Bicycle Sharing Program: The effect of weather and calendar events. J. Transp. Geogr. 2014, 41, 292–305. [Google Scholar] [CrossRef]
- Shen, Y.; Zhang, X.; Zhao, J. Understanding the usage of dockless bike sharing in Singapore. Int. J. Sustain. Transp. 2018, 12, 686–700. [Google Scholar] [CrossRef]
- Hensher, D.A. Future bus transport contracts under a mobility as a service (MaaS) regime in the digital age: Are they likely to change? Transp. Res. Part A Policy Pract. 2017, 98, 86–96. [Google Scholar] [CrossRef] [Green Version]
- Huwer, U. Public transport and csar-sharing—benefits and effects of combined services. Transp. Policy 2004, 11, 77–87. [Google Scholar] [CrossRef]
- Ritzinger, U.; Puchinger, J.; Hartl, R.F. A survey on dynamic and stochastic vehicle routing problems. Int. J. Prod. Res. 2016, 54, 215–231. [Google Scholar] [CrossRef] [Green Version]
- Echaniz, E.; Dell’Olio, L.; Ibeas, Á. Modelling perceived quality for urban public transport systems using weighted variables and random parameters. Transp. Policy 2018, 67, 31–39. [Google Scholar] [CrossRef]
- Melis, A.; Mirri, S.; Prandi, C.; Prandini, M.; Salomoni, P.; Callegati, F. Integrating Personalized and Accessible Itineraries in MaaS Ecosystems through Microservices. Mob. Netw. Appl. 2017, 23, 167–176. [Google Scholar] [CrossRef]
- Caulfield, B.; O’Mahony, M.; Brazil, W.; Weldon, P. Examining usage patterns of a bike-sharing scheme in a medium sized city. Transp. Res. Part A Policy Pract. 2017, 100, 152–161. [Google Scholar] [CrossRef]
- Shaheen, S.; Cohen, A.; Zohdy, I. Shared Mobility: Current Practices and Guiding Principles; U.S. Department of Transportation, Federal Highway Administration: Washington, DC, USA, 2016; p. 120. [Google Scholar]
- Michaelis, M.; Schöbel, A. Integrating line planning, timetabling, and vehicle scheduling: A customer-oriented heuristic. Public Transp. 2009, 1, 211–232. [Google Scholar] [CrossRef] [Green Version]
- Chuanjiao, S.; Wei, Z.; Yuanqing, W. Scheduling combination and headway optimization of bus rapid transit. J. Transp. Syst. Eng. Inf. Technol. 2008, 8, 61–67. [Google Scholar]
- Fleury, S.; Tom, A.; Jamet, E.; Colas-Maheux, E. What drives corporate carsharing acceptance? A French case study. Transp. Res. Part F Traffic Psychol. Behav. 2017, 45, 218–227. [Google Scholar] [CrossRef]
- Jung, J.; Jayakrishnan, R.; Park, J.Y. Dynamic Shared-Taxi Dispatch Algorithm with Hybrid-Simulated Annealing. Comput. Civ. Infrastruct. Eng. 2016, 31, 275–291. [Google Scholar] [CrossRef]
- Cevallos, F.; Zhao, F. Minimizing transfer times in public transit network with genetic algorithm. Transp. Res. Rec. 2006, 1971, 74–79. [Google Scholar] [CrossRef]
- Fleurent, C.; Lessard, R.; Séguin, L. Transit timetable synchronization: Evaluation and optimization. In Proceedings of the 9th International Conference on Computer-Aided Scheduling of Public Transport (CASPT), San Diego, CA, USA, 9–11 August 2004. [Google Scholar]
- Saharidis, G.K.; Dimitropoulos, C.; Skordilis, E. Minimizing waiting times at transitional nodes for public bus transportation in Greece. Oper. Res. 2014, 14, 341–359. [Google Scholar] [CrossRef]
- Ahillen, M.; Mateo-Babiano, D.; Corcoran, J. Dynamics of bike sharing in Washington, DC and Brisbane, Australia: Implications for policy and planning. Int. J. Sustain. Transp. 2015, 10, 441–454. [Google Scholar] [CrossRef]
- Calvo, R.W.; De Luigi, F.; Haastrup, P.; Maniezzo, V. A distributed geographic information system for the daily car pooling problem. Comput. Oper. Res. 2004, 31, 2263–2278. [Google Scholar] [CrossRef]
- Shaheen, S.A.; Mallery, M.A.; Kingsley, K.J. Personal vehicle sharing services in North America. Res. Transp. Bus. Manag. 2012, 3, 71–81. [Google Scholar] [CrossRef] [Green Version]
- Kamargianni, M.; Li, W.; Matyas, M.; Schäfer, A. A Critical Review of New Mobility Services for Urban Transport. Transp. Res. Procedia 2016, 14, 3294–3303. [Google Scholar] [CrossRef] [Green Version]
- Utriainen, R.; Pöllänen, M. Review on mobility as a service in scientific publications. Res. Transp. Bus. Manag. 2018, 27, 15–23. [Google Scholar] [CrossRef]
- Kostrzewska, M.; Macikowski, B. Towards Hybrid Urban Mobility: Kick Scooter as a Means of Individual Transport in the City. IOP Conf. Ser. Mater. Sci. Eng. 2017, 245, 052073. [Google Scholar] [CrossRef] [Green Version]
- Porru, S.; Missoa, F.E.; Pani, F.E.; Repetto, C. Smart mobility and public transport: Opportunities and challenges in rural and urban areas. J. Traffic Transp. Eng. 2020, 7, 88–97. [Google Scholar] [CrossRef]
- Hart, T.C.; Miethe, T.D. Street robbery and public bus stops: A case study of activity nodes and situational risk. Secur. J. 2014, 27, 180–193. [Google Scholar] [CrossRef]
- Carrignon, D. Connected and Autonomous Vehicles, Electric Scooter and Their Implications for Road Network Design. Transp. Res. Procedia 2020, 49, 160–169. [Google Scholar] [CrossRef]
- Simon, D.; Arfvidsson, H.; Anand, G.; Bazaz, A.; Fenna, G.; Foster, K.; Nyambuga, C. Developing and testing the Urban Sustainable Development Goal’s targets and indicators—A five-city study. Environ. Urban. 2016, 28, 49–63. [Google Scholar] [CrossRef]
- Sierpiński, G. Model of incentives for changes of the modal split of traffic towards electric personal cars. In Proceedings of the International Conference on Transport. Systems Telematics, Ustron, Poland, 22–25 October 2014; Springer: Berlin/Heidelberg, Germany, 2014; pp. 450–460. [Google Scholar]
- Schneider, R.J. Theory of routine mode choice decisions: An operational framework to increase sustainable transportation. Transp. Policy 2013, 25, 128–137. [Google Scholar] [CrossRef]
- Kim, J.; Rasouli, S.; Timmermans, H. Satisfaction and uncertainty in car-sharing decisions: An integration of hybrid choice and random regret-based models. Transp. Res. Part A Policy Pract. 2017, 95, 13–33. [Google Scholar] [CrossRef]
- Lu, Q.-C.; Zhang, J.; Peng, Z.-R.; Rahman, A.S. Inter-city travel behaviour adaptation to extreme weather events. J. Transp. Geogr. 2014, 41, 148–153. [Google Scholar] [CrossRef]
- Chung, N.; Koo, C. The use of social media in travel information search. Telemat. Inform. 2015, 32, 215–229. [Google Scholar] [CrossRef]
- Kuijer, S.C. Implications of Social Practice Theory for Sustainable Design. Ph.D. Thesis, Delft University of Technology, Delft, The Netherlands, 2014. [Google Scholar]
- Kopp, J.; Gerike, R.; Axhausen, K.W. Do sharing people behave differently? An empirical evaluation of the distinctive mobility patterns of free-floating car-sharing members. Transportation 2015, 42, 449–469. [Google Scholar] [CrossRef]
- Krueger, R.; Rashidi, T.H.; Rose, J.M. Preferences for shared autonomous vehicles. Transp. Res. Part C Emerg. Technol. 2016, 69, 343–355. [Google Scholar] [CrossRef]
- Miralinaghi, M.; Peeta, S. Design of a Multiperiod Tradable Credit Scheme under Vehicular Emissions Caps and Traveler Heterogeneity in Future Credit Price Perception. J. Infrastruct. Syst. 2020, 26, 04020030. [Google Scholar] [CrossRef]
- Sinha, K.C.; Labi, S. Transportation Decision Making: Principles of Project Evaluation and Programming; John Wiley Sons: Hoboken, NJ, USA, 2007. [Google Scholar]
- Hilgert, T.; Kagerbauer, M.; Schuster, T.; Becker, C. Optimization of individual travel behavior through customized mobil-ity services and their effects on travel demand and transportation systems. Transp. Res. Procedia 2016, 19, 58–69. [Google Scholar] [CrossRef]
- Piazza, G.; Bracco, S.; Delfino, F.; Siri, S. Optimal design of electric mobility services for a Local Energy Community. Sustain. Energy Grids Netw. 2021, 26, 100440. [Google Scholar] [CrossRef]
- Mourad, A.; Puchinger, J.; Chu, C. A survey of models and algorithms for optimizing shared mobility. Transp. Res. Part B Methodol. 2019, 123, 323–346. [Google Scholar] [CrossRef]
- Esztergár-Kiss, D. Trip Chaining Model with Classification and Optimization Parameters. Sustainability 2020, 12, 6422. [Google Scholar] [CrossRef]
- Wątróbski, J.; Małecki, K.; Kijewska, K.; Iwan, S.; Karczmarczyk, A.; Thompson, R.G. Multi-Criteria Analysis of Electric Vans for City Logistics. Sustainability 2017, 9, 1453. [Google Scholar] [CrossRef] [Green Version]
- Kobryń, A. Wielokryterialne Wspomaganie Decyzji w Gospodarowaniu Przestrzenią; Difin: Warszawa, Poland, 2014. [Google Scholar]
- Saaty, T.; Ozdemir, M. Why the magic number seven plus or minus two. Math. Comput. Model. 2003, 38, 233–244. [Google Scholar] [CrossRef]
- Sierpiński, G.; Staniek, M.; Kłos, M.J. Decision Making Support for Local Authorities Choosing the Method for Siting of In-City EV Charging Stations. Energies 2020, 13, 4682. [Google Scholar] [CrossRef]
- Broach, J.; Dill, J.; Gliebe, J. Where do cyclists ride? A route choice model developed with revealed preference GPS data. Transp. Res. Part A Policy Pract. 2012, 46, 1730–1740. [Google Scholar] [CrossRef]
- Langford, B.C.; Cherry, C.R.; Bassett, D.R., Jr.; Fitzhugh, E.C.; Dhakal, N. Comparing physical activity of pedal-assist electric bikes with walking and conventional bicycles. J. Transp. Health 2017, 6, 463–473. [Google Scholar] [CrossRef]
- Schlüter, J.; Weyer, J. Car sharing as a means to raise acceptance of electric vehicles: An empirical study on regime change in automobility. Transp. Res. Part F Traffic Psychol. Behav. 2019, 60, 185–201. [Google Scholar] [CrossRef]
- Böcker, L.; Anderson, E.; Uteng, T.P.; Throndsen, T. Bike sharing use in conjunction to public transport: Exploring spatio-temporal, age and gender dimensions in Oslo, Norway. Transp. Res. Part A Policy Pract. 2020, 138, 389–401. [Google Scholar] [CrossRef]
- Kim, D.; Park, Y.; Ko, J. Factors underlying vehicle ownership reduction among carsharing users: A repeated cross-sectional analysis. Transp. Res. Part D Transp. Environ. 2019, 76, 123–137. [Google Scholar] [CrossRef]
- Degele, J.; Gorr, A.; Haas, K.; Kormann, D.; Krauss, S.; Lipinski, P.; Tenbih, M.; Koppenhoefer, C.; Fauser, J.; Hertweck, D. Identifying E-Scooter Sharing Customer Segments Using Clustering. In Proceedings of the 2018 IEEE International Conference on Engineering, Technology and Innovation (ICE/ITMC), Stuttgart, Germany, 17–20 June 2018; pp. 1–8. [Google Scholar]
- Ciociola, A.; Cocca, M.; Giordano, D.; Vassio, L.; Mellia, M. E-Scooter Sharing: Leveraging Open Data for System Design. In Proceedings of the 2020 IEEE/ACM 24th International Symposium on Distributed Simulation and Real Time Applications (DS-RT), Prague, Czech Republic, 14–16 September 2020; pp. 1–8. [Google Scholar]
- Du, M.; Cheng, L. Better Understanding the Characteristics and Influential Factors of Different Travel Patterns in Free-Floating Bike Sharing: Evidence from Nanjing, China. Sustainability 2018, 10, 1244. [Google Scholar] [CrossRef] [Green Version]
- Martin, E.; Pan, A.; Shaheen, S. An Evaluation of Free-Floating Carsharing in Oakland, California. UC Berkeley Transp. Sustain. Res. Cent. 2020. [Google Scholar] [CrossRef]
- Noland, R.B. Trip patterns and revenue of shared e-scooters in Louisville, Kentucky. Transp. Find. 2019, 29. [Google Scholar] [CrossRef]
- Ye, M.; Chen, Y.; Yang, G.; Wang, B.; Hu, Q. Mixed Logit Models for Travelers’ Mode Shifting Considering Bike-Sharing. Sustainability 2020, 12, 2081. [Google Scholar] [CrossRef] [Green Version]
- Xu, D.; Bian, Y.; Shu, S. Research on the Psychological Model of Free-floating Bike-Sharing Using Behavior: A Case Study of Beijing. Sustainability 2020, 12, 2977. [Google Scholar] [CrossRef] [Green Version]
- Soczówka, R.; Żochowska, R.; Sobota, A.; Kłos, M.J. Wpływ czynników związanych z podróżą na czas dojścia do przystanku publicznego transportu zbiorowego. Transp. Miej. Reg. 2020, 7–13. Available online: https://yadda.icm.edu.pl/baztech/element/bwmeta1.element.baztech-e5bdee74-df95-43e3-a527-5694c99680be (accessed on 10 March 2021).
- Zoepf, S.M.; Keith, D.R. User decision-making and technology choices in the U.S. carsharing market. Transp. Policy 2016, 51, 150–157. [Google Scholar] [CrossRef]
| Sharing Services Parameters | Bike Sharing | Car Sharing | Scooters and Others | Travel Sharing Services | Collective Public Transport |
|---|---|---|---|---|---|
| Possibility of using sharing services | |||||
| Bicycle dock capacity (the larger the more rentals) | Fishman [14], Saberi et al. [15], Laporte et al. [16], Caspi et al. [17] | - | - | - | - |
| Proximity to business centers and downtown area; availability understood as the system’s vehicle count | Saberi et al. [15], Caspi et al. [17], Wang et al. [18], Faghih-Imani et al. [19], Abolhassani et al. [20] | Mattia et al. [21] | Caspi et al. [17], Aguilera-García et al. [22] | Kaan et al. [23] | Daraio et al. [24] |
| Possibility of using different vehicle models | - | Kim [25] | - | - | - |
| Network | |||||
| Infrastructure (bicycle paths, stops) | Abolhassani et al. [20] | - | - | - | Yannis et al. [26] |
| Impact on road traffic (reducing congestion) | Sochor et al. [27] | Ferrero et al. [28], Giesecke et al. [29] | Aguilera-García et al. [22] | Chan et al. [30] | Daraio et al. [24] |
| Safety (higher compared to public transport) | Abolhassani et al. [20], Cieśla et al. [31] | Cieśla et al. [31], Mattia et al. [21] | Aguilera-García et al. [22], Cieśla et al. [31], Orr et al. [32] | - | Yannis et al. [26] |
| Terrain topography | Li et al. [33] | - | - | - | - |
| Dock/station location | Abolhassani et al. [20], Wang et al. [34] | - | - | - | Verbas et al. [35] |
| Environment | |||||
| Weather | Saberi et al. [15], Corcoran et al. [36], Li et al. [33], Shen et al. [37] | - | Aguilera-García et al. [22] | - | - |
| Environmental impact (reducing pollution) | Li et al. [33], Cieśla et al. [31] | Ferrero et al. [28], Hensher [38], Huwer [39] | Aguilera-García et al. [22], Cieśla et al. [31] | Kaan et al. [23], Ritzinger et al. [40] | Yannis et al. [26], Daraio et al. [24], Echaniz et al. [41] |
| Higher quality (generally) compared to public transport | Li et al. [33], Cieśla et al. [31] | Mattia et al. [21] | Aguilera-García et al. [22], Cieśla et al. [31] | - | Daraio et al. [24], Echaniz et al. [41] |
| Trip | |||||
| Greater traveling range and shorter traveling time | - | Melis et al. [42] | Aguilera-García et al. [22] | Chan et al. [30] | - |
| Traveling distance and time (up to 10 min for bicycles): scooters—10 km | Caulfield et al. [43], Shaheen et al. [44] | Michaelis et al. [45] | Shen et al. [37] | - | Daraio et al. [24], Michaelis et al. [45], Chuanjiao et al. [46] |
| Range and battery charging related difficulties | Li et al. [33] | Melis et al. [42] | Aguilera-García et al. [22] | - | - |
| Traveling destination | Caulfield et al. [43] | Sochor et al. [27] | Aguilera-García et al. [22] | Kaan et al. [23] | - |
| Frequency of cargo transport and cargo size | - | Giesecke et al. [29] | - | - | - |
| Travel planning, elimination of unnecessary transfers | - | Yannis et al. [26] | - | - | - |
| Short waiting time compared to public transport | - | Fleury et al. [47] | - | Jung et al. [48] | Echaniz et al. [41], Cevallos et al. [49], Fleurent et al. [50], Saharidis et al. [51] |
| Users | |||||
| Effect on the health of users | Li et al. [33] | - | - | - | - |
| Passenger’s frequency of traveling | Abolhassani et al. [20], Ahillen et al. [52] | Sochor et al. [27] | Orr et al. [32], Ahillen et al. [52] | Wolfler Calvo et al. [53] | Daraio et al. [24] |
| Economic (own vehicle not required, operating costs, cost sharing) | Abolhassani et al. [20], Li et al. [33], Cieśla et al. [31] | Shaheen et al. [12], Huwer [39], Shaheen et al. [54], Kamargianni et al. [55] | Cieśla et al. [31] | Ritzinger et al. [40] | Daraio et al. [24] |
| Demographics (age): elderly people may find it difficult to use and accept new technologies | Caspi et al. [17] | Mattia et al. [21], Utriainen et al. [56] | Caspi et al. [17], Aguilera-García et al. [22], Kostrzewska et al. [57] | - | Yannis et al. [26], Porru et al. [58] |
| Location of the place of residence, population density | Li et al. [33] | Sochor et al. [27] | - | - | Yannis et al. [26], Daraio et al. [24] |
| Data sources | |||||
| Information availability | Caulfield et al. [43], Shaheen et al. [44] | Yannis et al. [26], Fleury et al. [47] | Shen et al. [37], | - | Echaniz et al. [41] |
| Parameter | Name | Description |
|---|---|---|
| Loc1 | existing infrastructure | describes the infrastructure used when traveling |
| Loc2 | terrain topography | describes the inclination of pavements |
| Loc3 | parking availability | describes the availability of parking areas, the possibility of leaving the vehicle parked, and the impact of potential problems associated with leaving the vehicle |
| Loc4 | available driving range | considers potential problems associated with charging/fueling of vehicles while traveling |
| D1 | age | specific age pre-defines the likelihood of a user actually using a specific mode of transport |
| D2 | gender | specific gender pre-defines the likelihood of a user actually using a specific mode of transport |
| T1 | travel time | pre-assumed travel time estimated using a travel planner, indicating whether or not a specific mode of transport is suitable |
| T2 | distance | pre-assumed distance to be covered, which indicates whether or not a specific mode of transport is suitable |
| T3 | travel start point | parameter describing the time of walk from the point of origin to the vehicle, dock, or stop |
| T4 | travel end point | parameter describing the time of walk from the vehicle, dock, or stop to the destination point |
| T5 | travel planning | parameter determining the impact of travel planning on the choice of the mode of transport |
| T6 | size of cargo | parameter determining the impact of the size of the cargo to be transported on the choice of the mode of transport |
| E1 | travel cost per 1 km | parameter determining the impact of the price per 1 km of the ride on the choice of the mode of transport |
| E2 | parking costs | parameter describing the need for parking charges to be covered and their impact on the choice of the mode of transport |
| E3 | discounts held | parameter describing whether or not one has any discounts, e.g., statutorily granted, and if this affects the choice of the mode of transport |
| E4 | travel cost sharing | parameter describing whether it is possible to share the travel costs, and if this affects the choice of the mode of transport |
| Q1 | weather | parameter describing the impact of weather conditions on the choice of the mode of transport |
| Q2 | user flexibility to potential change of means/mode of transport | parameter which takes into account the data entered by the user concerning their willingness to possibly change the transport modes |
| Q3 | road congestion | describes the current traffic intensity which affects the choice of the mode of transport |
| Q4 | road safety | determined by the number of collisions involving the chosen mode of transport on the selected route |
| Q5 | personal safety | number of assaults/thefts committed on those traveling by the given transport modes, established on the basis of police statistics for the chosen area |
| Q6 | waiting time | describes the impact of the user’s waiting for the ride time on the choice of the mode of transport |
| Q7 | congestion (pedestrian traffic) | describes the impact of pedestrian congestion on the route planned to be covered on the choice of the mode of transport |
| Q8 | payment forms | describes the impact of the available fare payment forms on the choice of the mode of transport |
| L1 | eco-friendliness | describes the environmental impact of using the chosen mode of transport |
| L2 | car ownership | describes the impact of owning a car on the choice of the mode of transport |
| L3 | bicycle ownership | describes the impact of owning a bicycle on the choice of the mode of transport |
| L4 | information | describes the impact of the availability of information on the choice of the mode of transport |
| L5 | driving license | describes the impact of having a driving license on the choice of the mode of transport |
| L6 | user health | describes the impact of the chosen mode of transport on the user’s health |
| Parameter | Data Source |
|---|---|
| Loc1 | Road network operator |
| Loc2 | Numerical terrain model |
| Loc3 | OSM data |
| D1; D2; T5; T6; E4; Q2; L1; L2; L3; L5; L6 | Users |
| T1; T2; T3; T4; Q3; Q6; Q7 | Travel planner, based on travel start and end point |
| Q1; Q8; L4; E1; E2; E3; Loc4 | Service provider |
| Q4; Q5 | Police database |
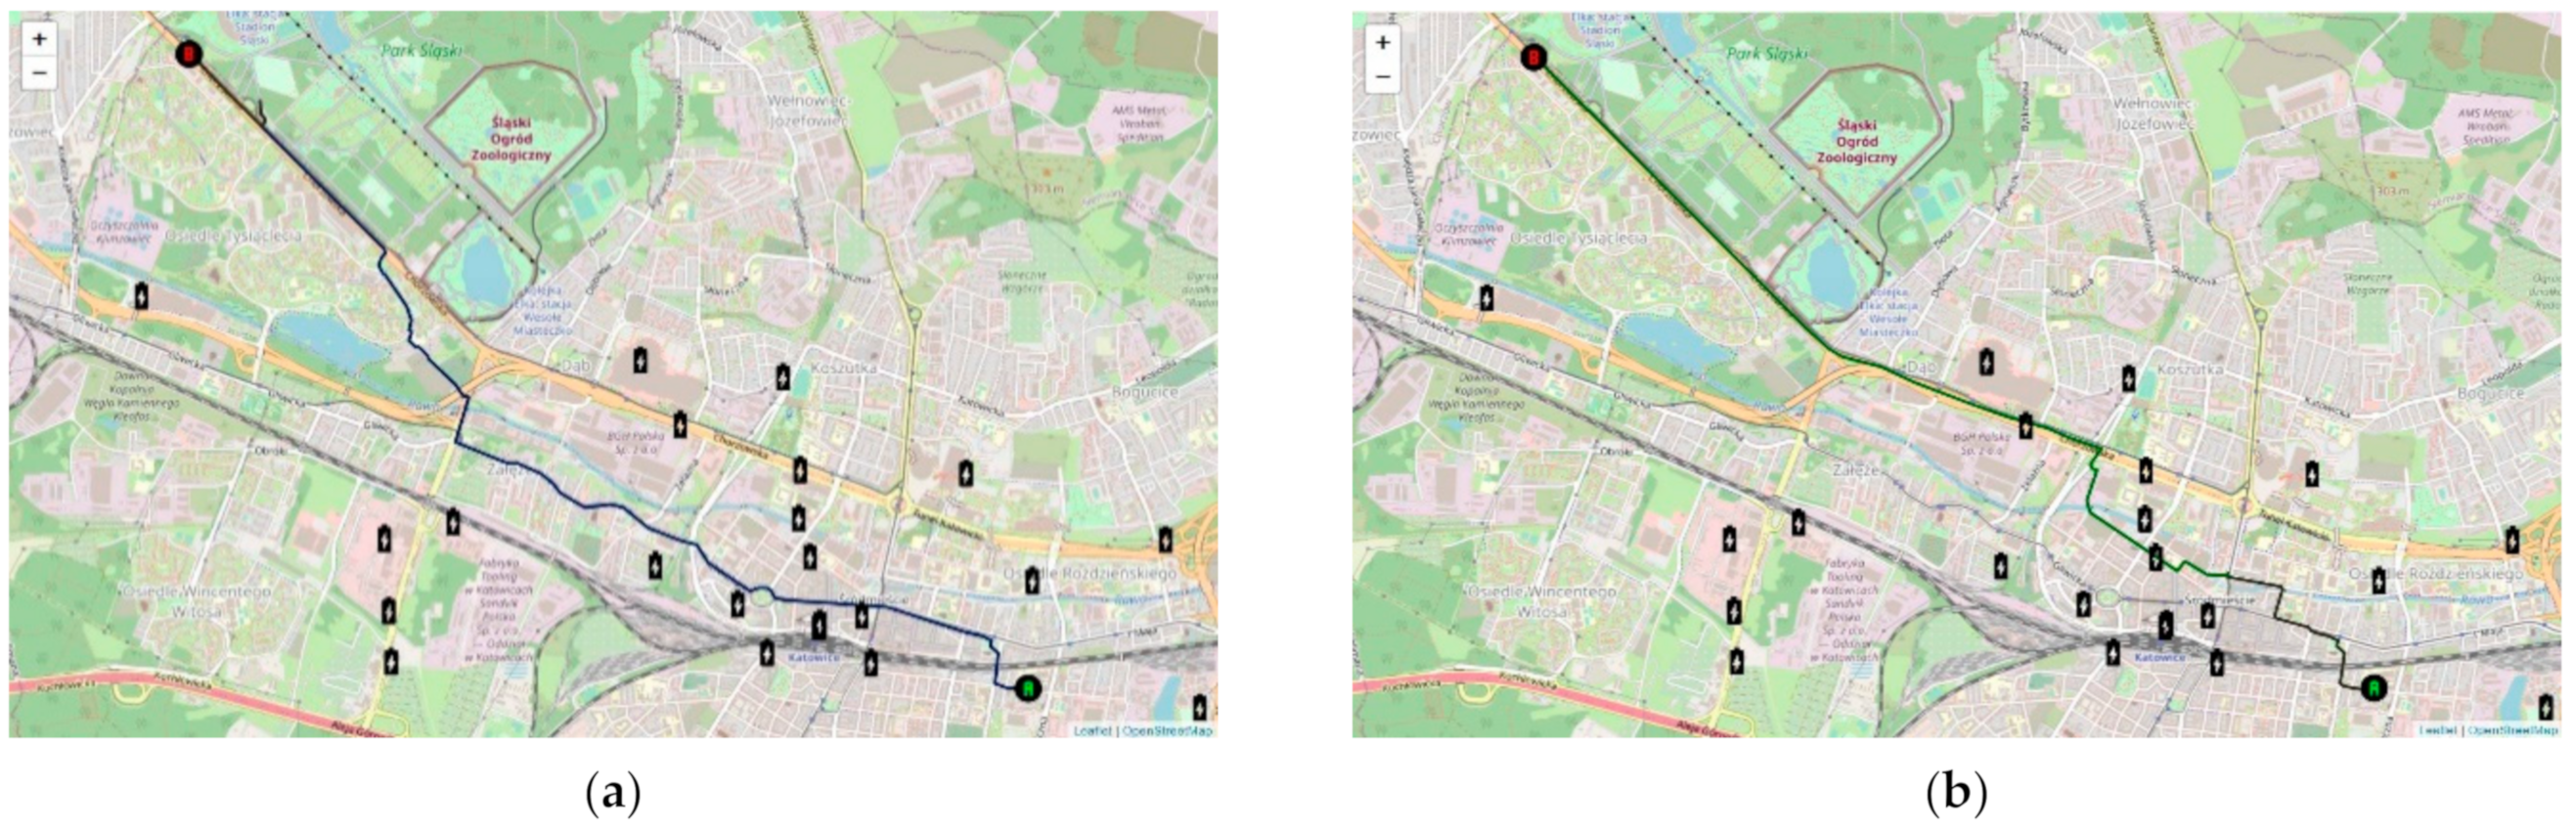
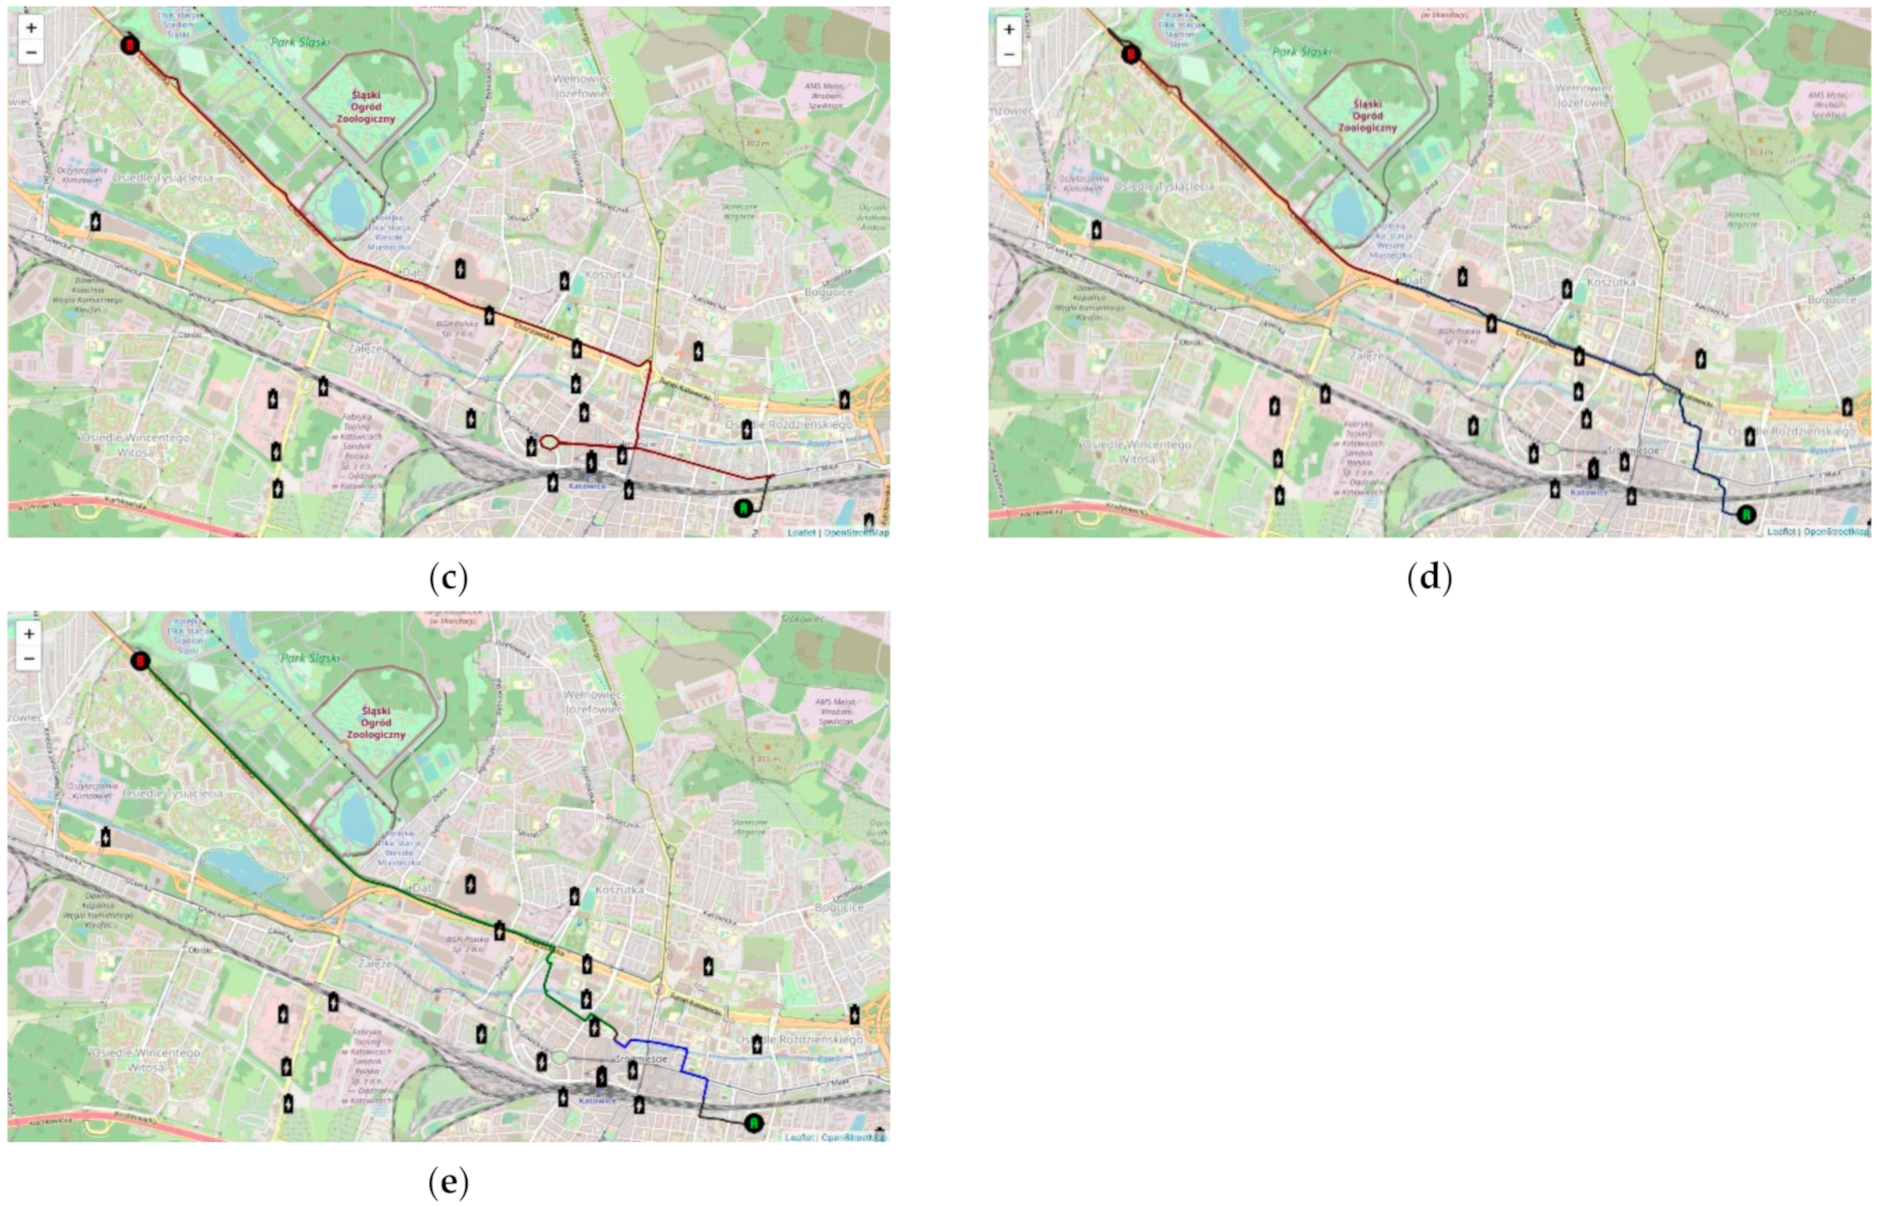
| Variants | Description |
|---|---|
| W1 | Using the bike sharing system which, in the area in question, requires docking stations to be used (walking to the nearest dock and returning the bicycle to the dock closest to the travel destination). Traveling partially on foot. |
| W2 | Using the electric car sharing system. To complete the travel, one must first walk to the nearest parked vehicle available under the given service. Necessity of finding a free parking place close to the travel destination. |
| W3 | Mixed-mode traveling using collective transport modes. In the case in question—using two different tram services. Traveling based on the current timetable, including walking and waiting at stops. |
| W4 | Mixed-mode traveling, first by a shared bicycle, and then using a tram. Traveling based on the current timetable, including walking, waiting at stops, and necessary bicycle docking. |
| W5 | Mixed-mode traveling—using a bus to reach a shared electric car parked as close as possible, and continuing by the sharing service mode. Traveling based on the current timetable, including walking, waiting at stops, and finding a free parking place close to the travel destination. |
| Criteria | ||||||
|---|---|---|---|---|---|---|
| Variants | KLoc | KD | KT | KE | KQ | KL |
| W1 | 0.688 | 1.000 | 0.667 | 0.500 | 0.969 | 0.833 |
| W2 | 0.750 | 1.000 | 0.792 | 0.317 | 0.938 | 0.833 |
| W3 | 1.000 | 1.000 | 0.917 | 0.445 | 0.813 | 0.792 |
| W4 | 0.714 | 1.000 | 0.854 | 0.444 | 0.897 | 0.720 |
| W5 | 0.750 | 1.000 | 0.917 | 0.250 | 0.857 | 0.815 |
| No. of User | Criteria | KLoc | KD | KT | KE | KQ | KL |
|---|---|---|---|---|---|---|---|
| I | Weights | 0.181818 | 0.004253 | 0.277157 | 0.160553 | 0.170654 | 0.205564 |
| II | Weights | 0.139988 | 0.003708 | 0.174289 | 0.232695 | 0.213226 | 0.236094 |
| No. of User | Variants | W1 | W2 | W3 | W4 | W5 |
|---|---|---|---|---|---|---|
| I | Uk | 0.73093 | 0.74218 | 0.81293 | 0.74327 | 0.74864 |
| II | Uk | 0.735798 | 0.717028 | 0.767106 | 0.717162 | 0.701834 |
Publisher’s Note: MDPI stays neutral with regard to jurisdictional claims in published maps and institutional affiliations. |
© 2021 by the authors. Licensee MDPI, Basel, Switzerland. This article is an open access article distributed under the terms and conditions of the Creative Commons Attribution (CC BY) license (http://creativecommons.org/licenses/by/4.0/).
Share and Cite
Kłos, M.J.; Sierpiński, G. Building a Model of Integration of Urban Sharing and Public Transport Services. Sustainability 2021, 13, 3086. https://doi.org/10.3390/su13063086
Kłos MJ, Sierpiński G. Building a Model of Integration of Urban Sharing and Public Transport Services. Sustainability. 2021; 13(6):3086. https://doi.org/10.3390/su13063086
Chicago/Turabian StyleKłos, Marcin Jacek, and Grzegorz Sierpiński. 2021. "Building a Model of Integration of Urban Sharing and Public Transport Services" Sustainability 13, no. 6: 3086. https://doi.org/10.3390/su13063086
APA StyleKłos, M. J., & Sierpiński, G. (2021). Building a Model of Integration of Urban Sharing and Public Transport Services. Sustainability, 13(6), 3086. https://doi.org/10.3390/su13063086