Abstract
Gaseous loss of N leads to lower nitrogen use efficiency (NUE) of applied urea and N content of the soil. This laboratory study was conducted to compare the nitrogen losses from two tropical soil series (Bungor sandy clay loam and Selangor clay) incubated with either liquid urea (LU) or granular urea (GU) at 0, 300, 400, or 500 mg/kg of soil for thirty days. The NH3 volatilization, N2O emission, and N content in the soils were measured throughout the incubation period. For the same application rate, the total NH3 volatilization loss was higher in GU-treated soils than the LU-treated soils. NH3 volatilization loss continued up to the 15th day in the Selangor soil, while in the Bungor soil series it continued up to the 26th day. Higher amounts of N2O emissions were recorded in GU-treated soils than the LU-treated soils, and N2O emission increased with increasing rate of GU and LU applications in both soils. The N2O emission was higher only in the first few days and then tapered off at the seventh and eighth day in Bungor and Selangor soil series, respectively. The total N2O emission was higher in the Selangor soil series than that of Bungor soil series. The total N content that remained in the LU-treated soils after 30 days of incubation was higher than the GU-treated soils. The total N loss from applied urea was higher in the sandy clay loam Bungor soils than that of clayey Selangor soil series. The results suggest that the LU may be a better N fertilizer source than GU due to lower N loss from NH3 volatilization and N2O emission.
1. Introduction
Nitrogen (N) is an essential plant macronutrient and is a controlling element for crop production [1]. Urea is recognized as the principal N fertilizer source for its significant impact on global crop production [2] and covers about 73.4% of total N fertilizer utilization globally [3,4]. However, a distressing concern associated with the application of granular (typical form) urea fertilizer is its high nitrogen loss and low (10–50%) nitrogen use efficiency (NUE) [5]. Volatilization of NH3 and denitrification are the two main N loss mechanisms that decrease the NUE of applied urea [6]. Normally, the extreme losses of N, such as via ammonia (NH3) volatilization [7] and nitrous oxide (N2O) emissions [8], are responsible for lowering the NUE of applied urea to the soil. According to Xin Zhang et al. [9], the NUE will need to increase 40–70% for agricultural sustainability to meet the worldwide food demand. More than 50% of the nitrogen from applied urea cannot be assimilated by plants, therefore, it becomes a potential source of environmental degradation, contributing to environmental problems such as water pollution, eutrophication, acid rain, ammonia volatilization loss, nitrous oxide emission, global warming, and stratospheric ozone depletion [3,10]. Surface application of granular urea promotes significant loss of ammonia volatilization, and agriculture is the main source of NH3 volatilization and N2O emissions to the environment [11,12]. An estimated 31% of the urea applied in tropical and temperate soils will be lost, depending on the application mode, environmental/climatic conditions, and soil types [13]. The amount of NH3-N and N2O-N loss is mostly affected by soil properties such as pH, buffering capacity, cation exchange capacity, and organic matter content, along with N source and rate [14], fertilization time and placement of urea [15], and nitrification and denitrification processes in soil [16,17]. However, it is a challenge to minimize N losses to increase the NUE of applied urea. Researchers have recommended several mechanisms to enhance the NUE of applied urea to confirm the need-based smooth supply of N while lowering the risk of N losses. Soil and fertilizer management have been reported to reduce significant losses of N from NH3 volatilization and N2O emission [18,19,20]. However, there is currently no single technology available that can increase NUE by restricting the NH3 volatilization and N2O emission from applied urea. Some researchers have suggested root zone fertilization as a promising technology to increase NUE through controlling NH3 and N2O loss [21]. Liquid urea (LU) application has the ability to uniformly distribute the soil column, which can increase the adsorption of NH4+-N and NO3−-N by the soil particles, which will prevent further conversion to prevent gaseous loss. Therefore, the aim of this present study was to evaluate the effect of LU application on NH3 volatilization and N2O emission in comparison to granular urea (GU) when applied to two tropical soils under laboratory incubation conditions (30 days).
2. Materials and Methods
The soils used in this study were Bungor (fine, kaolinitic, isohyperthermic, Typic Paleudult) and Selangor (very fine, alluvium, isohyperthermic, Typic Endoaquepts). The Bungor soil was sampled at the field station of the Faculty of Agriculture Universiti Putra Malaysia (03°00′12.6″ N; 101° 47′22.4″ E), while the Selangor soil was sampled from Sungai Besar, Selangor (03°42′20.1″ N; 100°58′08.0″ E).
The soils were sampled from the top 15 cm depth and were air-dried, ground, and sieved through a 2.00-mm sieve. The soils were analysed for total N using the dry combustion method on a LECO’s TruMac, LECO Corporation, USA [22] CNS analyser, cation exchange capacity (CEC) was determined using the leaching method [23], NH4+-N and NO3−-N concentrations were determined by distillation method [24], soil particle distribution was determined using the pipette method [25], gravimetric water content was determined at field capacity [26], and pH was determined in 2.5 (soil:water) ratio and measured using Metrohm827 pH meter, Metrohm AG, Switzerland. The properties of both soils are shown in Table 1.

Table 1.
Physicochemical properties of the soils. CEC: cation exchange capacity.
The LU and GU were applied to the two soils at either 0, 300, 400, or 500 mg/kg soil to determine the NH3 volatilization, N2O emission, and total N loss during thirty days of incubation. Both GU and LU fertilizers were applied to the soil surface. Freshly prepared 1.20% (w/v), 1.60% (w/v), and 2.00% (w/v) urea solutions at 2.5 mL/100 g soil were applied for 300, 400, or 500 mg/kg soil, respectively. The NH3 gas volatilization loss was estimated by the force draft technique [28]. About 250 g soil was placed in a 500-mL Erlenmeyer flask, the gas was trapped by 75 mL of 2% boric acid-indicator solution in a 250-mL Erlenmeyer flask, and the trapped gas was titrated against 0.1 N HCl solution. The N2O emission loss was determined by using a closed aerobic chamber (343 mL) filled with 100 g of air-dried soil, and the free headspace volume was 175 mL. The chamber was sealed with a rubber septum. The gas samples were collected every day for 10 days using a syringe, and the N2O was determined by using an HP Agilent 6890 Plus (G1530A) Gas Chromatograph, Hewlett-Packard, USA. The experiment was conducted as a complete factorial design and the experimental units were arranged in a completely randomized design with four replicates.
Statistical Analysis
The data were analysed statistically with Statistical Analysis Software (SAS) 9.4 (SAS Institute Inc., 2013) [29] as a complete factorial experimental design, and differences between treatment means were compared using the least significant difference (LSD) test at the 0.05 significance level.
3. Results
3.1. NH3 Gas Volatilization Loss
The amount of NH3 volatilization loss from both soils increased (in Bungor 29.55% and 27.77% while in Selangor 21.55% and 15.83%, respectively) with the increasing rate of GU and LU applications. It was observed that the accumulative NH3 volatilization loss was significantly higher (56.48%, 28.77%, and 22.27% in Bungor, and 74.04%, 58.92, and 50.54 in Selangor soil treated with 300 mg/kg, 400 mg/kg, and 500 mg/kg of urea, respectively) from GU than the LU-treated soils when compared at the same application rate. The amount of NH3 volatilized from LU- and GU-treated Bungor and Selangor soil series are shown in Figure 1 and Figure 2, respectively. In GU-treated Bungor soils, NH3 volatilization was low at day 1 (0.89 mg/kg, 2.52 mg/kg, and 6.07 mg/kg from soil treated with 300 mg/kg, 400 mg/kg, and 500 mg/kg of GU, respectively) but drastically increased at day 2 (19.46 mg/kg, 41.61mg/kg, and 60.43 mg/kg from soil treated with 300 mg/kg, 400 mg/kg, and 500 mg/kg of GU, respectively). However, the NH3 volatilization began to slow down at the beginning of day 3 (8.35 mg/kg, 9.93mg/kg, and 13.07 mg/kg from soil treated with 300 mg/kg, 400 mg/kg, and 500 mg/kg of GU, respectively) until day 15, at which point the amount of NH3 volatilized was very little (0.23 mg/kg, 0.33 mg/kg, and 0.56 mg/kg from soil treated with 300 mg/kg, 400 mg/kg, and 500 mg/kg of GU, respectively). The cumulative NH3 volatilization was higher at the higher rate of GU application (40.27 mg/kg, 71.86 mg/kg, and 99.37 mg/kg from soil treated with 300 mg/kg, 400 mg/kg, and 500 mg/kg of GU, respectively). The time at which NH3 volatilization began to cease increased with the rate of GU application to the soils. The NH3 volatilization begin to cease after day 19, 25, and 26 of incubation from GU300-, GU400-, and GU500-treated soils, respectively. In LU-treated Bungor soils, the NH3 volatilization was already high at the first day (7.04 mg/kg, 13.61 mg/kg, and 27.44 mg/kg from soil treated with 300 mg/kg, 400 mg/kg, and 500 mg/kg of LU, respectively) of application, unlike the GU-treated soils. Even though the NH3 volatilization was higher in the second day compared to the first day, the differences were small, unlike those observed for the GU-treated soils. The NH3 volatilization decreased beginning on the third day (3.78 mg/kg, 8.12 mg/kg, and 10.45 mg/kg from soil treated with 300 mg/kg, 400 mg/kg, and 500 mg/kg of LU, respectively), and the NH3 volatilization was not detected in the soils at the 17th, 22nd, and 24th day of incubation for LU300-, LU400-, and LU500-treated soils, respectively.
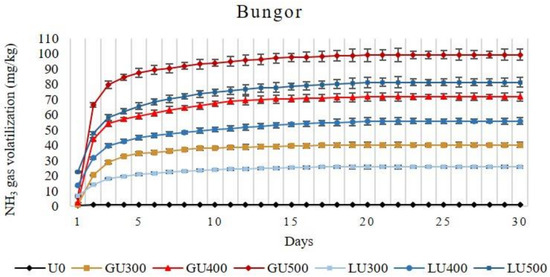
Figure 1.
Cumulative volatilization loss of ammonia gas (NH3) from Bungor soil treated with different rates of liquid urea (LU) and granular (GU) fertilizers during the four weeks of incubation. Vertical bars on the graphs show the standard errors.
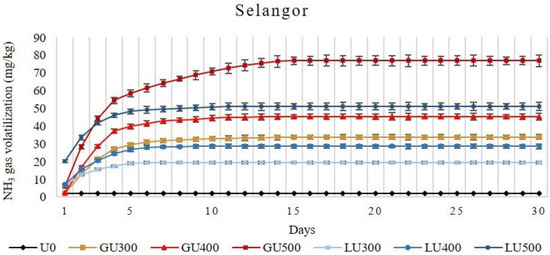
Figure 2.
Cumulative volatilization loss of ammonia gas (NH3) from Selangor soil treated with different rates of LU and GU fertilizers during the four weeks of incubation. Vertical bars on the graphs show the standard errors.
In Selangor soil, the accumulative NH3 volatilization loss increased with the increasing rate of application in both LU- and GU-treated soils. In the GU-treated soils, NH3 volatilization was low on the first day (1.87 mg/kg, 2.45 mg/kg, and 5.91 mg/kg from soil treated with 300 mg/kg, 400 mg/kg, and 500 mg/kg of GU, respectively), then rapidly increased on the second day (11.07 mg/kg, 14.33 mg/kg, and 22.47 mg/kg from soil treated with 300 mg/kg, 400 mg/kg, and 500 mg/kg of GU, respectively), and then decreased on the third day. Beginning from day 6, the NH3 was very low (1.69 mg/kg, 1.80 mg/kg, and 3.08 mg/kg from soil treated with 300 mg/kg, 400 mg/kg, and 500 mg/kg of GU, respectively), which continued until day 15. Similar patterns were observed for all application rates of GU. In the LU-treated soils, the NH3 volatilization was higher than in the GU-treated soils at all application rates. The NH3 volatilization loss from LU-treated soils on the second day (5.99 mg/kg, 8.68 mg/kg, and 13.39 mg/kg from soil treated with 300 mg/kg, 400 mg/kg, and 500 mg/kg of LU, respectively) was lower than the first day (6.67 mg/kg, 7.05 mg/kg, and 20.25 mg/kg from soil treated with 300 mg/kg, 400 mg/kg, and 500 mg/kg of LU, respectively). The volatilization loss continued until day 6, 9, and 11 of incubation for the LU300-, LU400-, and LU500-treated soils, respectively.
3.2. N2O Gas Emission Loss
The amount of N2O emission loss from both soils increased with the increasing rate of GU and LU applications. The accumulative N2O emission loss was significantly higher from the GU- than the LU-treated soils when compared at the same application rate. In the Bungor soil series, higher N2O emission was found in GU-treated soils than the LU-treated soils, and the N2O emission increased with the increasing rate of GU and LU applications (Figure 3).
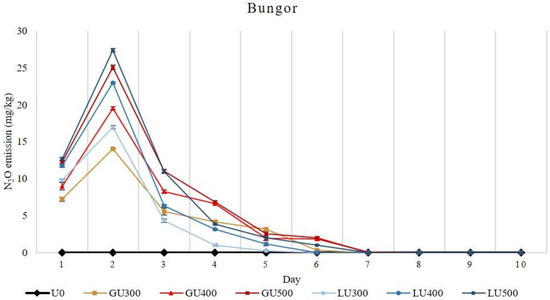
Figure 3.
Daily emission loss of nitrous oxide gas (N2O) from Bungor soil treated with different rates of LU and GU fertilizers during the incubation. Vertical bars on the graphs show the standard errors.
In both GU- and LU-treated soils, the highest N2O emission was recorded on the second day of incubation. The N2O emission in GU-treated soils was high in the first four days and later diminished from the eighth day of incubation. In the LU-treated soils, N2O emission was also high on the second day and then sharply dropped at the third day of incubation. The N2O emission in LU-treated soils continued until the ninth day, after which no N2O was detected. The N2O emission in the first two days was higher in the LU-treated soils, but later it was higher in the GU-treated soils. Overall, the total N2O emission was higher in the GU-treated soils than the LU-treated soils. The highest total N2O emissions recorded were 59.75 mg/kg and 57.80 mg/kg from GU500- and LU500-treated soils, respectively.
In the Selangor soil series, higher N2O emissions were found in the GU-treated soils than those of the LU-treated soils, and the N2O emission increased with the increasing rate of both GU and LU applications (Figure 4).
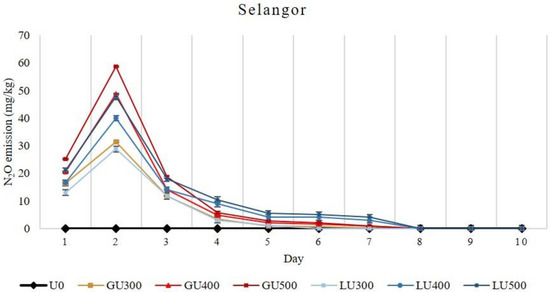
Figure 4.
Daily emission loss of nitrous oxide gas (N2O) from Selangor soil treated with different rates of LU and GU fertilizers during the incubation. Vertical bars on the graphs show the standard errors.
The N2O emissions in the first three days was higher in the GU-treated soils but were later higher in LU-treated soils. The total N2O emission was higher in GU-treated soils than that of LU. The highest total N2O emission recorded was 113.81 mg/kg and 111.16 mg/kg from GU500- and LU500-treated soils, respectively. Overall, higher cumulative emissions of N2O were recorded from the GU- than the LU-treated soils in both soil series. The N2O emission was very low after the seventh and eighth day of incubation in Bungor and Selangor soil series, respectively. The total N2O emission was higher in the Selangor soil series than that of Bungor soil series.
3.3. Total N (%) Remaining in the Soils
Figure 5A shows the amount of total N remaining in the Bungor soil series after the 30th day of incubation.
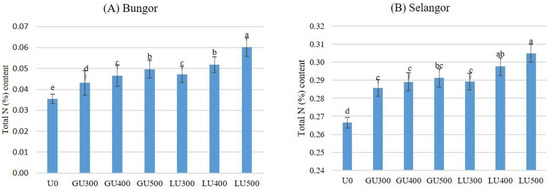
Figure 5.
Total N (%) remaining in Bungor (A) and Selangor (B) soil treated with different rates of LU and GU fertilizers after 30 days of incubation. Different letters indicate significant difference between means using least significant difference (LSD) test at the 0.05 probability level. Vertical bars on the graphs show the standard errors.
The total N remaining in the soils after 30 days of incubation was higher in the LU-than the GU-treated soils when compared at the same application rate. The total N remaining in the soil increased with the rate of application. In both LU- and GU-treated soils, the lowest amount of total N remaining was recorded in soils treated with 300 mg/kg urea and the highest was in the soils treated with 500 mg/kg urea. The amount of total N remaining in the soil increased with the rate of application in both LU- and GU-treated soils. The amount of total N remaining in the Selangor soil series are shown in Figure 5B. Similar to the Bungor soil series, the lowest amount of total N remaining in the Selangor soil series was found in soils treated with 300 mg/kg urea while the highest was in the soils treated with 500 mg/kg urea. The total N remaining in the Selangor soil series was higher in the LU- than the GU-treated soils; similar results were observed in the Bungor soil series. However, the total N remaining in the Selangor soils at the end of incubation was much higher than for both LU- and GU-treated Bungor soils. In the LU-treated soils, the NH4+-N and NO3−-N concentrations were higher than in the GU-treated soils, but the NH3 volatilization loss and remaining urea-N in soil was lower than in the GU-treated soils. Therefore, the total N remaining in the soils at the end of the incubation period was higher in the LU-treated soils. However, the total N remaining in the Selangor soil series at the end of incubation was much higher than for both LU- and GU-treated Bungor soils.
3.4. Total N Loss (%) from the Soil
The total % N loss from the applied urea in the soils after 30 days of incubation was significantly higher in the GU- than the LU-treated soils when compared at the same application rate (Table 2).
Table 2.
Total N loss (%) from the applied urea.
In the Bungor soil series, a higher total % N loss was recorded from the GU300 treatment (74.60%), which was similar to the GU400 treatment, and the lowest total % N loss was recorded from the LU500 treatment (50.59%). Lower total % N losses were observed for higher urea application rates in both GU- and LU-treated soils. In the Selangor soil series, there was no significant difference in total % N loss from the soils with GU applied at different rates, but in the LU-treated soils, a significantly higher total % N loss was recorded from the LU500 treatment. The total % N losses from the LU300 and LU400 treatments were statistically similar. In both Bungor and Selangor soil series, the total % N loss was significantly higher in the GU-treated soils than the LU-treated soils when compared at the same application rate. The total % N losses in the Bungor soils were significantly higher than in the Selangor soils at the end of the incubation.
4. Discussion
After application, urea granules absorb water and dissolve when they come into contact with the soil and, consequently, hydrolysis driven by urease enzymes will release NH4+ and HCO3− [30] and subsequently NH3 gas will be released [30]. Soil moisture content is an influential factor which starts the urea hydrolysis process [31]. However, in the case of LU, the process of urea hydrolysis occurs prior to soil application, while the GU may need time to absorb water before it can be hydrolysed. The GU application can increase the urea concentration in the locality of the fertilizer application point, which can affect hydrolysis as well as NH3 volatilization [31,32,33]. Other researchers have suggested that the incorporation of urea throughout the soil effectively decreased the volatilization loss of urea [34]. Only the LU application could ensure the uniform distribution of urea-N in the soil column. It can increase the adsorption of NH4+-N by the soil particles, which prevents further conversion to NH3 gas [34]. The amount of NH3 volatilization depends on the amount of the urea applied to the soil. The NH3 volatilization loss increased with the increasing rate urea applications, which is in agreement with previous works [20,35,36]. The LU in soil that was previously hydrolysed could proceed through nitrification due to favourable moisture content. However, in the GU applications, there could arise an NH4+ concentration gradient in the soils where the NH4+ was highly concentrated around the urea granules. Such a concentration gradient could lead to higher NH3 volatilization loss from the GU-treated soils. Marchi et al. [36] found reduced NH3-N volatilization from applied urea in an area under frequent rainfall, while Holcomb et al. [37] observed that there was a reduction in NH3-N volatilization loss when water was applied after urea application. The results of the current study show that the application of LU resulted in less ammonia loss than the application of GU, and the same findings were reported by Doyle [38]. If there is uniform incorporation of applied urea in soil, it could significantly decrease NH3-N volatilization by increasing the NH4+ adsorption by the soil particles. Holcomb et al. [37] demonstrated that rainfall or irrigation was the most effective for reducing NH3 losses when applied before the hydrolysis of urea. Moisture content has been reported to maintain soil total N content, as it affected N mineralization and losses [39], and fine-textured soil experienced lower NH3 volatilization [40].
The denitrification process, which occurs under anaerobic conditions, converts the NO3−-N to N2O and later to N2 by the denitrifying bacteria. This denitrification occurs after urea hydrolysis and nitrification. These processes are controlled by the physical, chemical, and biological properties of soil. N2O emissions were found to be high in the first three days, then decreased, and after the eighth day of incubation, the emission value was not detected. The daily N2O emission appears related to the transformation of urea after application. The plentiful production of NO3−-N encouraged higher emissions of N2O. In our study, higher cumulative N2O emissions were detected in GU-treated soils than LU-treated soils. Cardenas et al. [41] observed that higher N2O emissions were associated with GU application than ammonium nitrate application. Faster hydrolysis can promote higher urea mineralization, and higher soil water content can increase the hydrolysis as well as mineralization of urea. The LU, which had been previously hydrolysed and could be distributed throughout the soil column, may ensure lower N concentrations in the soils. Alves et al. [20] observed that higher N2O emissions were associated with higher N application rates. The results showed that the Selangor soil series emitted higher N2O than the Bungor soil series due to its higher clay content and greater CEC. The Selangor soil series also possessed higher NO3− concentrations, which can be transformed to N2O gas. Additionally, the clayey Selangor soil series would have higher micropores, which could have caused greater anaerobic microsites than the more sandy Bungor soil series; therefore, higher amounts of N2O were emitted from the Selangor soils. The results of Brentrup et al. [42] support this statement.
The total N remaining in the Selangor soils at the end of incubation was much higher than for both LU- and GU-treated Bungor soils, possibly due the high CEC of the Selangor soil series, such that more NH4+ was tightly adsorbed to the soil particles. In the LU-treated soils, the NH4+-N and NO3−-N concentrations were higher than in the GU-treated soils, but the NH3 volatilization loss and remaining urea-N in soil were lower than the GU-treated soils. Therefore, the amounts of total N remaining in the soils at the end of incubation period were higher in the LU-treated soils. Moisture contents of soil are reported to maintain soil total N content, as it affects N mineralization and losses [39], and gaseous (NH3-N and N2O-N) loss has been observed to significantly increase alongside N losses from soils [43,44]. Higher gaseous (NH3-N and N2O-N) losses have been shown to contribute significantly to the total N content in soils [44,45]. The NH3 volatilization and N2O emission loss were lower in Selangor soil for both GU and LU treatments, possibly since most NH4+ could be adsorbed by the soil particles and hence less NH4+ was available to be converted to NH3. On the other hand, due to a higher CEC, Selangor soils have a higher capacity to hold positively charged ions. These positively charged positions can hold negatively charged ions (e.g., NO3−) [46]. These mechanisms may prevent further transformation of NO3−-N to N2O emissions. Based on the results of this study, the LU application was more efficient than the GU application because soils treated with LU had lower N losses from NH3 volatilization and N2O emission, resulting in higher N availability and higher N content in the soil. Most of the NH4+-N and NO3−-N could be adsorbed by the soil particles, possibly reducing the NH3 volatilization and N2O emission loss. The LU might have a greater NUE than the GU in soils since the total N loss was lower in the LU-treated soils. However, this needs to be further confirmed by a field study.
5. Conclusions
The results suggest that the LU would be a better source of urea N fertilizer, as it resulted in lower NH3 volatilization and N2O emission loss, and higher total N remaining in the soils compared to the GU treatment. In addition, the LU performed better in the sandy clay loam Bungor soils than the more clayey Selangor soils. Therefore, the use of LU could benefit farmers because it would have higher NUE than GU. However, the results of this study should be confirmed by glasshouse pot experiments and field trials.
Author Contributions
All authors contributed to the conceptualization, methodology, and writing—review and editing. A.M.M. conducted the investigation, formal analysis, visualization, writing—original draft, and funding acquisition under the supervision of A.W.S., A.S.A.S. and A.M.A. All authors have read and agreed to the published version of the manuscript.
Funding
This study was sponsored by a grant from the Bangladesh Agricultural Research Council (BARC) (Grant number: 6282521-10201) under the project NATP Phase-II.
Institutional Review Board Statement
Not Applicable.
Informed Consent Statement
Not applicable.
Data Availability Statement
No supporting data available.
Acknowledgments
The authors thank the Universiti Putra Malaysia, BARC, and Soil Resources Development Institute (SRDI), the People’s Republic of Bangladesh, for their support in conducting this research.
Conflicts of Interest
The authors declare no conflict of interest.
References
- Erisman, J.W.; Galloway, J.N.; Seitzinger, S.; Bleeker, A.; Dise, N.B.; Petrescu, A.M.R.; Leach, A.M.; de Vries, W. Consequences of human modification of the global nitrogen cycle. Philos. Trans. R. Soc. B Biol. Sci. 2013, 368, 20130116. [Google Scholar] [CrossRef]
- Kira, O.; Shaviv, A.; Dubowski, Y. Direct tracing of NH3 and N2O emissions associated with urea fertilization approaches, using static incubation cells. Sci. Total Environ. 2019, 661, 75–85. [Google Scholar] [CrossRef] [PubMed]
- Sutton, M.A.; Oenema, O.; Erisman, J.W.; Leip, A.; van Grinsven, H.; Winiwarter, W. Too much of a good thing. Nature 2011, 472, 159–161. [Google Scholar] [CrossRef]
- Heffer, P.; Prud’homme, M. Short-Term Fertilizer Outlook 2016–2017; International Fertilizer Industry Association: Paris, France, 2016. [Google Scholar]
- Almaz, M.G.; Halim, R.A.; Martini, M.Y.; Samsuri, A.W. Integrated application of poultry manure and chemical fertiliser on soil chemical properties and nutrient uptake of maize and soybean. Malays. J. Soil Sci. 2017, 21, 13–28. [Google Scholar]
- Wang, S.; Shan, J.; Xia, Y.; Tang, Q.; Xia, L.; Lin, J.; Yan, X. Different effects of biochar and a nitrification inhibitor application on paddy soil denitrification: A field experiment over two consecutive rice-growing seasons. Sci. Total Environ. 2017, 593, 347–356. [Google Scholar] [CrossRef] [PubMed]
- Behera, S.N.; Sharma, M.; Aneja, V.P.; Balasubramanian, R. Ammonia in the atmosphere: A review on emission sources, atmospheric chemistry and deposition on terrestrial bodies. Environ. Sci. Pollut. Res. 2013, 20, 8092–8131. [Google Scholar] [CrossRef] [PubMed]
- Reay, D.S.; Davidson, E.A.; Smith, K.A.; Smith, P.; Melillo, J.M.; Dentener, F.; Crutzen, P.J. Global agriculture and nitrous oxide emissions. Nat. Clim. Chang. 2012, 2, 410–416. [Google Scholar] [CrossRef]
- Zhang, X.; Davidson, E.A.; Mauzerall, D.L.; Searchinger, T.D.; Dumas, P.; Shen, Y. Managing nitrogen for sustainable development. Nature 2015, 528, 51–59. [Google Scholar] [CrossRef]
- Puga, A.P.; Grutzmacher, P.; Cerri, C.E.P.; Ribeirinho, V.S.; de Andrade, C.A. Biochar-based nitrogen fertilizers: Greenhouse gas emissions, use efficiency, and maize yield in tropical soils. Sci. Total Environ. 2020, 704, 135375. [Google Scholar] [CrossRef] [PubMed]
- Lichiheb, N.; Myles, L.T.; Personne, E.; Heuer, M.; Buban, M.; Nelson, A.J.; Koloutsou-Vakakis, S.; Rood, M.J.; Joo, E.; Miller, J.; et al. Implementation of the effect of urease inhibitor on ammonia emissions following urea-based fertilizer application at a Zea mays field in central Illinois: A study with SURFATM-NH 3 model. Agric. For. Meteorol. 2019, 269–270, 78–87. [Google Scholar] [CrossRef]
- Bortoletto-Santos, R.; Cavigelli, M.A.; Montes, S.E.; Schomberg, H.H.; Le, A.; Thompson, A.I.; Kramer, M.; Polito, W.L.; Ribeiro, C. Oil-based polyurethane-coated urea reduces nitrous oxide emissions in a corn fi eld in a Maryland loamy sand soil. J. Clean. Prod. 2020, 249, 119329. [Google Scholar] [CrossRef]
- da Silva, M.J.; Franco, H.C.J.; Magalhães, P.S.G. Liquid fertilizer application to ratoon cane using a soil punching method. Soil Tillage Res. 2017, 165, 279–285. [Google Scholar] [CrossRef]
- Rimski-Korsakov, H.; Rubio, G.; Lavado, R.S. Fate of the nitrogen from fertilizers in field-grown maize. Nutr. Cycl. Agroecosyst. 2012, 93, 253–263. [Google Scholar] [CrossRef]
- Randall, G.W.; Sawyer, J. Nitrogen Application Timing, Forms, and Additives. Available online: https://elibrary.asabe.org/abstract.asp?aid=24245 (accessed on 18 May 2018).
- Hyatt, C.R.; Venterea, R.T.; Rosen, C.J.; Wilson, M.L.; Dolan, M.S. Polymer-Coated Urea Maintains Potato Yields and Reduces Nitrous Oxide Emissions in a Minnesota Loamy Sand. Soil Sci. Soc. Am. J. 2010, 74, 419–428. [Google Scholar] [CrossRef]
- Keerio, H.A.; Bae, W.; Park, J.; Kim, M. Substrate uptake, loss, and reserve in ammonia-oxidizing bacteria (AOB) under different substrate availabilities. Process Biochem. 2020, 91, 303–310. [Google Scholar] [CrossRef]
- Signor, D.; Eduardo, C.; Cerri, P. Nitrous oxide emissions in agricultural soils: A review 1. Pesqui. Agropecu. Trop. 2013, 2013, 322–338. [Google Scholar] [CrossRef]
- Jones, C. Ammonia Volatilization: Process, Amounts, and Effects on Yield and Protein. Available online: http://landresources.montana.edu/soilfertility (accessed on 22 February 2020).
- Alves, I.; Degaspari, M.; Rodrigues, J.; Zaqueu, S.; Montezano, F.; Vitti, C.; Rossetto, R.; Del, S.J.; Andre, G. Nitrogen sources and application rates affect emissions of N2O and NH3 in sugarcane. Nutr. Cycl. Agroecosyst. 2020, 116, 329–344. [Google Scholar] [CrossRef]
- Yao, Y.; Zeng, K.; Song, Y. Biological nitrification inhibitor for reducing N2O and NH3 emissions simultaneously under root zone fertilization in a Chinese rice field. Environ. Pollut. 2020, 264, 114821. [Google Scholar] [CrossRef] [PubMed]
- LECO. LECO Corporation. Available online: https://www.leco.com/about-us/corporate/approved-methods (accessed on 30 November 2018).
- Chapman, H.D. Cation-exchange capacity. Methods Soil Anal. Part 2 Chem. Microbiol. Prop. 1965, 9, 891–901. [Google Scholar]
- Keeney, D.R. Nitrogen—Availability indices. In Methods of Soil Analysis: Part 2 Chemical and Microbiological Properties; Page, A.L., Ed.; John Wiley & Sons, Inc.: Hoboken, NJ, USA, 1983; Volume 9, pp. 711–733. [Google Scholar]
- Teh, C.B.S.; Talib, J. Soil and Plant Analyses Vol. I Soil Physics Analyses; Department of Land Management, Faculty of Agriculture, Universiti Putra Malaysia: Seri Kembangan, Malaysia, 2006; Volume 1, ISBN 983-3455-64-6. [Google Scholar]
- Tan, K.H. Determination of soil water. In Soil Sampling, Preparation, and Analysis, 2nd ed.; CRC Press: Boca Raton, FL, USA, 2005; Volume 1, ISBN 9780849334993. [Google Scholar]
- Min, L.W. Reconnaissance Soil Survey of Raub-Temerloh-Jerantut Region Northwest Pahang; Soil Science Division, Research Branch, Division of Agriculture, Ministry of Agriculture and Co-Operatives: Kuala Lumpur, Malaysia, 1967; Volume 2. [Google Scholar]
- Fenn, L.B.; Kissel, D.E. Ammonia volatilization from surface applications of ammonium compounds on calcareous soils: I. General theory. Soil Sci. Soc. Am. J. 1973, 37, 855–859. [Google Scholar] [CrossRef]
- SAS Institute Inc. SAS® 9.4 Statements Reference. 2013. Available online: https://www.sas.com/ro_ro/home.html?gclid=CjwKCAiA1eKBBhBZEiwAX3gql-7WYG5CxvSd5EDWKohWu3nVvb0RRsgLupYC7rC0hWqRVAvu7oOHJhoCWVMQAvD_BwE (accessed on 3 February 2021).
- Mariano, E.; de Sant Ana Filho, C.R.; Bortoletto-Santos, R.; Bendassolli, J.A.; Trivelin, P.C.O. Ammonia losses following surface application of enhanced-efficiency nitrogen fertilizers and urea. Atmos. Environ. 2019, 203, 242–251. [Google Scholar] [CrossRef]
- Abera, G.; Wolde-meskel, E.; Beyene, S.; Bakken, L.R. Nitrogen mineralization dynamics under different moisture regimes in tropical soils. Int. J. Soil Sci. 2012, 7, 132. [Google Scholar] [CrossRef]
- Cantarella, H.; Mattos, D.; Quaggio, J.A.; Rigolin, A.T. Fruit yield of Valencia sweet orange fertilized with different N sources and the loss of applied N. Nutr. Cycl. Agroecosyst. 2003, 67, 215–223. [Google Scholar] [CrossRef]
- Vitti, A.C.; Trivelin, P.C.O.; Gava, G.J.D.C.; Franco, H.C.J.; Bologna, I.R.; Faroni, C.E. Sugar cane yield AS related to the location of nitrogen fertilizer applied on top of unburnt sugar caneresidues. Rev. Bras. Ciência Solo 2007, 31, 491–498. [Google Scholar] [CrossRef]
- Rochette, P.; Angers, D.A.; Chantigny, M.H.; Gasser, M.; Macdonald, J.D.; Pelster, D.E.; Bertrand, N. NH3 volatilization, soil NH4 concentration and soil pH following subsurface banding of urea at increasing rates. Can. J. Soil Sci. 2013, 93, 261–268. [Google Scholar] [CrossRef]
- Pan, B.; Kee, S.; Mosier, A.; Luo, Y.; Chen, D. Agriculture, Ecosystems and Environment Ammonia volatilization from synthetic fertilizers and its mitigation strategies: A global synthesis. Agric. Ecosyst. Environ. 2016, 232, 283–289. [Google Scholar] [CrossRef]
- De Marchi, T.; Silva, F.; Braz, V.; Oliveira, D.; Pontes, O.; Sergio, P. Geoderma Regional Soil nitrogen dynamics under tobacco with different fertilizer management in southern Brazil. Geoderma Reg. 2020, 21, e00282. [Google Scholar] [CrossRef]
- Holcomb, J.C.; Sullivan, D.M.; Horneck, D.A.; Clough, G.H. Effect of Irrigation Rate on Ammonia Volatilization. Soil Sci. Soc. Am. J. 2011, 75, 2341–2347. [Google Scholar] [CrossRef]
- Doyle, S. Liquid Nitrogen: Pros and Cons of Different Formulations—GRDC. Available online: https://grdc.com.au/resources-and-publications/grdc-update-papers/tab-content/grdc-update-%0A%09papers/2013/03/liquid-nitrogen-pros-and-cons-of-different-formulations%0A (accessed on 26 November 2020).
- Fu, W.; Wang, X.; Wei, X. Science of the Total Environment No response of soil N mineralization to experimental warming in a northern middle-high latitude agro-ecosystem. Sci. Total Environ. 2019, 659, 240–248. [Google Scholar] [CrossRef]
- Pelster, D.E.; Watt, D.; Strachan, I.B.; Rochette, P.; Bertrand, N.; Chantigny, M.H. Effects of initial soil moisture, clod size, and clay content on ammonia volatilization after subsurface band application of urea. J. Environ. Qual. 2019, 48, 549–558. [Google Scholar] [CrossRef]
- Cardenas, L.M.; Bhogal, A.; Chadwick, D.R.; Mcgeough, K.; Misselbrook, T.; Rees, R.M.; Thorman, R.E.; Watson, C.J.; Williams, J.R.; Smith, K.A.; et al. Science of the Total Environment Nitrogen use ef fi ciency and nitrous oxide emissions from fi ve UK fertilised grasslands. Sci. Total Environ. 2019, 661, 696–710. [Google Scholar] [CrossRef]
- Brentrup, F.; Kusters, J.; Lammel, J.; Kuhlmann, H. Methods to estimate on-field nitrogen emissions from crop production as an input to LCA studies in the agricultural sector. Int. J. Life Cycle Assess. 2000, 5, 349–357. [Google Scholar] [CrossRef]
- Cameron, K.C.; Di, H.J.; Moir, J.L. Nitrogen losses from the soil/plant system: A review. Ann. Appl. Biol. 2013, 162, 145–173. [Google Scholar] [CrossRef]
- Wu, H.; Du, S.; Zhang, Y.; An, J.; Zou, H.; Zhang, Y.; Yu, N. Effects of irrigation and nitrogen fertilization on greenhouse soil organic nitrogen fractions and soil-soluble nitrogen pools. Agric. Water Manag. 2019, 216, 415–424. [Google Scholar] [CrossRef]
- Chantigny, M.H.; Curtin, D.; Beare, M.H.; Greenfield, L.G. Influence of Temperature on Water-Extractable Organic Matter and Ammonium Production in Mineral Soils. Soil Sci. Soc. Am. J. 2010, 74, 517–524. [Google Scholar] [CrossRef]
- Mukhopadhyay, S.; Masto, R.E.; Tripathi, R.C.; Srivastava, N.K. Application of Soil Quality Indicators for the Phytorestoration of Mine Spoil Dumps; Elsevier Inc.: Amsterdam, The Netherlands, 2019; ISBN 9780128139134. [Google Scholar]


Publisher’s Note: MDPI stays neutral with regard to jurisdictional claims in published maps and institutional affiliations. |
© 2021 by the authors. Licensee MDPI, Basel, Switzerland. This article is an open access article distributed under the terms and conditions of the Creative Commons Attribution (CC BY) license (http://creativecommons.org/licenses/by/4.0/).