Article

Agriculture Land Use Change and Demographic Change in Response to Decline Suspended Sediment in Južna Morava River Basin (Serbia)

Faculty of Geography, University of Belgrade, 11000 Belgrade, Serbia
*
Author to whom correspondence should be addressed.
Sustainability 2021, 13(6), 3130; https://doi.org/10.3390/su13063130
Submission received: 17 February 2021 / Revised: 5 March 2021 / Accepted: 8 March 2021 / Published: 12 March 2021

Abstract

:
This study expounds the dynamic relationships among agricultural land-use change, rural population migration, and sediment transport. The variability of suspended sediment load was detected by Mann–Kendall and Pettitt tests. From 1961 to 2007, the annual trend in suspended sediment concentration and sediment load demonstrated significant reduction (α = 0.001), with decreasing rates of 0.0144 g/L/y and 84.7 t/y, respectively. An abrupt change-point was detected in 1984 for the sediment load (p = 0.0001). The double-mass curve method and regression analysis of sediment load versus precipitation were used to quantify the effects of climate change and human activities on sediment load variations. The changes in sediment load were predominantly impacted by human activities (89%), while precipitation explained 11% of the reduction in suspended sediment. An important land-use change recorded in the Južna Morava river basin comprised the abandonment of agricultural lands due to depopulation processes, as well as economic and social changes, which was followed by significant impacts on soil erosion and sediment transport. Land abandonment was most pronounced in marginal mountain or semi-mountainous areas, where agriculture was until recent decades traditional or semi-traditional. The results of the correlation matrix were significant at the p < 0.05 level, demonstrating that the decrease of rural population, agricultural land, and arable land were directly related to the decline of suspended sediment. High correlation coefficients were found between anthropogenic indicators and sediment parameters, ranging from 0.94 to 0.97.

1. Introduction

Transport sediment load in rivers has a long history of being studied as a physical process, from the aspect of various disciplines such as geomorphology, geology, and climatology. However, it has long been recognized that focusing exclusively on physical processes offers only a partial explanation of the causes of decrease or increase in sediment load trend. As dynamics and sediment transport also depend on anthropogenic impacts [1], some scientific studies have pointed out that the influence of socio-economic, demographic, and physical factors on the study of soil degradation and soil erosion processes should be solved in tandem [2]. The European Environment Agency has defined land-use as one of the basic factors of soil erosion [3]. The relationship between different land-uses/land-covers and the intensity of soil erosion has attracted the interest of a wide range of researchers [4,5,6,7,8]. Some studies have demonstrated that land-use is the dominant factor determining sediment yields, where the highest values are usually associated to cultivated lands [9,10,11]. Earlier analyses have also shown that spatial variability in human impact on catchment sediment yield can mainly be explained by differences in land-use (i.e., the fraction of arable land) in western and central Europe [12]. Important land-use changes recorded in the Mediterranean area include the abandonment of agricultural land due to economic and social changes, followed by significant impacts on soil erosion [13].
Changes in agricultural land-uses in different parts of Europe and the Balkans, in the second half of the 20th century and at the beginning of the 21st century, have shown that the deintensification of land-use in agricultural areas has led to a significant reduction in sediment production and sediment transport [14,15,16,17,18]. Serbia provides such an example, where the causes of trends in soil erosion can be explained by negative demographic and socio-economic changes [19,20,21,22,23,24]. As a kind of catalyst for agricultural development, natural conditions and socio-economic characteristics are, at the same time, important factors that have contributed to the current stage of agricultural production in Serbia [25]. The regressive age pyramid and deep-rooted birth model, insufficient for simple population reproduction, have been constant obstacles to the formation of positive (favorable) demographic trends in Serbia in the long-term [26]. Socio-economic development aimed at the industrialization of urban areas has only further accelerated the internal migration of residents from rural areas to fast-growing industrial centers [27]. This has resulted in disturbances in the gender structure of the current population in the primary reproductive years, at the settlement level throughout the country [28]. The unfavorable age and gender structure in agricultural areas has affected the change in the agricultural production structure and reduced the vital rate of the rural population, meanwhile reducing the economic attractiveness of these areas [29]. This has further deepened the processes of demographic aging and poverty. Rural depopulation has become one of the biggest structural development problems in Serbian society [30]. The rural areas of Serbia have experienced the characteristics of a rural exodus since the 1960s [27]. Depopulation processes and socio-economic processes affect changes in agricultural practices and land resource management. The post-socialist transformation of land has led to the fragmentation of large-scale agricultural land, which has resulted in the fragmentation of plots, an increase in farm colors, and an increase in uncultivated land [29].
Previous studies in Serbia [22,31] have shown that the most significant controlling factors affecting soil erosion are the coefficient of soil protection (X) in the EPM model and the topography (LS) and land-use (C) factors in the USLE model. Certain research focused on the functional relationship between land-use changes and soil erosion intensity has shown a link between these processes and changes in the transport of suspended sediment at the long-term scale [32]. The aims of this study are to analyze the inter-annual trend of suspended sediment load in Južna Morava river and to evaluate the impacts of climate change and human activities on the sediment load. In this context, the focus of this research is to determine the impact of the depopulation process, the process of deagrarization, and change of agricultural land-use on the dynamics and transport of sediment loads in the Južna Morava river basin. Considering that modern agrarian space research is typically based on concepts related to the study of spatial organization and mutual connections and relations between phenomena and processes related to agrarian production [7,8,33,34,35], in this paper, the research of agriculture is based on the spatial–temporal dimension and the principle of functional connection between demographic processes and land-use changes at the settlement level. Adequate knowledge, quantification, and understanding of these processes is a basic step in the development of effective strategies for land and water resource management, spatial planning and management, and environmental protection.

2. Study Area

The study area was located in the Južna Morava river basin (Figure 1). Južna Morava is formed by the merging of Binačka Morava and Preševska Moravica, which merge near the town of Bujanovac. The area of the Južna Morava basin is 15,469 km2, of which 85% belongs to Serbia, while smaller parts belong to Bulgaria and Northern Macedonia [36]. The relief of the basin consists of huge mountains of the Serbian–Macedonian mass, as well as parts of the Carpathian–Balkan mountains, with the largest extent in the Nišava basin. The hilly–mountainous relief is represented by altitudes ranging from 130 m (at the positions of the Južna and Zapadna Morava) to 2169 m (at the peak Midžor of the mountain Stara planina). The average altitude of the basin is 657 m. According to the map of the Spatial distribution of annual precipitation in Serbia in the period from 1961 to 2010, the average annual precipitation in the basin ranges from 550 mm, in the valley of the Južna Morava, to 1300 mm, in the highest eastern and southeastern parts of the basin [37]. The Južna Morava river basin belongs to the region characterized by precipitation values below the Serbian average [38,39]. The average annual air temperature is in the range of 10–12 °C in the lowest parts of the basin, while the mountainous parts (above 1500 m) have temperatures below 3 °C [40]. The rivers in the Južna Morava basin mostly belong to the pluvio–nival type of water regime, with maximum discharges in March and April, and minimum discharges in August and September [41]. Based on previous research on the natural hazards on the territory of Serbia [42], the valley of the Južna Morava, from Vladičin Han to Stalać, is a potential flood zone. Flooding of the Velika Morava River and its tributaries is mostly of the destructive torrential kind, which can have devastating consequences on the environment [43,44,45].
The population in the Južna Morava river basin lives in 27 urban and municipal centers and 1353 rural settlements. The urban centers are mainly located in the valleys of the Južna Morava and its larger tributaries, or along the main traffic corridors (e.g., the pan-European Corridor X). In terms of numbers, small urban settlements prevail: 16 settlements have less than 10,000 inhabitants and 6 between 10,000 and 20,000 inhabitants. There are only 4 medium-sized cities with population between 20,000 and 100,000, while the largest urban center is Nis, with approximately 183,000 inhabitants. According to the Statistical Office of the Republic of Serbia, the total population has decreased from 1961 (1,053,590 people) to 2011 (983,445 people).

3. Materials and Methodology

3.1. Data

Precipitation data (1961–2007) at 16 gauging stations in the Južna Morava river basin were provided by Meteorological Yearbooks of the Hydro-meteorological Office of the Republic of Serbia (RHMOS). Hydrological data series (1961–2007) of the annual water discharge and suspended sediment, extracted from hydrological station Mojsinje in the Južna Morava River, were obtained from the Hydrological Yearbooks of the RHMOS [46].
The impact of human activity on the dynamics of sediment load was based on the analysis of population, agricultural land, and arable land. Settlements are the basic territorial level (spatial units) in this study. The data set of populations was determined using the corresponding Statistical Yearbooks of the Statistical Office of the Republic of Serbia (SORS) for the census years 1961, 1971, 1981, 1991, 2002, and 2011. The data set of agricultural land and arable land in rural settlements was determined by comparative analysis using the Census of Agriculture books for 1960 and 2011. Data from the agricultural land and arable land censuses of 1971, 1981, 1991, and 2001 in Agricultural yearbooks were also used (SORS) [47]. The analysis was based on the interpretation of data within 1353 rural settlements located in the Južna Morava river basin, except for a few settlements in the south Serbian provinces Kosovo and Metohija, due to a lack of data (according to UN resolution 1244, the territorial status of the province is still not determined).

3.2. Mann–Kendall and Pettit Tests

To analyze the long-term trends of the hydro-meteorological variables, the non-parametric Mann–Kendall test (MK test) was applied. The rank-based Mann–Kendall test was originally proposed by Mann (1945) [48] and later reformulated by Kendall (1975) [49]. This method has been widely applied for general use throughout the world, due to its robustness for non-normally distributed data. In this study, this method was used to detect trends in precipitation, water discharge, suspended sediment concentration, and sediment load time-series. The Mann–Kendall Z statistic was used for significance testing. A positive value of Z represents an upward trend, while a negative Z value indicates a negative trend. In the Mann–Kendall test, the slope estimated using the Sen estimator is usually considered to detect the monotonic trend and to indicate the variable quantity in the unit time. It is a robust estimate of the magnitude of a trend and has been widely used to identify the slope of a trend line in hydrological and climatic time-series data.
Identifying change-points is one of the important analysis methods to study the impact of climate change and human activities on sediment load. This study uses the non-parametric method proposed by Pettitt (1979), which has been widely used for the detection of change-points in hydrological and climate data [50]. In this study, to detect change-points a significant level of α = 0.05 was used. Both methods have been widely recommended and have been generally applied in hydrological and meteorological data analyses. Details of the MK and Pettitt tests can be found in many previous studies [51,52,53,54] and, thus, are not repeated here.

3.3. Double-Mass Curve Method and Linear Regression Method

The double-mass curve (DMC) method is relatively simple, practical, and highly visual method, which has been widely used to analyze the consistency and trends in long-term hydro-meteorological data and to quantitatively evaluate the impacts of precipitation and human activities on water discharge and sediment regime changes [1,52]. The method uses linear regression analysis of cumulative precipitation, water discharge, and suspended sediment load time-series data. The application of this method has been described in many studies [51,52,53,54,55]. In this study, identifying the baseline period was one of the most important steps in the process. We used the Pettitt test to determine the baseline period for assessment of the relative impacts of climate change and human activity on sediment load. The period before the change-point was determined as the reference period, while the period after the change-point was the research period. The relationship curve between cumulative precipitation and cumulative sediment load in two periods was established, and a linear regression equation was established according to the base period, thereby reconstructing the annual sediment load not affected by human activities during the study period.
The impacts of human activities and precipitation on the transport of sediment load can be calculated using the following equations:
Qs = Qsao − Qspo,
where ΔQs is the total change of annual average suspended sediment load, Qspo is the observed average annual suspended sediment load of the before-change period, and Qsao is the observed suspended sediment load of the after-change period, extrapolated using the regression equation for the before-change period.
ΔQshuman = Qsao − Qsac,
where ΔQshum is the change in annual average suspended sediment load caused by human activities, and Qsac is the calculated suspended sediment load of the after-change period, extrapolated using the regression equation for the before-change period.
ΔQsprecipitation = ΔQs − ΔQshuman,
where ΔQprecipitation is the change in annual average suspended sediment load caused by changes in precipitation.
The following equations can be used to calculate the contributions of precipitation and human activities to the suspended sediment load:
μprecipitation = ΔQsprecipitation/ΔQs∙100%,
μhuman = ΔQshuman/ΔQs∙100%,
where μprecipitation is the contribution rate of change of precipitation to suspended sediment change, and μhuman is the contribution rate of human activities to sediment change [56,57].

3.4. The Sediment Rating Curve Method

The sediment rating curve (SRC) is used to understand the dynamics and conditions of suspended sediment transport in rivers. The method is based on the relationship between the suspended sediment concentration (or suspended sediment load) and water discharge [58,59]. As has been indicated in many studies [60,61], the general relationship can be expressed as a power function:
SSC = aQb,
Qs = aQb,
where SSC is the suspended sediment concentration (g/L), Qs is the sediment load (t), Q is the water discharge (m3/s), and a and b are the rating coefficients of the sediment rating curve.
According to Morgan (1995), the sediment rating parameters represent the soil erodibility and erosivity of the river [62]. A high value of the a coefficient indicates availability of sediment in the basin, which can be easily eroded and transported by runoff, while the b coefficient describes the erosivity of the river, for which a high value indicates a strong increase in the erosive power of the river. In this study, two complementary approaches were adopted. In the first part, we analyzed the variability of the coefficients a and b in the relationship between average annual suspended sediment concentration and water discharge. In the second part, we analyzed the relationship between annual sediment load and water discharge. The analysis considered temporal changes in the sediment regime, differentiated into ten-year time-series (1961–1970, 1971–1980, 1981–1990, and 1991–2000). The last period includes data from 2001 to 2007.

3.5. Method of Proportional Changes

Changes in population and the use of agricultural or arable land, for the period from 1961 to 2012, can be determined based on the analysis of proportional changes [30,63,64,65], which defines the regional configuration of the processes of depopulation and deagrarization in the rural area of the Južna Morava basin. The essence of this method lies in the initial hypothesis that “total changes” (in the number of inhabitants, agricultural areas, and arable land) are the result of two types of changes: (a) Regional differentiation of changes in each rural settlement individually; and (b) structural changes in the studied area which condition the dynamics of change.
“Absolute change” in population (PCj), agricultural land-use (AgLCj), and arable land (ArLCj) represent the total decrease in absolute values during the study period. The calculation was performed at the level of settlement (j), according to the formulas:
PCj = PEj0 − PEj1,
AgLC j = AgLEj0 − AgLEj1,
ArLCj = AgrLEj0 − ArLEj1,
where PCj is the absolute change in the number of inhabitants in each rural settlement individually, PEj0 is the population in 1961, PEj1 is the population in 2011, AgLCj is the absolute change of agricultural area in each rural settlement individually, AgLEj0 is the agricultural area in 1961, AgLEj1 is the agricultural area in 2011, ArLCj is the absolute change of arable land in each rural settlement individually, AgrLEj0 is the arable land in 1961, and ArLEj1 is the arable land in 2011.
The “Regional share component” of population, agricultural area, and arable land can be calculated according to the formulas:
PNj = PEj0 (PT1/PT0 − 1),
AgLNj = AgLEj0 (AgLT1/AgLT0 − 1),
ArLNj = ArLEj0 (ArLT1/ArLT0 − 1),
where PNj is the regional share component of population, PEj0 is the number of inhabitants in each settlement individually in 1961, PT1 is the total population in the basin territory in 2011, PT0 is the total population in the basin territory in 1961,AgLNj is the regional share component of agricultural area, AgLEj0 is the agricultural area in 1961, AgLT1 is the total agricultural area in the basin territory in 2011, AgLT0 is the total agricultural area in the basin territory in 1961, ArLNj is the regional share component of arable land, ArLEj0 is the arable land in 1961, ArLT1 is the total arable land in the basin territory in 2011, and ArLT0 is the total arable land in the basin territory in 1961.
The “Net relative change” of population, agricultural area, and arable land can be calculated according to the formulas:
PRj = PEj1 − PEj0 (PT1/PT0),
AgLRj = AgLEj1 − AgLEj0 (AgLT1/AgLT0),
ArLRj = ArLEj1 − ArLEj0 (ArLT1/ArLT0),
where PRj is the net relative change of population, PEj1 is the population in 2011, PEj0 is the population in 1961, PT1 is the total population in the basin territory in 2011, PT0 is the total population in the basin territory in 1961, AgLRj is the net relative change of agricultural area, AgLEj1 is the agricultural area in 2011, AgLEj0 is the agricultural area in 1961, AgLT1 is the total agricultural area in the basin territory in 2011, AgLT0 is the total agricultural area in the basin territory in 1961, ArLRj is the net relative change of arable land, ArLEj1 is the arable land in 2011, ArLEj0 is the arable land in 1961, ArLT1 is the total arable land in the basin territory in 2011, and ArLT0 is the total arable land in the basin territory in 1961.
The method of proportional changes enables the definition of different types of changes. The relative values of the two main components of change, in relation to the relative values of the Regional share component, define the following types of regional changes: “Progressive type” (PT), “stagnant type” (ST), “regressive type” (RT), and “predominantly regressive type” (DRT).

4. Results and Discussion

4.1. Long-Term Trend and Change-Point Analyses

The annual sediment load in the Južna Morava river basin decreased significantly from 1961 to 2007. The average annual sediment load was 2393 × 103 t, the minimum annual sediment load was 40 × 103 t (1993), and the maximum value was 9855 × 103 t (1963) (Figure 2A). Comparing precipitation and water discharge, the trend of sediment load was more obvious (Figure 3). The results of the Mann–Kendall (MK) test indicated no significant trend for the precipitation series. Water discharge showed a statistically significant decreasing trend (α = 0.05). The change rate of water discharge was 0.77 m3/s/yr. The suspended sediment concentration and sediment load decreased significantly (α = 0.001), with average annual decrease rate being SSC = 0.0144 g/L/yr and Qs = 7.1 × 10³ t/yr.
As the Mann–Kendall test showed a significant downward trend in sediment load, the Pettitt test was further used to detect the change-points (Table 1, Figure 2A). The Pettitt test was applied to annual precipitation and the results showed that no transition year could be detected at a significance level of α = 0.05. However, for annual water discharge, the change-point year was detected as 1983 (p < 0.05). For the annual sediment load, change-point year was detected as 1984 (p < 0.0001), which can be seen in the double-mass curve diagram (Figure 2B). The average sediment load reduced from 3650 × 103 t to 1082 × 103 t in the 1961–1984 and 1985–2007 periods, respectively.
The time-series was divided into two segments, based on the change-point, such that the gradual trends before and after the change-point could be further examined. Based on the MK test, changes of precipitation, water discharge, suspended sediment concentration, and sediment load before and after the detected change-point are shown in Figure 3 and Table 2. Compared with the results of the MK test in the whole study period of 1961–2007, the results of trend analysis for separate segments (i.e., before and after the change-point) showed different levels of significance. In general, the reductions in the suspended sediment concentration and sediment load in the period before the change-point were more dramatic than those of precipitation and water discharge. The time-series of SSC and Qs were found to show decreasing trends at the significance levels of α = 0.01 and α = 0.05, respectively. On the other hand, opposite change trends were found for new time-series (i.e., after the abrupt change-point) for precipitation and water discharge. Regardless of the established increasing trend the precipitation and water discharge, the suspended sediment still showed a decreasing trend in the time-series after the change-point. Opposite trends suggest that there were different control factors which were significant for sediment load reduction.

4.2. Quantification of the Impacts of Precipitation and Human Activities on the Decrease of Suspended Sediment

As can be seen from Figure 2B, the double-mass curve showed that the annual sediment load suddenly decreased in 1984, which was confirmed by the Pettitt test. In order to quantify the change in sediment loads before and after the change-point, a double-mass cumulative curve was drawn, in order to represent the correlation between cumulative water discharge and precipitation and cumulative annual sediment loads and precipitation. As can be seen from Figure 2B, the water discharge variation was relatively stable. According to the established linear regression equations, the analysis results showed that the cumulative decrease of water discharge after the change-point was only 8%, while the cumulative decrease of sediment load was 30% (Table 3).
The change-point (T) represents a change in the slope of the double-mass curve, emphasizing that the drastic decrease of suspended sediment load cannot be directly linked to the precipitation. This reduction reflects the impact of human-induced variation of sediment in the river basins. Table 4 summarizes the quantitative contributions of precipitation and human activities to the variations in sediment load. For sediment load, the impact of human activities far exceeded that of precipitation. The percentage impact of human activities was much larger than that of precipitation. Human activities in the basin were directly responsible for 89% of reduction in sediment load. These results are consistent with previous research, which has indicated the dominance of human impact on sediment reduction in rivers [52,53,54,55,66,67,68,69,70].

4.3. Influence of Anthropogenic Factors on Decline of Suspended Sediments

4.3.1. Spatial–Temporal Changes of Agricultural and Demographic Transformation of Settlements in Rural Areas

The effect of urbanization in modern conditions is absorbed by even the most remote villages and, thus, an increasing amount of rural population accepts the values of urban areas [34]. Due to the acceptance of new values, there is a depopulation of rural areas and a change in the organization of agricultural production. In suburban settlements, the dynamics of urbanization are the most intense, and rural–urban conflicts due to land-use changes are most pronounced. Different social groups adapt valuation standards to their needs, which is why traditional cultural landscapes change frequently [71]. The basic characteristics of modern changes in rural–urban relations and connections, defined through the processes of polarization, diffusivity, accessibility, and mobility [72], result in a pronounced migration of the population in the studied area. The analysis of the basic characteristics of the urban system in Serbia [73] and different demographic characteristics of the rural areas [
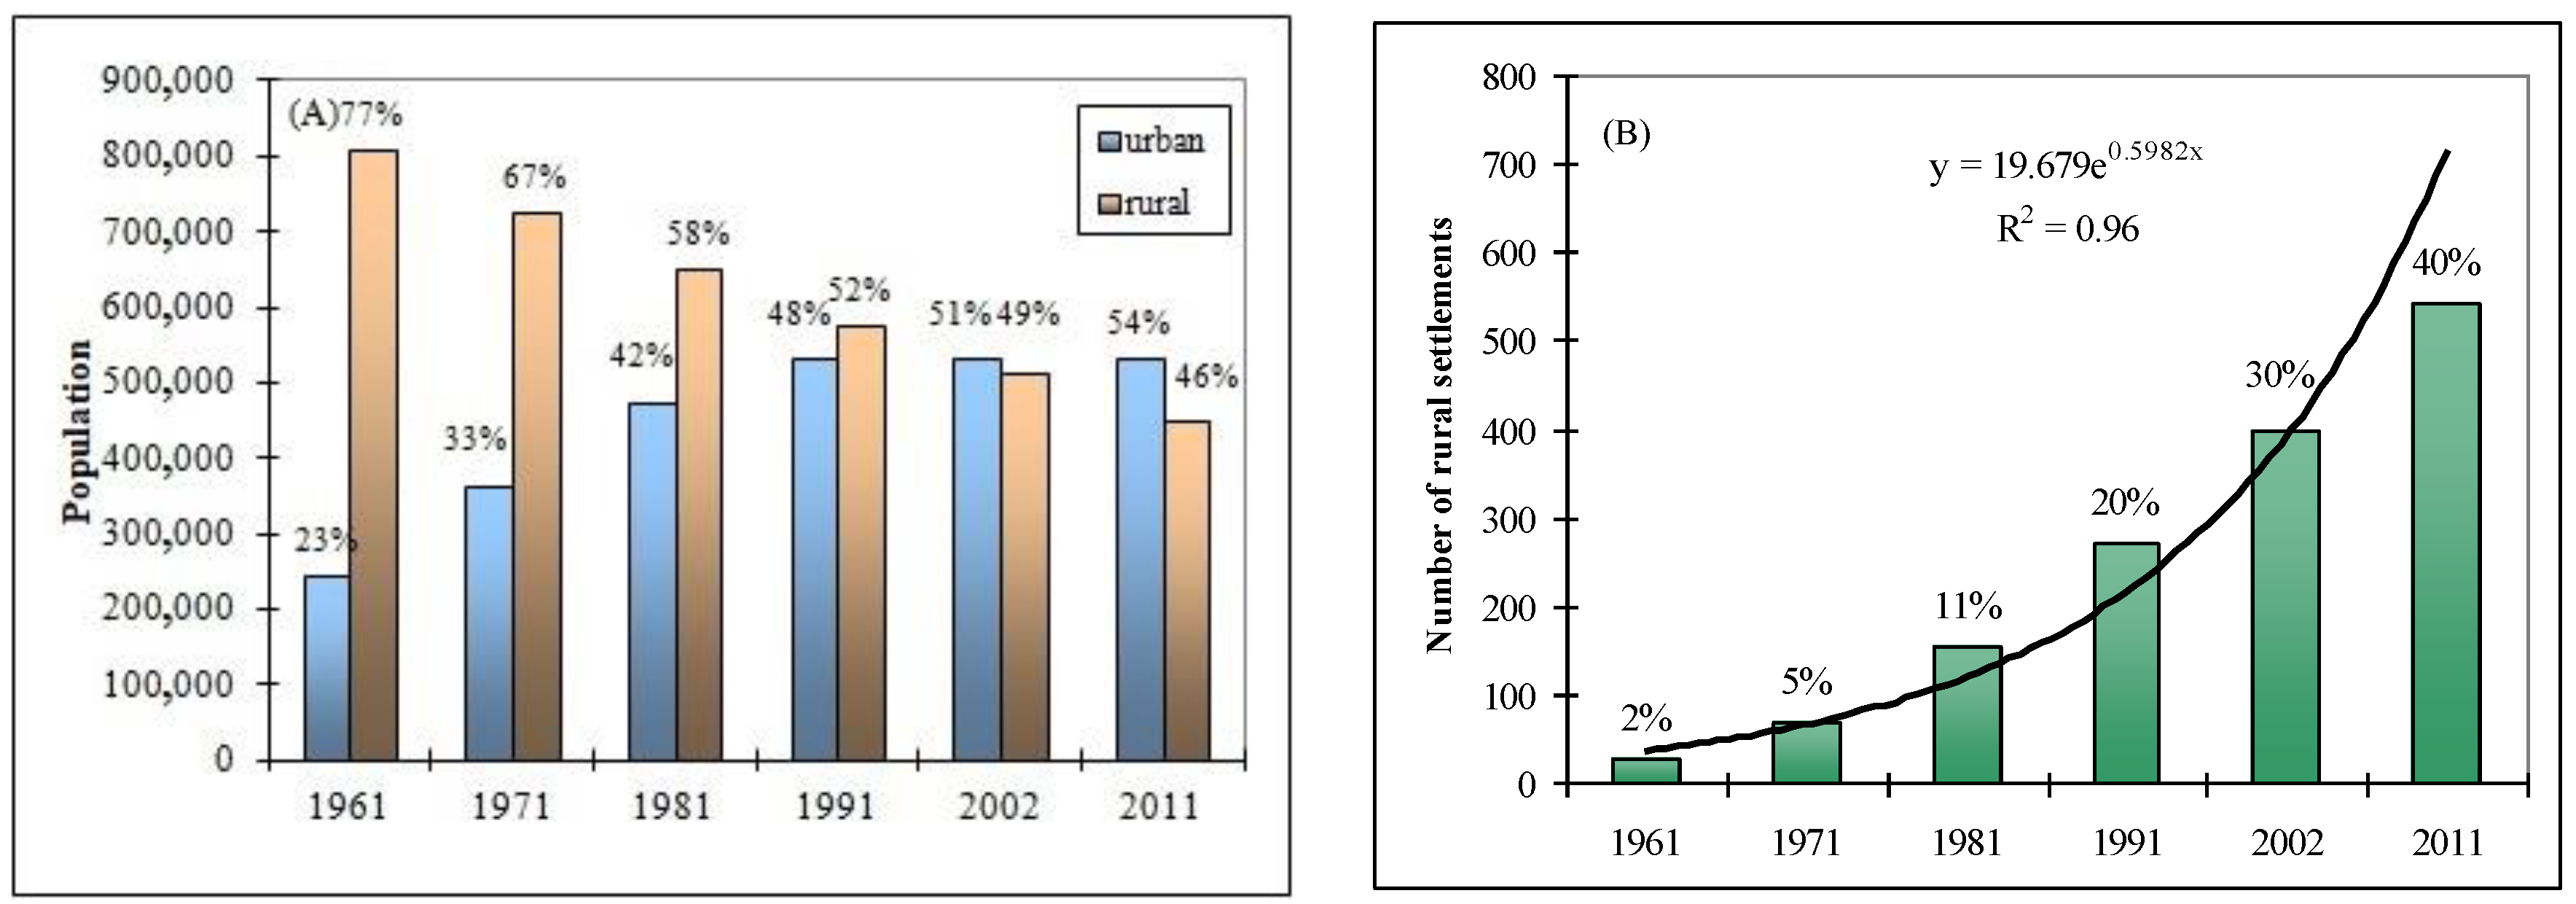
30] has emphasized the unbalanced spatial and regional development. These characteristics are very pronounced in the area of the Južna Morava river basin. According to 1961 Census, approximately a quarter of the total population (23%) lived in urban areas and approximately 77% of the active population lived in rural settlements. Over five decades, urbanity had increased to 54% by 2011, while the share of the rural population decreased to 46% (Figure 4A). The long-term policy of marginalizing rural areas led to a gradual aging and disappearance of the rural settlements; therefore, many households and agricultural activities have died out. The demographic aging of the labor force engaged in agriculture has had negative implications on the agricultural production itself, such that this rural labor force becomes a limiting factor in agricultural development [74]. The process of extinction of rural settlements and the drastic decline in the rural population have lasted for several decades. The number of rural settlements with less than 100 inhabitants has been growing exponentially. According to the last census (in 2011), 40% of rural settlements had fewer than 100 inhabitants, while that in 1961 was only 2% (Figure 4B).
As a consequence of long-term negative development tendencies, the rural settlements in the Južna Morava basin have undergone major transformations, in terms of the demographic and agro-geographical contexts. The typology of changes in the dynamics of population, agricultural areas, and arable land in the settlements of the Južna Morava basin is shown in Figure 5. Based on the presented methodology in the study area, the four basic types of settlements were defined.
The progressive type is characteristic of settlements in which the number of inhabitants, agricultural area, and arable land did not decrease, or where the decrease was significantly below the regional average. Progressive type of population change (PTP) occurred in 131 settlements (10%), while progressive type of change in agricultural areas (PTAgL) was present in 309 settlements (23%) and progressive type of arable land (PTArL) occurred in 203 settlements (15%). The progressive type of change was spatially located in the plain–valley part of the basin, along the main highway route in the peri-urban zone and, to a significant extent, the settlements with less pronounced processes of depopulation and deagrarization coincided. Multifunctional land-use in suburban areas conditions more efficient agricultural production and optimal market access [75]. Therefore, the intensive action of urbanization initiated the reaction of the peripheral rural area, in the form of increased attractiveness of settlement.
The stagnant type was also spatially located in the peri-urban belt, next to the progressive-type settlements. This type of change was characterized by a decrease in the number of inhabitants, agricultural area, and arable land, in proportion to the regional average. The stagnant type of population change (STP) occurred in 275 settlements (20%), the stagnant type of change in agricultural land (STAgL) occurred in 312 settlements (23%), and the stagnant type of arable land change (STArL) occurred in 330 settlements (24%). Unlike the part of the peri-urban belt in which settlements of progressive type were located, areas of stagnant type were characterized by a higher degree of fragmentation of holdings, greater diffusion of land-use, and increased urbanization pressure on agricultural land. The higher degree of fragmentation of agricultural holdings can be explained by the sale of part of agricultural plots, due to the high price of land [76], and the abandonment of agrarian activity in settlements of stagnant type.
The regressive type was characterized by a decrease in the number of inhabitants, agricultural area, and arable land higher than the regional average (i.e., up to the negative average of the Regional share component). Rural settlements of this type were extremely depopulated, while the process of deagrarization was in an advanced stage. In terms of the territorial distribution, settlements of this type were mainly located outside the plain–valley part and outside the peri-urban belt. They were characterized by poor accessibility to the agricultural market and mostly extensive agricultural production. The regressive type of population change (RTP) occurred in 649 settlements (48%), the regressive type of change in agricultural area (RTAgL) occurred in 383 settlements (28%), and the regressive type of arable land change (RTArL) occurred in 417 settlements (30%).
The dominant regressive type describes the situation where value of the net relative change was significantly lower than the negative average of the Regional share component. Rural settlements of this type form a zone which experienced extremely intensive processes of deagrarization, depopulation, and senilization of rural settlements. The dominant regressive type of population change (DRTP) occurred in 298 settlements (22%), the dominant regressive type of agricultural land change (DRTAgL) occurred in 349 settlements (26%), and the dominant regressive type of arable land change (DRTArL) occurred in 417 settlements (31%). They were spatially located mainly in the peripheral (distinctly hilly and mountainous) belts, in relation to important urban centers. In rural settlements of this type, the elderly population was predominantly represented, which is why there was no labor-intensive agricultural production [47].
The decrease in the number of inhabitants of rural areas is a consequence of continuous rural–urban migration, reduced fertility, and the decline in the attractiveness of rural settlements due to the increased need for a modern lifestyle among the working population. Land abandonment was most pronounced in marginal mountain or semi-mountainous areas, where agriculture was, until recent decades, traditional or semi-traditional with low input and high human labor intensity. The main factor in reducing agricultural and arable land is not a consequence of systematically organized restructuring of agriculture or the effect of a planned change in the direction of agricultural land-use but, most often, is instead a consequence of the individual decisions of farmers [77].

4.3.2. Temporal Changes in Transport of Suspended Sediment

Sediment rating curves were obtained for five distinct periods, according to the annual water discharge, sediment load, water discharge, and suspended sediment concentration. All sediment rating curves generally displayed a decreasing trend in all periods (Figure 6). In Table 5, the regression coefficient a had the highest value in the period up to 1980. The decreasing coefficient a and increasing coefficient b for SSC in the period after 1980 imply a decreasing sediment supply from the main source area of sediment and an increased erosive power of the river channel. A slightly higher value of the coefficient a in the sediment rating curve for Qs in the period 2001–2007 can be attributed to the increase in water discharge. Comparing water discharge, the trends of suspended sediment concentration and sediment load were more obvious (Figure 7); specifically, the mean water discharge in the period 2001–2007 was only 16% lower than in the first decade (1961–1970), while the mean SSC and mean Qs in the same period declined by 77% and 81%, respectively. A similar situation was observed, with respect to the change in maximum suspended sediment concentration and maximum sediment load. The MK test results showed decreasing and significant trends (α = 0.001) for SSCmax and Qsmax (Figure 3). The mean values of SSCmax and Qsmax in the period 2001–2007 are lower by 87% and 80%, respectively, compared to the first ten years. These results indicate a gradual downward shift, in response to the sediment reductions induced by human activities.

4.3.3. Rural Population, Agricultural Area, and Arable Land as Factors of Decline in Sediment Load

Developed European countries annually “lose” about 1.5% of the rural population [78], due to which arable land is reduced, the number of farmers decreases, and the structure of production changes. A similar trend was also observed in the territory of the Južna Morava basin. In general, during the study period (from 1961 to 2011), the number of inhabitants decreased by an average of 0.87% per year, while agricultural land decreased by 1.2% and arable land by about 1% per year. During the research period, suspended sediment concentration and sediment load decreased by about 1.5% and 1.8% per year, respectively. The loss of agricultural land is the main feature of the deagrarization process, and the most intensive decrease in the structure of the land was recorded for arable land. The intensity of depopulation and deagrarization [25] are presented, in terms of different population dynamic type (Tp) settlements (Figure 8). The process of deagrarization, as an important factor in the transformation of the environment, was most pronounced in rural areas of regressive and dominant regressive type. As can be seen from Figure 8, the highest intensity of deagrarization (i.e., high and medium-high deagrarization index) with average values of loss of agricultural and arable land of 85% and 89%, respectively, was typical for the predominantly regressive type of settlement (DRTp), for which a high depopulation index also held. Medium-high and medium deagrarization index, with an average reduction of agricultural land by 62% and arable land by 55%, is characteristic of the regressive type of settlement (RTp). Continuous reduction of agricultural area and arable land were also present in settlements of stagnant type (STp), but to a somewhat lesser extent (i.e., medium deagrarization index). The more intensive reduction of agricultural land (42%), in relation to the number of inhabitants (22%) in settlements of stagnant type, was a consequence of the continuous reduction of the agricultural labor force, in response to increased mechanization and periodic participation in agricultural production by the active population employed in other sectors. Even in settlements with a relatively stable or slight increase in population (PTp), there was an evident loss of land fund, which averaged 42% for agricultural land and 28% for arable land.
The decreasing trends of population, agricultural land, and arable land were directly related to the decline of suspended sediment. Statistical interactions between anthropogenic indicators and sediment parameters are described by the regression equation (Figure 9) and correlation matrix (Table 6). Correlations between variables were significant at p < 0.05. The results demonstrated high significance between variables. The values of the correlation coefficients (r) ranged from 0.94 to 0.99. In general, it can be concluded that the statistical analyses showed a strong level of dependence between the decreases in rural population, agricultural land, and arable land, and the decreases of suspended sediment concentration and sediment load.
The rates of decrease in sediment load and water discharge are the result of various human interventions and activities. There have been no systematic long-term measurements or research on the influence of anthropogenic factors on the flow regime in the study area. Some studies have indicated several possibilities [79,80]: The long-term acceptance of water from the right tributaries of the Južna Morava into river basins in the territory of Bulgaria; or water extraction and diversion for agricultural irrigation and urban and industrial use. Undoubtedly, the adoption of soil and water conservation measures and engineering structures in the 1960s and 1970s played a certain role in water discharge and sediment reduction [45]. However, our research showed that the biggest change in the reduction of sediment was reflected by land-use changes. Causal links between industrialization, urbanization, and economic and demographic development reflect the spatial distribution of the population. The socio-economic changes were the most pronounced in the 1970s and 1980s, when the reproductive population immigrated to urban areas [81]. The complex dynamics of rural–urban migration have resulted in an intensive process of depopulation, continuous fragmentation of rural settlements, structural changes in agricultural production, and changes in arable land-use. Rural settlements in mountainous and peripheral parts of the basin have typical features of traditional agriculture with low labor force engagement, low productivity, and low level of development [82]. The basic agrarian characteristic of the basin, overall, is the intensive and unplanned reduction of agricultural land. The abandonment of agricultural land affected the reduction of sediment production, and the transition year of sediment load (1984) was also in good agreement with the period of the major demographic and socio-economic changes.

5. Conclusions

In this study, the trends of reduction of suspended sediment in the Južna Morava River basin in the period 1961–2007 and the impact of human activities on the established trend were analyzed. During the study period, decreases in SSC and Qs was found at a significance level of α = 0.001, with average reduction rates of 0.0144 g/L/y for SSC and 84.7 t/y for Qs. The results of Pettitt tests at confidence level of α = 0.05 showed that the amount of sediment transported decreased significantly (p < 0.0001) and 1984 was detected as change-point year of sediment load. To quantitatively evaluate the impacts of precipitation and human activities on water discharge and sediment regime changes, a double mass-plot diagram and linear regression were used. The changes in sediment load were predominantly impacted by human activities (89%), while precipitation explained 11% of the reduction in suspended sediment.
An important land-use change recorded in the Južna Morava river basin comprises the abandonment of agricultural lands, due to demographical, economic, and social changes, which was followed by significant impacts on the sediment regime. Only 9.7% of settlements spatially defined in peri-urban zones had a stagnant or slight increase in population, while 90.3% of settlements were characterized by different levels of depopulation, namely, the typological classification of settlements, according to population dynamics (Tp), showed that as much as 70% of settlements belonged to the regressive (RTp) and predominantly regressive (DRTp) type, in which the decrease in rural population was 68% and 92%, respectively, in the period from 1961 to 2011.
The factor of migration of the population from the mountainous parts of the basin towards the urban centers had the consequence that a large percentage of agricultural area was abandoned and, over time, became overgrown with spontaneous vegetation. The results revealed that the greatest impact of land-use changes between 1961 and 2011 was a reduction in arable land, as an individual and social response to economic conditions during the research period. The loss of agricultural land was the main feature of the deagrarization process, and the most intensive decrease in the structure of the land fund was recorded in arable land. In general, during the study period, the number of inhabitants decreased by an average of 0.87% per year, while agricultural land decreased by 1.2% and arable land decreased by about 1% per year. The highest deagrarization index was characteristic of the settlements that had the highest depopulation (reduction of agricultural land and arable land of 85% and 89%, respectively). The continuous decrease of agricultural land was also typical in settlements with a relatively stable or slight increase in the number of inhabitants, where the loss of land fund averaged 42% for agricultural land and 28% for arable land.
The observed agriculture land abandonment resulted in a reduction in soil erosion, which led to a reduction in the transport of suspended sediment in the river. The results of sediment rating curves for the five distinct time periods showed a decrease of the regression coefficients a, indicating a decrease in the supply of sediments from the main source to the river channel. Furthermore, the results of the correlation matrix (significant at p < 0.05), between anthropogenic indicators and sediment parameters, showed high correlation coefficients, ranging from 0.94 to 0.97. It can be concluded that the decreases of rural population, agricultural land, and arable land were directly related to the decline of suspended sediment.
This research can serve as a basis for integrated basin management. In the initial phase of implementation of this concept, it is necessary to identify specific problems in the basin and to enable reliable and timely action of the population. The results of this interdisciplinary approach to the study of the dynamics of suspended sediment can be used to solve problems in the economic, social, agricultural, and environmental spheres, with the clearly defined task of sustainable development of the area. This not only enables the realization of long-term environmental goals at higher levels but, at the same time, ensures the existence of the rural population, which largely depends on the sustainability of land and water resources.

Author Contributions

Conceptualization, S.M. and M.S.; methodology, S.M. and M.S.; software, M.S.; validation, S.M. and M.S.; formal analysis, S.M., T.S. and M.S.; investigation, A.H. and T.S.; data curation, T.S. and I.S.; writing—original draft preparation, S.M.; writing—review and editing, M.S.; visualization, M.S.; supervision, S.M.; project administration, A.H. and I.S.; funding acquisition, S.M. and M.S. All authors have read and agreed to the published version of the manuscript.

Funding

This research was funded by Ministry of Education, Science and Technological Development of the Republic of Serbia, project 176017.

Institutional Review Board Statement

Not applicable.

Informed Consent Statement

Not applicable.

Data Availability Statement

Data set was used from Statistical Office of Republic of Serbia (https://www.stat.gov.rs/en-US/, accessed on 25 September 2020).

Acknowledgments

This study is a research project funded by the Ministry of Education, Science and Technological Development of the Republic of Serbia.

Conflicts of Interest

The authors declare no conflict of interest.

References

  1. Walling, D.E. Human impact on land–ocean sediment transfer by the world’s rivers. Geomorphology 2006, 79, 192–216. [Google Scholar] [CrossRef]
  2. Boardman, J.; Poesen, J.; Evans, R. Socio-economic factors in soil erosion and conservation. Environ. Sci. Policy 2003, 6, 1–6. [Google Scholar] [CrossRef]
  3. Gobin, A.; Jones, R.; Kirkby, M. Assessment and Reporting on Soil Erosion: Background and Workshop Report; European Environment Agency: Copenhagen, Denmark, 2003; pp. 1–103. [Google Scholar]
  4. Sharma, A.; Tiwari, K.N.; Bhadoria, P.B. Effect of land use land cover change on soil erosion potential in an agricultural watershed. Environ. Monit. Assess. 2011, 173, 789–801. [Google Scholar] [CrossRef]
  5. Leh, M.; Bajwa, S.; Chaubey, I. Impact of land use change on erosion risk: An integrated remote sensing, geographic information system and modeling methodology. Land Degrad. Dev. 2013, 24, 409–421. [Google Scholar] [CrossRef]
  6. Serpa, D.; Nunes, J.P.; Santos, J.; Sampaio, E.; Jacinto, R.; Veiga, S.; Lima, J.C.; Moreira, M.; Corte-Real, J.; Keizer, J.J. Impacts of climate and land use changes on the hydrological and erosion processes of two contrasting Mediterranean catchments. Sci. Total Environ. 2015, 538, 64–77. [Google Scholar] [CrossRef] [PubMed] [Green Version]
  7. Uddin, K.; Matin, M.A.; Maharjan, S. Assessment of Land Cover Change and Its Impact on Changes in Soil Erosion Risk in Nepal. Sustainability 2018, 10, 4715. [Google Scholar] [CrossRef] [Green Version]
  8. Gusarov, A.V. The impact of contemporary changes in climate and land use/cover on tendencies in water flow, suspended sediment yield and erosion intensity in the northeastern part of the Don River basin, SW European Russia. Environ. Res. 2019, 175, 468–488. [Google Scholar] [CrossRef] [PubMed]
  9. Erskine, W.D.; Mahmoudzadeh, A.; Myers, C. Land use effects on sediment yields and soil loss rates in small basins of Triassic sandstone near Sydney, NSW, Australia. Catena 2002, 49, 271–287. [Google Scholar] [CrossRef]
  10. García-Ruiz, J.M.; Lana-Renault, N. Hydrological and erosive consequences of farmland abandonment in Europe, with special reference to the Mediterranean region—A review. Agric. Ecosyst. Environ. 2011, 140, 317–338. [Google Scholar] [CrossRef]
  11. Ferreira, V.; Panagopoulos, T.; Cakula, A.; Andrade, R.; Arvela, A. Predicting soil erosion after land use changes for irrigating agriculture in a large reservoir of southern Portugal. Agric. Agric. Sci. Procedia 2015, 4, 40–49. [Google Scholar] [CrossRef] [Green Version]
  12. Vanmaercke, M.; Poesen, J.; Govers, G.; Verstraeten, G. Quantifying human impacts on catchment sediment yield: A continental approach. Glob. Planet. Chang. 2015, 130, 22–36. [Google Scholar] [CrossRef]
  13. Koulouri, M.; Giourga, C. Land abandonment and slope gradient as key factors of soil erosion in Mediterranean terraced lands. Catena 2007, 69, 274–281. [Google Scholar] [CrossRef]
  14. Garcia-Ruiz, J.M.; Lasanta, T.; Ruiz-Flano, O.; Ortigosa, L.; White, S.; Gonzhlez, C.; Marti, C. Land-use changes and sustainable development in mountain areas: A case study in the Spanish Pyrenees. Landsc. Ecol. 1996, 11, 267–277. [Google Scholar] [CrossRef]
  15. Tošić, R.; Dragićević, S.; Lovrić, N. Assessment of soil erosion and sediment yield changes using erosion potential model—Case study: Republic of Srpska (BiH). Carpath. J. Earth Environ. Sci. 2012, 7, 147–154. [Google Scholar]
  16. Tošić, R.; Dragićević, S.; Zlatić, M.; Todosijević, M.; Kostadinov, S. The impact of socio-demographic changes on land use and soil erosion (case study: Ukrina river catchment). Geogr. Rev. 2012, 46, 69–78. [Google Scholar]
  17. Kijowska-Strugata, M.; Bucata-Hrabia, A.; Demczuk, P. Long-term impact of land use changes on soil erosion in anagricultural catchment (in the Western Polish Carpathians). Land Degrad. Dev. 2018, 29, 1871–1884. [Google Scholar] [CrossRef]
  18. Spalević, V.; Barović, G.; Vujačić, D.; Ćurović, M.; Behzadfar, M.; Đurović, N.; Dudić, B.; Billi, P. The Impact of Land Use Changes on Soil Erosion in the River Basin of Miocki Potok, Montenegro. Water 2020, 12, 2973. [Google Scholar] [CrossRef]
  19. Dragićević, S.; Stepić, M. Changes of the erosion intensity in the Ljig river basin–the influence of the antropogenic factor. Bull. Serb. Geogr. Soc. 2006, 86, 37–44. [Google Scholar]
  20. Kostadinov, S.; Zlatić, M.; Dragićević, S.; Novković, I.; Košanin, O.; Borisavljević, A.; Lakićević, M.; Mlađan, D. Antropogenic Influence on Erosion Intensity Changes in Rasina River Watershed Area upstream from “Celije” Water Reservoir, Central Serbia. Fresenius Environ. Bull. 2014, 23, 254–263. [Google Scholar]
  21. Manojlović, S.; Antić, M.; Sibinović, M.; Dragicević, S.; Novković, I. Soil erosion response to demographic and land use changes in the Nišava river basin, Serbia. Fresenius Environ. Bull. 2017, 26, 7547–7560. [Google Scholar]
  22. Manojlović, S.; Antić, M.; Šantić, D.; Sibinović, M.; Carević, I.; Srejić, T. Anthropogenic Impact on Erosion Intensity: Case Study of Rural Areas of Pirot and Dimitrovgrad Municipalities, Serbia. Sustainability 2018, 10, 826. [Google Scholar] [CrossRef] [Green Version]
  23. Perović, V.; Kadović, R.; Ðurdević, V.; Braunović, S.; Čakmak, D.; Mitrović, M.; Pavlović, P. Effects of changes in climate and land use on soil erosion: Case study of the Vranjska Valley, Serbia. Reg. Environ. Chang. 2019, 19, 1035–1046. [Google Scholar] [CrossRef]
  24. Gocić, M.; Dragićević, S.; Radivojević, A.; Martić Bursać, N.; Stričević, L.; Đorđević, M. Changes in Soil Erosion Intensity Caused by Land Use and Demographic Changes in the Jablanica River basin, Serbia. Agriculture 2020, 10, 345. [Google Scholar] [CrossRef]
  25. Sibinović, M. Structural Changes and Spatial Differentiation of Agriculture in Rural Settlements of Belgrade Region. Ph.D. Thesis, Faculty of Geography, University of Belgrade, Belgrade, Serbia, 2014. [Google Scholar]
  26. Nikitović, V. Towards the Regional Depopulation; Institute of Social Sciences: Belgrade, Serbia, 2019; pp. 1–115. [Google Scholar]
  27. Martinović, M.; Ratkaj, I. Sustainable rural development in Serbia: Towards a quantitative typology of rural areas. Carpath. J. Earth Environ. Sci. 2015, 10, 37–48. [Google Scholar]
  28. Nikitović, V. Demographic Limits to sustainable development of mountain regions in Serbia. In Sustainable Development in Mountain Regions; Zhelezov, G., Ed.; Springer: Berlin, Germany, 2016; pp. 241–251. [Google Scholar]
  29. Bogdanov, N.; Petronijević, M. Structural Changes of agricultural sector-experience after two year of transition. In Agriculture and Rural Area of Serbia—Sensitive Points of Transition and the Comparison with Other Countries; Bogadnov, N., Ed.; Faculty of Agriculture, University of Belgrade: Belgrade, Serbia, 2009; pp. 1–23. [Google Scholar]
  30. Antić, M.; Šantić, D.; Kašanin-Grubin, M.; Malić, A. Sustainable Rural Development in Serbia—Relationship Between Population Dynamicss and Environment. J. Environ. Prot. Ecol. 2017, 18, 323–331. [Google Scholar]
  31. Perović, V.; Jaramaz, D.; Životić, L.; Cakmak, D.; Mrvić, V.; Milanović, M.; Saljnikov, E. Design and implementation of WebGIS technologies in evaluation of erosion intensity in the municipality of NIS (Serbia). Environ. Earth Sci. 2016, 75, 1–12. [Google Scholar] [CrossRef]
  32. Manojlović, S. Influence of Geographical Factors on Changes in the Intensity of Water Erosion in the Nišava River Basin; Faculty of Geography, University of Belgrade: Belgrade, Serbia, 2019; pp. 1–189. [Google Scholar]
  33. Todorović, M. The Base of Typology and Regionalization of Agriculture of Serbia; Serbian Geographical Society: Belgrade, Serbia, 2002; pp. 1–164. [Google Scholar]
  34. Antrop, M. Landscape change and the urbanization process in Europe. Landsc. Urban. Plan. 2004, 67, 9–26. [Google Scholar] [CrossRef]
  35. Grigg, D. An Introduction to Agricultural Geography; Routledge: New York, NY, USA, 2005; pp. 1–236. [Google Scholar]
  36. Borisavljević, A.; Kostadinov, S. Integrated river basin management of Juzna Morava River. Bull. Serb. Geogr. Soc. 2012, 92, 135–160. [Google Scholar] [CrossRef]
  37. Milovanović, B.; Schuster, P.; Radovanović, M.; Ristić Vakanjac, V.; Schneider, C. Spatial and temporal variability of precipitation in Serbia for the period 1961–2010. Theor. Appl. Climatol. 2017, 130, 687–700. [Google Scholar] [CrossRef]
  38. Gocić, M.; Trajković, S. Spatio-temporal patterns of precipitation in Serbia. Theor. Appl. Climatol. 2014, 117, 419–431. [Google Scholar] [CrossRef]
  39. Gocić, M.; Trajković, S. Spatio-temporal characteristics of drought in Serbia. J. Hydrol. 2014, 510, 110–123. [Google Scholar] [CrossRef]
  40. Bajat, B.; Blagojević, D.; Kilibarda, M.; Luković, J.; Tošić, I. Spatial analysis of the temperature trends in Serbia during the period 1961–2010. Theor. Appl. Climatol. 2015, 121, 289–301. [Google Scholar] [CrossRef]
  41. Urošev, M.; Dolinaj, D.; Leščešen, I. Hydrological droughts in the Južna Morava river basin (Serbia). Geogr. Pannon. 2016, 20, 197–207. [Google Scholar] [CrossRef] [Green Version]
  42. Dragicević, S.; Filipović, D.; Kostadinov, S.; Ristić, R.; Novoković, I.; Zivković, N.; Andjelković, G.; Abolmasov, B.; Sećerov, V.; Djurdjić, S. Natural Hazard Assessment for Land-use Planning in Serbia. Int. J. Environ. Res. 2011, 5, 371–380. [Google Scholar]
  43. Petrović, A.; Kostadinov, S.; Dragicević, S. The inventory and characterization of Torrential flood phenomenon in Serbia. Pol. J. Environ. Stud. 2014, 23, 823–830. [Google Scholar]
  44. Gavrilović, L.J.; Milanović-Pešić, A.; Urošev, M. A hydrological analysis of the greatest floods in Serbia in the 1960–2010 period. Carpath. J. Earth Environ. Sci. 2012, 7, 107–116. [Google Scholar]
  45. Kostadinov, S.; Braunović, S.; Dragićević, S.; Zlatić, M.; Dragović, N.; Rakonjac, N. Effects of Erosion Control Works: Case Study-Grdelica Gorge, the South Morava River (Serbia). Water 2018, 10, 1094. [Google Scholar] [CrossRef] [Green Version]
  46. Hydrometeorological Office of the Republic of Serbia 1961–2007. Available online: http://www.hidmet.gov.rs (accessed on 10 September 2020).
  47. Statistical Office of the Republic of Serbia 1961–2012. Available online: http://www.stat.gov.rs (accessed on 25 September 2020).
  48. Mann, H.B. Nonparametric tests against trend. Econometrica 1945, 13, 245–259. [Google Scholar] [CrossRef]
  49. Kendall, M.G. Kendall Rank Correlation Methods; Griffin: London, UK, 1975; pp. 1–202. [Google Scholar]
  50. Pettitt, A.N. A non-parametric approach to the change-point problem. J. Appl. Stat. 1979, 28, 126–135. [Google Scholar] [CrossRef]
  51. Gao, P.; Zhang, X.C.; Mu, X.M.; Wang, F.; Li, R.; Zhang, X.P. Trend and change-point analyses of streamflow and sedi-ment discharge in Yellow River mainstream during 1950–2005. Hydrol. Sci. J. 2010, 55, 275–285. [Google Scholar] [CrossRef]
  52. Gao, P.; Mu, X.M.; Wang, F.; Li, R. Changes in streamflow and sediment discharge and the response to human activities in the middle reaches of the Yellow River. Hydrol. Earth Syst. Sci. 2011, 15, 1–10. [Google Scholar] [CrossRef] [Green Version]
  53. Gao, P.; Geissen, V.; Ritsema, C.J.; Mu, X.M.; Wang, F. Impact of climate change and anthropogenic activities on stream flow and sediment discharge in the Wei River basin, China. Hydrol. Earth Syst. Sci. 2013, 17, 961–972. [Google Scholar] [CrossRef] [Green Version]
  54. Zhong, X.; Jiang, X.; Li, L.; Xu, J.; Xu, H. The Impact of Socio-Economic Factors on Sediment Load: A Case Study of the Yanhe River Watershed. Sustainability 2020, 12, 2457. [Google Scholar] [CrossRef] [Green Version]
  55. Tian, P.; Mu, X.; Liu, J.; Hu, J.; Gu, C. Impacts of Climate Variability and Human Activities on the Changes of Runoff and Sediment Load in a Catchment of the Loess Plateau, China. Adv. Meteorol. 2016, 3, 1–15. [Google Scholar] [CrossRef]
  56. Li, Z.; Xu, X.; Yu, B.; Xu, C.; Liu, M.; Wang, K. Quantifying the impacts of climate and human activities on water and sediment discharge in a karst region of southwest China. J. Hydrol. 2016, 542, 836–849. [Google Scholar] [CrossRef]
  57. Wu, J.; Miao, C.; Zhang, X.; Yang, T.; Duan, Q. Detecting the quantitative hydrological response to changes in climate and human activities. Sci. Total Environ. 2017, 586, 328–337. [Google Scholar] [CrossRef]
  58. Jansson, M.B. Estimating a sediment rating curve of the Reventazon river at Palomo using logged mean loads within discharge classes. J. Hydrol. 1996, 183, 227–241. [Google Scholar] [CrossRef]
  59. Walling, D.E. Assessing the accuracy of suspended sediment rating curves for a small basin. Water Resour. Res. 1977, 13, 531–538. [Google Scholar] [CrossRef]
  60. Achite, M.; Ouillon, S. Suspended sediment transport in a semiarid watershed, Wadi Abd, Algeria (1973–1995). J. Hydrol. 2007, 343, 187–202. [Google Scholar] [CrossRef]
  61. Iadanza, C.; Napolitano, F. Sediment transport time series in the Tiber River. Phys. Chem. Earth Parts A/B/C 2006, 31, 1212–1227. [Google Scholar] [CrossRef]
  62. Morgan, R.P.C. Soil Erosion and Conservation; John Wiley & Sons: New Jersey, NJ, USA, 1995; pp. 1–316. [Google Scholar]
  63. Göler, D.; Grčić, M.; Ratkaj, I. Tendenzen der jüngeren industriellen Entwicklung in Serbien und ihre regionale Differenzierung –untersucht mit einem quantitativen Analyseansatz. Mitt. Osterr. Geogr. Ges. 2007, 149, 109–132. [Google Scholar]
  64. Martinović, M. Types of population dynamics in settlements of Zaplanje area. Bull. Serb. Geogr. Soc. 2012, 92, 133–152. [Google Scholar] [CrossRef]
  65. Sibinović, M.; Winkler, A.; Grčić, M. Agriculture in a Transitional Crisis Period: Crop Production in the Administrative Region of Belgrade from 1991 to 2002. Mitt. Osterr. Geogr. Ges. 2014, 156, 293–310. [Google Scholar] [CrossRef] [Green Version]
  66. Zhang, X.; Yan, H.; Yue, Y.; Xu, Q. Quantifying natural and anthropogenic impacts on runoff and sediment load: An investigation on the middle and lower reaches of the Jinsha River Basin. J. Hydrol. Reg. Stud. 2019, 25, 1–19. [Google Scholar] [CrossRef]
  67. Du, M.; Mu, X.; Zhao, G.; Gao, P.; Sun, W. Changes in Runoff and Sediment Load and Potential Causes in the Malian River Basin on the Loess Plateau. Sustainability 2021, 13, 443. [Google Scholar] [CrossRef]
  68. Wang, H.; Yang, Z.; Saito, Y.; Liu, J.P.; Sun, X.; Wang, Y. Stepwise decreases of the Huanghe (Yellow River) sediment load (1950–2005): Impacts of climate change and human activities. Glob. Planet. Chang. 2007, 57, 331–354. [Google Scholar] [CrossRef]
  69. Peng, J.; Chen, S.; Dong, P. Temporal variation of sediment load in the Yellow River basin, China, and its impacts on the lower reaches and the river delta. Catena 2010, 83, 135–147. [Google Scholar] [CrossRef]
  70. Zhang, W.; Mu, S.; Zhang, Y.; Chen, K. Temporal variation of suspended sediment load in the Pearl River due to human activities. Int. J. Sediment. Res. 2011, 26, 487–497. [Google Scholar] [CrossRef]
  71. Wood, R.; Handley, J. Landscape Dynamics and the Management of Change. Landsc. Res. 2001, 26, 45–54. [Google Scholar] [CrossRef]
  72. Antrop, M. Rural-urban conflicts and opportunities. In The New Dimensions of the European Landscape, Wageningen UR Frontis Series; Jongman, R., Ed.; Springer: Berlin, Germany, 2005; pp. 83–91. [Google Scholar]
  73. Živanović, Z.; Tošić, B.; Nikolić, T.; Gatarić, D. Urban System in Serbia—The Factor in the Planning of Balanced Regional Development. Sustainability 2019, 11, 4168. [Google Scholar] [CrossRef] [Green Version]
  74. Miljković, M.; Bilali, H.E.; Berjan, S. Rural economy diversification in Serbia. Res. J. Agric. Sci. 2010, 42, 684–691. [Google Scholar]
  75. Sibinović, M. Structural changes in the rural planting areas of Belgrade region. Bull. Serb. Geogr. Soc. 2012, 92, 111–132. [Google Scholar] [CrossRef]
  76. Živanović, Z.; Tošić, B.; Đorđević, J. Regional types in Serbia and their territorial inconsistency. Bull. Serb. Geogr. Soc. 2010, 90, 151–172. [Google Scholar]
  77. Jordan, P. Development of rural space in post-communist Southeast Europe after 1989: A comparative analysis. Geogr. Rev. 2009, 4, 89–102. [Google Scholar]
  78. Frey, W.H.; Zimmer, Z. Defining the city. In Handbook of Urban Studies; Paddison, R., Ed.; SAGE Publications: London, UK, 2001; pp. 14–35. [Google Scholar]
  79. Gavrilović, L.J.; Dukić, D. Rivers of Serbia; Institute for Textbook Publishing and Teaching Aids: Belgrade, Serbia, 2002; pp. 1–218. [Google Scholar]
  80. Djokić, M. Nišava—Potamology Study. Ph.D. Thesis, Department of Geography, Faculty of Science and Mathematics, University of Niš, Niš, Serbia, 2015. [Google Scholar]
  81. Jevtić, M. Functional Urban Region in Spatial Planning; Faculty of Geography, University of Belgrade: Belgrade, Serbia, 2019; pp. 1–286. [Google Scholar]
  82. Drobnjaković, M. Development Role of the Rural Settlements in Central Serbia; Geographical Institute “Jovan Cvijić”, Serbian Academy of Sciences and Arts: Belgrade, Serbia, 2019; pp. 1–253. [Google Scholar]
Figure 1. Location of study area in Republic of Serbia.
Sustainability 13 03130 g001
Figure 2. (A) Time-series of the annual sediment load (Qs) and change-point detection (using the Pettitt test); and (B) Double-mass curve analysis of precipitation (P)—water discharge (Q) and precipitation (P)—annual sediment load (Qs) during 1961–2007 in the Južna Morava river basin. The straight lines are the regression lines for the cumulative data before and after the detected change-point.
Sustainability 13 03130 g002
Figure 3. Results of Z statistic trend analysis using the Mann–Kendall (MK) test during 1961–2007, 1961–1984 (before change-point), and 1985–2007 (after change-point). P, precipitation (mm/yr); Q, annual water discharge; Qmax, maximum water discharge; SSCav, average annual suspended sediment concentration; SSCmax, maximum suspended sediment concentration; Qs, annual sediment load; Qsav, average annual sediment load; Qsmax, maximum sediment load; α, significance level; α + = 0.1, α * = 0.05, α ** = 0.01, α *** = 0.001; α =/, no significance.
Sustainability 13 03130 g003
Figure 4. (A) Changes in the share of urban and rural population in the period 1961–2011; and (B) the percentage and number of rural settlements with a population of less than 100, with respect to the total number of settlements, in the period 1961–2011. Analysis based on the data of rural and urban settlements in the Južna Morava river basin.
Sustainability 13 03130 g004
Figure 5. Typology of rural settlements, according to population dynamics, TP (A); the change of agricultural areas, TAgL (B); and the change of arable land, TArL (C) in the period 1961–2011.
Sustainability 13 03130 g005
Figure 6. Sediment rating curves for decline of suspended sediment concentration (A) and sediment load (B) for decade periods based on annual data.
Sustainability 13 03130 g006
Figure 7. Long-term variations: In average annual water discharge (Qav) and maximum water discharge (Qmax) (A); in average annual suspended sediment concentration (SSCav) and maximum suspended sediment concentration (SSCmax) (B); and in average annual suspended sediment load (Qsav) and maximum suspended sediment load (Qsmax) (C).
Sustainability 13 03130 g007
Figure 8. Box-plots of differentiation of the depopulation index/deagrarization index, according to the typological classification of settlements by population dynamics (TP). High depopulation/High deagrarization: Pj/AgLj/AgLj < 10; Medium-high depopulation/Medium-high deagrarization: Pj/AgLj/AgLj = 10–30; Medium-depopulation/Medium deagrarization: Pj/AgLj/AgLj = 30–50; Medium-low depopulation/Medium-low deagrarization: Pj/AgLj/AgLj = 50–70; Low depopulation/Low deagrarization: Pj/AgLj/AgLj = 70–100; Population growth/Agricultural or Arable growth: Pj/AgLj/AgLj > 100).
Sustainability 13 03130 g008
Figure 9. Relationship between rural population (P) and suspended sediment concentration (SSCav), and between rural population (P) and sediment load (Qsav).
Sustainability 13 03130 g009
Table 1. Statistical tests evaluating changes in the long-term annual precipitation, water discharge, and suspended sediment load. Results of Pettitt tests at significance level of α = 0.05.
River-StationParameterKpShiftChange-Point (T)
Južna Morava-MojsinjePrecipitation1680.2915--
Water discharge3080.0050Downward1983
Sediment load4680.0001Downward1984
Table 2. Results of San’s slope (β) analysis using the Mann–Kendall (MK) test for time-series of 1961–2007, 1961–1984 (before change-point), and 1985–2007 (after change-point).
ParametersPeriod 1961–2007Period 1961–1984Period 1985–2007
βββ
Pmm/yr−0.01−0.451.17
Q avm3/s/yr−0.77−0.081.08
Q maxm3/s/yr−2.97−3.022.56
SSC avg/L/yr−0.0144−0.0287−0.0063
SSC maxg/L/yr−0.0396−0.0697−0.0205
Qs103 t/yr−84.7−113.1−13.9
Qs av103 t/yr−7.1−9.4−1.2
Qs max103 t/yr−27.9−30.2−8.5
Table 3. Linear regression Equation (1): Cumulative water discharge (Q) and cumulative precipitation (P) for period before transition years (ΣQ, cumulative water discharge; ΣP, cumulative precipitation; Q1, extrapolated cumulative water discharge until 2007; Q2, observed cumulative water discharge until 2007). Linear regression Equation (2): Cumulative suspended sediment load (Qs) and cumulative precipitation (P) for period before transition years (ΣQs, cumulative suspended sediment load; ΣP, cumulative precipitation; Qs1, extrapolated cumulative suspended sediment load until 2007; Qs2, observed cumulative suspended sediment load until 2007).
Water Discharge/PrecipitationSediment Load/Precipitation
Regression Equation (1)ΣQ = 0.1464 ΣP + 49.041 (R2 = 0.99)Regression Equation (2)ΣQs = 4.7943 ΣP + 12,398 (R2 = 0.98)
Q1 (m3/s)4608Qs1 (103 t)161,677
Q2 (m3/s)4240Qs2 (103 t)112,483
Q1 − Q2 (m3/s)368Qs1 − Qs2 (103 t)49,194
(Q1 − Q2) × 100/Q1 (%)8(Qs1 − Qs2) × 100/Qs1 (%)30
Table 4. The impacts of precipitation and human activities on change of annual sediment load (Qso, observed annual average suspended sediment load; Qsc, calculated annual average suspended sediment load; ΔQs, change in observed sediment load between period before change year and after change year).
PeriodQso (103 t)Qsc (103 t)ΔQs (103 t)Impact of PrecipitationHuman Impact
ΔQsprecipitation (103 t)ΔQshuman (103 t)
Before 19843650
After 1984117233892408 (66%)261 (11%)2147 (89%)
Table 5. Sediment rating parameters for SSC and Qs for decade periods.
PeriodSSCQs
abR2abR2
1961–19700.07210.52040.271.57351.71450.91
1971–19800.15120.23110.022.50111.49640.72
1981–19900.02780.57040.170.35601.92430.49
1991–20000.00950.71330.710.33801.79680.94
2001–20070.00360.88620.990.44181.69570.91
Table 6. Correlations between anthropogenic indicators and sedimentary parameters. Multiple regressions coefficient correlations (r) significant at p < 0.05. Parameters based on decade period data. P, rural population; AgL, agriculture land; ArL, arable land; SSCav, average annual suspended sediment concentration; SSCmax, maximum suspended sediment concentration; Qsav, average annual suspended sediment load; Qsmax, maximum suspended sediment load.
PAgLArLSSCavSSCmaxQsavQsmax
P1
AgL0.9621
ArL0.9720.9921
SSCav0.9480.9720.9851
SSCmax0.9580.9710.9780.9961
Qsav0.9610.9600.9840.9940.9871
Qsmax0.9580.9550.9720.9940.9970.9931
Publisher’s Note: MDPI stays neutral with regard to jurisdictional claims in published maps and institutional affiliations.

