Article

Photovoltaic and Thermoelectric Generator Combined Hybrid Energy System with an Enhanced Maximum Power Point Tracking Technique for Higher Energy Conversion Efficiency

Electrical Engineering Department, College of Engineering, Prince Sattam Bin Abdulaziz University, Wadi Aldawasir 11991, Saudi Arabia
Sustainability 2021, 13(6), 3144; https://doi.org/10.3390/su13063144
Submission received: 9 January 2021 / Revised: 28 February 2021 / Accepted: 8 March 2021 / Published: 12 March 2021
(This article belongs to the Special Issue Energy System Sustainability)

Abstract

:
In this paper, the design and performance investigation of the hybrid photovoltaic–thermoelectric generator (PV–TEG) system with an enhanced fractional order fuzzy logic controller (FOFLC)-based maximum power point tracking (MPPT) technique is presented. A control strategy of the variable incremental conduction (INC) method is employed using FOFLC for the MPPT control technique to efficiently harvest the maximum power from the PV module. The fractional factor α used in the MPPT control algorithm is a supporting fuzzy logic controller (FLC) for the accurate tracking of the maximum power point (MPP) and to maintain the constant output after reaching the MPP. In the proposed system configuration, the TEG is mounted with the PV panel for generating the extra electrical power using the waste heat energy produced on the PV panel due to the incident solar irradiation. The PV and TEG are connected electrically in series to increase output voltage level and thereby improve the power output. The hybrid energy module has better energy conversion efficiency when compared to the standalone PV array. The performance of the proposed MPPT technique is studied for the PV–TEG hybrid energy module under various thermal and electrical operating conditions using a MATLAB software-based simulation. The results of the FOFLC-based MPPT technique are compared with the conventional perturb and observe (P&O) and FLC-based P&O methods. The proposed MPPT technique confirms its effectiveness in extracting the maximum power in terms of speed and accuracy. Moreover, the PV and TEG combined system provides higher energy efficiency than the individual PV module.

1. Introduction

The electric power generation around the world is changing towards the environmentally friendly because the use of conventional source-based power generation causes more environmental issues, such as the emission of greenhouse gases, global warming, and air pollution. Therefore, the use of renewable energy sources becomes essential to minimize the damages to the environmental and to protect human health. Among the various renewable energy sources, solar energy-based electricity generation has attracted more attention recently due to its merits, such as being freely available everywhere, a clean-green energy, inexhaustible and lower maintenance because it has no mechanical rotational parts. However, the photovoltaic (PV) cells utilize only a partial amount of the incident irradiation of the solar for electricity, and a large amount of solar energy is converted into heat, which is considered as waste [1]. The waste heat due to solar irradiation will increase the PV cell temperature above the ambient level, which causes the power conversion efficiency of the PV cells to reduce at a considerable level [2]. Therefore, the cooling mechanism is sometimes necessary for the PV system [3]. As an alternative to the cooling mechanism, the thermoelectric generator (TEG) with heat sinks arrangements can be mounted at the backside of the PV panel, which helps to convert the freely available thermal energy into useful electricity. The PV combined TEG hybrid module provides a promising solution for solar thermal energy waste, and it supports the improvement of the overall system power conversion efficiency [1,4].
The practical TEG is usually fabricated with several thermoelectric elements (TEs) (i.e., thermocouples), which are operates based on the Seebeck effect [5,6]. The thermocouples are usually connected in series in a TEG to produce an adequate level of voltage output. Generally, the TEs are mounted between two dielectric ceramic plates for better thermal conductance; one of these plate surfaces is maintained with a low temperature called cold side and another plate with a high temperature named hot side. The TEG can also be used to convert the waste heat energy available freely in various industrial processes and automobile engines, etc. [7,8,9]. The uses of TEGs were not progressive in the past due to the low-efficiency factor. However, the TEGs are selected to generate electricity from low-grate freely available waste heat where the input to these devices is costless and, therefore, the efficiency is not a major issue [10]. The energy conversion efficiency of TEGs is usually around 5–10% [11]; the efficiency level can be improved by enhancing the electrical and/or thermal performance of the TEs.
Recent research studies have confirmed that the TEG can be used for improving the power conversion efficiency of the PV array by making use of the waste heat produced around the PV array due to the incident solar irradiation. For example, the study results in [12] confirmed that the PV and TEG combined hybrid energy system with different structures provides higher power output, better efficiency and reduced waste heat. The assessment conducted in [3] based on the commercial data proved that the PV–TEG module will improve the system performance compared to the individual PV array. The experimental study on the PV–TEG system in [13] for water pumping applications confirmed that the pump flow rate and motor power output were improved. An unconcentrated hybrid system using PV–TEG was suggested by [14] for agriculture indoor farming. It is demonstrated that the TEG can change the PV module efficiency in the combined PV–TEG system. The hybrid system module proposed by [15] for energy enhancement proved that the PV and TEG combined system output power was maximized under different operating conditions. In addition, the MPPT control technique also has a major role in improving the power conversion efficiency of hybrid renewable energy systems. MPPT control techniques are generally employed in renewable energy source-based electric power generation to extract the possible maximum power from the source and thereby improve energy efficiency; the quick and accurate achievement of the MPP will help to minimize the power loses in the system. Different types of MPP tracking methods have been recommended for various applications in the literature, for example, the incremental conductance method [16], the hill climbing (HC) technique [17], P&O method [18,19], artificial neural network [20], fuzzy logic control technique [21], fractional open-circuit voltage technique [22], linear extrapolation-based MPPT algorithm [23] and variation-tolerant MPPT technique [24].
In this paper, the fractional order fuzzy logic controller (FOFLC)-based variable incremental conduction MPPT control technique is proposed for extracting the maximum power from the PV module of the hybrid energy module. The proposed MPPT technique is developed to overcome the limitations of conventional techniques, such as slow tracking and fluctuating output around MPP. In this control technique, the FLC uses a variable tracking step size for quickly achieving the MPP based on the PV operating point in the power versus current (P–I) curve; the larger tracking step size is applied when the PV operating point is not close to the MPP. Suppose the operating point of the PV is approaching the MPP, then a smaller step size will be used to avoid oscillation in the output. In the system configuration, the TEG arranged on the rear side of the PV panel will utilize the waste heat energy for producing extra electricity. To generate sufficient voltage and output power, the PV and TEG are connected electrically in series, and thereby the overall energy conversion efficiency of the system is improved. The performance of the proposed system is investigated under steady-state and transient thermal conditions. The results of the proposed MPPT technique are compared with the classical P&O and FLC-based P&O MPPT techniques.

2. Modeling and Analysis of the PV and TEG

2.1. The PV Cell Modeling

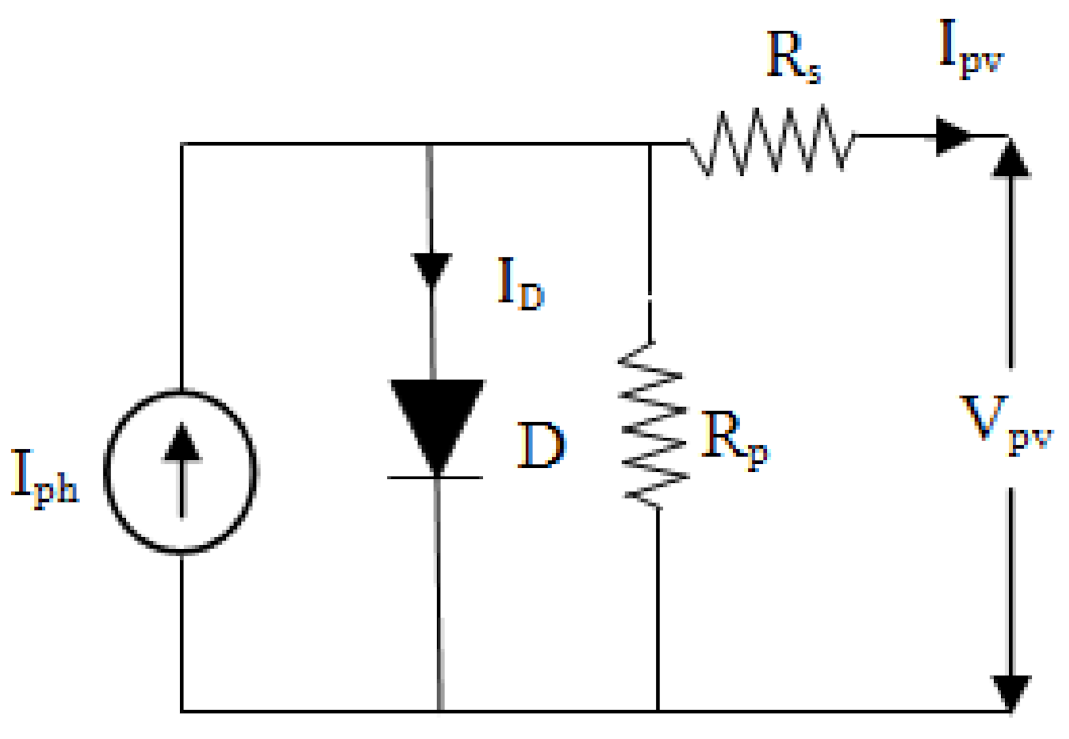
The equivalent circuit of the PV model is represented with a current source, diode and resistor combination, as shown in Figure 1. The current flowing out of a PV cell can be expressed as
I pv = I ph I D
where ID is the diode current in A, and Iph is the photocurrent in A. The PV module is usually produced with series and parallel connected solar cells. The above Equation (1) is rewritten as
I pv = N p I ph N p I sat exp q kTn V pv N s 1
where Isat represents the reverse saturation current in A; Vpv denotes output voltage in V; q denotes the charge of an electron in C; k denotes the Boltzmann constant (1.3806 × 10⁻²³ JK−1); T denotes the cell temperature in K; Np and Ns denote the number of the parallel and series-connected PV cells, respectively; and n denotes the diode ideality factor. The Isat is sensitive to the T, which is expressed as
I sat = I rev T T ref 3 exp qe kn 1 T ref 1 T
I ph = I s + k s T T ref G 1000
where Tref denotes the standard temperature (300 K) in K, Is denotes the short-circuit current in A at standard temperature, Irev denotes reverse saturation current in A at standard temperature, e denotes energy in energy gap, ks denotes temperature coefficient in %/K of Is and G denotes the irradiation in w/m2.
The PV module efficiency was determined using the ratio of the power output to the area of PV panel absorbing solar irradiation [25]; it is expressed as
η PV = P pv G × A P
where Ppv denotes the PV module output power in w and AP denotes the area of cross-section of the PV panel in m2.
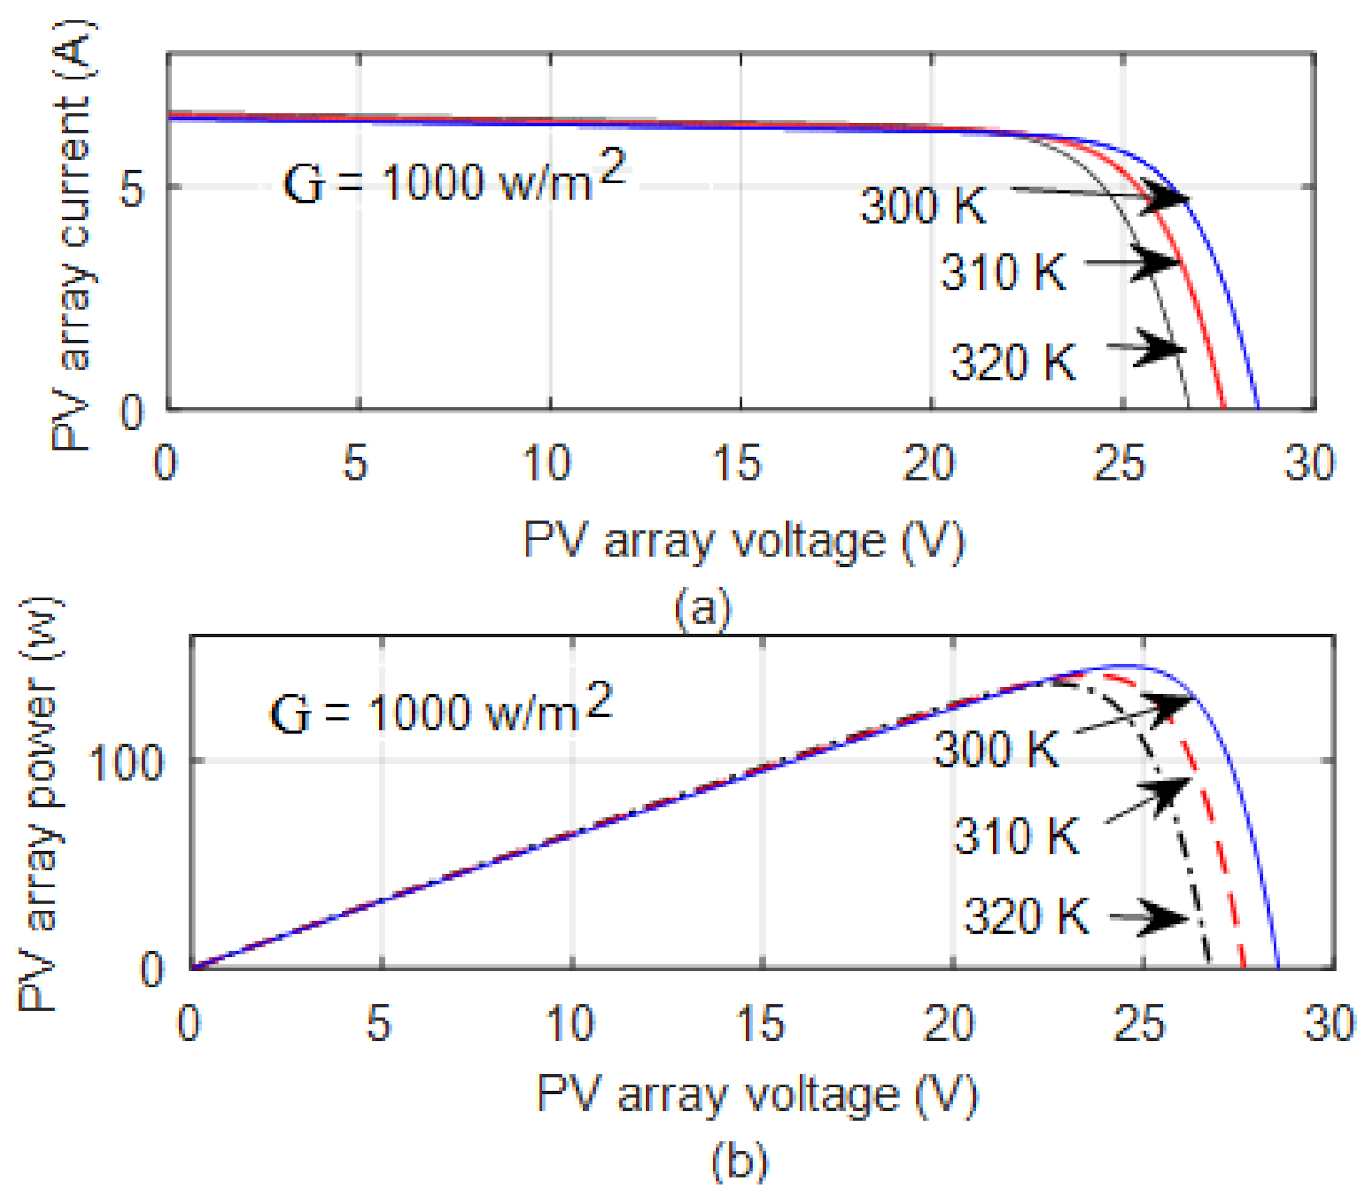
The PV model was developed using MATLAB software based on the aforementioned theoretical background; the design parameters of the PV model are shown in Table 1. The designed model validation was conducted by verifying the PV cell output characteristics, namely, power versus voltage (P–V) and voltage versus current (I–V). The characteristics of the designed PV model for the different temperatures with assumed solar irradiation of 1000 w/m2 were plotted as shown in Figure 2a,b. The accuracy of the designed PV model was confirmed by comparing its output with the manufacture datasheet; the percentage of deviation is within 2%, as shown in Table 2.

2.2. Modeling of the TEG

Thermoelectric generators are usually constructed with series-connected TEs; a typical structure of the TEG is shown in Figure 3. Figure 4 shows the electrical equivalent circuit of the TEG; the voltage induced in a TEG based on the Seebeck effect is given as
E teg = S T H T C = S Δ T
where S is the Seebeck coefficient in V/K, TH is the hot-end temperature in K and TC denotes the cold-end temperature in K. The Seebeck coefficient can be determined from the following expression
S = N t s p s n
where Nt denotes the number of thermocouples; sp and sn denote the Seebeck coefficients for p-type and n-type TE, respectively. The voltage, current and power output of the TEG can be given as
V teg = s p s n × T H T C × R L R L R int × N t
I = s p s n × T H T C R L + R int
P teg = R L × s p s n 2 × T H T C 2 R L R int 2 × N t
where RL denotes the load resistance in Ω, and Rint is the TEG internal resistance in Ω. The internal resistance of the TEG can be calculated from the following expression
R int = L σ A t + 2 L C σ C A C
where σ is the electrical conductive of thermocouple in S/m, σC is the electrical conductive of the copper strip, At is the area of cross-section of TE in m2, AC is the area of cross-section of the copper strip in m2, L is the thermocouple length in m and LC is the length of copper strip in m.
In this energy conversion process, the TEG collects heat flux at the hot end and releases the heat flux at the cold end. During the energy conversion, the Seebeck effect plus two more effects also take place in the TEG, the Peltier effect causing heat due to the current flow and the Thomson effect causing heat because of the temperature difference between two ends of the TEG and current flow. However, the Thomson effect is ignored because of its low impact on the output; the TEG energy equation is expressed as [1]
Q teg = q H q C  
where qH and qC are the energy at hot and cold ends of the TEG, respectively, which are expressed as
q H = SIT H 1 2 σ I 2 k t T H T C
q C = SIT C + 1 2 σ I 2 + k t T H T C
where kt is the thermal conductance of the TEG (w/K); the terms SITH and SITC represent the heat flux at hot and cold ends of the TEG, respectively. The model of the TEG was developed using the thermal and electrical properties of the thermocouple; the familiar bismuth telluride Bi2Te3-type thermocouple was chosen in the present study. The areas and lengths of p-type TE and n-type TE were assumed to be equal. The temperature-dependent parameters of the Bi2Te3 thermocouple were considered from the datasheet and Qing et al. [26]. The design parameters of the Bi2Te3 thermocouple for the reference temperature of 300 K are shown in Table 3. The performance of the TEG is usually determined using the figure-of-merit, which is expressed as
ZT = S 2 σ K t T
Similarly, the efficiency of TEG was determined by the ratio of the power generated for the input thermal energy,
η teg = P teg q H .
Thermal properties of the p-type and n-type TEs were studied for the temperature range of 300 to 450 K, as shown in Figure 5. These characteristic graphs are closely matched with the results presented in [27] for the Bi2Te3 thermocouple. Similarly, the electrical properties of the TEG model were also tested against the temperature difference (ΔT) with an assumed total number of thermocouples (Nt) of 110. The voltage and power output of the TEG against the varying temperature difference of 0 to 50 K is shown in Figure 6a. From the result, one can understand that the open-circuit voltage (Eteg) of the TEG varies linearly with ΔT and satisfies Equation (6). Additionally, the output voltage (Vteg) is exactly half of the Eteg voltage for the chosen load resistance; RL is equal to the internal resistance (Rint) of the TEG. According to the theory of maximum power transfer theorem, the load will receive the maximum power when the RL is equal to Rint and the load voltage (Vteg) is half of the source voltage (Eteg). The proposed TEG model confirmed its electrical performance by satisfying the maximum power transfer theorem. The power output of the TEG is directly dependent on ΔT between the sides (cold and hot) and the connected load at the output side. The maximum power output of the TEG was achieved by maintaining an equal load resistance value to its internal resistance of the TEG. The power output (Pteg) generated versus that shown in Figure 6a confirms that the TEG output power varies based on the temperature difference between the cold and hot ends. The voltage versus current (V-I) characteristic of the designed model is demonstrated for the different ΔT values of the TEG in Figure 6b. From the results, it was observed that the voltage output (Vteg) of the TEG is dependent on the temperature difference across the two junctions and confirms Equation (9). For the given Seebeck coefficient, the high ΔT increased the TEG output voltage.

3. The Hybrid PV–TEG Energy Module

3.1. Integration of PV with TEG

The hybrid PV–TEG energy module is proposed to convert the maximum irradiation coming from the sun into electricity. Generally, the PV cells utilize only a partial amount of incident solar irradiation for generating useful electricity, and the larger amount of irradiation is converted into waste heat energy. Further, the waste heat energy produced on the PV panel increases the cell temperature, which leads to a decrease in the energy efficiency of the PV system. In the proposed system, the TEG with heat sinks is arranged in order to make use of the waste heat energy for extra power generation and to reduce the PV cell temperature. A typical structure of the PV and TEG combined hybrid module is depicted in Figure 7. One of the surfaces of the TEG is mounted on the backside; PV array represents the hot side; the heat sinks are arranged on another surface of the TEG called the cold side. The purpose of the heat sink arrangement is to maintain a reasonable level of temperature difference between the cold and hot sides of the TEG. Additionally, the heat sinks arrangement also helps to reduce the ambient temperature of the PV cells, by which better energy conversion efficiency could be achieved. The overall PV–TEG hybrid system power conversion efficiency is expressed as follows:
η PV TEG = P pv + P TEG / G × A P
In the hybrid structure, the PV arrays and TEG can be arranged either in parallel or series; the parallel connection needs additional power electronic switches, which lead to more power losses. Alternately, the serial connected PV and TEG have a minimum number of power electronic switches and minimum power losses.
The performance study of the PV and TEG integrated energy module was conducted under standard test conditions. In the proposed system configuration, the total efficiency is only the electrical efficiency since we are not harvesting heat energy for utilization. The energy conversion efficiency of the PV system mainly depends on the ratio of electric power generated to the amount of solar input energy per unit area. The electrical energy conversion efficiency of TEG is based on the input thermal energy at the hot end to the amount of thermal energy emitted at the cold end. In this hybrid structure, the TEG input is the ceramic absorber plate temperature, and the electrical energy generated by the TEG is the output.

3.2. Performance Analysis of PV–TEG

The feasibility of the hybrid energy module for improving the electrical energy generation from solar energy was confirmed by comparing the performance of the standalone PV with that of the hybrid PV–TEG system. The performance comparison was conducted for the assumed solar irradiation of 1000 w/m2, PV temperature of 310 K and temperature difference of 20 K across the TEG. The comparison result is shown in Figure 8; it was observed that the PV and TEG combined system produced better power output than the standalone PV module. Since the hybrid energy system converted a larger amount of solar irradiation into electricity, better power output was achieved. Similarly, the energy conversion efficiency of the PV and hybrid PV–TEG was also studied based on Equations (5) and (17), which was compared with the theoretical efficiency of the PV array for the assumed irradiation of 1000 w/m2, as shown in Figure 9. Since the power contribution by the TEG was also at a considerable level, the efficiency of the hybrid PV–TEG module was at a reasonably higher level when compared to the standalone PV module. Additionally, the theoretical and study module efficiency comparison for the PV system did not show a significant difference, which reflects the effectiveness of the designed system. The comparison result evidently proved that the hybrid PV–TEG system has a higher efficiency, of about 4.5%, than the standalone PV system.

4. The Proposed FOFLC-Based MPPT Control Technique

MPP tracking techniques are employed for the renewable energy system to harvest the possible maximum power from the source and thereby increase the energy conversion efficiency. In the current study, the MPP tracking technique was employed for the PV array of the hybrid PV–TEG combined energy module; the reason for this choice is explained in the next section. The variable tracking step size was achieved in the proposed MPPT technique by expanding or contracting the universe of discourse (i.e., domain range) of the input fuzzy variable; the universe of discourse of the fuzzy input was changed dynamically using the fractional factor α. The change in the universe of discourse facilitated the achievement of the variable tracking step size and thereby the quick harvesting of the maximum power from the PV array. For example, if the operating point of the PV is not closer to the peak point in the P–I curve, then the FLC will use a larger step size to quickly attain the peak point. If the operating point of the PV is approaching the peak point, then the FLC will use a smaller step size to produce steady-state output without any oscillations. The value for the factor α was assigned between 0 and 1 based on the change in current (ΔI = Ipv − Ipv(t − 1)) of the PV array. The idea of using the fractional factor originated from the fractional order differentiator, the recent control strategy used in various control applications, such as adaptive control, signal processing, active control, linear and nonlinear feedback control. Based on the definition of Riemann–Liouville and Grunwald–Letnikov, the general fractional order differentiator is given as [16]
D t α t n = γ n + 1 γ n + 1 α t n α
where γ denotes function, and α denotes the order of the derivative in the range of 0 < α ≤ 1. When α is 0 < α < 1, then the control scheme will be a fractional order control. Otherwise, if α = 1, the control scheme becomes a conventional integer order control. Therefore, the fractional factor α can be applied in the conventional MPP tracking scheme to enhance the controller performance. The concept of the fractional order control scheme has been successfully used for different applications in recent years [28,29,30,31].
The drawback of the conventional INC tracking technique is that the output fluctuates around the MPP, which leads to power losses and a reduction in power conversion efficiency. Hence, the fractional factor combined FLC-based INC method is proposed in this paper to overcome the drawbacks of the conventional INC. In the conventional INC method, the MPP is achieved by meeting any one of the following conditions
dP pv dI pv = 0  
dI pv dV pv I pv I pv t 1 V pv V pv t 1 = I pv V pv
where Ipv and Ppv are the present value of the current and power from the PV array; Ppv(t-1) and Ipv(t−1) are the previous instant value of the current and power from the PV array; dPpv and dIpv are the variations in the power and current at a unit time, respectively. Using the fractional order differentiator of (18), the conventional INC expression (19) can be modified as
d α P pv dI pv α = lim I 0 P pv α P pv t 1 I pv I pv t 1 α
d α P pv dI pv α P pv α P pv t 1 I pv I pv t 1 α
The fractional factor α will change the power and current variation of (22); this expression represents the reasonable approximation in fractional order calculus. If α = 1, then (18) will be a general first derivative; suppose 0 < α < 1, then it can be considered as the fractional order differentiator. Therefore, the fractional order incremental changes of the power and current of the PV module are approximated as [16]
d α P pv P pv α P pv t 1
dI pv α I pv I pv t 1 α
In the fuzzy logic system, the inputs are converted into suitable linguistic values to develop the control rules. The two inputs of the classical FLC are defined as
e t = P pv P pv t 1 I pv I pv t 1
P t = P pv P pv t 1
Therefore, for the FOFLC (25) could be modified by including the fractional order factor α
e t = P pv α P pv t 1 I pv I pv t 1 α
The error (27) and change in power (26) are the two inputs of the FOFLC. The term α is assigned with a value between 0 and 1 using the change in current (ΔI) of the PV array. Suppose ΔI is zero, then α is set to 1, which confirms that the MPP is achieved. Otherwise, if ΔI is not equal to zero, then α will be 0 < α < 1, which indicates that the MPP is not achieved. According to Equation (27), the fuzzy input variable e(t) will be modified based on α. Therefore, the smaller α will increase the step size to reduce the time required to reach the MPP. When the operating point approaches the peak level in the P–I curve, then α will be large (i.e., nearly about 1), then the controller keeps a smaller tracking step size to avoid oscillation. The proposed MPP tracking algorithm is demonstrated through the flow chart, as shown in Figure 10.

5. Implementation of the Proposed System

5.1. The Hybrid PV–TEG System

The schematic of the proposed PV–TEG hybrid system is shown in Figure 11. The PV array and TEG power ratings were chosen based on the power requirement of the load. Generally, in the hybrid energy system, the MPPT control technique is applied for any one of the energy modules which contributes more power to the load [13]. In the current study, the PV array was chosen for implementing the MPPT control by considering its maximum power contribution from the total output power. A continuous current mode DC-DC converter circuit was used to boost the PV array output. The DC-DC converter design was conducted based on the procedure in [32]. The duty cycle for the converter circuit is the significant factor to extract the possible maximum power under different operating conditions. Referring to Figure 11, when the MOSFET switch is ON, the diode D1 is reverse biased, and the energy will be stored in the inductor L using the PV array output during the Toff period. If the MOSFET switch is OFF, the energy available in the inductor will make the current flow to the load via diode D1 for a period Ton. The changes in the duty cycle will modify the output current and voltage. The duty ratio (D) is given by
D = T on T on + T off
A lead-acid battery is also included with charge control switches in the proposed system; the battery specifications are shown in Table 4.

5.2. Implementation of the FOFLC-Based MPPT Algorithm

In the proposed MPPT control algorithm, the FLC uses two inputs, namely, error e(t) and change in power ΔP(t), defined in (27) and (26), respectively, to generate the output u(t) using the pre-defined fuzzy control rules. The magnitude of the error input was used to identify the present operating point of the PV array in the P–I curve, for example, the positive e(t) confirms that the PV operating point is at the left side of the P–I curve. Suppose e(t) is negative, then the operating point is on the right side of the MPP on the P–I curve. If the MPP is achieved, then e(t) is zero. Therefore, the controller uses e(t) to generate the necessary control action to move the operating point towards the MPP; the justification from the error signal is summarized as follows:
e t   ve ;   right side   the   MPP = 0 ;   at   the   MPP +   ve ;   left side   the   MPP .
Similarly, the input of change in the power ΔP(t) sign points out the movement of the operating point of the PV module in the P–I curve. If e(t) and ΔP(t) inputs are positive, this confirms that the present position of the PV operating point is on the left side, and it is moving towards the MPP in the P–I curve. Hence, there is no need to change the parameters of the PV array to attain MPPT. Alternately, if e(t) and ΔP(t) inputs are negative, this confirms that the present position of the PV operating point is on the right side of the peak level in the P–I curve, and it is moving away from the MPP. So, the PV current has to be decreased. Thus, the controller will take appropriate control action using the e(t) and ΔP(t) input signals to quickly achieve the MPP; the summary of the control action is illustrated in Table 5.
For the FOFLC design, the triangular-type fuzzy membership functions (MFs) were selected for the inputs and output variables. The fuzzy MFs are represented with linguistic terms; the input MFs are PH: Positive High; PL: Positive Low; ZE: Zero; NL: Negative Low; NH: Negative High. Similarly, the output MFs are VL: Very Low; LW: Low; ME: Medium; HG: High; VH: Very High. The shapes of the fuzzy MFs used in the present study are depicted in Figure 12. The control rules for the FOFLC-based MPPT algorithm were developed using the control strategy explained previously, for example, if the error e(t) is negative (i.e., NL or NH), then the output u(t) is small in magnitude to attain the MPP by decreasing the PV array current. Additionally, if the error e(t) is positive (i.e., PH or PL), then the output u(t) is at the maximum to attain the MPP by increasing the PV array current. Likewise, 25 fuzzy control rules were designed for the present study, which are depicted in Table 6. The FLC input and output relationship is represented with a surface view in Figure 13.

6. Analysis of Results and Discussion

The performance investigation of the proposed FOFLC-based MPPT control technique for the hybrid PV–TEG module was conducted using a simulation study. The study results were compared with the classical P&O and FLC-based P&O MPPT algorithms to confirm the advantages of the proposed MPP tracker.

6.1. Hybrid PV–TEG System without Battery Storage

The maximum power extracting ability of the MPPT techniques were investigated under different operating conditions for the proposed hybrid PV–TEG energy module. The power output from the system using FOFLC, P&O and FLC-based P&O MPPT algorithms for step-change in solar irradiation is depicted in Figure 14. The temperature of the PV array was kept at 310 K, and a temperature difference of 20 K was maintained between the hot and cold sides of the TEG during this investigation. From Figure 14a, the FOFLC-based MPPT technique exhibited improved performance in tracking the MPP of the PV array when compared to the P&O and FLC-based P&O techniques. It was also observed that the proposed MPPT technique accurately tracked the MPP within a short time using the variable tracking step size, which resulted in the system output power quickly reaching the maximum level. On other hand, in the conventional P&O method of MPPT, the system output had more oscillation and took a long time to attain the final maximum power level, particularly at the low irradiation level. However, the FLC-based P&O MPPT technique showed a moderate performance in extracting the maximum power with minimum oscillation and a lower time when compared to the conventional P&O method. Therefore, the variable tracking step size used in the proposed FOFLC-based MPPT control technique helps to quickly attain the maximum power output and maintain the stable output after reaching the maximum power level. However, the conventional P&O MPPT technique results are not sufficient for step-change in solar irradiation. The voltage and current flow during this study are shown in Figure 14b. From Figure 14b, it is noticed that the voltage and current parameters of the system using the conventional P&O-based MPPT scheme also had oscillation when compared to the other two techniques. Thus, the FOFLC-based MPP tracking method can extract the maximum power within a short time and maintains stable output around the MPP. The fast and accurate tracking of the MPP will reduce power losses and thereby improve the energy conversion efficiency of the system.
The performance of the different MPPT techniques for the step-change in input temperature was also verified with a constant irradiation level of 1000 w/m2; the study results of the FOFLC, conventional P&O and FLC-based MPP tracking schemes are depicted in Figure 15. The current and voltage outputs of three different MPPT methods for step-change in temperature are shown in Figure 15a; the result clearly demonstrates that the FOFLC-based MPPT technique promptly identified the temperature changes and modified the output accordingly when compared to the other MPPT techniques. The PV–TEG hybrid energy module output power corresponding to this study is illustrated in Figure 15b. From Figure 15b, it is noticed that the FOFLC-based MPP tracker outperformed in extracting the maximum power for step-change in temperature when compared to other techniques.
Additionally, the power harvesting from the PV–TEG hybrid energy module using the MPPT control methods was investigated for the continuous variation in solar irradiation level; the investigation results are shown in Figure 16. The results of this study confirmed that the proposed tracking algorithm can efficiently manage continuous changes in the solar irradiation using the fractional factor and brings the system output to the maximum level smoothly without any oscillation. Thus, the performance of the FOFLC-based maximum power extracting algorithm is comparatively better in identifying the variations in the environmental factors and applying the necessary control action to quickly bring the system output to a stable level.

6.2. Hybrid PV–TEG System with Added Battery Storage

The usefulness of the proposed PV–TEG hybrid module with FOFLC-based MPPT algorithm was demonstrated for the battery energy storage application. A lead-acid battery was added to the system for this study; the system performance was observed with three stages, namely, charging, fully charged and charging and discharging concurrently. The battery state of charge (SoC) during these three stages is depicted in Figure 17a; the related voltage and current flow to the battery and load are shown in Figure 17b. In order to observe the SoC clearly, the initial charge level of the battery was chosen as 99.98%. From Figure 17b, it is noticed that during the battery charging period, the battery current (IB) magnitude was negative since the battery takes the energy from the source. The battery voltage (VB) level increased gradually during the charging time; once the voltage VB reached the maximum level (i.e., SoC is 100%), the IB current became zero. In the second stage, the SoC was at 100%, and the current IB was zero in this period. To verify the PV–TEG hybrid system power output during the battery discharging conditions, a resistive load was connected across the battery, and the battery was allowed to charge as well as deliver power to the load concurrently. Since the battery receives power continuously from the source, the SoC and VB levels decreased to a relatively small value and the current IB flow was also quite low. The load current (IL) and voltage (VL) during this period are shown in Figure 17b. The main purpose of this study is to confirm the level of the power output from the source during these three operation stages. Figure 17c shows the output power from the PV–TEG hybrid system; it was noticed that in all three stages, the system output power was almost constant and equal to the maximum power output level. The proposed FOFLC-based MPP tracker correctly adjusts the duty cycle of the DC-DC converter circuit to maintain the maximum power output from the system even for load variations.

7. Conclusions

A novel FOFLC-based MPP tracking technique for the hybrid PV–TEG renewable energy system was proposed. The variable INC method of MPPT control was employed using the FOFLC for fast and accurate tracking and minimizing the power losses. The model of the PV and TEG was developed using the theoretical background; the series-connected PV and TEG energy module was used for investigating the proposed MPPT control scheme. The results of the investigation confirmed that the hybrid energy system with the proposed FOFLC-based MPP tracking technique can harvest the maximum power output under varying environmental conditions. Moreover, the MPP tracking ability of the proposed MPPT control technique was compared with the conventional P&O and FLC-based P&O tracking techniques; the comparison results proved that the proposed control technique has better performance in terms of speed and accuracy. The fast-tracking and stable output capability of the proposed MPPT technique can reduce the power losses of the hybrid PV–TEG module, particularly when the system undergoes frequent changes in the solar irradiation. The effectiveness of the proposed hybrid energy system was also studied for the battery energy storage application; the results proved that the proposed system was always able to supply a constant and enough power output even for the load variations. Moreover, the study results of the hybrid PV and TEG integrated energy system showed better output power and improved electrical efficiency of about 4.5% higher than that of the standalone PV system.

Funding

This research received no external funding.

Institutional Review Board Statement

Not applicable.

Informed Consent Statement

Not applicable.

Conflicts of Interest

The author declare no conflict of interest.

References

  1. Babu, C.; Ponnambalam, P. The theoretical performance evaluation of hybrid PV-TEG system. Energy Convers. Manag. 2018, 173, 450–460. [Google Scholar] [CrossRef]
  2. Attivissimo, F.; Di Nisio, A.; Lanzolla, A.M.L.; Paul, M. Feasibility of a photovoltaic thermoelectric generator: Performance analysis and simulation results. IEEE Trans. Instrum. Meas. 2015, 64, 1158–1169. [Google Scholar] [CrossRef] [Green Version]
  3. Hasanuzzaman, M.; Malek, A.B.M.A.; Islam, M.M.; Pandey, A.K.; Rahim, N.A. Global advancement of cooling technologies for PV systems: A review. Sol. Energy 2016, 137, 25–45. [Google Scholar] [CrossRef]
  4. Ahmet, S.; Kehinde, I.; Bekir, Y.; Abdullah, S. A review on the performance of photovoltaic/thermoelectric hybrid generators. Int. J. Energy Res. 2020, 44, 3365–3394. [Google Scholar]
  5. Meng, J.H.; Zhang, X.X.; Wang, X.D. Characteristics analysis and parametric study of a thermoelectric generator by considering variable material properties and heat losses. Int. J. Heat Mass Transf. 2015, 80, 227–235. [Google Scholar] [CrossRef]
  6. Laird, I.; Lu, D. High step-up DC/DC topology and MPPT algorithm for use with a thermoelectric generator. IEEE Trans. Power Electron. 2013, 28, 3147–3157. [Google Scholar] [CrossRef]
  7. Hsiao, Y.Y.; Chang, W.C.; Chen, S.L. A Mathematic Model of Thermoelectric Module with Applications on Waste Heat Recovery from Automobile Engine. Energy 2010, 35, 1447–1454. [Google Scholar] [CrossRef]
  8. McEnaney, K.; Kraemer, D.; Ren, Z.; Chen, G. Modeling of Concentrating Solar Thermoelectric Generators. J. Appl. Phys. 2011, 110, 074502. [Google Scholar] [CrossRef]
  9. Kumar, S.; Heister, S.D.; Xu, X.; Salvador, J.R.; Meisenr, G.P. Thermoelectric generators for automotive waste heat recovery systems. Part I: Numerical modeling and baseline model analysis. J. Electron. Mater. 2013, 42, 665–674. [Google Scholar] [CrossRef]
  10. Wang, P.; Wang, B.L.; Li, J.E. Temperature and performance modeling of thermoelectric generators. Int. J. Heat Mass Transf. 2019, 143, 1145–1153. [Google Scholar] [CrossRef]
  11. Kanagaraj, N.; Rezk, H.; Gomaa Behiri, M.R. A variable fractional order fuzzy logic control based MPPT technique for improving energy conversion efficiency of thermoelectric power generator. Energies 2020, 13, 4531. [Google Scholar] [CrossRef]
  12. Lin, J.; Liao, T.; Lin, B. Performance analysis and load matching of a photovoltaic-thermoelectric hybrid system. Energy Convers. Manag. 2015, 105, 891–899. [Google Scholar] [CrossRef]
  13. Ibrahim, N.M.; Rezk, H.; Dahifallah, M.A.; Sergeant, P. Hybrid photovoltaic-thermoelectric generator powered synchronous reluctance motor for pumping applications. IEEE Access 2019, 7, 146979–146988. [Google Scholar] [CrossRef]
  14. Mohd Shatar, N.; Abdul Rahman, M.A.; Muhtazaruddin, M.N.; Shaikh Salim, S.A.Z.; Singh, B.; Muhammad-Sukki, F.; Bani, N.A.; Saudi, A.S.M.; Ardila-Rey, J.A. Performance evaluation of unconcentrated photovoltaic-thermoelectric generator hybrid system under tropical climate. Sustainability 2019, 11, 6192. [Google Scholar] [CrossRef] [Green Version]
  15. Verma, V.; Kane, A.; Singh, B. Complementary performance enhancement of PV energy system through thermoelectric generation. Renew. Sustain. Energy Rev. 2016, 58, 1017–1026. [Google Scholar] [CrossRef]
  16. Lin, C.H.; Huang, C.H.; Du, Y.C.; Chen, J.L. Maximum photovoltaic power tracking for the PV array using the fractional-order incremental conductance method. Appl. Energy 2011, 88, 4840–4847. [Google Scholar] [CrossRef]
  17. Nzoundja, F.C.B.; Patrice, W.; Martin, K.; Abderrezak, B.; Hyacinthe, T. Real-time experimental assessment of hill climbing algorithm enhanced by estimating a duty cycle for PV system. Int. J. Renew. Energy Res. 2019, 9, 1180–1189. [Google Scholar]
  18. Fuqiang, C.; Yu, G.; Xiaohong, G.; Xian, Y.; Liangwei, F.; Lin, S.; Xing, H.; Kun, Z.Z.; Chao, W.; Weitao, Z. Fabrication of nanostructured skutterudite-based thermoelectric module and design of a maximum power point tracking system for the thermoelectric pile. IEEE Sens. J. 2019, 19, 5885–5894. [Google Scholar]
  19. Subudhi, B.; Pradhan, R. A comparative study on maximum power point tracking techniques for photovoltaic power systems. IEEE Trans. Sustain. Energy 2013, 4, 89–98. [Google Scholar] [CrossRef]
  20. Serhat, D.; Nuran, Y.; Ismail, A. A novel MPPT algorithm based on optimized artificial neural network by using FPSOGSA for standalone photovoltaic energy systems. Neural Comput. Appl. 2018, 29, 257–278. [Google Scholar]
  21. Junaid, K.M.; Lini, M. Fuzzy logic controller-based MPPT for hybrid photo-voltaic/wind/fuel cell power system. Neural Comput. Appl. 2019, 31, 6331–6344. [Google Scholar]
  22. Montecucco, A.; Knox, A.R. Maximum power point tracking converter based on the open-circuit voltage method for thermoelectric generators. IEEE Trans. Power Electron. 2015, 30, 828–839. [Google Scholar] [CrossRef]
  23. Bijukumar, A.; Raam, A.G.K.; Ganesan, S.I.; Nagamani, C. A linear extrapolation-based MPPT algorithm for thermoelectric generators under dynamically varying temperature conditions. IEEE Trans. Energy Convers. 2018, 33, 1641–1649. [Google Scholar] [CrossRef]
  24. Kim, J.; Kim, C. A DC–DC boost converter with variation-tolerant MPPT technique and efficient ZCS circuit for thermoelectric energy harvesting applications. IEEE Trans. Power Electron. 2012, 28, 3827–3833. [Google Scholar] [CrossRef]
  25. Rezania, A.; Sera, D.; Rosendahl, L.A. Coupled thermal model of photovoltaic-thermoelectric hybrid panel for sample cities in Europe. Renew. Energy 2016, 99, 127–135. [Google Scholar] [CrossRef]
  26. Qing, S.; Rezania, A.; Rosendahl, L.A.; Gou, X. An analytical model for performance optimization of thermoelectric generator with temperature dependent materials. IEEE Access 2018, 6, 60852–60861. [Google Scholar] [CrossRef]
  27. Chen, M.; Rosendahl, L.A.; Condra, T. A three-dimensional numerical model of thermoelectric generators in fluid power systems. Int. J. Heat Mass Transf. 2011, 54, 345–355. [Google Scholar] [CrossRef]
  28. Kanagaraj, N. Design and performance evaluation of fuzzy variable fractional-order [PI]λDμ controller for a class of first-order delay-time systems. Stud. Inform. Control 2019, 28, 443–452. [Google Scholar] [CrossRef]
  29. Tang, S.; Sun, Y.; Chen, Y.; Zhao, Y.; Yang, Y.; Szeto, W. An enhanced MPPT method combining fractional-order and fuzzy logic control. IEEE J. Photovolt. 2017, 7, 640–650. [Google Scholar] [CrossRef]
  30. Yu, K.N.; Liao, C.K.; Yau, H.T. A new fractional-order based intelligent maximum power point tracking control algorithm for photovoltaic power systems. Int. J. Photoenergy 2015, 2015, 493452. [Google Scholar] [CrossRef]
  31. Ullah, N.; Nisar, F.; Alahmadi, A.A. Closed Loop Control of Photo Voltaic Emulator Using Fractional Calculus. IEEE Access 2020, 8, 28880–28887. [Google Scholar] [CrossRef]
  32. Rashid, M.H. Power Electronics Circuits, Devices and Applications, 2nd ed.; Prentice-Hall of India Private Ltd.: New Delhi, India, 2003. [Google Scholar]
Figure 1. The photovoltaic (PV) cell equivalent circuit.
Sustainability 13 03144 g001
Figure 2. The PV module characteristics: (a) I–V curve; (b) P–V curve.
Sustainability 13 03144 g002
Figure 3. The structure of a typical thermoelectric generator (TEG).
Sustainability 13 03144 g003
Figure 4. The TEG equivalent circuit.
Sustainability 13 03144 g004
Figure 5. Thermoelectric properties of p-type and n-type thermoelectric elements (TEs): (a) Seebeck coefficient; (b) thermal conductivity; (c) electric conductivity.
Sustainability 13 03144 g005
Figure 6. Electrical characteristics of the TEG: (a) voltage and power output; (b) voltage versus current.
Sustainability 13 03144 g006
Figure 7. Schematic of a typical hybrid PV–TEG structure.
Sustainability 13 03144 g007
Figure 8. The output power comparison.
Sustainability 13 03144 g008
Figure 9. The efficiency comparison.
Sustainability 13 03144 g009
Figure 10. Flow chart of the fractional order fuzzy logic controller (FOFLC)-based MPPT control algorithm.
Sustainability 13 03144 g010
Figure 11. The overall system implementation of the FOFLC-based hybrid PV–TEG module.
Sustainability 13 03144 g011
Figure 12. The input and output fuzzy sets: (a) input e(t); (b) input ΔP(t); (c) output u(t).
Sustainability 13 03144 g012
Figure 13. The fuzzy control rules surface view.
Sustainability 13 03144 g013
Figure 14. The hybrid system output for step-change in solar irradiation using different MPPT techniques: (a) output power; (b) output voltage and current.
Sustainability 13 03144 g014aSustainability 13 03144 g014b
Figure 15. System response for the step-change in temperature using different MPPT techniques: (a) output voltage and current (b) output power.
Sustainability 13 03144 g015aSustainability 13 03144 g015b
Figure 16. System power output for the continuous variation in solar irradiation.
Sustainability 13 03144 g016
Figure 17. System performance for the battery energy storage: (a) state of charge; (b) battery and load parameters; (c) system output power.
Sustainability 13 03144 g017aSustainability 13 03144 g017b
Table 1. The PV model design parameters.
SpecificationsValue (Unit)
Peak power voltage24.2 V
Peak power140 W
Peak power current5.8 A
Short Circuit Current6.5 A
Open circuit voltage29 V
Area of the solar panel1480 mm × 670 mm
Number of PV cells(2 × 4) 8
Table 2. Accuracy of the designed PV model.
ParametersPV SpecificationDesigned Model% of Deviation
Peak power voltage (Vmp)24.20 V23.98 V0.92
Peak power current (Imp)5.80 A5.76 A0.69
Maximum power (Pmax)140 w138.12 w1.36
Table 3. Design parameters of the TEG module.
SpecificationsValue
Length (L)1.6 mm
Area (A)1.4 mm2
Electrical conductivity p-type (σp)2.18 × 10⁵ S/m
Electrical conductivity n-type (σn)0.825 × 10⁵ S/m
Thermal conductivity p-type (kp)1.44 w/mK
Thermal conductivity n-type (kn)1.34 w/mK
Seebeck coefficient p-type (sp)383 µV/K
Seebeck coefficient n-type (sn)−634 µV/K
Total Number of thermocouples (Nt)110
Table 4. Battery specifications.
ParametersValue
Nominal voltage15 V
Fully charged voltage17.5 V
Rated capacity20 Ah
Internal resistance0.09 Ω
Table 5. Summary of the control strategy.
Error e(t)Change in Power ΔP(t)Control Action
PositivePositiveNo change
PositiveNegativeIncrease PV current
NegativePositiveNo change
NegativeNegativeDecrease PV current
Table 6. The fuzzy control rules.
u(t)e(t)
NHNLZEPLPH
ΔP(t)NHVLVLLWMELW
NLVLLWLWHGME
ZELWLWHGMEHG
PLMEMEHGVHVH
PHHGHGVHVHVH
Publisher’s Note: MDPI stays neutral with regard to jurisdictional claims in published maps and institutional affiliations.

