Article

Trade-Offs between Agricultural Production, GHG Emissions and Income in a Changing Climate, Technology, and Food Demand Scenario

by
Paresh B. Shirsath
* and
Pramod K. Aggarwal
CGIAR Research Program on Climate Change, Agriculture and Food Security (CCAFS), Borlaug Institute for South Asia (BISA), International Maize and Wheat Improvement Centre (CIMMYT), New Delhi 110012, India
*
Author to whom correspondence should be addressed.
Sustainability 2021, 13(6), 3190; https://doi.org/10.3390/su13063190
Submission received: 12 December 2020 / Revised: 5 March 2021 / Accepted: 5 March 2021 / Published: 15 March 2021
(This article belongs to the Special Issue Food Systems to Address Climate Challenges)

Abstract

:
Climate-smart agriculture targets integrated adaptation and mitigation strategies for delivering food security and greenhouse gas emissions reduction. This study outlines a methodology to identify the trade-offs between food production, emissions, and income under technology and food demand-shift scenario and climate change. The methodology uses Climate Smart Agricultural Prioritization (CSAP) toolkit a multi-objective land-use allocation model, and detailed databases, characterizing the agricultural production processes at the land-unit scale. A case study has also been demonstrated for Bihar, a state in India. The quantification of trade-offs demonstrates that under different technology growth pathways alone the food self-sufficiency for Bihar cannot be achieved whilst the reduction in emission intensity targets are achievable up to 2040. However, both food self-sufficiency and reduction in emission intensity can be achieved if we relax constraints on dietary demand and focus on kilo-calories maximization targets. The district-level analysis shows that food self-sufficiency and reduction in emission intensity targets can be achieved at a local scale through efficient crop-technology portfolios.

1. Introduction

Agriculture today feeds more than seven billion people, a feat made possible through increased yields over the last 50 years. However, the sector is faced with a growing set of new challenges like diet diversity because of increased urbanization as well as the uncertainty of crop production as a consequence of climate change. Even now, 820 million people are hungry, most of them happen to be in sub-Saharan Africa and South Asia and at the same time, agriculture and land-use changes are a major source of greenhouse gases (GHG) emissions [1]. To achieve zero hunger by 2030, the agriculture production process needs a transformation—from input intensification to sustainable intensification; from being vulnerable to adaptive and resilient with lower emissions of GHGs. Therefore, increasing food production in the coming decades must be done sustainably without compromising environmental integrity. To implement this transformation, a variety of innovations in the production technologies and policy decisions have been suggested by different organizations, institutes, researchers, policymakers etc. Climate-smart agriculture (CSA) is one such integrative approach to achieve food security and mitigate climate change impact with ecological sustainability [2]. CSA offers several solutions like water-smart, energy-smart, and carbon-smart interventions [3]. However, it becomes difficult to choose from the available set of interventions whenever a system has multiple objectives, either synergistic or antagonistic. Within CSA, choosing the appropriate decisions of investment, production technology or policy is often done through heuristics or expert judgments. Such decisions may lack quantification of foreseen impacts and tradeoffs. Few studies such as the green revolution’s impact, limits and future direction, describe a broader system-level retrospective analysis as a method to support decision making.
To choose strategically, different stakeholders utilize decision support tools to prioritize and take appropriate interventions which are climate-resilient, efficient, and adaptive. Several such decision support tools have been recently reported in the literature [4,5,6] and many of them use multi-criteria analysis approach [7,8]. These tools help planners in making investment decisions like which crop to grow, when to grow it and with what technological and policy intervention [5]. These tools also provide insights on trade-offs and synergies among the different interventions from the biophysical viewpoint. Several studies report trade-offs for crop-based systems [5], the livestock-based systems [9] and those which incorporate gender lenses [10,11]. Often, several trade-offs have to be taken into consideration while choosing the right interventions. Beddington et al., 2012 [12] operating space’ for interconnected food and climate systems. The framework specifies three limits for the global community—food production capabilities under a given climate, future food demand for the growing population and effects of the food production on climate. They highlight that at present we are violating these limits; furthermore, if the current trends of increasing population, changing diets and climate change impacts continue, we will be outside the “safe operating space” in 2050. A similar approach has also been described by identifying planetary boundaries for a sustainable and safe operating space for humanity [13,14].
For agricultural production systems, a range of crop and technology options are available to support the development and adaptation of the agricultural sector to reduce the impacts of climate change on livelihoods. Decision support tools can assist in the process of climate-smart adaptation planning; they identify portfolios of interventions that deliver sustainably increasing agricultural productivity and incomes, increased resilience to climate change and a reduction in greenhouse gas emissions. Significantly, quantitative scenarios developed by such tools comprise a key input to the National Adaptation Plan (NAP) development. While most of these studies focus on individual fields/farmers, we need to understand the adaptation domains of CSA practices and technologies, their synergies with increasing income, their linkages with demand and supply of food grains in a changing climate scenario.
This article builds on earlier article by Shirsath et al., 2017 [6] which describe database development methodology for climate smart agriculture prioritisation; and Dunnett et al., 2018 [5] which use same data for multi-objective trade-off analysis. In the earlier articles, majority interventions were from supply side (technology interventions and socio-economic scenarios), food demand scenarios were not considered or hypothesized. In this study, we analyze trade-offs between agricultural production, GHG emissions and income in a changing climate, technology, and additionally food demand scenario for Bihar in eastern India, a region plagued by poverty and climatic extremes. The methodology here utilizes the Climate Smart Agricultural Prioritisation toolkit [5] for developing and analyzing different scenarios through multi objective land use allocation modelling. Together with supply side interventions, food demand scenarios are also considered here. This analysis has been done with three technology and baseline scenarios with rice and maize in the rainy season (kharif), pulses (lentil, gram, and lathyrus), wheat, maize, and mustard in winter (rabi) season, maize and mung bean in the summer season. Currently, these crops occupy more than 85% of the gross cropped area in Bihar.

2. Materials and Methods

2.1. The Study Region: Bihar

Bihar, a state in eastern India, has an area of 9.4 million hectares and a population of 104 million [15]. About 89% of Bihar’s population dwells in rural areas [15]. Like most of the states in India, agriculture is the backbone of Bihar’s economy; 77% of the workforce and generating nearly 25% of the State Domestic Product [16]. The gross and net sown area in the state is estimated at 7.7 and 5.3 million hectares, respectively [16]. In Bihar, rice, wheat, and maize are the main crops although legumes, vegetables, and fruits also occupy a significant area of the agricultural production system. Bihar’s fertile land and large water resources imply huge potential to the agricultural sector. Despite this, the productivity of crops in Bihar compares poorly with other states. This yield gap often attributes to sub-optimal input use and climate extremes like flood and drought. Solutions are needed that will help the state to produce enough food for the large and growing population, while simultaneously increasing income and reducing GHG emissions. These solutions need to be explored in such a way that we identify the robust growth pathways which consider production, income and emissions from agriculture.

2.2. Crops and Future Technological Scenarios Considered

This study considers major crops—i.e., rice and maize in the rainy season (kharif), pulses (lentil, gram, and lathyrus), wheat, maize, and mustard in winter (rabi) season, maize and mung bean in the summer season.
For achieving a steady and sustainable increase in productivity, agriculture needs a complete transformation. These transformations can be achieved through new production technologies. However, new production technologies have their own costs and feedbacks in the system, e.g., input intensification will likely to increase productivity as well as the GHGs. Many innovations, production technologies, policy decisions have been suggested by different organizations, institutes, researchers, policymakers etc. Several practices and technologies are being used by farmers depending on crop and location. In this study, three technological interventions incorporating both current agricultural practices as baseline in Bihar and advanced potential agricultural practices are analyzed. These technologies groups were derived from ten production technologies presented by Shirsath et al., 2017 [6]. The baseline technology here represents both rainfed and irrigated technologies based on location and crop; the intensification technology has emphasis on increased input use (fertilizer, water in irrigated areas, quality seeds) whereas climate-smart technologies focus on yield improvement through resource use efficiency and precision management of inputs. The technology characteristics and detailed descriptive statistics are available in Shirsath et al., 2017 [6].
Table 1 shows a list of interventions in different technology portfolios used in the study, including baseline, intensification (pertaining to water, seed, fertilizer, and land management related technologies) and finally climate-smart technologies.

2.3. Future Food Demands

The dynamic land-use allocation in the toolkit requires future demand targets. Future crop demand was derived from a published statistics [17]. Total demand for each crop commodity in future was estimated by using projected per capita demand and total population projections (World population prospectus, https://esa.un.org/unpd/wpp/, accessed on 11 March 2021). Please see Figure 1 population growth factors over baseline. For Bihar, and its constituent districts, the existence and achievability of the food self-sufficiency or emission targets are based on food demand in kilo-calories (kcal) terms. Here we targeted the self-sufficiency of food for the projected population growth at an average daily energy requirement. This requirement here is adjusted for the percentage intake in the diets covered by the crop portfolio under consideration. Here, we maximized kcal food production with a set of technologies available to the system (i.e., baseline, intensification, and climate-smart).

2.4. Future GHG Emission Targets

To understand the sustainability of the future production systems we also analyzed emissions and production tradeoffs. The agricultural production systems have to balance between the food production to feed its increasing population and at the same time check the GHG emissions per unit of production. Here, we targeted a reduction of emissions intensity of production with a rate equivalent to 20% reduction every 30 years (i.e., extension of 1990 baseline targets) applied from the calibrated baseline level. At each time-step, we calculated the emission intensity for the resulting agricultural growth pathway. Please see Figure 1 for emission intensity target factors; these were applied while setting targets in the CSAP. The model is initially calibrated to replicate baseline production (kt) and areas (kha) for each crop in each district. The model then identifies optimized land-use change pathways in terms of achieving the specified objectives for food-production, incomes (measured as gross-margin) and CO2 emissions.
Lastly, we compared kcal food production and emission intensity against the target to identify whether food self-sufficiency and reduction in emission targets are attainable or not.

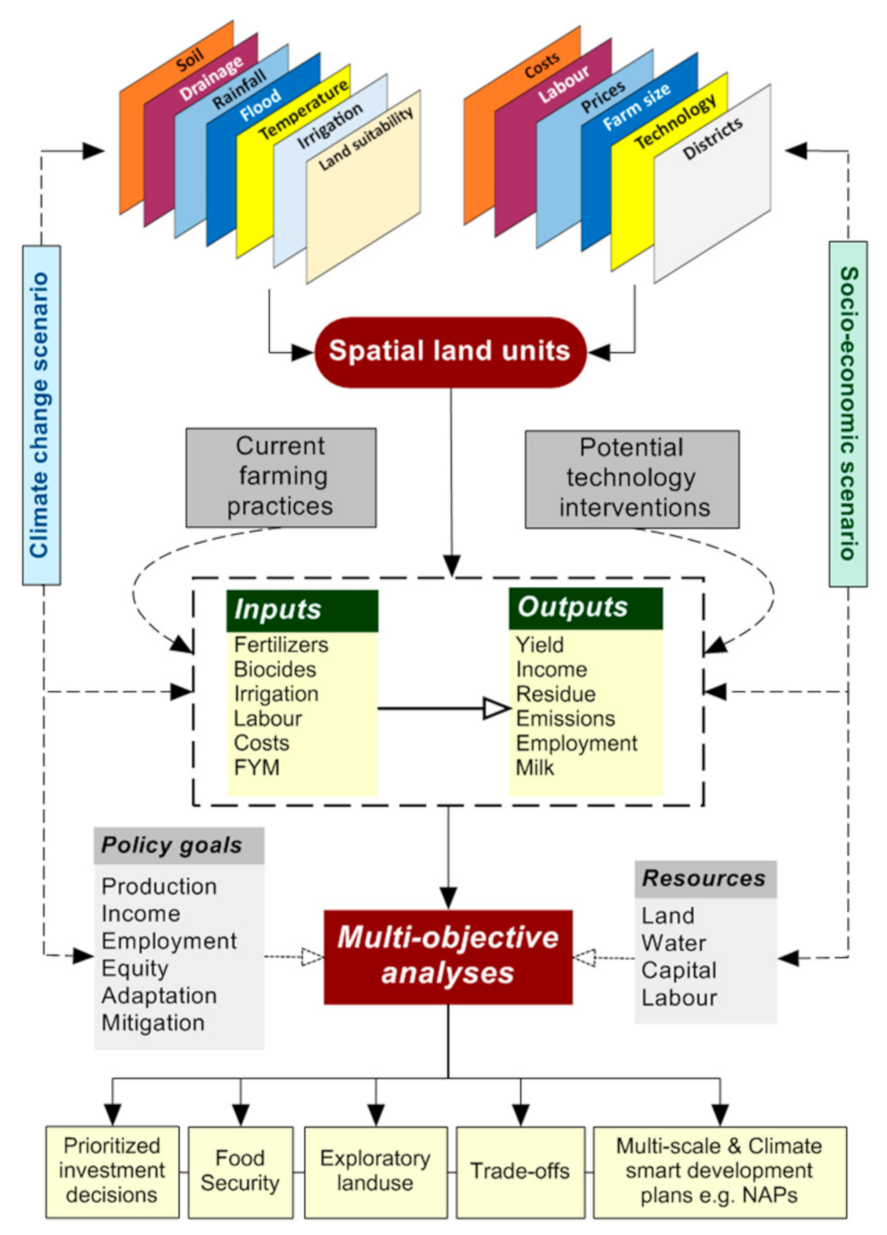
2.5. Climate Smart Agricultural Prioritization (CSAP) Toolkit

The CSAP toolkit employs a dynamic, spatially-explicit multi-objective optimization linear programming model. It explores a range of agricultural growth pathways in tandem with climate-adaptation strategies to meet agricultural development and environmental goals, concerning food self-sufficiency, incomes, employment, and mitigation targets. It can support the prioritization of investment decisions, food security analysis, exploratory land-use analysis and trade-off analysis to support the development of climate-smart investment plans. The toolkit can handle a range of spatial and temporal scales. The schematic diagram of the CSAP toolkit is shown in Figure 2.
The major components of the CSAP toolkit are described below:
  • Land evaluation and resource characterization: This process is the first step of database development for the CSAP toolkit. In this step the detailed database on resource availability e.g., Water, capital and labor are developed. Land suitability to crop and technologies is also characterized in this step. Here, crop-technology and land-unit-specific input–output variables are estimated using the databases and technological coefficient generators. The database development for the CSAP tool integrates biophysical, agronomic, and socio-economic data to establish input–output relationships related to water, fertilizer, energy, labor, and greenhouse gas emissions.
  • Scenario development: This step targets includes establishing a scenario which aims to analyze different development pathways through diverse policy views and development plans. The developed scenarios can encompass climate change scenarios as well as socio-economic scenarios. Here we have considered technology interventions as well as different food demand scenarios.
  • Land-use optimization: The exploratory land-use analysis is carried out using a dynamic, spatially-explicit multi-objective optimization model. The land-use modelling component of the CSAP toolkit is dynamic; in a comparative static analysis, a model is first calibrated to replicated observed production levels under baseline conditions before being subjected to an alternative future set conditions/scenarios and solved again.
The first step of the analysis using the CSAP toolkit starts with the identification of land-units, which are homogeneous parcels of land. They define the spatial resolution of the study, along with the preparation of biophysical and socio-economic datasets. In the case of Bihar, we divided the state into 34 homogenous spatial units. Superimposing this with the district boundaries resulted in 194 land-units—the smallest units of assessment in this study (please see Shirsath et al., 2017 [6] and Dunnett et al., 2018 [5] for more details). Within each land unit, we can further differentiate representative farm-sizes and irrigation/rainfed category. These (sub-categories) may exhibit different levels of resource constraints and costs (e.g., capital, family and hired labor, and water accessibility), and/or constrained access to technologies as a result of the farm size.
The CSAP is a data intensive tool; it requires data on biophysical, economic and social domains. The biophysical data includes information on historical and baseline production levels, agricultural crop suitability and productivity as function of climate, soil, water etc., dynamic climate change impacts (on temperature, precipitation etc.), water availability, estimated greenhouse gas emissions from production. The economic data required includes labor availability and cost, agricultural production costs (input–output) for range of technology options, characterization of market effects on prices of factor-inputs and outputs, discount rates applied to costs and benefits. Social datasets included feasible rates of land-use change, adoption rates for new technologies and stratification of producers (e.g., farm-size, intrinsic technology). For practical decision making analysis using CSAP toolkit all these datasets are required at either land-unit or district level. The methodology to generate such datasets is explained by Shirsath et al., 2017 [6].
In the CSAP exploratory land-use allocation modelling, the primary activity variable represents the area allocated to each crop-technology within a land-unit at a given time for each climate scenario. Yield, costs and greenhouse-gas emissions are linked to this variable via a detailed spatially-explicit database. Furthermore, the CSAP contains a range of multi-scalar spatial constraints on resource and crop-technology suitability. The multi-objective optimization process of CSAP has been explained in detail in Dunnett et al., 2018 [5].

2.6. Assessment of Trade-Offs

Choosing the appropriate decisions of investment, production technology or policy often done through heuristics or expert judgments. Such decisions may lack quantification foreseen impacts. Need is to understand the tradeoffs and synergies in Bihar’s agriculture which will be brought out by new production technologies and/or altered land-use allocation. It is imperative to understand these in the context of future climatic conditions. Further, there is a need to quantify the tradeoffs and synergies between food production, emissions, investments etc. so that we can choose among suitable technologies or altered plausible land use.
For assessing the trade-offs we carried out the multi-objective analysis. In the multi-objective optimization firstly we identify extreme values for the competing objectives by optimizing each in isolation. Based on these extreme values we can identify a decision space within which all further trade-off solutions will be located—being bounded by observed upper and lower extremes in respective objectives. Constraints on the maximum (minimum) level of objectives within this decision space are then formulated and applied in the second round of model solutions (trials). Each trial identifies the optimal performance in each objective achievable under varying levels of constraint in other objectives. Finally, we screen the resulting set of model solutions to identify only efficient solutions. Here, trade-offs are analyzed between income, food self-sufficiency ratio (SSR) and employment in addition to metrics developed to characterize adaptation, mitigation, and food security.
To better understand the trade-offs in the production process, we created three technology and one technology plus demand-shift scenario. These scenarios guide us on which technology and demand-shift combinations are required to migrate into the food self-sufficiency while achieving emission intensity targets. The technology and demand-shift scenarios are explained in detail below:
(a)
Technology max scenario: Here, the crop and technology allocation is not constrained by any rate of uptake (i.e., pathway development). It considers growth pathways based on maximum potential technology within the allocated area for the given time in consideration.
(b)
Intensification growth pathway: In this scenario, the crop and technology allocation is a constrained by the rate of uptake, i.e., pathway development (we allowed rates of land-use change ≤250 kha·yr−1) coupled with intensification technologies (see Table 1).
(c)
Climate-smart growth pathway: This is similar to the previous pathway except for the interventions, which belong to climate-smart technologies.
(d)
Climate-smart growth pathway + demand-shift scenario: Here, we relaxed the demand constraint and instead targeted maximum calorific production. This scenario is analogous to dietary change interventions. A key feature of this growth pathway is that it targets both resource-efficient and high-yielding crops irrespective of its demand. In practice, there two challenges in doing this the first challenge is getting an additional or replacing existing crop area to grow resource-efficient and high-yielding crops and the second challenge is generating demand for this product.
The land-use allocation in all the above scenarios is constrained by resources e.g., water, energy, labor and capital.

3. Results and Discussion

We now demonstrate the achievability of food self-sufficiency and emission targets under the four technology and demand-shift scenarios enumerated above. The elements of emission and adaptation are resolved by the CSAP through multi-objective land-use allocation modelling and dietary change interventions using the demand-shift scenario. We present trade-offs for food security, income, and emission. These trade-offs help in strategically choosing the triple-win solution which addresses income, emissions and food security.

3.1. Achievability of Food Self-Sufficiency and Emission Targets under Different Technology Scenarios

In the technology max scenario (Figure 3 top-left) we do not constrain any rate of uptake for technology adoption (i.e., pathway development) but simply consider maximum potential technology. Here, we found that the self-sufficiency targets can be achieved until 2025. As evident from the graph, this scenario (the continuous green line) remains above food demand until –2025. The emission intensity targets are met until 2040, denoted by the dotted green line (emissions intensity) crossing over the dotted blue line (target emissions intensity) in –2040. Figure 3 highlights that the baseline production level (the black circle) is substantially lower than the existing food demand, indicating that the food self-sufficiency has not been achieved at present.
In the intensification growth pathway, the production processes are constrained by the baseline production position and allowed rates of land-use change (≤250 kha yr−1). We only allow the system to use intensification technologies and improved technologies for rainfed conditions. Considering the effects of allowed rates of land-use change and intensification technology limitations in this scenario, the food self-sufficiency is not achieved. Nonetheless, emission intensity targets can be met until –2032, although it erodes earlier than the technology max growth pathway. For climate-smart growth pathways, we similarly fail to achieve food self-sufficiency. Since these are efficient technologies, the emission reduction targets can be achieved until –2040 like for the technology max growth pathways. The bottom-right chart in Figure 3 highlights results of climate-smart technology together with demand-shift. Here the food self-sufficiency targets are met from 2020 onwards and emission targets are met until 2075. It shows that only technology-driven solutions alone will not be useful in achieving food self-sufficiency and emission reduction targets.

3.2. District Level Achievability of Food Production and Emission Targets

For further scrutiny, the district-level analysis was undertaken to understand district-wise existence and achievability of food sufficiency and meeting the emissions reduction targets (climate-smart growth pathway). The results (Figure 4) indicate that under this growth pathway the number of districts which can achieve food self-sufficiency increase with time. This is because some crops (especially rainfed and winter crops) benefit from an increase and shift in rainfall. Nonetheless, the number of districts meeting the emission targets decreases rapidly with time; since the target of 20% reduction in every 30 years becomes difficult to achieve with these technologies. In terms of achieving both the targets (food and emission), only a few districts emerge. In terms of spatial analysis, a potentially notable takeaway outside the remit of the above exercise would be the possibility of conducting a national-state equivalent, wherein deficit states and those states with limited potential to achieve intensity targets may be identified.

3.3. Trade-Offs with Income

In the analysis outlined above, there was a focus on food production and emissions, which is supplemented below with information on income or total margins. The efficient frontier (Figure 5) is set forth below wherein the portfolio which provides a triple-win is identified by analyzing the trade-offs for Agroecological Zone-1 of Bihar (north-western region). The food security aspect here is presented in terms of food self-sufficiency ratio (SSR) in calorific terms. emissions and income (margins) are given in absolute (total) terms. Figure 5 depicts three sub-plots showing methodology to locate the optimal point on the efficient frontiers, which can be achieved by identifying the point of inflection on SSR vs. emissions (Figure 5—top row) then checking it with the second objective which is the total margin (Figure 5—bottom left) and finally verifying if both points sit on SSR—margin efficient frontier.
We present these trade-offs in one plot where the optimal growth pathway is chosen in such a way that it has a high SSR and total margin, and at the same time, it has the lowest emissions possible. There could be several optimal pathways. Each such pathway can be tracked with a detailed profile incorporating the crop, technology, time and farm-size. One such case study of trade-off analysis is also presented in Dunnett et al., 2018 [5].

3.4. Sustainable Growth Pathways

The methodology presented here can assist in the identification of sustainable growth pathways by analyzing trade-offs for food production, income, and emissions and help in making more informed policy decisions such as a focus on crop diversification or climate-smart agriculture. The methodology treats the systems in holistic manner and builds on local level datasets. There are studies showing application of such modelling frameworks for targeting climate smart growth pathways [4,5,6], food, energy, and water nexus [18,19,20], trade-off analysis in crop based [5] and livestock based systems [21], and investment planning [22]. The growth pathways coming out of the analysis presented here provide important aspects for robust planning through holistic analysis on demand and supply-side innovations, which was missing in earlier studies.
The district-level results presented here demonstrate that food self-sufficiency and emission targets can be achieved at a local scale through efficient crop-technology portfolios. This achievability and development trajectories, of course, conditional on future climatic conditions and its complex interaction with elements of the production system. Different technological portfolios present the trajectories to migrate from the baseline production level (which is substantially lower than baseline food demand) to food self-sufficient pathways. These portfolios are challenged by increasing food demand of the growing population and climate impacts on crop production, which are largely negative. The multi-objective trade-off analysis demonstrated in this study helps in navigating the user to identify the optimal solutions on efficient frontiers of self-sufficiency –margin, self-sufficiency – emissions or margin – emissions. Each point in these efficient frontiers is a solution where the associated land-use in terms of crop-technology mixture can be tracked at a given time period. These locations and time-specific crop-technology options constitute the elements of sustainable growth pathways from the supply side. The methodology presented here resolves the same unpredictability; it allows the user to make robust decisions under these uncertain circumstances of climate and socio-economic conditions. Climate-smart agricultural interventions only on the supply side are likely to be insufficient [23] and hence innovations on demand-side interventions are required. This study also highlights that only technology-driven solution in a silo will not help in achieving both food self-sufficiency and emission reduction targets.
Sustainable finance and climate investment planning are receiving a lot of attention from global community. Increasing financing and its effectiveness is needed for effective implementation of CSA and finding sustainable growth pathways [24]. Several financing mechanisms either globally or regionally are also evolving; the methodology presented here can bridge the information gap for such projects in agriculture by addressing the trade-offs of yield, income, emissions etc. The hypothetical scenarios also provide crucial guidance about demand-side interventions to find sustainable growth pathways e.g., in the results discussed above, which show that food self-sufficiency and emissions targets can be achieved if we relax constraints on dietary demand and focus on kilo-calories maximization targets, implying a policy focus on growing high calorific crops which produce fewer emissions. Though the demand-shift scenario can be effectively used to steer agricultural growth to be more productive, less polluted and sustainable but often they are often very difficult to realize. Those can be brought through the market linkages, value addition using process industry and policy changes, e.g., centralized procurement for public distribution system targeted to the regions to create localized demands. These crop-technology options have varying costs and returns leading to varying levels of income/profit. The methodology presented here shows way to find efficient solutions to achieve income, food security, and emission targets using trade-off analysis. Using alternative modelling approaches and methodologies we can test the validity of the results and the approach presented here. Earlier studies for the same region [5]; however, with different scenarios highlights the similar results of tradeoffs. Such type of multi-objective trade-off analysis for food security, incomes, and emissions assist in identifying priority growth pathways can deliver food and climate-safe futures.

3.5. Limitations of This Study

The methodology presented here uses spatially-explicit dynamic models which prove valuable in making informed decisions. However, since current modelling techniques are often data-hungry, it is challenging to apply these dynamic models under data-scarce conditions. Many assumptions and transfer functions must be used which may result in some degree of uncertainty with them. Secondly, the toolkit and methodology capture the effects of agricultural production systems on the environment. This is achieved through an analysis of GHG emissions from agriculture and resource-use efficiency of inputs applied. While the methodology holistically treats the agricultural production systems wherein we can maximize the synergies through a multi-objective trade-off analysis, elements of livestock and poultry interactions have not yet been captured.

4. Conclusions

The objective this analysis was to identify sustainable growth pathways to better undertake development solutions at a time of agricultural precariousness, climatic shocks, and diet diversity. Building on earlier work on CSA prioritization and multi-objective trade-off analysis for Bihar in India, the analysis here adds food demand scenarios together with technology scenarios to identify optimal growth pathways. This was done by analyzing trade-offs between food production, emissions and income. This article provides a detailed methodology for it. This work develops on a dynamic, spatially-explicit optimization toolkit “CSAP”, which is capable of identifying a variety of growth pathways. The CSAP supports multi-objective analysis for agricultural production in relation to food self-sufficiency, incomes and emissions targets to find robust and sustainable development pathways.
Quantification of trade-offs shows that achievability of food self-sufficiency for our study site Bihar exists up to 2025 under technology max scenario. The emission reduction targets under “technology max” and “climate-smart” scenario can be met up to 2040; however, under the intensification pathway, it disappears by 2032. The district-level analysis shows that it is possible to find solutions at a local scale using efficient crop-technology portfolios. With time meeting emission reduction targets become difficult because of increasing temperature which drives increased emissions from agriculture, erratic rainfall, and increased temperatures leading to the negative impact of climate on crop production coupled with progressive emissions intensity targets.
Only technology-driven solution in a silo will not help in achieving both food self-sufficiency and emission reduction targets. Innovations on demand-side intervention together with technology interventions can help in achieving these targets. At a precarious time when new challenges such as diet diversity, an explosion in food demand and climate change spell uncertainty for the agricultural sector, multi-objective trade-off analysis for food-security, incomes, and emissions supports the development of priority growth pathways that can deliver food- and climate-safe futures and significantly improve policy-planning.

Author Contributions

P.B.S. and P.K.A. designed the research, P.B.S. developed methodology and analyzed the results; P.B.S. wrote the first draft of the article, which was improved with substantial input from P.K.A. All authors have read and agreed to the published version of the manuscript.

Funding

This research was funded by CGIAR Fund Donors and through bilateral funding agreements.

Institutional Review Board Statement

Not applicable.

Informed Consent Statement

Not applicable.

Data Availability Statement

Not applicable.

Acknowledgments

This work was implemented as part of the CGIAR Research Program on Climate Change, Agriculture and Food Security (CCAFS), which is carried out with support from the CGIAR Fund Donors and through bilateral funding agreements. For details, please visit https://ccafs.cgiar.org/donors (accessed on 11 March 2021). The authors would like to acknowledge Alex Dunnett who developed the GAMS version of the CSAP toolkit and to Philip Thornton, CGIAR-CCAFS for his critical inputs to improve this work. The views expressed in this document cannot be taken to reflect the official opinions of these organizations.

Conflicts of Interest

The authors declare no conflict of interest.

Data/Code Availability

The CSAP toolkit code is available on request from corresponding author.

References

  1. Food and Agriculture Organization of the United Nations (FAO); International Fund for Agricultural Development (IFAD); United Nations Children’s Fund (Unicef); World Food Programme (WFP); World Health Organization (WHO). The State of Food Security and Nutrition in the World. Safeguarding against Economic Slowdwns; Food & Agriculture Org: Rome, Italy, 2019; ISBN 978-92-5-109888-2. [Google Scholar]
  2. Mccarthy, N.; Lipper, L.; Zilberman, D. Economics of Climate Smart Agriculture: An Overview. Clim. Smart Agric. 2018, 52, 31–47. [Google Scholar] [CrossRef] [Green Version]
  3. Aggarwal, P.K.; Jarvis, A.; Campbell, B.M.; Zougmoré, R.B.; Khatri-Chhetri, A.; Vermeulen, S.J.; Loboguerrero, A.M.; Sebastian, L.S.; Kinyangi, J.; Bonilla-Findji, O.; et al. The climate-smart village approach: Framework of an integrative strategy for scaling up adaptation options in agriculture. Ecol. Soc. 2018, 23, art14. [Google Scholar] [CrossRef]
  4. Brandt, P.; Kvakić, M.; Butterbach-Bahl, K.; Rufino, M.C. How to target climate-smart agriculture? Concept and application of the consensus-driven decision support framework “targetCSA”. Agric. Syst. 2017, 151, 234–245. [Google Scholar] [CrossRef]
  5. Dunnett, A.; Shirsath, P.B.; Aggarwal, P.K.; Thornton, P.; Joshi, P.K.; Pal, B.D.; Khatri-Chhetri, A.; Ghosh, J. Multi-objective land use allocation modelling for prioritizing climate-smart agricultural interventions. Ecol. Modell. 2018, 381, 23–35. [Google Scholar] [CrossRef]
  6. Shirsath, P.B.; Aggarwal, P.K.; Thornton, P.K.; Dunnett, A. Prioritizing climate-smart agricultural land use options at a regional scale. Agric. Syst. 2017, 151, 174–183. [Google Scholar] [CrossRef]
  7. Prabhakar, S. Adaptation Decision Making Frameworks and Tools: Multicriteria Decision Making Tools for Prioritizing Adaptation Actions at Community Level; Institute for Global Environmental: Hayama, Japan, 2014. [Google Scholar]
  8. Feltmate, B.; Thistlethwaite, J. Climate Change Adaptation: A Priorities Plan for Canada; Climate Change Adaptation Project: Canada, 2012; p. 122. [Google Scholar]
  9. Notenbaert, A.; Pfeifer, C.; Silvestri, S.; Herrero, M. Targeting, out-scaling and prioritising climate-smart interventions in agricultural systems: Lessons from applying a generic framework to the livestock sector in sub-Saharan Africa. Agric. Syst. 2017, 151, 153–162. [Google Scholar] [CrossRef] [PubMed]
  10. Jost, C.; Kyazze, F.; Naab, J.; Neelormi, S.; Kinyangi, J.; Zougmore, R.; Aggarwal, P.; Bhatta, G.; Chaudhury, M.; Tapio-Bistrom, M.-L.; et al. Understanding gender dimensions of agriculture and climate change in smallholder farming communities. Clim. Dev. 2016, 8, 133–144. [Google Scholar] [CrossRef] [Green Version]
  11. Beuchelt, T.D.; Badstue, L. Gender, nutrition- and climate-smart food production: Opportunities and trade-offs. Food Secur. 2013, 5, 709–721. [Google Scholar] [CrossRef] [Green Version]
  12. Beddington, J.R.; Asaduzzaman, M.; Fernandez, A.; Clark, M.E.; Guillou, M.; Jahn, M.M.; Erda, L.; Mamo, T.; Bo, N.V.; Nobre, C.A.; et al. Achieving Food Security in the Face of Climate Change: Final Report from the Commission on Sustainable Agriculture and Climate Change; CGIAR Research Program on Climate Change, Agriculture and Food Security (CCAFS): Copenhagen, Denmark, 2012. [Google Scholar]
  13. Rockström, J.; Steffen, W.L.; Noone, K.; Persson, Å.; Stuart, F.; Iii, C.; Rockstrom, J.; Steffen, W.; Noone, K.; Persson, A.; et al. Planetary Boundaries: Exploring the Safe Operating Space for Humanity Recommended Citation. Ecol. Soc. 2009, 14, 32. [Google Scholar] [CrossRef]
  14. Rockström, J.; Steffen, W.; Noone, K.; Persson, Å.; Chapin, F.S.I.; Lambin, E.; Lenton, T.M.; Scheffer, M.; Folke, C.; Schellnhuber, H.J.; et al. Planetary Boundaries: Exploring the Safe Operating Space for Humanity. Ecol. Soc. 2009, 14, art32. [Google Scholar] [CrossRef]
  15. Government of Bihar. Bihar Statistical Hand Book 2016; Directorate of Economics and Statistics: Patna, India, 2016.
  16. Pohit, S.; Kannan, E.; Singh, R.; Bandyopadhyay, S.; Alawadhi, A.; Sayal, L. Study on Agricultural Diagnostics for the State of Bihar in India; National Council of Applied Economic Research: New Delhi, India, 2019. [Google Scholar]
  17. Kumar, P.; Kumar, A.; Shinoj, P.; Raju, S. Estimation of demand elasticity for food commodities in India. Agric. Econ. Res. Rev. 2011, 24, 1–14. [Google Scholar]
  18. Berardy, A.; Chester, M.V. Climate change vulnerability in the food, energy, and water nexus: Concerns for agricultural production in Arizona and its urban export supply. Environ. Res. Lett. 2017, 12, 35004. [Google Scholar] [CrossRef]
  19. Li, M.; Singh, V.P.; Fu, Q.; Liu, D.; Li, T.; Zhou, Y. Optimization of agricultural water–food–energy nexus in a random environment: An integrated modelling approach. Stoch. Environ. Res. Risk Assess. 2019, 35, 3–19. [Google Scholar] [CrossRef]
  20. Bieber, N.; Ker, J.H.; Wang, X.; Triantafyllidis, C.; van Dam, K.H.; Koppelaar, R.H.E.M.; Shah, N. Sustainable planning of the energy-water-food nexus using decision making tools. Energy Policy 2018, 113, 584–607. [Google Scholar] [CrossRef]
  21. Gil, J.D.B.; Garrett, R.D.; Rotz, A.; Daioglou, V.; Valentim, J.; Pires, G.F.; Costa, M.H.; Lopes, L.; Reis, J.C. Tradeoffs in the quest for climate smart agricultural intensification in Mato Grosso, Brazil. Environ. Res. Lett. 2018, 13, 64025. [Google Scholar] [CrossRef]
  22. Andrieu, N.; Sogoba, B.; Zougmore, R.; Howland, F.; Samake, O.; Bonilla-Findji, O.; Lizarazo, M.; Nowak, A.; Dembele, C.; Corner-Dolloff, C. Prioritizing investments for climate-smart agriculture: Lessons learned from Mali. Agric. Syst. 2017, 154, 13–24. [Google Scholar] [CrossRef] [Green Version]
  23. Scherer, L.; Verburg, P.H. Mapping and linking supply- and demand-side measures in climate-smart agriculture. A review. Agron. Sustain. Dev. 2017, 37, 1–17. [Google Scholar] [CrossRef] [Green Version]
  24. Lipper, L.; Thornton, P.; Campbell, B.M.; Baedeker, T.; Braimoh, A.; Bwalya, M.; Caron, P.; Cattaneo, A.; Garrity, D.; Henry, K.; et al. Climate-smart agriculture for food security. Nat. Clim. Chang. 2014, 4, 1068–1072. [Google Scholar] [CrossRef]
Figure 1. Emission intensity factors and population growth factors over baseline. Emission intensity factor is targeting a reduction rate equivalent to 20% reduction every 30 years (i.e., extension of 1990 baseline targets) applied from the calibrated baseline level.
Sustainability 13 03190 g001
Figure 2. Schematic of the Climate Smart Agricultural Prioritization (CSAP) multi-objective toolkit (Source: Dunnett et al., 2018 [5]).
Sustainability 13 03190 g002
Figure 3. Achievability of food self-sufficiency and emission targets under different technology scenarios (top-left: Technology max growth pathway; top-right: Intensification growth pathway; bottom-left: Climate-smart growth pathway and bottom-right: Climate-smart growth pathway with demand-shift). The green shaded area highlights achievability of food and emission targets over time.
Sustainability 13 03190 g003
Figure 4. District wise existence and achievability of food self-sufficiency under the climate-smart growth pathway. The existence and achievability of food self-sufficiency shown in the top row; meeting emissions intensity target in the middle row and meeting combined targets (food + emission) in the bottom row (green color highlights target achieved and red denotes missed).
Sustainability 13 03190 g004
Figure 5. Identifying trade-offs of food production, emission, and income for districts in agro-ecological zone-1.
Sustainability 13 03190 g005
Table 1. Interventions in different technology portfolios used in this study.
TechnologyTechnology Characteristics
BaselineTraditional cultivars; fertilizer application required to realize target yields and biocide application
Intensification (rainfed)Fertilizer application required to realize target yields; water conservation practices, improved cultivars; index-based insurance and seed replacement
Intensification (irrigated)Fertilizer application required to realize target yields; seed replacement; biocide application and additional secondary tillage
Climate-smartFertilizer application required to realize target yields; index-based insurance; seed replacement; biocide application; leaf color charts (rice, wheat and maize); laser levelling and water management; residue incorporation; reduced tillage; alternate wetting drying (rice); site-specific Nitrogen management; improved irrigation pump efficiency and farmer training
Publisher’s Note: MDPI stays neutral with regard to jurisdictional claims in published maps and institutional affiliations.

