Review

Subjective Well-Being as a Potential Policy Indicator in the Context of Urbanization and Forest Restoration

1
School of Environmental Science, University of Shiga Prefecture, Hikone 522-8533, Japan
2
Research Institute for Humanity and Nature, Kyoto 603-8047, Japan
3
Kokoro Research Center, Kyoto University, Kyoto 606-8501, Japan
4
Faculty of Human Sciences, Waseda University, Tokorozawa 359-1192, Japan
5
Research Center for Inland Seas, Kobe University, Kobe 657-8501, Japan
*
Author to whom correspondence should be addressed.
Sustainability 2021, 13(6), 3211; https://doi.org/10.3390/su13063211
Submission received: 14 December 2020 / Revised: 8 March 2021 / Accepted: 10 March 2021 / Published: 15 March 2021

Abstract

:
The enhancement of human well-being is one of the ultimate goals of resource management; however, it is not explicitly considered by forest policy indicators. Our previous studies examined how Japanese citizens in the Yasu River watershed of the Shiga Prefecture perceived subjective well-being related to forests (forest SWB). We found a negative correlation between forest SWB and forest ownership, suggesting dissatisfaction with the low profitability of forest ownership. Based on this result, in this paper, we argue that forest SWB can be an important indicator for policymaking in the context of urbanization and forest restoration and can complement existing forest indicators focusing mainly on physical and objective properties. First, we propose that a direct measurement of well-being (e.g., forest SWB) is preferable over an indirect measurement (e.g., GDP), for policymaking processes related to forests. Second, forest SWB can reflect the quality of our interactions with forests, which is important in urbanized societies which tend to have reduced experiences with nature. Third, forest SWB could identify inequalities between the users of forest ecosystem services and forest managers. Overall, forest SWB can be a holistic indicator to capture a variety of perspectives held by citizens.

1. Introduction

1.1. Background

Urbanization is an ongoing and persistent global trend [1]. In 1950, 30% of the global population resided in urban areas. By 2018, this percentage increased to 55% and is expected to increase to 68% by 2050. This evidence has several policy implications because it poses environmental, economic, and social challenges for sustainable future development. The trend towards urbanization is also present in Japan. In 2018, 91.6% of the Japanese population resided in urban areas [1], ranking 17th in the world.
Forest restoration is also a global trend. As stated by Mather in his “forest transition hypotheses”, forest areas generally decrease in beginning stages of economic development and, in turn, they increase in later developed stages [2,3,4]. Following intensive exploitation during World War II, Japanese forests have been restored and have now reached “forest saturation” status—a state where a nation has a sufficient quantity of forests [5].
In general, policy indicators determine the extent to which the policy goals are met and often reflect political or institutional factors that influence the entire process [6]. Given the connection between urbanization and forest restoration, forest policymakers need to consider new types of policy indicators that clarify the links between the subjective feelings of citizens and the condition of the forests. For example, following urbanization, the direct and material dependence on natural ecosystems has decreased, but the importance of spiritual (nonmaterial) values of natural ecosystems has increased [7].
Historically, policy indicators have tended to focus on the physical and objective conditions of the forest. For example, the Japanese national forest plan approved by the Cabinet office, Government in Japan (2018; Table 1) provided numerical goals for the types of forests and their areas, harvesting volumes, tree-planting areas, construction of forest roads, areas of protected forests, and soil conservation projects [8]. These physical forest characteristics have a significant impact on determining the amount of timber as well as the opportunities for recreation. For example, plantation forests and seminatural forests provide different levels of timber production and recreational opportunities. However, with such objective measures, consequences for the subjective well-being (SWB) of individuals who interact with forests remain unclear. Understanding these more subjective measures may help to address forest management problems commonly faced by policymakers in developed countries. For example, forest owners who lose interest in forest management do not properly manage forests [9,10].
At the global level, the Food and Agricultural Organization of the United Nations (FAO) conducts a forest resource assessment every 5 years (Table 2) [11]. Nearly all items used in this series of assessments emphasizes forests’ physical features, such as total forest areas and protected forest areas.

1.2. Subjective Well-Being as a Policy Indicator

Subjective well-being (SWB) is a theoretical construct developed in psychology [12,13,14] and economics [15,16,17] and has been the subject of many empirical studies. SWB is a multidimensional construct capturing basic human psychological needs, such as security, basic materials for a satisfactory life, health, successful social relationships, and freedom of choice and action. These human needs are also of interest to the conceptual model of ecosystem services [18], and we argue it is therefore important to monitor well-being when considering policies for forest ecosystems.
Forest SWB refers to a subjective well-being measure that assesses the respondent’s relationship with forests. Previous studies regarding forest-specific SWB do not exist to the best of our knowledge, although the influence of nature on the general SWB has been studied by researchers. The number of studies investigating the relationships between nature, especially green spaces, and SWB is increasing. In the following sections, we argue that forest-related SWB can be a promising policy indicator.

1.3. SWB-Correlated Factors in the Literature

In the reviewed two studies, the SWB-correlated factors in the literature were investigated. We organized factors associated with SWB into the following four categories in order to review previous studies: natural capital, built or manufactured capital, human capital, and social or cultural capital [19].

1.4. Natural Capital

Several researchers have emphasized the importance of natural areas as natural capital contributing to SWB by estimating their economic value. For example, Kopman and Rehdanz identified correlations between the ratios of natural environments and SWB in European countries and analyzed their monetary values as marginal willingness-to-pay (WTP) estimates [20]. Ambrey and Fleming reported relationships between ecosystem services (i.e., visual amenity and biodiversity) and SWB in Australia, and estimated WTP values for the improvement of these services [21,22]. An inverted U-shaped (concave) relationship between the distance to urban green spaces and life satisfaction was found for Berlin and this relationship was replicated in other German cities in a separate study [23,24]. In another study, Tsurumi and Managi identified relationships between SWB and the distance from the green spaces from residential areas, and calculated the marginal WTP for green spaces in metropolitan areas in Japan [25]. Tsurumi et al. further investigated various well-being measures such as the Cantril ladder, life satisfaction, subjective happiness, affect balance, and mental health, and their relationships with diverse green spaces in a metropolitan area in Japan and suggested possible positive effect of greenery investments on SWB [26]. A national-level survey in Japan found that respondents living in areas with more plantation forests or open water had relatively higher levels of well-being [27]. Based on these results, the authors recommended additional investments in plantation forest management and open water areas. Apart from land use types, Holms et al. captured the negative impacts of bark beetle epidemics on SWB in the western US [28].
Several studies have further explored the impact of interactions, not only physical closeness, with nature on SWB. Jang et al. reported that the frequency of forest visits is more relevant to SWB than the distance to urban forests in South Korea [29]. It was found in Italy and the UK that longer and more frequent visits to urban green spaces improved the perceived benefits and well-being of respondents [30]. Another study confirmed that the types of activities during visits to forest areas ((a) reading, talking, socializing; (b) walking/exercising, and (c) contemplating the setting) influenced well-being differently [31]. Bieling et al. noted that practices (e.g., hiking, walking) and perceived relationships (e.g., naturalness, tranquility, accessibility) in natural settings were also important factors for SWB compared to physical factors (e.g., mountains, forests, water bodies), based on open-ended interviews in Germany and Austria [32].
Notably, several studies have examined urban–rural differences based on SWB. In secondary analysis of existing data, lower levels of urban sprawl were associated with higher SWB as measured by personal financial issues for individuals living in urban areas in the USA [33]. Carrus et al. investigated how urban residents perceived peri-urban natural areas in large- to medium-scale cities in Italy and found that biodiversity had a positive relationship with perceived restorative properties and self-reported benefits from urban and peri-urban green spaces [31]. The aforementioned studies mainly focused on urban resident perspectives. Thus, we highlighted the well-being of residents in rural areas in the second (upper watershed) study reviewed below.

1.5. Built or Manufactured Capital

The correlations between SWB and built or manufactured capital (e.g., roads, postal offices) in Japan were examined, and there were no statistically significant correlations, while the authors cautioned that several urban respondents completing the online survey may already have sufficient levels of built capital [27]. Tsurumi et al. included convenience indicators (e.g., number of neighboring retail stores) as control variables and found no statistically significant correlations with SWB [25].

1.6. Human Capital/Social or Cultural Capital

SWB is positively correlated with education level, which is often used as a measure of human capital [17]. Several studies included the levels of education as control variables and found statistically significant coefficients for the variables [25,26,27].
Social relationships are also correlated with SWB [12], which can be identified with social capital. Several studies analyzed above include social relationships, such as participation in volunteering activities [27] and the number of people who can be relied upon [26], with a statistically significant correlation and insignificant results, respectively.

1.7. Demographic Factors

Demographic factors were included as control variables in various studies [16,17,20,21,22,23,24,25,26,27]. Age, the age (squared), income, sex, marriage, and jobs were found to correlate with SWB.

1.8. Methodologies

All the aforementioned empirical studies involved survey or interview responses regarding SWB and used those responses as SWB indicators. However, MacKerron and Mourato utilized an innovative method by using a smartphone application to periodically collect daily life SWB data, as well as the GIS location when respondents reported their SWB, making more frequent measurement possible [34]. As an additional exception to the physical surveys and interviews, Wei et al. used facial expressions on selfies on SNS, a possibly more objective representation of SWB, to measure the satisfaction levels of visitors to forest parks in Chinese cities [35].

1.9. Structure of Paper

In summary, previous research empirically investigated the relationships between SWB and green spaces, such as forests, agricultural lands, and parks. They did not explicitly consider SWB or forest SWB as forest policy indicators. Based on two studies regarding forest SWB to be discussed in the below, we examined why and how forest SWB can be an appropriate policy indicator in the age of urbanization and forest restoration. Section 2 and Section 3 review the summary results of two studies that examined forest SWB across the entire Yasu River watershed and at the upper Yasu River watershed in Japan. In Section 4, we argue that forest SWB can be utilized as a policy indicator, and finally, Section 5 provides a conclusion which also discusses possible future studies.

2. Study of Forest SWB across the Entire Yasu Watershed (Study 1)

In the current study, a questionnaire survey was distributed among Japanese residents living in a region with a medium-sized watershed [36]. A watershed represents a natural unit for forest management in the country, as indicated by regional forest management plans being based on watershed units. This watershed was selected because it has a densely populated lower watershed and a less populated upper watershed, which is typical in Japan [37]. Furthermore, the watershed residents’ characteristics are representative of the Japanese population in terms of familiarity with forests, occasions upon which they visited forests, and their needs, based on comparisons of a local questionnaire with national surveys [38].
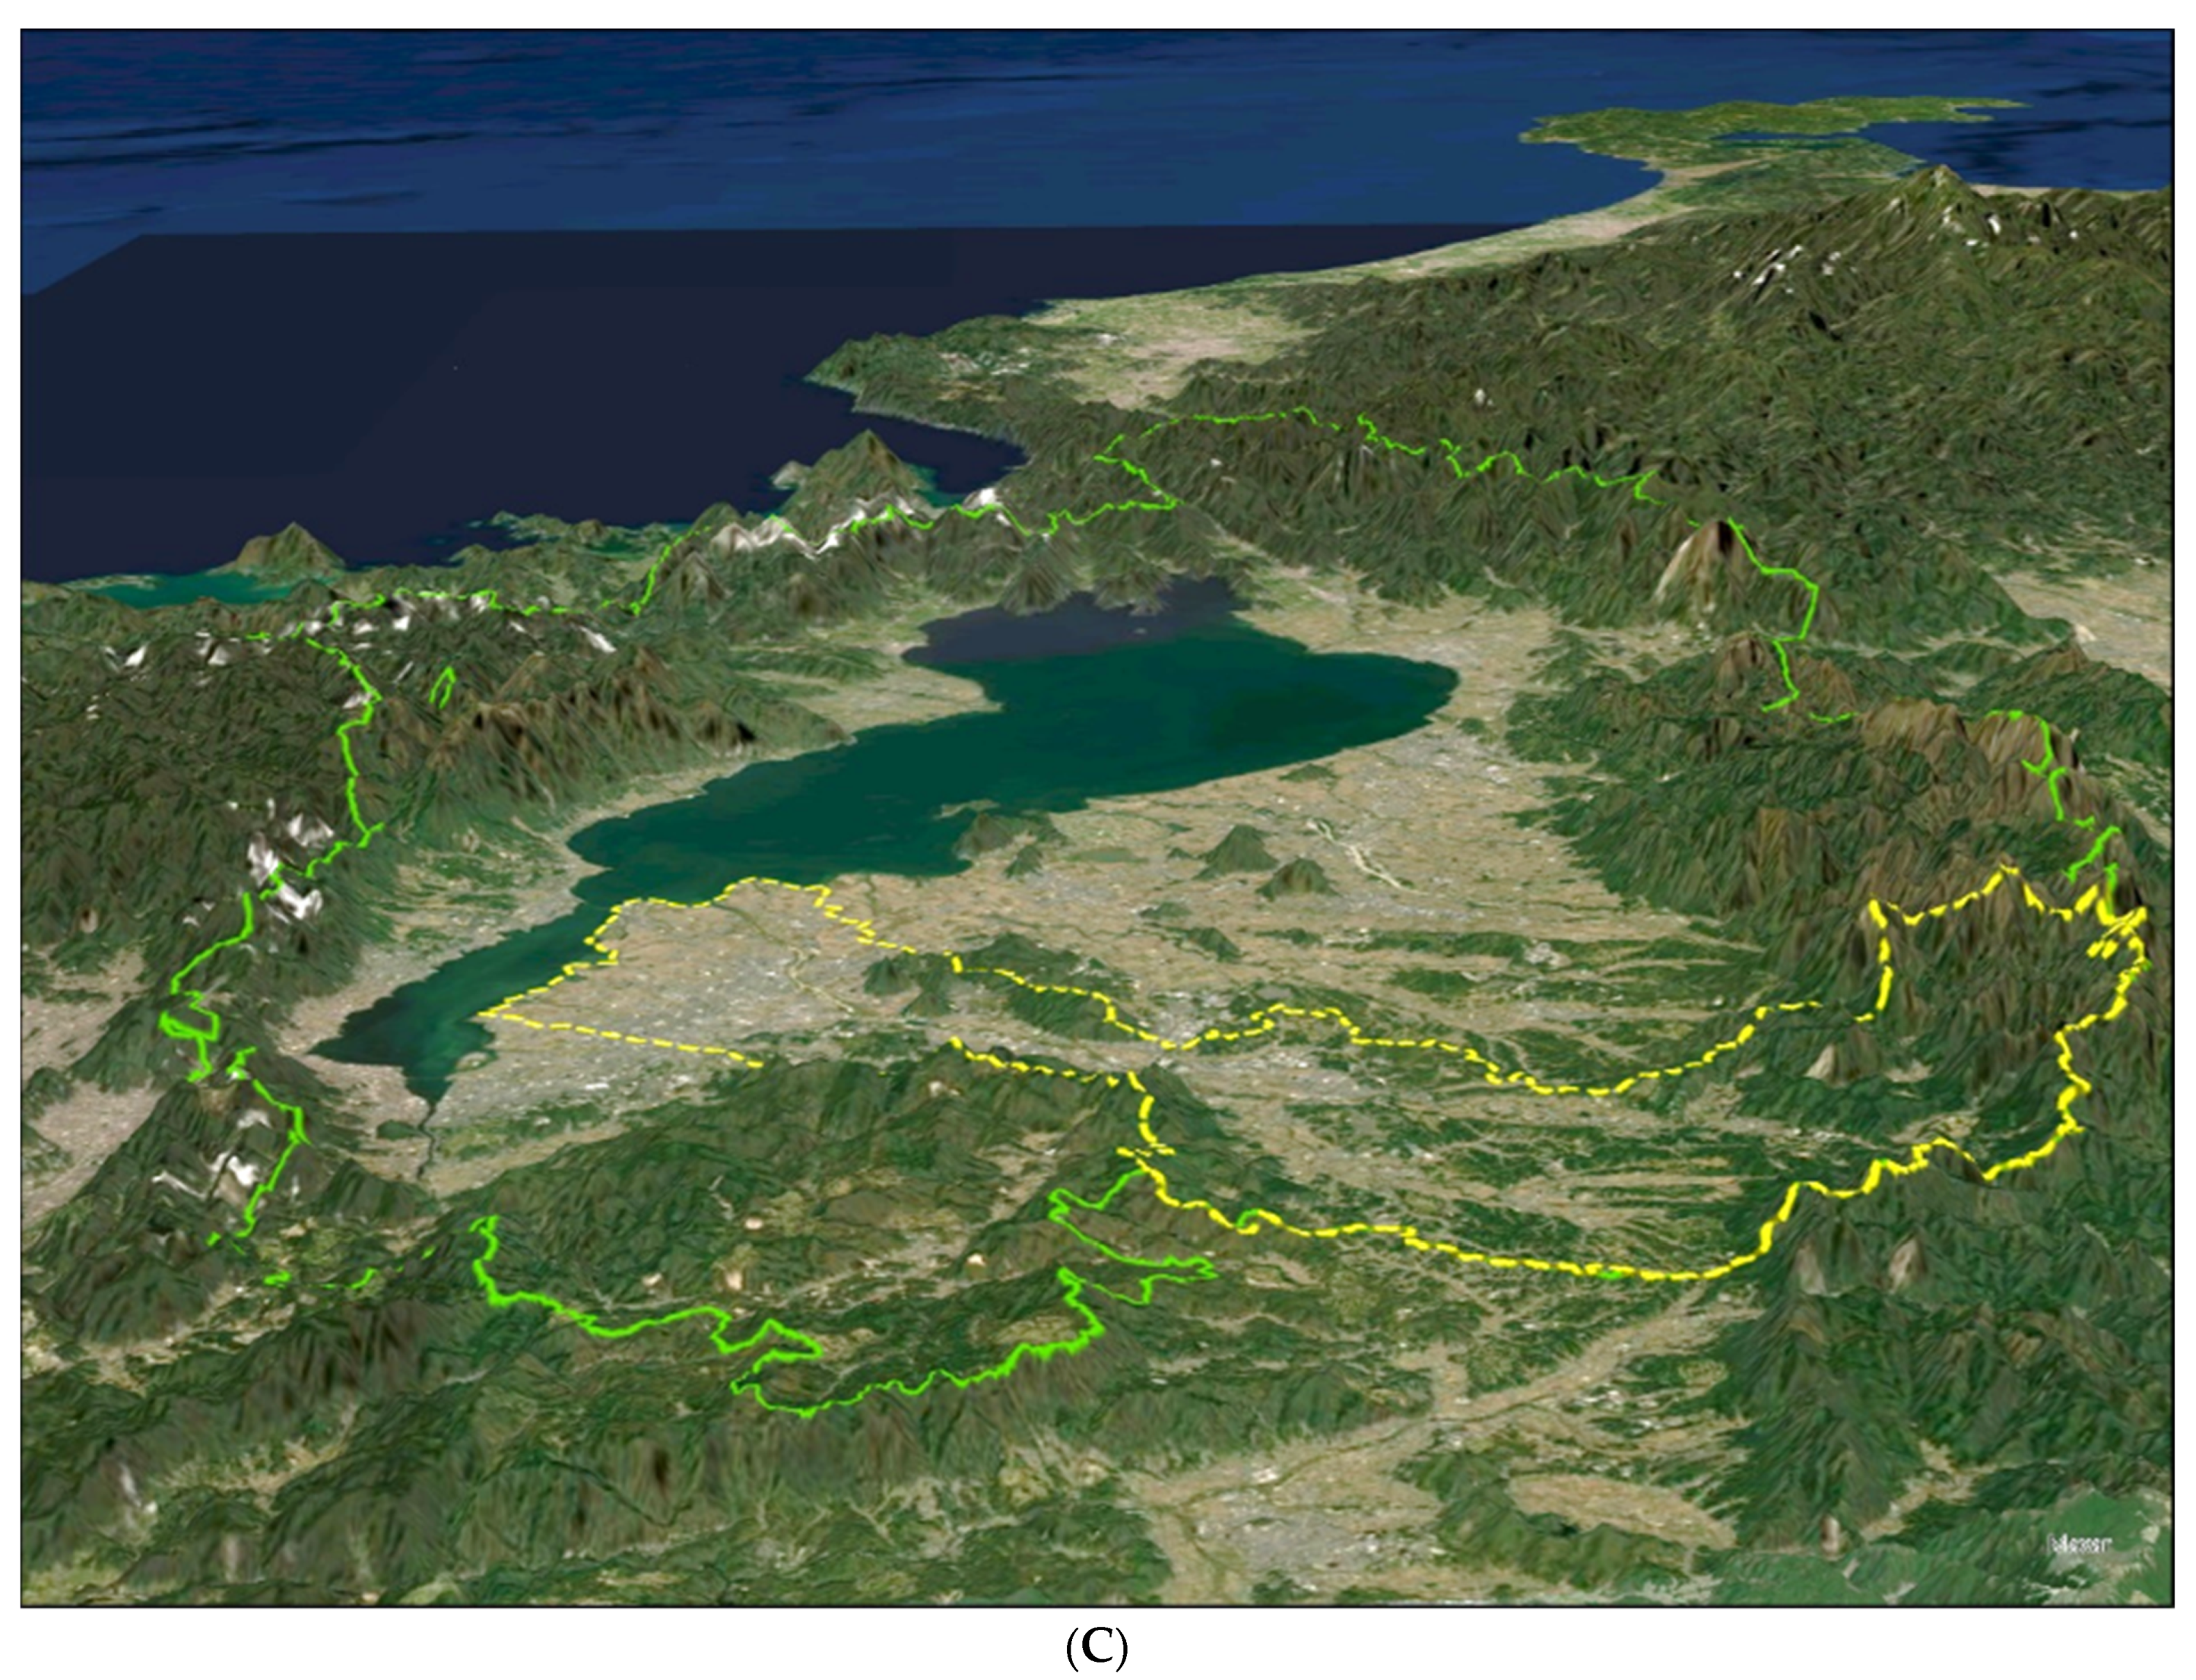
The study site, the Yasu River watershed, is located in Shiga Prefecture near Kyoto in central Japan (Figure 1A–C). Table 3 presents the descriptions of this watershed.
Questionnaires were mailed in February and March 2016 to 34,691 households in 81 randomly selected postal codes within the study area. The questionnaire, written in Japanese, asked about SWB, relationships with others (social capital), nature (forest-related activities), and other aspects of everyday life. A total of 3,220 questionnaires were returned with a 9.3% response rate.
The average age of the respondents was 65, in comparison to residents’ average age among the six cities ranging from 40 to 46 as of 2015. Respondents were 35% female, whereas female residents in the six cities range from 48% to 51% as of 2015 [40].
Forest SWB was measured using one item intended to assess affective evaluations towards local forests. The SWB specifically related to local forests was measured by the responses to the following statement: “I feel happy when I see local mountains.” The response options ranged from 1 = “I completely disagree” to 5 = “I strongly agree.” The term “mountains,” which is interchangeable with “mountain forests” in Japanese, was used as vernacular to question the feelings regarding forests, which are located mainly in mountainous areas in Japan [41]. The distribution of forest SWB responses is presented in Figure 2 with the average score in brackets. Responses were widely distributed, indicating that there was sufficient individual variation.
Ordinary least squares (OLS) regressions were performed in STATA to identify significant associations (p < 0.10) between forest SWB, demographic factors, and (i) natural, (ii) man-made, and (iii) social capitals, with positive and negative coefficients indicating the direction of these associations (Table 4). In the written explanation of the results to follow, the numbers for each variable in Table 4 will be used in text to refer to their corresponding variables.
Considering the groups of variables, certain demographic variables have positive or negative correlations with the indicators.
  • Subjective health (dependent variable 1–explanatory variable 1; 1–1) and age squared (1–2) were positively correlated with forest SWB.
  • The professional category of respondents was also associated with forest SWB such that individuals working in forestry (1–4) and fishery (1–5) had higher forest SWB and those working in businesses (1–10) had lower forest SWB relationships.
Next, we considered variables relating to respondents’ behavior regarding forests.
  • Engagement with wildlife (1–9) and recreational activities (e.g., leisure) (1–7) had positive relationships with forest SWB.
  • There was a significant interaction between the ratio of forest ratios and forest-related activities (1–12) predicting forest SWB. This indicates that respondents who lived in forested areas perceived lower forest SWB from forest-related activities than did those in less forested areas.
Unexpectedly, there was no significant associations between the physical presence of forests and forest SWB.
  • The forest ratios of the respective postal areas where respondents resided did not correlate with forest SWB.
The adjusted R2 value for the models with dependent variable 1 (forest SWB) was 0.156. The F-statistic p-value of the corresponding OLS was less than 0.0001. The adjusted R2 values for models with a general SWB were larger than those for the forest SWB (0.360).

3. Study of Forest SWB within the Upper Yasu Watershed (Study 2)

A second study was conducted on the upper watershed, a subsection within the first study site [42]. The purpose of this second survey was to identify patterns of responses among populations that have more intense ties with forests. The upper watershed areas have higher ratios of forested areas, whose residents historically experience active forestry activities. The city in the upper watershed includes 81% of the all the six watershed cities [39]. Considering the entire watershed survey, it was found that residents in forested areas were less likely to derive forest SWB from forest-related activities, which is another motivation for this study.
Questionnaires were mailed from January through April 2018 to 6559 households in all postal codes of two upper watershed areas of the study area. Similar to the previous questionnaire, SWB, relationships (social capital), nature (forest-related activities), and other aspects of everyday life were questioned. A total of 1457 questionnaires were returned, with a response rate of 17.2%. The average age of the respondents was 59, consisting of 39% of female respondents while the average age of citizens of the upper watershed city was 46 and the ratio of female population was 50% [40].
In this study, forest SWB was measured using five items. Similar to study 1, the first item asked about personal affective evaluation towards local forests. The other four items assessed satisfaction, fulfillment (eudaimonia), positive affect, and negative affect, based on the Organization for Economic Co-operation and Development (OECD) guidelines for the measurement of SWB [43].
Forest satisfaction: Respondents were asked about their satisfaction using an 11-point scale, which ranged from “completely dissatisfied” (0) to “completely satisfied” (10) (“How satisfied are you with your current relationships with forests?”). Forest fulfillment (eudaimonia): Forest fulfillment was assessed on an 11-point scale ranging from “do not feel at all” (0) to “feel strongly” (10) (“How much worth, fulfilment, or sense of accomplishment do you feel regarding your relationships with forests?”). This question concerns eudaimonia, a concept first indicated by Aristotle in his Nicomachean Ethics, in which he asserts that people are happy not by feeling pleasure (hedonia), but by leading virtuous lives [44,45].
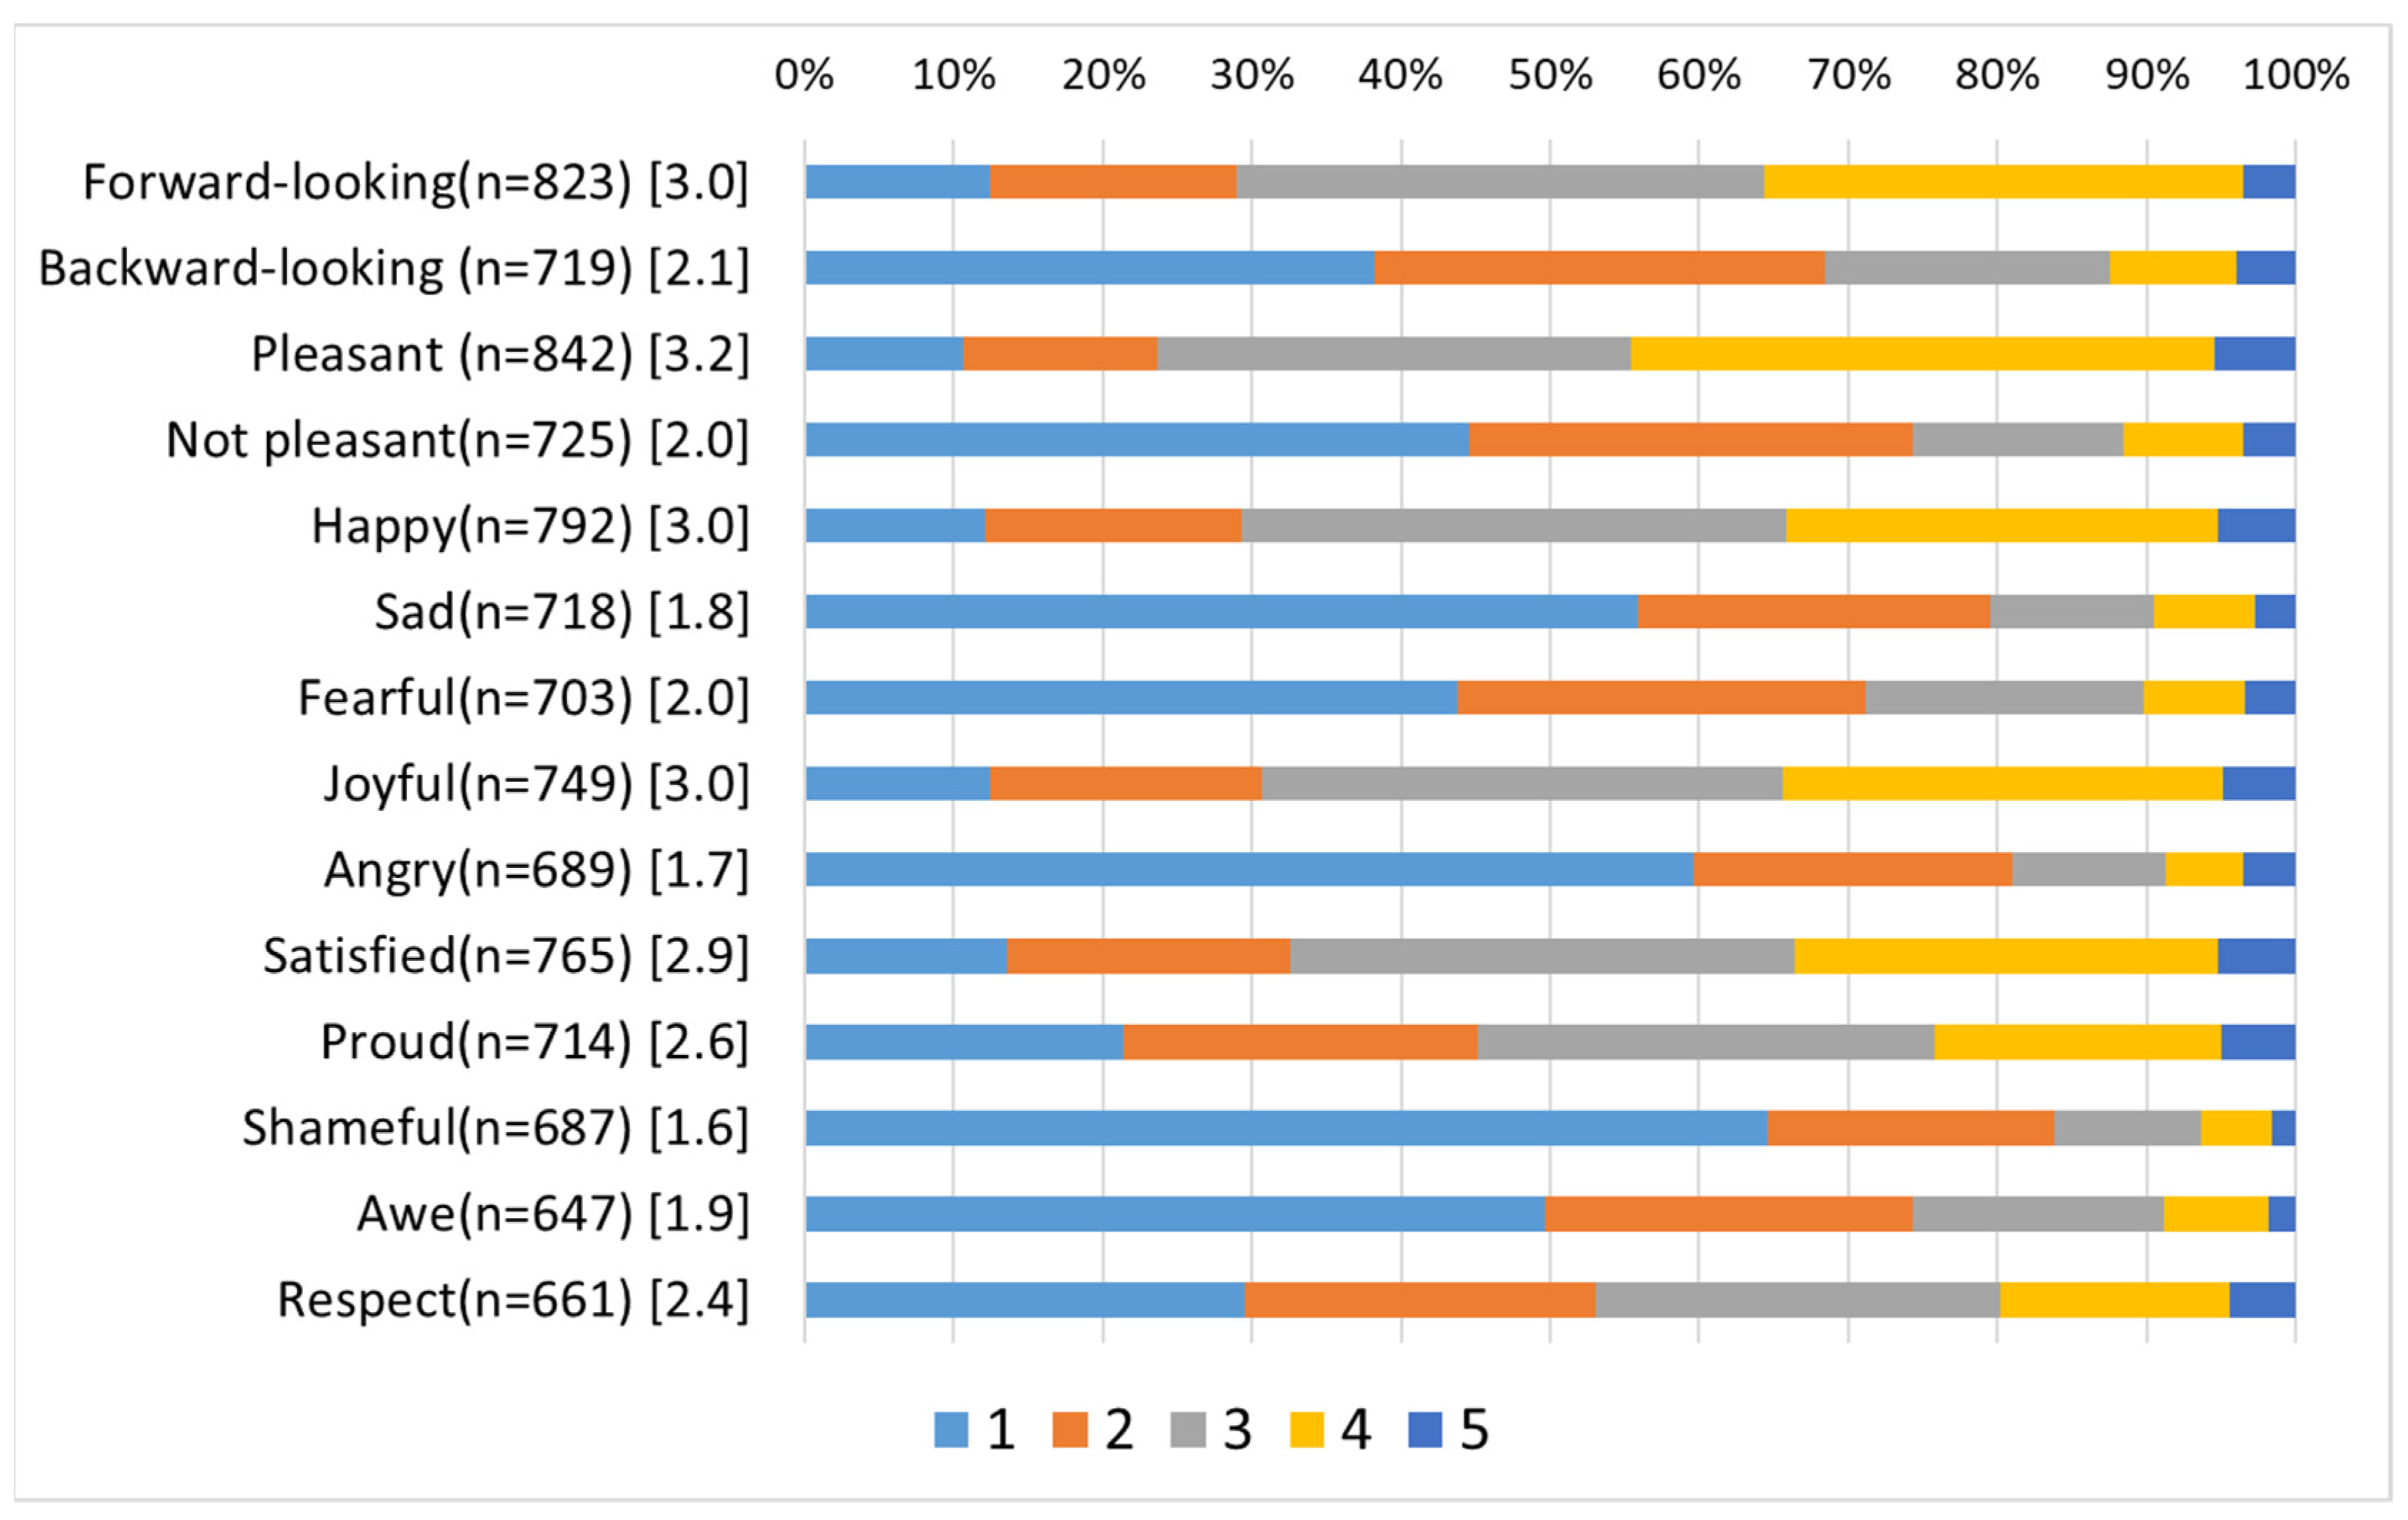
Positive and negative affect (feelings): Next, respondents were asked “How much have you experienced the following feelings during your experiences regarding forests?” For this item, respondents were provided the following list of feelings: forward-looking, backward-looking, pleasant, not pleasant, happy, sad, fearful, joyful, angry, satisfied, proud, shameful, awe, and respect. For each feeling, respondents were asked to choose one option on a five-point scale: 1 = “very rare,” 2 = “rare,” 3 = “sometimes,” 4 = “frequently,” and 5 = “very frequently.” Based on the results of a factor analysis, by choosing items with factor loadings greater than 0.5, the authors determined the scores of the positive and negative affects by adding the scores of the five items for the positive affect (i.e., forward-looking, pleasant, happy, joyful, and satisfied), and the scores of two items for the negative affect (i.e., backward-looking and unpleasant).
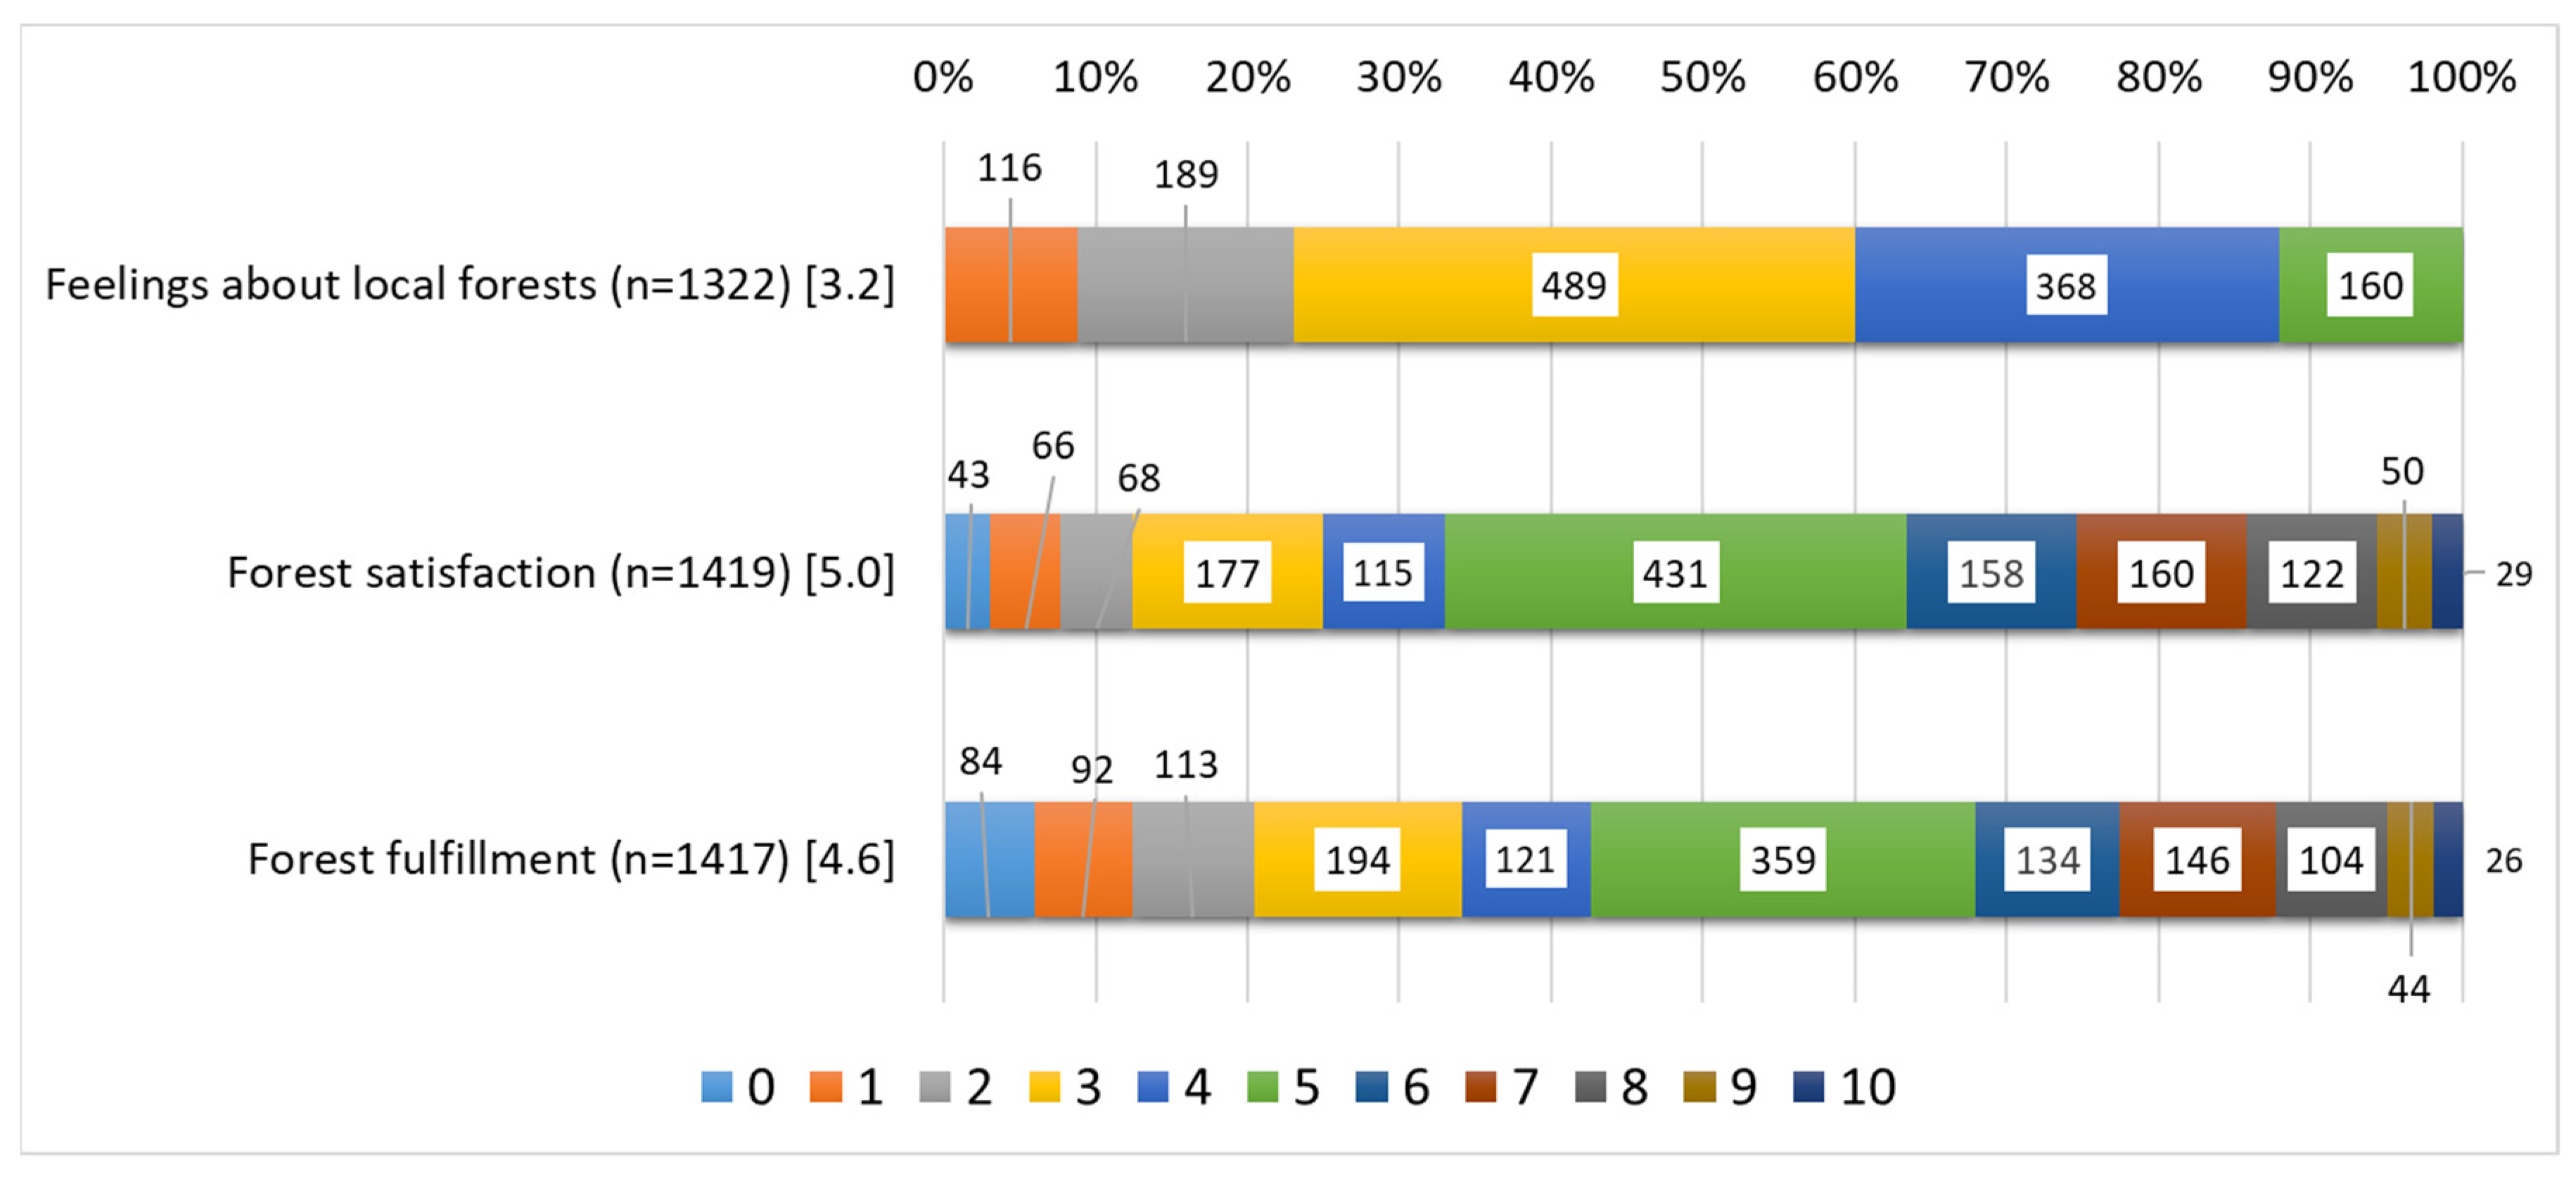
Figure 3 presents the distributions of responses to the forest SWB items. The values in brackets indicate the average scores. Similar to the previous assessment, the responses are distributed widely, indicating sufficient variation in responses.
Figure 4 presents the distribution of forest SWB evaluated by respondents considering their affect (feelings). The values in brackets indicate the average. In general, respondents reported a higher frequency for positive affect than for negative affect. Nearly all indicators for the positive affect, such as “Forward-looking,” “Pleasant,” and “Happy,” have higher scores than the mid-point (3.0) between 1 and 5; except for “Satisfied” [2.9] and “Proud” [2.6]. All the indicators for the negative affect, such as “Backward-looking,” “Not Pleasant,” “Sad,” “Fearful,” “Angry,” and “Shameful,” have lower scores than the mid-point (3.0). Although the number of responses in the second survey was 1457, the number of responses to complete the emotion items ranged from 647 to 842, because respondents who did not engage with forests were instructed not to answer these questions.
The validity of these measures was examined [42]. These measures are based on the manual for measuring SWB by the OECD [43]. While these measures concentrate on a specific domain, that is, relationships with forests, this treatment is justified by studies in psychology, in which a domain-specific SWB, such as the job and marriage of a participant, are measured [43]. Construct validity was verified using confirmatory factor analysis; the results obtained were satisfactory [42].
Ordinary least squares (OLS) regressions were performed in STATA to identify significant associations (p < 0.10) between forest SWB, demographic factors, and (i) natural, (ii) man-made, and (iii) social capitals, with positive and negative coefficients indicating the direction of these associations (Table 5). In the written explanation of the results to follow, the numbers for each variable in Table 5 will be used in text to refer to their corresponding variables.
Considering the groups of variables, certain demographic variables have positive or negative correlations with the indicators.
  • Subjective health was positively correlated with forest SWB (2–1, 3–1, 4–1, 5–1).
  • Female respondents were more likely to report higher forest SWB (2–3, 5–2, 6–1).
  • Age correlated with forest SWB (2–2, 2–8). As the age terms and the age squared had negative and positive coefficients, respectively, in the “2 Feeling regarding local forests” analysis for the upper watershed survey, age and forest SWB had a curvilinear, U-shaped relationship with the lowest point at a positive age. The authors determined that the age of 53 had the lowest point.
  • Respondent jobs had positive and negative relationships with forest SWB. Individuals working in forestry (4–4) and agriculture (3–2, 4–3) had positive relationships, while those working in business (2–9) and studying at school (2–11, 3–6, 4–9) had negative relationships.
Next, we consider the variables indicating respondent behavior regarding forests.
  • Observing animals and plants (5–6, 6–4) had a positive relationship with forest SWB.
  • Recreational activities, such as climbing/skiing (3–3, 4–5, 5–5, 6–2), and fishing/collecting mountain vegetables (2–7, 3–4, 6–3) were positively related to forest SWB.
  • Management of privately owned forests (3–5, 4–6) had a positive relationship with forest SWB, and management of community forests (5–9) had a negative relationship.
  • Ownership of forests (2–12, 3–7, 4–10, 5–10, 6–6) was negatively related to forest SWB.
Unexpectedly, the authors did not identify a relationship between the physical presence of the forests and forest SWB.
  • The forest ratios of the respective postal areas where the respondents resided did not correlate with the forest SWB.
The adjusted R2 values for models with dependent variables 2–6 (forest SWB) were 0.103, 0.116, 0.151, 0.160, and 0.107, respectively. All F-statistic p-values of the corresponding OLS were less than 0.0001. The adjusted R2 values for models of general SWB were larger than those for the forest SWB (0.415).

4. Discussion

The reviewed studies suggest that forest SWB varied among respondents and correlated with respondents’ engagement with local forests, such as forest-related activities and forest ownership. Forest ownership negatively correlated with forest SWB, indicating owner dissatisfaction with the unprofitability of timber producing forestry in contemporary Japan [42].

4.1. Rationales for Forest SWB as a Policy Indicator

In addition to these findings, based on the following four rationales, we argue that forest SWB can be an additional and promising policy indicator that complements the existing physically oriented indicators focusing on areas and volumes of forests.
The first rationale is that the direct measurement of well-being is preferable to indirect measurements, such as the gross domestic product (GDP). In the field of economics, income or GDP is used as an approximate measure for estimating individual well-being. Although researchers or policymakers frequently use economic indicators such as household income or GDP, such indicators neglect significant aspects of the forest ecosystem services. More specifically, individuals working in forestry constitute a relatively small portion of the population in Japan. In the entire watershed survey, only 0.3% of respondents worked in forestry and 1.4% worked in forestry in the upper watershed survey. Owing to the low profitability of forest management, few individuals work in forestry, even in the upper watershed. However, a significant portion of the respondents in the upper watershed (42%) owned forests. Furthermore, income from forestry constitutes only 0.04% of the GDP in Japan as of 2018 [46]. Only using economic indicators masks the important aspects of forest ecosystem services outside of income, such as venues for recreational activities or the embodiment of family traditions “that are central to quality of life and cultural identity” [47]. Engagement with animals and plants presents a positive correlation with forest SWB among some of the OLS analyses; mountain climbing and management of privately owned forests also had a positive relationship with forest SWB in the upper watershed study. An assessment relying on income measures overlooks these aspects of human–forest interactions because they represent only an insignificant amount in terms of money.
Second, SWB captures the quality of human interactions with forests, an aspect that is often missing in quantitative indicators, such as in the Montreal Process and Pan-European Process for Sustainable Forest Management. Here, we examine these indicators as international standards for sustainable forest management because the international community of policymakers and researchers of intergovernmental panels agreed on these, based on up-to-date knowledge of forest management and the practicality of their applications. For example, the Montreal process includes the following criteria:
Criterion 1: Conservation of biological diversity.
Criterion 2: Maintenance of the productive capacity of forest ecosystems.
Criterion 3: Maintenance of the forest ecosystem health and vitality.
Criterion 4: Conservation and maintenance of soil and water resources.
Criterion 5: Maintenance of forest contributions to global carbon cycles.
Criterion 6: Maintenance and enhancement of long-term multiple socioeconomic benefits.
Criterion 7: Legal, institutional, and economic frameworks for forest conservation and sustainable management.
Criterion 6 reflects the quality of citizen interactions with the forests. This aspect is becoming more significant in urbanized societies because urban residents do not have traditional relationships with forests, such as harvesting trees, mountain vegetables, and mushrooms. A national report from Japan on this process, the “State of Japan’s Forests and Forest Management—3rd Country Report of Japan to the Montreal Process” presents the national survey results of changes in public expectations of forests (ranking) for indicator 6.5.b: the importance of forests to people. Currently, the national government cannot sufficiently monitor the quality of citizen interactions with forests because there is no verified method. Forest SWB may be an indicator of this aspect.
Third, SWB could identify inequalities between populations regarding access to or use of forest ecosystem services. As demonstrated by the reviewed studies, forest ownership, which is more prevalent in the upper watershed, unexpectedly presented a negative correlation with forest SWB. In contrast, urban residents are more likely to enjoy forest ecosystem services. The low levels of forest SWB for forest owners may reflect that forest management heavily burdens them, given the low profitability of timber-producing forestry; on the other hand, urban residents could receive forest ecosystem services without paying a price for them, other than taxes. Such an asymmetric pattern of forest SWB between stakeholders can indicate inequalities surrounding free access to or use of the forest ecosystem services, that is, the public goods nature of certain forest ecosystem services, as well as the cost burden of managing forests.
The fourth rationale is that SWB is a more holistic indicator that can capture subjective perspectives of respondents. The current studies’ surveys included not only the economically rational evaluation by the respondents, but also responses of “feelings” towards forests. Forest restoration is a global trend and we face new challenges for improving forests qualitatively. For example, we may further need more forests with giant trees, which inspire visitors aesthetically or spiritually. Forest SWB measurements could better capture the perceived ecological qualities of forests, as well as the psychological and sociological forest–human interactions, such as access to and use of forests.
The current form of forest SWB has some limitations. A thorough representation of the forest ecosystems and the interactions between forests and humans may be limited. Forest SWB is not a rich, fully realistic description of forests or forest–human interactions; rather, it could be considered as a policy “indicator”. For example, body temperature alone does not indicate a complete representation of health; however, it is used as an indicator of health because it is useful for monitoring health. This example demonstrates that the simplistic nature of forest SWB does not necessarily invalidate its use as a policy indicator.

4.2. Possibilities and Challenges for Forest SWB

Furthermore, forest SWB can contribute to enhancing urban–rural cooperation. Policy entrepreneurs could identify opportunities for improving the SWB of urban residents by identifying activities that positively correlate with their forest SWB. Rural communities could provide such opportunities to urban residents and potentially receive some rewards (e.g., human resource and monetary resource) from them. Conversely, higher levels of forest SWB in certain rural communities may suggest novel ways to improve forest SWB with innovative lifestyles or activities. Researchers could identify urban–rural combinations to enhance mutually beneficial relationships among forest SWB. For example, policy measures, such as payment for ecosystem services (PES) and product certification would coordinate the relationship between forest owners and urban residents.
Forest SWB may have future applications for developing countries as well. Researchers and practitioners in developing countries may claim that forest SWB could provide useful information only for a certain group of industrialized countries where forest restoration has been achieved, and not for developing countries, where forest destruction and poverty are more urgent issues. However, as Mather suggests, one reason for restoring forests is the change in feelings of individuals [2], thus forest SWB should be monitored, and factors influencing forest SWB should be investigated also in developing countries.
In the field of conservation, overall SWB (not forest SWB) is considered to be a potential policy indicator in developing countries. Biedenweg and Gross-Camp proposed to incorporate well-being into conservation dialogues for the two following reasons: (1) conservation without considering the well-being of affected individuals will fail, and (2) environmental justice requires considering well-being, including the distribution of costs and benefits of conservation [48]. Social impact assessment with subjective well-being measurement in the Global South was also proposed [49]. Several empirical studies have assessed the relationship between forest management and SWB in developing countries. A study measured the subjective well-being of residents in an area of the Brazilian Amazon and found no correlation with the participation in logging projects [50]. Another study evaluated the impact of REDD+ on the subjective well-being of 4000 households in 130 villages in Brazil, Peru, Cameroon, Tanzania, Indonesia, and Vietnam [51]. Researchers and practitioners in the field of resource management may be able to gain a better understanding by learning from these examples and focusing on local contexts as well as scientific rigor with practical considerations.
Considering governmental policies in developing countries, the Bhutanese government monitors the well-being of individuals, which involves subjective aspects and relationships with the natural environment and sets a gross national happiness (GNH) level as the national goal [52,53]. These examples are worth examining for incorporating SWB into forest policies.
Here, we propose several possibilities indicating why the models presenting the forest SWB had lower R2 values than those for the general SWB. This can help improve the analytical capabilities of models used for future studies. First, the models for forest SWB may have missing factors that determine the levels of forest SWB. For example, personality traits, such as extraversion or introversion, may exert a stronger influence on forest SWB than on general SWB. Second, the measurement of explanatory variables may be inappropriate. The intensity of forest-related activities was found to correlate with the general SWB or the evaluation of forest spaces for recreational purposes [29,31]. The current models assess the levels of forest-related activities as yes-or-no experiences during the past year. A change from binary to graded measurements may improve the explanatory power of the models. Third, forest SWB may involve more measurement errors than the general SWB. Respondents may have greater difficulty assessing their SWB in this specific domain of their lives. Future studies can explore these possibilities by including new explanatory variables and improving the measurement methods.

5. Conclusions

This study proposes forest SWB as a promising policy indicator based on measurement trials in Japan. Studies 1 and 2 suggest that there was variation in respondents’ level of self-reported measures of forest SWB and forest SWB was significantly associated with some demographic variables and behaviors related to forest interactions. We further discussed the following rationales for using forest SWB as a policy indicator: (1) direct measurement of well-being—SWB is preferable to indirect measurements such as income levels; (2) well-being measures are influenced by respondents’ interactions with forests; (3) inequalities among stakeholders can be identified; (4) SWB represents a holistic measurement.
Despite these novel findings and suggestions, challenges remain in establishing forest SWB as a policy indicator. Survey instruments for measuring forest SWB have not been standardized. Based on several measurement trials, we should ensure that survey instruments, especially survey questions, are valid and reliable. Efforts to improve the explanatory power of models explaining forest SWB should be increased. The mechanism for determining forest SWB should be further investigated. Although we attempted to control endogeneity by estimating the average treatment effect based on an endogenous treatment-regression model [36], other methods such as randomized controlled tests or the regression discontinuity design may provide more unbiased and efficient results. Measurements among different populations (e.g., different countries and regions) may reveal the generality or specificity of forest SWB and could contribute to revealing hidden mechanisms.

Author Contributions

All authors made contributions to the conception of this paper. T.T. and Y.U. designed the questionnaire instrument. T.T. led the questionnaire survey, data analysis and drafting, and Y.U., H.I. and N.O. critically reviewed drafts for intellectual content and revised them. All authors have read and agreed to the published version of the manuscript.

Funding

This research was funded by Research Institute for Humanity and Nature for the project, “Biodiversity-driven Nutrient Cycling and Human Well-being in Social-Ecological Systems (D06-14200119)” and JSPS KAKENHI Grant-in-Aid for Scientific Research (B) 15H02871 and (B) 20H03090.

Institutional Review Board Statement

This statement is not applicable to the current review article.

Informed Consent Statement

This statement is not applicable to the current review article.

Data Availability Statement

Data sharing not applicable.

Acknowledgments

Kimberly Bowen provided valuable comments and suggestions to the manuscript.

Conflicts of Interest

The authors declare no conflict of interest.

References

  1. United Nations, Department of Economic and Social Affairs, P.D. World Urbanization Prospects: The 2018 Revision (ST/ESA/SER.A/420); United Nations: New York, NY, USA, 2019; pp. 1–103. [Google Scholar]
  2. Mather, A.S. The forest transition. Area 1992, 24, 367–379. [Google Scholar]
  3. Mather, A.; Needle, C.L. The forest transition: A theoretical basis. Area 1998, 30, 117–124. [Google Scholar] [CrossRef]
  4. MacDonald, H.; McKenney, D. Envisioning a global forest transition: Status, role, and implications. Land Use Policy 2020, 99, 104808. [Google Scholar] [CrossRef]
  5. Ota, T. Forest Saturation: Thinking about Changing National Land; NHK Publishing: Tokyo, Japan, 2012; pp. 1–254. [Google Scholar]
  6. Weible, C.M.; Sabatier, P.A. (Eds.) Theories of the Policy Process; Westview Press: New York, NY, USA, 2018; pp. 1–416. [Google Scholar]
  7. IPBES. Summary for Policymakers of the Global Assessment Report on Biodiversity and Ecosystem Services of the Intergovernmental Science-Policy Platform on Biodiversity and Ecosystem Services; Díaz, S., Settele, J., Brondízio, E.S., Ngo, H.T., Guèze, M., Agard, J., Arneth, A., Balvanera, P., Brauman, K.A., Butchart, S.H.M., et al., Eds.; IPBES: Bonn, Germany, 2019; pp. 1–45. [Google Scholar]
  8. Ministry of Agriculture, Forestry and Fisheries. National Forest Plan (Approved by the Cabinet on October 16, 2018); Ministry of Agriculture, Forestry and Fisheries: Tokyo, Japan, 2018; pp. 1–30.
  9. Akiyama, T. Attitudes of members of forest owner’s associations toward forestry and challenges for the associations: Based on the result of questionnaire surveys. Financ. Agric. For. 2008, 61, 27–41. [Google Scholar]
  10. Forestry Agency. White Paper of Forests and Forestry (Heisei 29 (2017)); Forestry Agency: Tokyo, Japan, 2018; pp. 1–246.
  11. FAO. Global Forest Resources Assessment 2015 (FRA 2015); FAO: Rome, Italy, 2015; pp. 1–244. [Google Scholar]
  12. Eid, M.; Larsen, R.J. (Eds.) The Science of Subjective Well-Being; The Guilford Press: New York, NY, USA, 2008; pp. 1–546. [Google Scholar]
  13. Diener, E. Subjective well-being: The science of happiness and a proposal for a national index. Am. Psychol. 2000, 55, 34–43. [Google Scholar] [CrossRef]
  14. Diener, E.; Lucas, R.E.; Oishi, S. Subjective well-being: The science of happiness and life satisfaction. In Handbook of Positive Psychology; Snyder, C.R., Lopez, S.J., Eds.; Oxford University Press: Oxford, UK, 2002; pp. 63–73. [Google Scholar]
  15. Kahneman, D.; Wakker, P.; Sarin, R. Back to Bentham? Explorations of experienced utility. Quart. J. Econ. 1997, 112, 375–405. [Google Scholar] [CrossRef] [Green Version]
  16. Frey, B.S.; Stutzer, A. What can economists learn from happiness research? J. Econ. Lit. 2002, 40, 402–435. [Google Scholar] [CrossRef]
  17. Dolan, P.; Peasgood, T.; White, M. Do we really know what makes us happy? A review of the economic literature on the factors associated with subjective well-being. J. Econ. Psychol. 2008, 29, 94–122. [Google Scholar] [CrossRef]
  18. Millennium Ecosystem Assessment. Millennium Ecosystem Assessment. Available online: https://www.millenniumassessment.org/en/Global.html (accessed on 2 July 2020).
  19. Costanza, R.; de Groot, R.; Braat, L.; Kubiszewski, I.; Fioramonti, L.; Sutton, P.; Farber, S.; Grasso, M. Twenty years of ecosystem services: How far have we come and how far do we still need to go? Ecosyst. Serv. 2017, 28, 1–16. [Google Scholar] [CrossRef]
  20. Kopmann, A.; Rehdanz, K. A human well-being approach for assessing the value of natural land areas. Ecol. Econ. 2013, 93, 20–33. [Google Scholar] [CrossRef]
  21. Ambrey, C.L.; Fleming, C.M. Valuing Ecosystem Diversity in South East Queensland: A Life Satisfaction Approach. Soc. Indic. Res. 2014, 115, 45–65. [Google Scholar] [CrossRef] [Green Version]
  22. Ambrey, C.L.; Fleming, C.M. Valuing scenic amenity using life satisfaction data. Ecol. Econ. 2011, 72, 106–115. [Google Scholar] [CrossRef] [Green Version]
  23. Bertram, C.; Rehdanz, K. The role of urban green space for human well-being. Ecol. Econ. 2015, 120, 139–152. [Google Scholar] [CrossRef] [Green Version]
  24. Krekel, C.; Kolbe, J.; Wüstemann, H. The greener, the happier? The effect of urban land use on residential well-being. Ecol. Econ. 2016, 121, 117–127. [Google Scholar] [CrossRef] [Green Version]
  25. Tsurumi, T.; Managi, S. Environmental value of green spaces in Japan: An application of the life satisfaction approach. Ecol. Econ. 2015, 120, 1–12. [Google Scholar] [CrossRef]
  26. Tsurumi, T.; Imauji, A.; Managi, S. Greenery and Subjective Well-being: Assessing the Monetary Value of Greenery by Type. Ecol. Econ. 2018, 148, 152–169. [Google Scholar] [CrossRef]
  27. Kunugi, Y.; Arimura, T.H.; Nakashizuka, T.; Oguro, M. Subjective well-being and natural capital in Japan—An empirical analysis using micro data. Environ. Sci. 2017, 30, 96–106. [Google Scholar]
  28. Holmes, T.; Koch, F. Bark Beetle epidemics, life satisfaction, and economic well-being. Forests 2019, 10, 696. [Google Scholar] [CrossRef] [Green Version]
  29. Jang, Y.-S.; Yoo, R.-H.; Lee, J.-H. The Effects of Visit Characteristics in Neighborhood Forest on Individual Life Satisfaction. J. People Plants Environ. 2019, 22, 677–690. [Google Scholar] [CrossRef] [Green Version]
  30. Lafortezza, R.; Giuseppe Carrus, G.; Sanesi, G.; Clive Davies, C. Benefits and well-being perceived by people visiting green spaces in periods of heat stress. Urban For. Urban Green. 2009, 8, 97–108. [Google Scholar] [CrossRef]
  31. Carrus, G.; Scopelliti, M.; Lafortezza, R.; Colangelo, G.; Ferrini, F.; Salbitano, F.; Agrimi, M.; Portoghesi, L.; Semenzato, P.; Sanesi, G. Go greener, feel better? The positive effects of biodiversity on the well-being of individuals visiting urban and peri-urban green areas. Landsc. Urban Plan. 2015, 134, 221–228. [Google Scholar] [CrossRef]
  32. Bieling, C.; Plieninger, T.; Pirker, H.; Vogl, C.R. Linkages between landscapes and human well-being: An empirical exploration with short interviews. Ecol. Econ. 2014, 105, 19–30. [Google Scholar] [CrossRef] [Green Version]
  33. Lee, W.H.; Ambrey, C.; Pojani, D. How do sprawl and inequality affect well-being in American cities? Cities 2018, 79, 70–77. [Google Scholar] [CrossRef] [Green Version]
  34. MacKerron, G.; Mourato, S. Happiness is greater in natural environments. Glob. Environ. Chang. 2013, 23, 992–1000. [Google Scholar] [CrossRef] [Green Version]
  35. Wei, H.; Hauer, R.J.; Chen, X.; He, X. Facial expressions of visitors in forests along the urbanization gradient: What can we learn from selfies on social networking services? Forests 2019, 10, 1049. [Google Scholar] [CrossRef] [Green Version]
  36. Takahashi, T.; Asano, S.; Uchida, K.; Takemura, K.; Fukushima, S.; Matsushita, K.; Okuda, N. Effects of forests and forest-related activities on the subjective well-being of residents in a Japanese watershed: An econometric analysis through the capability approach. For. Policy Econ. 2021. under review. [Google Scholar]
  37. Ministry of Land, Infrastructure, Transport and Tourism. I.Land and Climate of Japan. Available online: https://www.mlit.go.jp/river/basic_info/english/land.html (accessed on 2 November 2020).
  38. Takahashi, T. Attitudes of Residents in the Southern Shiga Watershed toward Forests: Investigation of its Structure based on a Questionnaire Survey. J. Rural Probl. 2009, 45. [Google Scholar] [CrossRef] [Green Version]
  39. Shiga Prefecture. Statistical Book of Shiga Prefecture. 2018. (Siga ken toukeisyo, Heisei 30 nendo, 2018 nendo); Shiga Prefecture: Otsu, Japan, 2020.
  40. Ministry of Internal Affaiirs and Communication. National Census 2015; Ministry of Internal Affaiirs and Communication: Tokyo, Japan, 2017.
  41. Naumann, N. Yama no Kami (Yama no Kami: Die japanische Berggottheit); Gensosha: Tokyo, Japan, 1994. [Google Scholar]
  42. Takahashi, T.; Uchida, Y.; Ishibashi, H.; Okuda, N. Factors affecting forest-related subjective well-being: A case study in the upper Yasu River watershed. J. Jpn. For. Soc. 2021, 103. in press. [Google Scholar]
  43. OECD. OECD Guidelines on Measuring Subjective Well-being; OECD Publishing: Paris, France, 2013; pp. 1–265. [Google Scholar]
  44. Ryff, C.D.; Keyes, C.L.M. The structure of psychological well-being revisited. J. Pers. Soc. Psychol. 1995, 69, 719. [Google Scholar] [CrossRef] [PubMed]
  45. Aristotle. Aristotle’s Nicomachean Ethics; The University of Chicago Press: Chicago, IL, USA, 2011. [Google Scholar]
  46. Forestry Agency. White Paper of Forests and Forestry (Reiwa 1 (2019)); Forestry Agency: Tokyo, Japan, 2020.
  47. IPBES. Report of the Plenary of the Intergovernmental Science-Policy Platform on Biodiversity and Ecosystem Services on the Work of Its Seventh Session; IPBES: Bonn, Germany, 2019. [Google Scholar]
  48. Biedenweg, K.; Gross-Camp, N.D. A brave new world: Integrating well-being and conservation. Ecol. Soc. 2018, 23, 1–4. [Google Scholar] [CrossRef]
  49. Woodhouse, E.; Homewood, K.M.; Beauchamp, E.; Clements, T.; McCabe, J.T.; Wilkie, D.; Milner-Gulland, E.J. Guiding principles for evaluating the impacts of conservation interventions on human well-being. Philos. Trans. R. Soc. B Biol. Sci. 2015, 370. [Google Scholar] [CrossRef]
  50. Cooper, N.A.; Kainer, K.A. To log or not to log: Local perceptions of timber management and its implications for well-being within a sustainable-use protected area. Ecol. Soc. 2018, 23. [Google Scholar] [CrossRef] [Green Version]
  51. Duchelle, A.E.; de Sassi, C.; Jagger, P.; Cromberg, M.; Larson, A.M.; Sunderlin, W.D.; Atmadja, S.S.; Resosudarmo, I.A.P.; Pratama, C.D. Balancing carrots and sticks in REDD+: Implications for social safeguards. Ecol. Soc. 2017, 22. [Google Scholar] [CrossRef] [Green Version]
  52. Centre for Bhutan Studies. A Compass Towards a Just and Harmonious Society 2015 GNH Survey Report; Centre for Bhutan Studies: Timphu, Bhutan, 2016; pp. 1–334. [Google Scholar]
  53. Centre for Bhutan Studies; GNH. Happiness: Tranforming the Development Landscape; Centre for Bhutan Studies: Timphu, Bhutan, 2017; pp. 1–475. [Google Scholar]
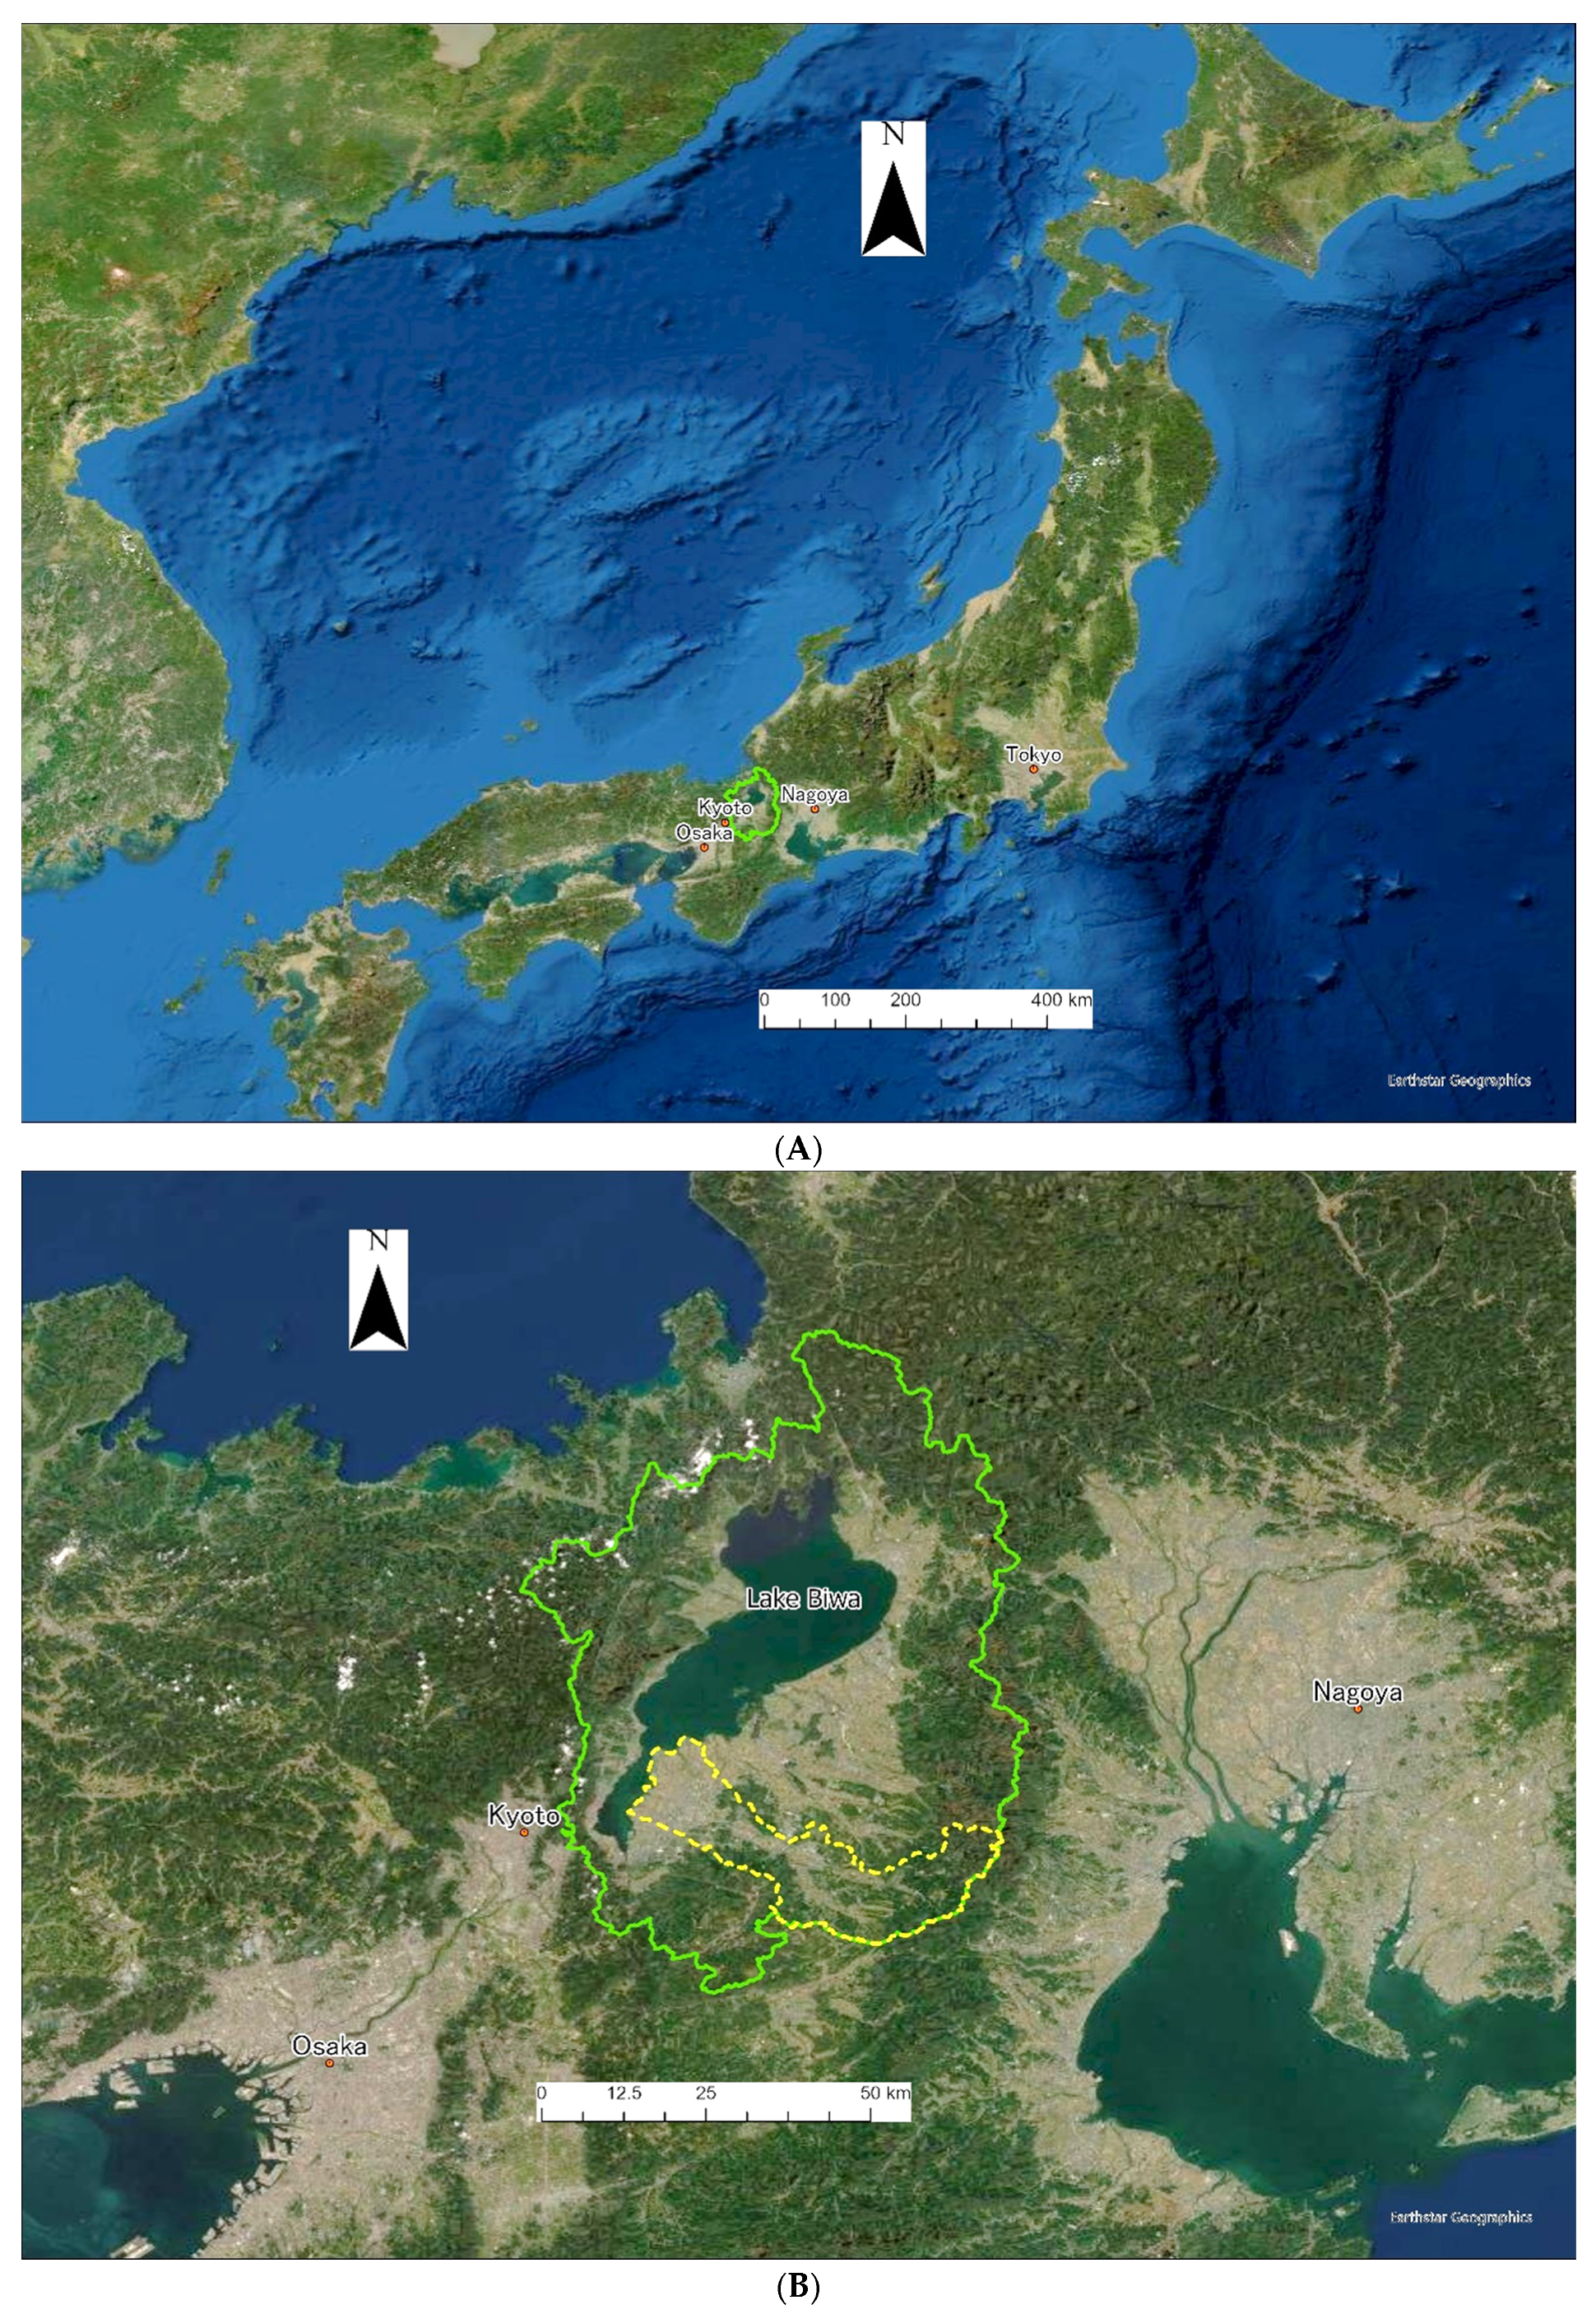
Figure 1. (A) Map of the study site (green line indicates Shiga Prefecture). All maps were drawn using ArcGIS Pro. (B) Map of the study site (green line indicates Shiga Prefecture, and yellow dotted line indicates the Yasu River watershed). The shapefile for the Yasu River watershed was provided by Dr. Satoshi Asano. (C) Map of the study site (3D representation).
Sustainability 13 03211 g001aSustainability 13 03211 g001b
Figure 2. Forest subjective well-being (SWB) in the entire watershed study (feelings regarding local forests) [36]. The authors gave permission to use this chart.
Sustainability 13 03211 g002
Figure 3. Forest SWB in the upper watershed study [42]. The authors gave permission to use this chart.
Sustainability 13 03211 g003
Figure 4. Forest SWB (positive and negative affect) in the upper watershed study [42]. The authors gave permission to use this chart.
Sustainability 13 03211 g004
Table 1. Structure of National Forest Plan (approved by the Cabinet on 16 October 2018) [8].
ChaptersSubchapters
I. Goals and other basic issues 1 Principles of forest management and protection
2 Goals of forest management and protection
II. Forest management1 Harvesting/planting and thinning/tending
2 Publicly beneficial forests
3 Forest road construction and transportation of forest products
4 Rationalization of forest management
III. Forest protection1 Forest land protection
2 Facilities
3 Protection from pests and fires
IV. Improvement of health-enhancing function of forests1 Principles of setting up forests for health-enhancing function
2 Principles of management of forests for health-enhancing function
3 Other necessary issues
Table 2. Forest resources assessment (FRA) 2015 analysis data table [11].
TOPIC/Variable
Extent Area
Forest area
Other wooded land
Other land
of which with tree cover
Forest Characteristics
Primary forest
Other naturally regenerated forest
Planted forest
Area of mangrove forest
Growing Stock, Biomass and Carbon
Forest growing stock
Above-ground biomass
Below-ground biomass
Dead wood
Carbon in above-ground biomass
Carbon in below-ground biomass
Carbon in dead wood
Carbon in litter
Soil carbon
Production and Multiple use
Production forest
Multiple use forest
Biodiversity and Protected Areas
Conservation of biodiversity
Forest area within protected areas
Ownership of Forests
Public ownership
Private ownership
Unknown ownership
Management Rights of Public Forests
Public administration
Individuals
Private companies
Communities
Other
Employment in Forestry
Employment in forestry
Table 3. Yasu River watershed [36,39].
TopicsDescriptions
Coverage and sizeThe Yasu River tributary to Lake Biwa, the largest lake in Japan, is 65.3 km long with a watershed area of 387.0 km2.
Society and economyThe watershed covers six municipalities with a combined population of 479,000 in 2015.
The downstream areas consist of urban/rural mixed land with thriving commercial and industrial sections that capitalize on the advantages of the major railroads and motorways connecting the eastern and western areas of the country.
The upstream areas are also urbanized to a lesser extent; most of this area is rural, with forestry (timber production) activities occurring within.
ForestsThe total forested area in the six cities consists of 39,902 ha, comprising 51% of the total land area, while the forest ratios range from 6% to 55% among the six cities.
49% are plantation forests, and the ratios of plantation forests among the six cities vary from 0% to 67%.
Forests owned by households are the largest category in terms of ownership (44%), followed by corporate (7%), and national forests (7%) in the six cities.
The forests in the watershed are classified as temperate and are composed of (i) plantation forests dominated by Japanese cedar (Cryptomeria japonica) and cypress (Chamaecyparis obtusa), and (ii) natural forests dominated by konara oak (Quercus serrata).
Table 4. Summary results of regression analyses of the entire watershed study: explanatory variables with positive and negative statistically significant coefficients (p < 0.10) * [36].
Dependent VariablesExplanatory Variables: Positive Coefficients Explanatory Variables: Negative Coefficients
Entire Watershed
1 Feeling regarding local forests1 Subjective health
2 Age (squared)
3 Social interaction
4 Working in forestry
5 Working in fishery
6 School education level
7 Leisure activities in forests
8 Seeing forests from homes
9 Engagement with wildlife
10 Working in business
11 No engagement with forests
12 Interaction terms between forest ratios and forest-related activities (leisure, observing from home, and engagement with wildlife)
(no relation found)
Areal ratio of forests in the area the respondent lives
Areal ratios of natural or plantation forests in the area the respondent lives
* Explanatory variables representing built or manufactured capital such as hospitals are omitted from this table for simplicity.
Table 5. Summary results of regression analyses in the upper watershed study: explanatory variables with positive and negative statistically significant coefficients * (p < 0.10) [42].
Dependent VariablesExplanatory Variables: Positive Coefficients Explanatory Variables: Negative Coefficients
Upper watershed
2 Feelings regarding local forests1 Subjective health
2 Age (squared)
3 Female
4 Number of family members
5 School education level
6 Social interaction within local community
7 Fishing/collecting mountain vegetables
8 Age
9 Working in business
10 Part-time job
11 Student
12 Ownership of forests
3 Forest satisfaction1 Subjective health
2 Working in agriculture
3 Climbing/skiing
4 Fishing/collecting mountain vegetables
5 Management of privately owned forest
6 Student
7 Ownership of forests
4 Forest fulfillment1 Subjective health
2 Working as a civil servant
3 Working in agriculture
4 Working in forestry
5 Climbing/skiing
6 Management of privately owned forest
7 Management of forests as a volunteer
8 Female
9 Student
10 Ownership of forests
5 Positive affect1 Subjective health
2 Female
3 Interaction with community members
4 Camping
5 Climbing/skiing
6 Observing animals and plants
7 Wood-working
8 Part-time job
9 Management of community forests
10 Ownership of forests
6 Negative affect **1 Female
2 Climbing/skiing
3 Fishing/collecting mountain vegetables
4 Observing animals and plants
5 Plantation ratio of forests owned
6 Ownership of forests
All five dependent variables(No relation found)
Areal ratio of forests in the area the respondent lives
* Variables indicating built or manufactured capital, such as hospitals, are omitted from this table for simplicity. ** As the dependent variable was reversed, “positive” indicates that an increase in the explanatory variable leads to a decrease in the negative affect, and vice versa.
Publisher’s Note: MDPI stays neutral with regard to jurisdictional claims in published maps and institutional affiliations.