Abstract
In the context of growing concerns regarding the deterioration of the environment and the increase in social inequalities, the concept of sustainability emerged as a response of companies, in order to contribute to community goodwill. The drivers and obstacles for the businesses engaging in sustainable policies have been explored at large by scientific literature. However, research gaps were observed, namely regarding SMEs, that tend to have a less formal and more fragmented approach to sustainability. The goal of our study is to determine the main barriers and facilitators for sustainability that Romanian SMEs face, and the connections between them and with the firms’ characteristics. Our study identifies the main barriers and facilitators for adopting sustainable practices in SMEs located in Romania, based on a study on a panel of 71 firms. The association rule method of data mining and quantitative statistic methods were used to explore barrier–facilitator relationships and how they vary depending on the firms’ or managers’ characteristics. The results show a wide range of drivers and obstacles for implementing sustainability in SMEs, while identifying connections between different barriers and facilitators and correlations with the firms’ characteristics. Our findings contribute to a better understanding of factors that impact sustainable behavior in SMEs and identify further aspects to be explored.
1. Introduction
Our work wishes to investigate the different facilitators and barriers to sustainability in the context of SMEs—firms with less than 250 employees—operating in Romania, the connections between them and the characteristics of the firm and managers. First, we explain the concept of sustainability and its reflection within the business sector, the corporate social responsibility. Following this, we present the specificities regarding the sustainable practices for SMEs, but also the obstacles and drivers for a firm to integrate responsible practices. The quantitative methods used for the study are the descriptive analysis, contingency tables, the Chi-square test or the Fischer test to identify the connections between the barriers or facilitators and the firms’ characteristics, association rule mining and network analysis to determine the links between the factors. The data collected through these methods is presented in the Results section, while in the Discussion and Conclusions section, we synthetize and comment our main findings.
The term “sustainability”, with Latin origins, designates the capacity of the ability of a matter to maintain itself with no external support. More specifically, sustainability is illustrated as a paradigm [1] in which the environmental, social and economic dimensions are in balance, in order to improve quality of life for present and future generations. Sustainable development is the institutional reflection—through the United Nations and the Brundtland Commission [2]—of this concept, and it includes both the transgenerational dimension and the triple bottom line approach [3] (pp. 52–53). This is the most widely known and accepted definition of sustainable development, among more than 50 proposed by academic literature.
Many authors pointed out the difficulties of implementing sustainable development [4] (pp. 141–149), linked to its complex multi-disciplinary interactions (e.g., philosophic, legal, economic) and to the challenges of operationalizing this term. In this context, the concept of “social ecology” emerged [5] (pp. 8–15), connecting the wish to protect the environment with the needs of the society or communities in which this ideal is accomplished.
Similarly, the notion of “corporate social responsibility” gradually took shape from the need to adapt the term sustainable development to the microeconomic level. In a review of the existing research on this topic and on the knowledge gaps, Aguinis and Glavas [6] (pp. 933–936) discuss the main academic papers that helped to understand the development of the social dimension (Berle in 1931, Dodd in 1932, Bowen in 1953, David and Frederick in 1960), and how it evolved toward the concept of “corporate social responsibility” (Carroll-1999, Waddock-2004, Wagner and Lutz, Peloza and Serenko and Bontis-2009). Based on these reviews, the authors state that corporate social responsibility (CSR) is defined as context-specific organizational actions and policies that take into account stakeholders’ expectations and the triple bottom line performance. Further research investigated how to measure the impact of CSR on financial performance (Peloza, 2009) [7] (pp. 1518–1541), while other authors (Carroll, Waddock) [8] (pp. 85–105) focused on the operationalization and the clarification of the concept, in order to measure or to assess it (Wood, 2010) [9] (pp. 50–84). Moreover, researchers [10] pointed out the way in which CSR creates value for stakeholders and its positive impact on the community.
However, Aguinis and Glavas’ work acknowledges that there is a fragmentation of the existing research on the corporate social responsibility. In particular, CSR is studied through different disciplinary and conceptual lenses. Furthermore, the concept was examined on many analysis levels, the approach being either of one level at the time and not simultaneously, or primarily studied at a macro level, neglecting its implications from the individual point of view. The microeconomic-focused studies are essential for the understanding the term, since the individual actors are the ones perceiving the CSR initiatives and take action as a result. Other gaps regarding the topic mentioned by the authors are poor research on the mediation effect (the processes and mechanisms through which CSR actions and policies lead to a particular outcome), or the need for multilevel and longitudinal research, but also for qualitative studies to better understand the underlying mechanisms of CSR. The European Commission stresses its complexity [11] (pp. 140–149) and dynamic features. The CSR involves not only internal factors (employees, human capital, health and safety, managing change, environmentally responsible practices related to production), but also external, beyond the doors of the company into the local community, involving a wide range of stakeholders (business partners, suppliers, customers, public authorities, NGOs, the environment). Today, CSR is taking into account increasingly more the external dimension, at the same time with the emergence of the concept of BSI (business stakeholder interface, or business society interface). On the other hand, the European Union’s definition of the concept links CSR practices intrinsically to business operations [12] (pp. 157–166), thus excluding corporate philanthropy and connecting CSR with the core of the firms’ operations.
While most corporations and large organizations are aware of the necessity of integrating the CSR principles in their activity and communicating their involvement to stakeholders, SMEs’ social and community actions are fragmented and often lack formality [11] (p. 143). Hence, many small businesses are engaged with at least part of the CSR range of policies, often not knowing this is that they are doing. This is the main reason our study focuses on SMEs’ CSR factors of influence. More specifically, our work wishes to understand how these factors act in the context of SMEs based in Romania. Moreover, our work aims at highlighting not only the connections between these factors, but also between them and the characteristics of the firm (size, profitability, managers’ typology), connections that are little presented in academic research. Our study thus has the following objectives: to identify barriers and facilitators experienced by managers of SMEs in the context of sustainable development, to identify which barriers and facilitators are frequently associated by managers, and to contribute to a better understanding of intervention measures for stimulating the adoption or implementation of sustainable practices. In the following two sections, we explore the specific ways that SMEs implement sustainable practices, that most authors consider different from the behavior of large corporations. At the same time, we examine the most frequent barriers and facilitators to sustainability mentioned in the academic literature. This step contributes to a better understanding of SMEs’ concerns regarding sustainability, but also to constructing the research tool (the questionnaire) with questions related to drivers and obstacles the managers face, as well as to the characteristics of the firms (size, profitability, managers’ gender, level of studies, age, customer typology).
2. The Sustainability and SMEs
In this section, we investigate the role of SMEs in the economy and society, pointing out their particularities in integrating sustainable strategies, which requires them to be treated differently compared to corporations as far as the research is concerned.
The academic research is unanimous in stating that SMEs have an important role in the economy, while presenting specificities that need to be taken into account as far as CSR is concerned. A study conducted by W. Luetkenhorst in 2004 [12] notes that 98% of companies in the European Union are small and medium-sized enterprises and that in some sectors such as textile, construction, furniture, they provide around 80% of the jobs. The author shows that countries with a high percentage of SMEs simultaneously have a relatively equal distribution of income and promote high social stability. Moreover, SMEs are a significant resource for innovation in niche markets that demand high flexibility and customized products. SMEs also serve as “grow labs” for innovation and risk-oriented product development.
In a study from 1999, Ram, cited by Moore and Spence [13] (pp. 219–226), pointed out already what appears to be one of the main specificities for SMEs: the basic antagonism between the capital and employment relationship, that can be reflected in cooperation, since employers need to secure workers’ willingness to work, while workers rely on the firms for their livelihood. As a corollary, it is perhaps the keen awareness of the employees’ reliance on the firms for their livelihood that is different from a larger firm.
Many studies regarding the adoption of sustainable development strategies in businesses outline the role of the manager–founder [14] (pp. 21–36), whose personal values and beliefs [15] (pp. 119–127) impact the strategic direction of the firm and its degree of sustainability. In an SME, the manager–founder has the greatest impact [16] (pp. 479–498) on the strategic choices and decisions to collaborate or not with certain stakeholders, particularly external. In a small firm, the involvement in sustainable development practices is mainly a conviction and a desire of the manager.
Spence and Rutherfoord have mentioned in 2001, cited by Moore and Spence, other significant particularities for SMEs that impact their way of addressing CSR. They reveal that in small businesses there is not a general orientation towards the maximization of profit. Moreover, competitors are often treated as moral stakeholders rather than adversaries in the marketplace. B. Kotey [17] (pp. 16–40) states that most SMEs are product focused, not having the time or competences to think about functional or organizational matters such as responsible business actions. Jones develops the concept of “moral intensity” for small businesses [18] (pp. 366–395), showing that they are well embedded in local communities, the proximity increasing the likelihood of moral behavior.
The specificities of small businesses require a close study on how they influence their attitudes and actions toward corporate social responsibility. Before we conducted our exploratory analysis on the drivers and obstacles met by SMEs from Romania, we examined the factors that positively and negatively impact the adoption of sustainable practices in small businesses, investigated by academic authors.
3. Facilitators and Barriers for Sustainability in SMEs
We reviewed the main facilitators and barriers for integrating sustainable development in small and medium-sized businesses, illustrated in the academic literature. It appears that most of them can either be a driver, or an obstacle, depending on the direction they impact the firm (positive or negative). For instance, Andreas et al. [19] (p. 11) mention the personal philosophy of the owner or founder of the firm to contribute to the wider good of the community. Others observed drivers are the legal restrictions or regulations as far as the environment and the social aspects are concerned, the actions of a couple of midlevel employees toward sustainability, the willingness to preserve the human capital, by offering the human resources more than a simple paycheck. The authors also outline the importance for the firm of being a positive example, by making a contribution to the welfare and well-being of society. These drivers can lead to a positive loop of sustainability; rather inexpensive initiatives and actions conducted in small businesses may generate measurable success that leads to more ambitious measures (doing well by doing good).
The same authors reveal the main financial, social and environmental benefits of sustainability programs. The firm can see its revenues increase by adopting sustainable policies through better branding and creation of a specific market niche; raising the awareness of consumers; providing innovative products or services; increased sales, market share and other competitive advantages; and selling renewable energy to utility companies or municipalities. Another benefit of sustainable programs that works as an incentive for managers is cost reduction, by lowering energy costs, material and packaging expenses, reducing the amount of waste and thus pollution taxes, but also through social positive impact (reducing employees’ turnover leads to lower training expenses). Moreover, sustainable policies can produce intangible benefits, such as a better reputation for the firm and gaining the respect of the community, attracting skilled and loyal employees, but also reducing the risk of non-compliance in the social and environmental field.
As far as the facilitators for sustainability are concerned, other authors [20] (pp. 111–114) indicate the conclusion of partnerships and agreements with stakeholders in the same community, the willingness to be a true leader that sets an example for other firms to follow, as well as communicating the social impact of the policies adopted by the firm. The business must show a proactive entrepreneurial spirit, looking for new business opportunities while implementing social innovation in order to be sustainable.
Aguinis and Glavas (2012) analyze the drivers for sustainable businesses at three levels: institutional (pressure from the stakeholders such as customers through their evaluation and product purchasing, etc., impacting thus the potential revenues and resources and the reputation of the firm; laws and regulations; standards and certification, with the potentially negative effect that they might reduce the focus on CSR, since the firm may become mainly concerned with symbolic activities that serve with minimally comply with requirements); organizational (the firm’s instrumental motivation, sense of responsibility and duty or stewardship, long term institutional ownership and top management equity, an organizational structure open to connections with society, financial outcomes); and individual level (commitment from employees and supervisors to CSR, congruence of individual values with organizational values, awareness of CSR guidelines, CSR training or attendance of CSR conferences, meeting employees’ developmental needs such as physiological, safety, affiliative, esteem, etc.).
The same authors classify the predictors for CSR in reactive (why the firm feel they must engage in CSR, mostly unwillingly) and proactive (why they choose to engage, that can be a desire to fulfill individual needs or enhance organizational values). The outcomes of engaging in CSR policies can be either external (reputation) or internal (diversity among employees). This study also identifies the concepts of mediator variables, such as relationships and values (why certain CSR initiatives lead to certain outcomes), and moderators (the four “P” s: people, price, place and profile of the firm).
Regarding the outcomes for adopting CSR practices, a study by Orlitzky et al. [21] (pp. 403–441) found a positive relationship between CSR and financial profitability. Sustainable practices are also linked to non-financial results, such as competitive advantage [22] (pp. 78–92), creating consumer goodwill and positive employees’ attitudes [23] (pp. 455–469), building corporate goodwill [24] (pp. 117–127), attractiveness to investors and financial institutions, and firm capabilities (product quality, efficient management and operational practices, improved demographic diversity, namely for women and minorities).
Many authors state that the inclusion of sustainable development principles in small businesses depends on their manager’s or owner’s personal attitudes. Accordingly, the business obstacles to sustainability are seen as personal barriers [25] (pp. 79–82). This can be illustrated by the time crisis and the subsequent lack of connection with the natural environment, materialism and over-consumption, avoiding negative communication or the feeling of guilt, the lack of a common frame of reference regarding sustainability in common language, which leads to confusion, and the lack of a unifying conservation or biodiversity ethic. Regarding the barriers, other academic works [26] (pp. 20–31) mention the “attitude-behavior gap”, which is reflected in the lack of changes in people’s lifestyle, regardless of consumers’ willingness to opt for greener alternatives. A worldwide survey on sustainable consumption conducted by WBCSD, cited by Partidario, Vicente and Belchior [27], concludes that the four main factors for non-adopting sustainable practices are related to a lack of understanding, resigned lifestyles, selfishness, and associated costs and taxes.
Concurrently, apart from obstacles related to the manager, academic authors identify other barriers to the adoption of sustainable measures in businesses. Bocken et al. [28] refer to the sustainability barriers as being on three levels: institutional, strategic and operational. In a case study for a credit union in the U.S.A. conducted by Andreas et al. (2011), it is shown that the resistance to change regarding green practices, coming from employees or customers, can make the difference for the commitment of the business to its sustainable values. The reluctance may come from their concerns for higher costs of being greener. The heterogeneity of attitudes toward sustainability among employees may result in difficulties to implement environmentally friendly measures at all levels or departments in the firm, provoking discrepancies within the company. Schaltegger et al. [29] (pp. 264–289) state that costly efforts for sustainability may be easily imitated by other firms, which can be a barrier for sustainable innovation investments in businesses.
Other obstacles the above authors mention are the small percentage of workers ready to take personal actions to grow sustainability, the struggle to find suppliers or to conclude new partnerships to become more environment friendly, namely for paper or recycled products, and logistical difficulties (the authors give the example of firms that collect or recycle electronic waste, which are not easy to find). Another barrier to implementing sustainability may be the necessity of additional training for the employees in order to adopt new practices, or of communicating through internal posters or leaflets. Some obstacles to adopting sustainable practices are specific to the field or industry. For instance, the authors mention the case of a beer factory that had difficulties with recycling or reusing not only the waste resulting from beer production but had to set up innovative partnerships to improve package recycling, glass being the largest single contributor to the carbon footprint of most breweries. Other authors [30] (pp. 247–258) suggest that the barriers and drivers for sustainability are specifically related to the sector in which the business evolves, but also to the country where they are located. Hence, the impact of CSR practices in developing countries in the area of environment [31] or human rights [32,33] remains a challenge.
Another obstacle mentioned by Andreas et al., particularly for SMEs, is the fact that they do not have a designated person or department dealing with sustainability issues. According to a study initially published in The Economist and cited by the authors, big businesses carry out four times more reporting regarding these issues, compared to SMEs. The perception among SMEs is that they have poor sustainability (twice as much as bigger firms). More than a third of big companies report making efforts to reduce their carbon footprint, compared to only one percent of SMEs. This situation may lead to additional barriers for implementing sustainability in SMEs, such as less pressure or expectations from the market or the community, not being followed or watched by environmental or social activists or NGOs, or the fact that their reputation and area of action are mainly local. With respect to these findings, Castka and Bamber indicate a fear of bureaucracy, and time and costs as barriers for sustainability in SMEs, arguing that these tend to be built on perceptions rather than on reality. Overall, SMEs used to be more focused on internal issues, such as staffing, increasing employees’ skills and team building, morale and motivation within the organization. Much of their social, community and environmental initiatives are therefore driven by or built to impact employees.
As a counterpart, Andreas et al. identify some specific sustainability drivers for SMEs that arise from their particularities. SMEs may easily find some niche business opportunities, avoided by corporations. They can find innovative solutions to social challenges, and implement them more rapidly, since they have a less complex organization than corporations. The local dimension can also become a facilitator, creating an emotional commitment to the community. Small businesses acting locally cannot afford damage to their image because of poor quality products or unsustainable social practices. The local involvement also allows maintaining close, personal relationships with community members, which may contribute to increasing the quality of products and services.
The literature review regarding facilitators and barriers for CSR in businesses of different sizes shows that various factors for integrating sustainable practices were identified by the authors. However, a research gap was observed in terms of associations between these factors and the way they depend on the firms’ and managers’ characteristics. The goal of our analysis is to recognize the main barriers and facilitators that the managers of Romanian SMEs face, while investigating their mutual connections and how they are influenced by the firms’ parameters and the managers’ characteristics.
4. Materials and Methods
4.1. The Questionnaire
Following the study of the scientific literature and non-academic sources, we built the research tool and the questionnaire, respectively, which was then submitted to business managers. An initial version of the questionnaire was proposed for completion on a panel of five enterprises (not part of the extended sample). The purpose of this approach is to test and adjust the research tool in real conditions, using the same type of respondents who complete the final questionnaire. Among the aspects that were closely followed, we list: identifying appropriate answer options, question reformulation and/or removal, testing the duration and method of administration of the questionnaire, examining managers’ perception of the concept of sustainable development and the degree of familiarity with it. The research methods used in this phase were: a semi-structured interview with the managers of the companies, the administration of the test questionnaire, and observation at the company’s headquarters.
In the final version of the questionnaire, in addition to the questions related to the characteristics of the company (number of employees: less than nine employees, 10 to 49 employees, 50 to 250 employees, turnover: <2 million €, 2 to 10 million €, >10 million €, enterprise profit: <10,000 €, 10,000 to 100,000 €, >100,000 €, the firm’s sector, managers’ age, gender and educational level), the following barriers and facilitators have been proposed for analysis (Table 1).

Table 1.
Barriers and facilitators of sustainable development.
4.2. The Sample Size
To establish the sample size in this study, we defined it according to statistical rules, but also to what was practically feasible. In order to determine the appropriate sample size, values such as the percentage of the total population (e.g., 10%), values from other similar studies, etc. were used in the literature. Creswell (2013) stated that the following three factors [34] (pp. 154–157) should be considered when deciding on the sample size of a study: the tolerable margin of error, the confidence level of the margin of error, and the estimated percentage of the sample. In this context, in the current study, we used the formula (adapted from SurveyMonkey.com, based on Fowler’s 2008 [35] (pp. 68–69) study):
where N is the population size, e is the margin of error, z is the z score, p is the population percentage (50% or 0.5).
Based on the formula presented above, it was estimated that the size of 71 questionnaires is sufficient for the significance level of 95% (z = 1.96) population size of 11,000 (source: termene.ro, reference year 2017) and with a margin of error slightly over 10% (e = 11.59).
4.3. Methods of Data Analysis
Using a descriptive statistical analysis with indicators such as the number of cases, a percentage was initially performed to analyze the proposed questionnaire results. Contingency tables, the Chi-square test or the Fischer test (depending on the situation) were used to identify whether there were significant differences between different barriers/facilitators analyzed and questions related to the company’s characteristics (number of employees, the company’s profit, manager age, gender, study level).
Moreover, the most frequent association of barriers, the most frequent association of facilitators, and the association between barriers and facilitators was analyzed using association rule mining (ARM). This technique was applied in many research areas to gain useful insights into associations and hidden relationships [36,37,38,39,40]. ARM is a two-step process for generating: (1) frequent item sets (all frequent item-sets whose support value is equal to or greater than the minimum support value—minsup), and (2) association rules/patterns (combinations of frequent item-sets whose confidence value is equal to or greater than the minimum confidence value—minconf) [41]. Let I be a set of items, I = { i1, i2,…, im } [42], and T a set of transactions (transaction database), T = { T1, T2,…, Tn }, where Ti is a set of items. In our context, the set of items include the biomarkers and facilitators of sustainable development while the transaction set is a set of data about managers and their opinion on considered biomarkers and facilitators.
An association rule is represented as an implication of the form X→Y where X (called antecedent of the rule/pattern) and Y (called consequent) are item-sets, X Y = . The importance/interestingness/usefulness/relevance of a rule/pattern generated with ARM methods is assessed by measures such as support, confidence, lift, leverage, conviction, gain, laplace, ps, Jaccard, and the phi-coefficient [41,43]. The formulas of the most widely used measure are:
where |.| represents the number of elements in a set ( is the number of transactions that contain only the X item-set, |X ∪ Y| is the number of transactions that include both X and Y item-sets). Support represents the fraction of transactions that contain bout X and Y, showing how often a rule appears in the transactional dataset (measure of prevalence of the rule). Confidence represents how often items in Y appear in transactions that contain X (measures the reliability of the inference made by a rule) and lift represents the ratio between a rule’s confidence and support of the item-set from the rule consequent (measure of interestingness/strength/importance of the rule, taking into account statistical dependency). Over time, several algorithms have been proposed for the extraction of association rules [44,45,46,47,48].
In this study, we used the FP-growth algorithm (frequent pattern growth, proposed by Han et al. [49]), the version implemented in RapidMiner environment. We considered a minsup threshold of 1% and minconf threshold of 80%.
In our research, we also used network analysis, which allows the visualization of the associations/interactions between the barriers and facilitators of sustainable development analyzed in this study. The nodes of the network represent these barriers and facilitators while the association between them is represented through the edges that connect the nodes. The thickness of the edges indicates the degree of association between the two paired nodes, when the associations with all the other nodes were also taken into account. The thicker the edges, the stronger the association. The color of the edges indicates the sign of the association: the green color indicates a direct association (positive correlation), and the red color indicates an inverse association (negative correlation). The software packages of the R program, proposed by Epskamp S. and colleagues (from the University of Amsterdam, Department of Psychological Methods) [50] were used to estimate the network.
5. Results
We analyzed the collected responses from 71 managers of the final sample of SMEs, most of them located territorially in the central area of Romania. Regarding the number of employees, 70% of the companies in the sample are micro-enterprises (with less than 10 employees), 20% fall into the category of small enterprises (10 to 49 employees), and the remaining 10% are medium enterprises (50 to 250 employees). A total of 56% of our respondents indicated that they have a profit of less than €10,000/year; 10% of them have a comfortable profit of over €100,000/year. Almost half of the respondents are in the 40 to 60 age group, while a third is between 35 and 40 years old. A total of 92% of managers have higher education and 51% are women. Regarding the country of origin of the capital, only eight percent of the enterprises have foreign capital (coming from European countries: France, Germany, Italy, Sweden and Hungary).
5.1. Descriptive Analysis
The main indicated barriers to the implementation of sustainable development are the limitation of financial and human resources (65 and 63%, respectively). More than half of the managers mentioned “other difficulties” with open answers, that we examine and categorize in the Discussion and Conclusions section. Less than 10% of managers do not know where or how to start sustainable development, but this is not a real impediment in implementing sustainability at the company level. A smaller proportion (7%) state that they did not take this issue into account, as the company operates well even without adopting sustainable principles. More than a third of managers believe that sustainable development is not their responsibility, but the responsibility of the state, to which they pay taxes. The opinion of more than a quarter of entrepreneurs is that environmental and social legislation is complex and implementing sustainable development at the firm level could create new difficulties. For more than a fifth of respondents, sustainable development would cost too much, and 13 of them are motivated by good intentions, but fail to mobilize employees or customers in this direction.
Regarding the facilitators of the implementation of sustainable development within an SME, the vast majority of managers (92%) mention the personal belief that everyone is responsible for the protection of the environment or the community. A large number of managers (86%) consider that the positive image of a sustainable company among customers, employees or suppliers is a motivating factor for the adoption of sustainable principles in the company. Additionally, the majority, even if fewer (44 managers, or 62%), are motivated by lowering the costs (e.g., through resource consumption) to have a sustainable company. Almost half of the respondents mention legal obligations as a determining factor, while one third believe that a sustainable company can attract new employees by adopting the principles of sustainable development.
The main barriers and facilitators to sustainable development are presented in Figure 1.
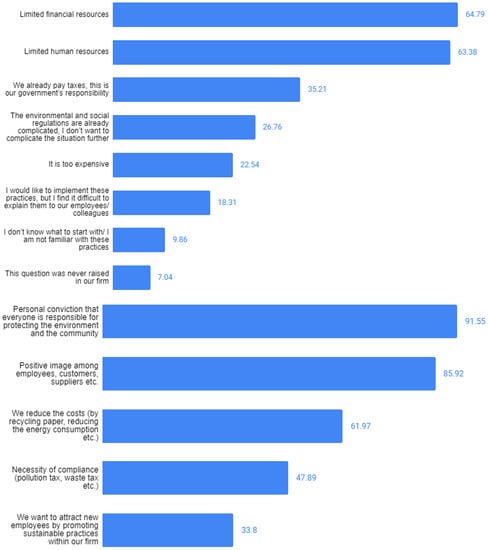
Figure 1.
Relative frequency (%) of barriers and facilitators of sustainable development.
5.2. Analysis of the Relationships between the Barriers and the Facilitators of Sustainability and the Characteristics of the Company
In order to examine whether there were significant differences between different barriers/facilitators analyzed and questions related to the company’s characteristics (the number of employees, the company’s profit, manager age, gender, level of education), we used contingency tables, the Chi-square test, or the Fischer test, if applicable. Below, we present the main relationships we found between the obstacles and drivers mentioned by managers, and the firms’ characteristics (Table 2).
Table 2.
Association between the barriers to the facilitators of sustainability and the characteristics of the company.
Limited financial resources are a barrier for almost two-thirds of companies. Three quarters of micro-enterprises mentioned this barrier, as opposed to 57% of small enterprises and none of the medium-sized enterprises (p = 0.000). Additionally, the companies with the lowest profit level (below €10,000/year) are the ones that most often indicated this barrier (75%), followed by those with a profit between €10,000 and €100,000/year (63%). Only one company with a profit over 100,000 €/year mentioned limited financial resources as being an obstacle for the implementation of sustainable development (p = 0.008). A significant proportion of female managers (81%) indicated limited financial resources as a barrier to implementing sustainable development in the company, as opposed to male managers (less than half, p = 0.005).
We already pay taxes, they should be used for sustainable development is seen as an obstacle for over a third of companies. Almost two thirds of small firms indicated this obstacle while only one third of micro and medium enterprises mentioned this barrier (p = 0.040). Most managers without a higher-level education (83%) consider that sustainable development is the responsibility of the state, unlike those with higher level education (less than a third mention this obstacle, p = 0.010).
I don’t know what to start with/I am not familiar with these practices is a marginal opinion, chosen only in few cases (10% of companies).
It is too expensive is mentioned as a barrier by 23% of companies. The youngest managers (25 to 35 years old) are the ones who most often consider (38%) that sustainable development costs too much, followed by the oldest ones (40 to 60 years old, that account for 26%) and under 10% for those of intermediate age (35 to 40 years old, p = 0.084). There are no significant differences between BtoB and BtoC companies.
Regarding the facilitators (drivers) for sustainable practices, among the companies that mention as a motivating factor a positive image for employees, customers, suppliers, etc., are all small and medium enterprises from the sample (100%) and micro-enterprises (80%, p = 0.087). The vast majority of managers have chosen his facilitator; among these, the youngest managers (25–30 years), which represent 100%, have the highest share, followed by the oldest (88%), and those of intermediate age (75%, p = 0.098).
Cost reduction is mentioned as a facilitator by almost two thirds of companies (62%); of these, all medium-sized companies, followed by 64% of small and 56% of micro-enterprises (p = 0.079) mentioned this. The higher the size of the company, the higher its concern for sustainable development as a method to reduce costs (p = 0.063). The highest proportion of choosing this facilitator belongs to managers with secondary education only (100%), compared to those with higher education (58%, p = 0.045). The reduction of costs is therefore a motivating factor for the implementation of sustainable development at the company level, especially for managers with secondary education.
Attracting new employees through a socially or environmentally responsible enterprise policy is a motivating factor for a third of managers from the sample, most of whom come from medium-sized companies (71%), followed by small companies (43%) and micro-enterprises (26%, p = 0.043). In other words, the desire for companies to attract new employees through a sustainable development policy is directly proportional to the number of employees already existing in the company.
The Necessity of compliance (pollution tax, waste tax etc.) represents a facilitator for almost half of the managers, of which the oldest have the highest share (over 60%), followed in relatively similar proportions by the other age categories (between 30 and 40%, p = 0.077).
42% of managers offered other alternatives related to facilitators of sustainable development, most of them being women (56 vs. 29% of male managers, p = 0.021).
5.3. The Results of Association Rule Mining Analysis
The most frequent co-occurrence of two barriers mentioned by managers are: B1 and B2 (support = 47.9%), B1 or B2 and B9 (support = 40.8% and 36.6%), B1 or B2 or B9 and B8 (support = 23.9% for all three situations), B9 or B1 and B4 or B6 (support = 18.3, 16.9, 15.5, and 14.1%). The most frequent combination of three barriers includes B1, B2, B9 and occurs in more than a quarter of managers’ opinions (support = 28.2%). The most frequent combination of two facilitators mentioned by managers are F4 and F1 (support = 78.9%), F4 or F1 and F2 (support = 60.6% and 59.2%), F4 or F1 or F2 and F3 (support = 46.5, 45.1, and 39.4%), F4 or F1 and F6 (support = 36.6 and 39.4%). Among the most frequent combination of three facilitators are F4, F1, and F2 occurring in more than half of managers’ opinions (support = 57.7%) followed by F4, F1, F3 (support = 43.7%), F4, F2, F3 (support = 38%), F4, F1, F6 or F5 (support = 35.2% and 32.4%).
Table 3 shows the top five highest support association rules, the top five highest confidence association rules and the top five highest lift association rules. The rules with higher support (which also have high confidence, > 80%) confirm that managers who consider limited financial resources (B1) and/or other barriers (B9) as barriers of sustainable development also consider positive image among employees, customers, suppliers (F1) as facilitator of sustainable development; additionally, the facilitator personal conviction that everyone is responsible for protecting the environment and the community (F4) co-occurs frequently with the barrier we already pay taxes, this is our government’s responsibility (B8) or others barriers (B9). The rules with higher confidence (which also have lift > 1) highlight the fact that the facilitator personal conviction that everyone is responsible for protecting the environment and the community (F4) is more likely to occur with a combination of the barrier we already pay taxes, this is our government’s responsibility (B8) and limited financial resources (B1) or limited human resources (B2), or other barriers (B9). All of these rules have a confidence score of 1, which is interpreted (for example in the case of first rule) as follows: every time that the barrier we already pay taxes, this is our government’s responsibility (B8) is chosen by a manager, the same manager will always choose personal conviction that everyone is responsible for protecting the environment and the community (F4) as a facilitator. The rules with a higher lift (which also have high confidence, >80%) suggest strong interdependence between combinations of barriers (antecedent) and combinations of facilitators (consequent). These patterns are of a higher length (between four to six items), all of them including B4 as item in antecedent (in combination with B1, B2, B9) and F1 as item in consequent (in combination with F2, F4, F6).
Table 3.
Association rules set.
The visual representation of the associations/interactions between the facilitators and the barriers of sustainable development performed using network analysis is presented in Figure 2.
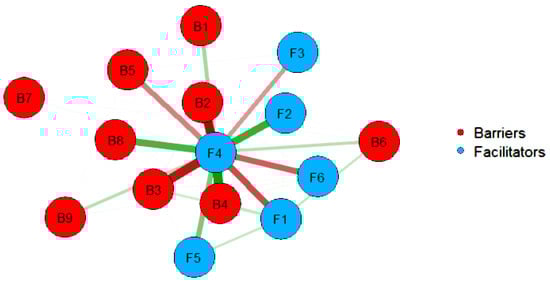
Figure 2.
Estimated network structure—visual representation of association between facilitators and barriers of sustainable development. The thickness of the edges indicates the degree of association between the two paired nodes, when the associations with all the other nodes were also taken into account. Thicker edges indicate stronger association, green edges indicate positive relationships, red edges indicate negative relationships. If a node is unconnected, its predictability by other nodes tends to be zero, while if more edges are connected to a node the higher its predictability tends to be.
6. Discussion
We included in the questionnaire the main barriers and facilitators identified by the academic literature, but also the ones that were mentioned by the managers interviewed within the focus group. It appears that the main barriers to the implementation of sustainable development in SMEs identified in this study are the limitation of financial and human resources, legal and regulatory difficulties, and the fear of additional costs linked to sustainable actions in the firms. Some managers consider that sustainable development is not their responsibility but that of the state to which they pay taxes; another part mentions that they do not know how to start sustainable practices.
More than half of the managers provided open answers and mentioned new barriers for implementing corporate social responsibility in the firms, other than the ones proposed in the questionnaire. We classified these obstacles into eight main areas:
- -
- difficulties related to the business environment (different vision from business partners, difficulties in adapting to market trends, insufficient or unsustainable suppliers, expensive supply, high and unfair competition, lack of proposals for sustainable partnerships, lack of support for fragile SMEs, their dependence on the local environment, etc.); the idea of the SMEs’ difficulties being linked to the supply chain is suggested in many academic studies. For instance, Bar [51] (pp. 234–243) notes that smaller companies that supply to larger businesses may lack feedback on the environmental requirements of their products due to the perceived relative size of the contribution of their product to the environmental footprint of the end product of the consumer. As a counterpart, better and tougher environmental requirements on each sector from environmental agencies, as well as long-term commitments between producers and end consumers may be effective solutions for sparking green innovation initiatives;
- -
- legislative or institutional difficulties (norms that do not keep up with technical progress or that difficult to comply with, non-stimulating for sustainable development, or unpredictable; bureaucracy; corruption);
- -
- difficulties related to employees (reluctant to sustainability, low professional awareness and responsibility, scarcity of qualified employees, disinterest in acquiring new skills, etc.);
- -
- difficulties related to customers (lack of moderation in resource consumption, fragility, preference for unsustainable but low-priced products, etc.). This idea is also acknowledged in other academic research [52] (pp. 8–19), suggesting that stakeholders’ (namely customers’) low awareness remains a critical impediment for maximizing business benefits through their CSR activities, highlighting the need for SMEs to communicate CSR more effectively among customers [53]; another study [54] shows that CSR communication in SMEs is largely informal, direct, non-strategic and internally focused;
- -
- external difficulties related to the environment (insufficient environmental infrastructure, too much plastic packaging imposed, arbitrary controls of compliance with environmental regulations, inadequate sanctions and fines, etc.);
- -
- internal economic difficulties (debt recovery, diversification of company activities, low access to finance, unsustainable or expensive sustainable investments, difficulty in reducing resource consumption, etc.);
- -
- survival mode (prioritizing the maintenance of the company on the market to the detriment of sustainable projects considered non-priority, lack of time of manager’s due to insufficient human resources, etc.);
- -
- insufficiency of profile information and inadequacy of education to market requirements or sustainable development. As far as education for sustainable development in SMEs is concerned, the academic research [11] shows that the good practices for SME are very important. If SMEs can see specific practices that impact profitability and business sustainable development, they tend to be more likely to be involved. In the same study, Castka and Bamber also point out that support for SMEs needs to be simple, transparent, and local. The authors insist on simplifying the experience of engagement for SMEs, since there is a clear feeling of bombardment (legislation or approaches from local charities) and too many organizations overlapping in advice. SMEs need a single, local point of contact, through which they can network with other organizations and learn.
The main barriers chosen or mentioned by the managers are documented in the academic literature. However, certain obstacles indicated by managers are little mentioned in scientific works and are particularly relevant in the Romanian context. The legislative or institutional difficulties (unpredictable regulations, bureaucracy, corruption), some barriers related to employees such as disinterest in acquiring new skills or for sustainable issues, or to customers (lack of education for sustainability, lack of moderation), but also external obstacles related to environment are linked to the business environment in Romania and to a certain degree to the immaturity of institutions and legislation regarding sustainable policies.
Among the main facilitators of the implementation of sustainable development within an SME are the personal belief that everyone is responsible for the protection of the environment or the community, the positive image of the company, cost reduction, and legal obligations. Similar to the range of questions regarding the barriers, the managers provided various open answers as far as the facilitators for sustainable practices are concerned. The new facilitators mentioned by managers, other than the ones indicated in the questionnaire, are:
- -
- the well-being of human resources and future generations;
- -
- customer satisfaction;
- -
- the intrinsic motivation of the manager.
Thus, more than one fifth of managers are motivated to adopt the principles of sustainable development in order to have a more stable, perennial company. Almost as many respondents see a causal association between the sustainability of the company and a more educated, healthier society. The well-being of human resources and future generations, but also customer satisfaction through the provision of quality products and services, are community and societal considerations, while the last three proposed variants are related to the intrinsic motivation of the manager as an individual (being a positive example, your own well-being but also the emotional attachment to the company and its team, seen as a family). Being a positive example is a driver for many SMEs, also mentioned in the academic literature. For instance, Jenkins [55] states that SMEs prefer to learn through networking and from their peers, which requires strong leadership or “championship” from individuals such as highly-motivated owner–managers and from exemplary companies.
In the semi-structured interviews, several managers mentioned the word “family” when referring to the company, which shows the strong connection between them and the fruit of their work. It is important to mention that 81% of the respondents are also the founders of the business object of this study. These findings are corroborated by academic research. In a study conducted by the Canadian Federation of Independent Enterprises [56] (pp. 22–38), 87% of the respondents admit that their personal values are at the heart of the changes produced in order to guide the firm toward a sustainable policy [56] (pp. 22–38). These beliefs strengthen and are put into practice the more the internal and external stakeholders are concerned by sustainable development [57]. The manager–founder can, hence, represent a facilitator or an important barrier for the integration of sustainable practices in the firm.
The facilitators chosen or mentioned by the managers mostly belong to the category “outcomes”, rather than “predictors” with respect to Aguinis and Glavas’ categories presented in their study from 2012. In other words, most of the managers responding to our questionnaire are driven by a higher goal related to sustainability, such as “good reputation”, “positive image” or “community goodwill” than predictors, like “regulation” or “customers’ pressure”. This finding is in line with the idea of the managers’ personal values and convictions being at the center of the decision whether or not they choose sustainable policies in the firm.
The findings of the association rule mining provide an overview of the relationships between facilitators and barriers. The barriers limited financial resources (B1), limited human resources (B2), other barriers (B9) and we already pay taxes, this is our government’s responsibility (B8) were found to be associated with facilitator personal conviction that everyone is responsible for protecting the environment and the community (F4). The association between barriers B1 and B2 (limited financial and human resources), but also between B4 and B6 (sustainability perceived as expensive, and the fear of complications liked to regulations) is confirmed by the academic literature. For instance, Maloni and Brown [58] mention that sustainable practices can be perceived by SME managers as a burden or a threat, corroborated by the fear of not being able to meet the social and environmental requirements. The association rule mining between facilitators and barriers to sustainability provided interesting findings. The connection between limited financial and human resources as barriers, and the positive image as a driver, can easily be interpreted as the willingness of the manager to implement sustainability in order to improve the image of the firm, despite the intrinsic limitations linked to human or financial capital. A rather surprising connection is the one identified between the obstacle “we already pay taxes, sustainability is not our responsibility” and the facilitator “everyone is responsible for the protection of the environment and the community”. This apparent contradiction that was also raised within the focus group shows the ambivalent feelings of the SME managers toward sustainable practices. Most of them are convinced that the responsibility for adopting them belongs to every member of the community, including them, and simultaneously, they consider that the public authorities should do more in order to integrate them into society.
As far as the links between the facilitators and barriers studied and the firms’ characteristics are concerned, our work indicates some interesting findings. The results of the comparative analysis show a connection between the firm’s size and some drivers or barriers to sustainability. Hence, the smallest businesses (microenterprises) most often mentioned limited financial resources as a barrier to sustainable practices. The same obstacle was indicated by most of the firms with low profits, suggesting that many of these small businesses are in “survival mode”. This situation is acknowledged by academic research [13], confirming that small firms tend to take more of an ad hoc and reactive approach to sustainability issues. This indicates the need for the smallest firms to benefit from financial incentives in order to be more sustainable. At the same time, the biggest firms from the sample (medium-sized enterprises) mentioned more frequently as facilitators the wish of benefiting from a positive image, of reducing the costs through sustainable actions, but also attracting new employees.
Another connection revealed by our study is between the manager’s gender and the barriers and facilitators to sustainability. This can be illustrated by women more often mentioning limited financial resources as an obstacle, but also giving other examples of drivers, such as concluding partnerships. This finding is partially confirmed by scientific research. A study from 2011 on a panel of Australian firms [59] showed a positive link between women on boards and economic growth in firms, possibly due to cost reduction. Moreover, because of their relational abilities, women on boards are more likely able to engage with multiple stakeholders and respond to their needs, resulting in an avenue for demonstrating social responsiveness, which is confirmed by the results.
Other relevant findings of our study are the link between the managers’ level of education and the barriers and facilitators mentioned by them. For example, managers with secondary studies are the ones most often mentioning the barrier “we already pay taxes, sustainability is not our responsibility”, and “cost reduction” as a facilitator for sustainable practices. This suggests that a higher degree of education among managers can help to integrate sustainability into the core business practices, by better understanding its financial and non-financial outcomes.
Finally, as far as managers’ age is concerned, the youngest managers from our sample most frequently mentioned the additional costs linked to sustainable practices as a barrier, but also the positive image as a facilitator. On the other hand, the oldest managers from the group indicated the necessity of compliance with regulations as a driver for adopting responsible business practices. This finding is indirectly confirmed by a study from 2019 [60] focused on how management styles vary with age, stating that as for dealing with change and obstacles, older managers placed high value on developing resilience, overcoming, growing from setbacks, anticipating problems and concerns.
7. Conclusions
This paper’s goal was to investigate the factors that positively and negatively influence the implementation of sustainability policies in SMEs, based on a panel of SMEs located in Romania. In addition, our research examined how these factors are connected to each other and how they depend on the firms’ and managers’ typologies. The literature review contributed to highlighting not only the particularities of SMEs and the way they understand sustainability, but also the obstacles and drivers the managers perceive to implement socially and environmentally responsible policies. The review of the main facilitators and barriers helped us to build the research tool and to formulate the questions for the managers. The closed questions proposed various choices of items indicated in academic studies, while the open questions, even if more laborious to analyze and categorize, provided interesting observations on the factors impacting sustainability in small firms.
The descriptive analysis contributed to identify factors little documented in the academic literature. Among them, managers most mentioned their wish for perenniality and stability of the firm, as a driver for sustainable policies. This facilitator may be specific for Eastern European businesses, that face unpredictability and volatility of legal regulations. This factor is consequently indicated in our study by Romanian managers as a barrier from a legal or institutional point of view. Other drivers are little mentioned in academic studies, but revealed by our investigation, are community goodwill (education, health, personal development), being a positive example for future generations and for the present society. Some managers even reported implementing sustainable development for their own wealth and comfort, while others admitted that the emotional attachment to the firm pushed them to adopt more responsible policies. Regarding the barriers they perceive, Romanian managers complain mostly about the difficulties related to the business environment and to finding partners and customers who share the same vision and values, such as fair competitors or sustainable suppliers. Other interesting barriers revealed by our research are those linked to the legal and institutional environment, including cumbersome, unpredictable and unstimulating regulations, bureaucracy, and corruption.
The techniques of network analysis and association rule mining showed some unexpected connections between factors, such as paradox behaviors (even if they indicate poor resources and the fact that sustainability is the job of public authorities as obstacles to sustainability, the Romanian managers still feel responsible for protecting the environment and having a positive impact on the community), which represents a novelty as far as the research on this topic is concerned. Moreover, the analysis between the factors impacting sustainability and the firms’ and managers’ typologies revealed interesting patterns related to the behavior of microenterprises and to the way managers’ age, gender and education degree influence the implementation of sustainable development in firms.
The results of this paper may help SMEs, professionals, and policymakers to better understand the factors impacting the responsible practices in SMEs. The limitations of our analysis are linked to the sample size and to its repartition, with regard to the characteristics of the firms observed, since many variables were taken into account (firm size, level of profit, managers’ gender, age and level of education, type of customers -BtoB or BtoC), but also to the location of the firms analyzed (Romania). To this end, our study included techniques of network analysis and association rule mining, in order to deliver accurate results on the facilitators and barriers to sustainability. Our findings show some original connections between these factors and the firm’s characteristics, but also between facilitators and barriers themselves. A part of these results are suggested by academic studies, leaving room for further investigation, especially at the microeconomic level where there is a research gap, namely concerning the way in which individual decisions regarding sustainability lead to real changes and impact of firm’s behavior.
Author Contributions
The individual contribution of the authors is presented below: Conceptualization, C.C. and D.-D.D.; Methodology, C.C. and I.M.; Software, I.M.; Validation, C.C. and D.-D.D.; formal analysis, C.C. and I.M.; Investigation, C.C.; Resources, C.C. and I.M.; Data curation, C.C., D.-D.D. and I.M.; Writing—original draft preparation, C.C. and I.M.; writing—review and editing, D.-D.D.; visualization, C.C.; supervision, D.-D.D.; project administration, D.-D.D.; funding acquisition, non-applicable. All authors have read and agreed to the published version of the manuscript.
Funding
Project supported by Lucian Blaga University of Sibiu, The Research Centre for sustainable products and processes and Hasso Plattner Foundation research action LBUS-RRC-2020-01.
Institutional Review Board Statement
Not applicable.
Informed Consent Statement
Not applicable.
Data Availability Statement
The data presented in this study are available on request from the corresponding author. The data are not publicly available due to privacy restrictions related to the firms included in the study.
Conflicts of Interest
The authors declare no conflict of interest.
References
- Jeronen, E.; Idowu, S.O.; Capaldi, N.; Zu, L.; Gupta, A.D. Sustainability and Sustainable Development; Springer: Berlin/Heidelberg, Germany, 2013. [Google Scholar]
- WCED. Our Common Future; Oxford University Press: Oxford, UK, 1987.
- Henriques, A.; Richardson, J. The Triple Bottom Line: Does It All Add up? Assessing the Sustainability of Businesses and CSR; Earthscan: Sterling VA, USA; London, UK, 2004. [Google Scholar]
- Gillespie, A. The Illusion of Progress—Unsustainable Development in International Law and Policy; Earthscan: London, UK, 2001; p. 257. [Google Scholar]
- Bookchin, M. The Ecology of Freedom. In Cheshire Book; New Dimensions Foundation: Palo Alto, CA, USA, 1982. [Google Scholar]
- Aguinis, H.; Glavas, A. What We Know and Don’t Know About Corporate Social Responsibility. J. Manag. 2012, 38, 932–968. [Google Scholar] [CrossRef]
- Peloza, J. The Challenge of Measuring Financial Impacts from Investments in Corporate Social Performance. J. Manag. 2009, 35, 1518–1541. [Google Scholar] [CrossRef]
- Carroll, A.B.; Shabana, K.M. The Business Case for Corporate Social Responsibility: A Review of Concepts, Research and Practice. Int. J. Manag. Rev. 2010, 12, 85–105. [Google Scholar] [CrossRef]
- Wood, D.J. Measuring Corporate Social Performance: A Review. Int. J. Manag. Rev. 2010, 12, 50–84. [Google Scholar] [CrossRef]
- Peloza, J.; Shang, J. How can corporate social responsibility activities create value for stakeholders? A systematic review. J. Acad. Mark. Sci. 2011, 39, 117–135. [Google Scholar] [CrossRef]
- Castka, P.; Balzarova, M.A.; Bamber, C.J.; Sharp, J.M. How can SMEs effectively implement the CSR agenda? A UK case study perspective. Corp. Soc. Responsib. Environ. Manag. 2004, 11, 140–149. [Google Scholar] [CrossRef]
- Luetkenhorst, W. Corporate Social Responsibility and the Development Agenda. The Case for Actively In-volving Small and Medium Enterprises. Intereconomics 2004, 39, 157–166. [Google Scholar] [CrossRef]
- Moore, G.; Spence, L. Editorial: Responsibility and Small Business. J. Bus. Ethic. 2006, 67, 219–226. [Google Scholar] [CrossRef]
- Jenkins, H. A ‘business opportunity’ model of corporate social responsibility for small- and medium-sized enterprises. Bus. Ethic. A Eur. Rev. 2009, 18, 21–36. [Google Scholar] [CrossRef]
- Quinn, J.J. Personal Ethics and Business Ethics: The Ethical Attitudes of Owner/Managers of Small Business. J. Bus. Ethic. 1997, 16, 119–127. [Google Scholar] [CrossRef]
- Labelle, F.; Aka, K.G. Processus d’innovation durable en contexte PME: Les effets d’un systeme generant des retombees positives. J. Small Bus. Entrep. 2012, 25, 479–498. [Google Scholar] [CrossRef]
- Kotey, B.; Slade, P. Formal Human Resource Management Practices in Small Growing Firms*. J. Small Bus. Manag. 2005, 43, 16–40. [Google Scholar] [CrossRef]
- Jones, T.M. Ethical Decision Making by Individuals in Organizations: An Issue-Contingent Model. Acad. Manag. Rev. 1991, 16, 366. [Google Scholar] [CrossRef]
- Andreas, F.; Cooperman, S.E.; Gifford, B.; Russell, G. A Simple Path to Sustainability. Green Business Strategy for Small and Medium-Sized Businesses; Praeger: Santa Barbara, CA, USA, 2011. [Google Scholar]
- Weidinger, C.; Fischler, F.; Schmidtpeter, R. Sustainable Entrepreneurship. Business Success through Sustainability; Springer: Berlin/Heidelberg, Germany, 2014. [Google Scholar]
- Orlitzky, M.; Schmidt, F.L.; Rynes, S.L. Corporate Social and Financial Performance: A Meta-Analysis. Organ. Stud. 2003, 24, 403–441. [Google Scholar] [CrossRef]
- Porter, M.; Kramer, M. Strategy and Society: The link between competitive advantage and CSR. Harvard Bus. Rev. 2006, 84, 78–92. [Google Scholar]
- Maignan, I.; Ferrell, O.C.; Hult, G.T.M. Corporate Citizenship: Cultural Antecedents and Business Benefits. J. Acad. Mark. Sci. 1999, 27, 455–469. [Google Scholar] [CrossRef]
- McWilliams, A.; Siegel, D. Corporate Social Responsibility: A Theory of the Firm Perspective. Acad. Manag. Rev. 2001, 26, 117–127. [Google Scholar] [CrossRef]
- Okechukwu, U.; Maser, C.; Reichenbach, M. Sustainable Development: Principles, Frameworks and Case Studies; CRC Press: Boca Raton, FL, USA, 2010. [Google Scholar]
- Young, W.; Hwang, K.; McDonald, S.; Oates, C.J. Sustainable consumption: Green consumer behaviour when purchasing products. Sustain. Dev. 2010, 18, 20–31. [Google Scholar] [CrossRef]
- Partidario, M.R.; Vicente, G.; Belchior, C. Can New Perspectives on Sustainability Drive Lifestyles? Sustainability 2010, 2, 2849–2872. [Google Scholar] [CrossRef]
- Bocken, N.M.P.; Geradts, T.H.J. Barriers and drivers to sustainable business model innovation: Organization design and dynamic capabilities. Long Range Plan. 2020, 53, 101950. [Google Scholar] [CrossRef]
- Schaltegger, S.; Lüdeke-Freund, F.; Hansen, E.G. Business Models for Sustainability. Organ. Environ. 2016, 29, 264–289. [Google Scholar] [CrossRef]
- Narimissa, O.; Kangarani-Farahani, A.; Molla-Alizadeh-Zavardehi, S. Drivers and barriers for implementation and improvement of Sustainable Supply Chain Management. Sustain. Dev. 2020, 28, 247–258. [Google Scholar] [CrossRef]
- Eweje, G. Environmental Costs and Responsibilities Resulting from Oil Exploitation in Developing Countries: The Case of the Niger Delta of Nigeria. J. Bus. Ethic. 2006, 69, 27–56. [Google Scholar] [CrossRef]
- Cragg, W. Human Rights and Business Ethics: Fashioning a New Social Contract. J. Bus. Ethic. 2000, 27, 205–214. [Google Scholar] [CrossRef]
- Cragg, W. Ethics, Enlightened Self-Interest, and the Corporate Responsibility to Respect Human Rights: A Critical Look at the Justificatory Foundations of the UN Framework. Bus. Ethic. Q. 2012, 22, 9–36. [Google Scholar] [CrossRef]
- Creswell, J.W. Qualitative Inquiry and Research Design:Choosing among Five Approaches, 3rd ed.; SAGE Publications: Los Angeles, CA, USA, 2013. [Google Scholar]
- Fowler, J.W., Jr. Survey Reaserch Methods, 4th ed.; Sage: Thousand Oaks, CA, USA, 2008. [Google Scholar]
- Lee, D.G.; Ryu, K.; Bashir, M.; Bae, J.-W.; Ryu, K.H. Discovering Medical Knowledge using Association Rule Mining in Young Adults with Acute Myocardial Infarction. J. Med. Syst. 2013, 37, 9896. [Google Scholar] [CrossRef] [PubMed]
- Wright, A.P.; Wright, A.T.; McCoy, A.B.; Sittig, D.F. The use of sequential pattern mining to predict next prescribed medications. J. Biomed. Inform. 2015, 53, 73–80. [Google Scholar] [CrossRef] [PubMed]
- Suchacka, G.; Chodak, G. Using association rules to assess purchase probability in online stores. Inf. Syst. E-Bus. Manag. 2017, 15, 751–780. [Google Scholar] [CrossRef]
- Maniu, I.; Maniu, G.; Visa, G.; Costea, R.; Neamţu, B. Frequent Pattern Mining of Risk Factors Predicting Neonatal Seizures Outcomes. BRAIN Broad Res. Artif. Intell. Neurosci. 2018, 9, 161–170. [Google Scholar]
- Lian, S.; Gao, J.; Li, H. A Method of Mining Association Rules for Geographical Points of Interest. ISPRS Int. J. Geo-Inf. 2018, 7, 146. [Google Scholar] [CrossRef]
- Agrawal, R.; Srikant, R. Fast algorithms for mining association rules in large databases. In Proceedings of the 20th International Conference on Very Large Databases, Santiago, Chile, 12–15 September 1994; Volume 1215, pp. 487–499. [Google Scholar]
- Brin, S.; Motwani, R.; Ullman, J.D.; Tsur, S. Dynamic itemset counting and implication rules for market basket data. In Proceedings of the 1997 ACM SIGMOD International Conference on Management of Data (SIGMOD ’97), Tucson, AZ, USA, 13–15 May 1997; Volume 26, pp. 255–264. [Google Scholar] [CrossRef]
- Piatetsky-Shapiro, G. Discovery, analysis, and presentation of strong rules. Knowl. Disc. Databases 1991, 229, 229–248. [Google Scholar]
- Zaki, M. Scalable algorithms for association mining. IEEE Trans. Knowl. Data Eng. 2000, 12, 372–390. [Google Scholar] [CrossRef]
- Hunyadi, D. Improvements of Apriori Algorithms, First International Conference on Modelling and De-velopment of Intelligent Systems. In Proceedings of the MDIS, Sibiu, Romania, 22–25 October 2009; “Lucian Blaga” University Publishing House: Sibiu, Romania, 2009; pp. 106–114, ISSN 2067-3965. [Google Scholar]
- Hunyadi, D. Performance Comparison of Apriori and FP-Growth Algorithms in Generating Association Rules. In Proceedings of the 5th European Computing Conference (ECC’ 11), Paris, France, 28–30 April 2011; pp. 376–381. [Google Scholar]
- Hunyadi, D. Performance algorithms in generating association rules. Int. J. Math. Comput. Simul. 2011, 5, 282–289. [Google Scholar]
- Ait-Mlouk, A.; Agouti, T.; Gharnati, F. Comparative survey of association rule mining algorithms based on multi-criteria decision analysis approach. In Proceedings of the 2015 3rd International Conference on Control, Engineering & Information Technology (CEIT), New York, NY, USA, 25–27 May 2015; pp. 1–6, 25–27. [Google Scholar]
- Han, J.; Pei, J.; Yin, Y. Mining frequent patterns without candidate generation. ACM Sigmod Rec. 2000, 29, 1–12. [Google Scholar] [CrossRef]
- Epskamp, S.; Cramer, A.; Waldorp, L.; Schmittmann, V.; Borsboom, D. Network Visualizations of Rela-tionships in Psychometric Data. J. Stat. Softw. 2012, 48, 1–18. [Google Scholar] [CrossRef]
- Bar, E.S. A case study of obstacles and enablers for green innovation within the fish processing equipment industry. J. Clean. Prod. 2015, 90, 234–243. [Google Scholar] [CrossRef]
- Du, S.; Bhattacharya, C.; Sen, S. Maximizing Business Returns to Corporate Social Responsibility (CSR): The Role of CSR Communication. Int. J. Manag. Rev. 2010, 12, 8–19. [Google Scholar] [CrossRef]
- Kowalska, M. SME Managers’ Perceptions of Sustainable Marketing Mix in Different Socioeconomic Conditions—A Comparative Analysis of Sri Lanka and Poland. Sustainability 2020, 12, 10659. [Google Scholar] [CrossRef]
- Lee-Wong, B.Y.; More, E. Management of corporate social responsibility in Hong Kong small and medium enterprises. J. Glob. Responsib. 2016, 7, 146–162. [Google Scholar] [CrossRef]
- Jenkins, H. Small Business Champions for Corporate Social Responsibility. J. Bus. Ethic. 2006, 67, 241–256. [Google Scholar] [CrossRef]
- Armstrong, M.; Lavoie, A.; Petkov, P.; Pohlmann, C.; Smith, D. Achieving Eco-Prosperity SMEs’ Perspectives on the Environment; FCEI: Toronto, ON, Canada, 2007; ISBN 978-2-7605-3795-8. [Google Scholar]
- DTI. Engaging SMEs in Community and Social Issues; Research Report; Department of Trade and Industry: London, UK, 2021. Available online: http://www.bitc.org.uk/resources/publications/engaging_smes.html (accessed on 17 February 2021).
- Maloni, M.J.; Brown, M.E. Corporate Social Responsibility in the Supply Chain: An Application in the Food Industry. J. Bus. Ethic. 2006, 68, 35–52. [Google Scholar] [CrossRef]
- Galbreath, J. Are there gender-related influences on corporate sustainability? A study of women on boards of directors. J. Manag. Organ. 2011, 17, 17–38. [Google Scholar] [CrossRef]
- Birkinshaw, J.; Manktelow, J.; D’Amato, V.; Tosca, E.; Macchi, F. Older and Wiser? How Management Style Varies With Age. Mit. Sloan Manag. Rev. 2019, 60, 75. [Google Scholar]


Publisher’s Note: MDPI stays neutral with regard to jurisdictional claims in published maps and institutional affiliations. |
© 2021 by the authors. Licensee MDPI, Basel, Switzerland. This article is an open access article distributed under the terms and conditions of the Creative Commons Attribution (CC BY) license (http://creativecommons.org/licenses/by/4.0/).