
A Systemic View on Circular Economy in the Water Industry: Learnings from a Belgian and Dutch Case


Abstract
:1. Introduction
1.1. Background
1.2. Context and System Boundary
1.3. Organization of Paper
2. State-of-the-Art in Circular Economy and Water
2.1. Decentralized Solutions
- Natural water treatment (through filtration);
- Storage (e.g., aquifers);
- Buffering (i.e., flood protection through reduced stormwater run-off);
- Recreation (e.g., green spaces).
2.2. Digitalization
- Reducing energy consumption;
- Avoiding unnecessary water losses;
- Minimizing resource consumption;
- Better monitoring and reporting on quality, quantity, reuse of water, extreme events (floods and water-scarcity), and aids informed decision-making;
- Engaging the end consumers in sustainable behaviors making them aware of individual water consumption patterns.
2.3. The Economics and Value of Water
3. Methodology
4. The Urban Water System Analysis
4.1. Water Quality
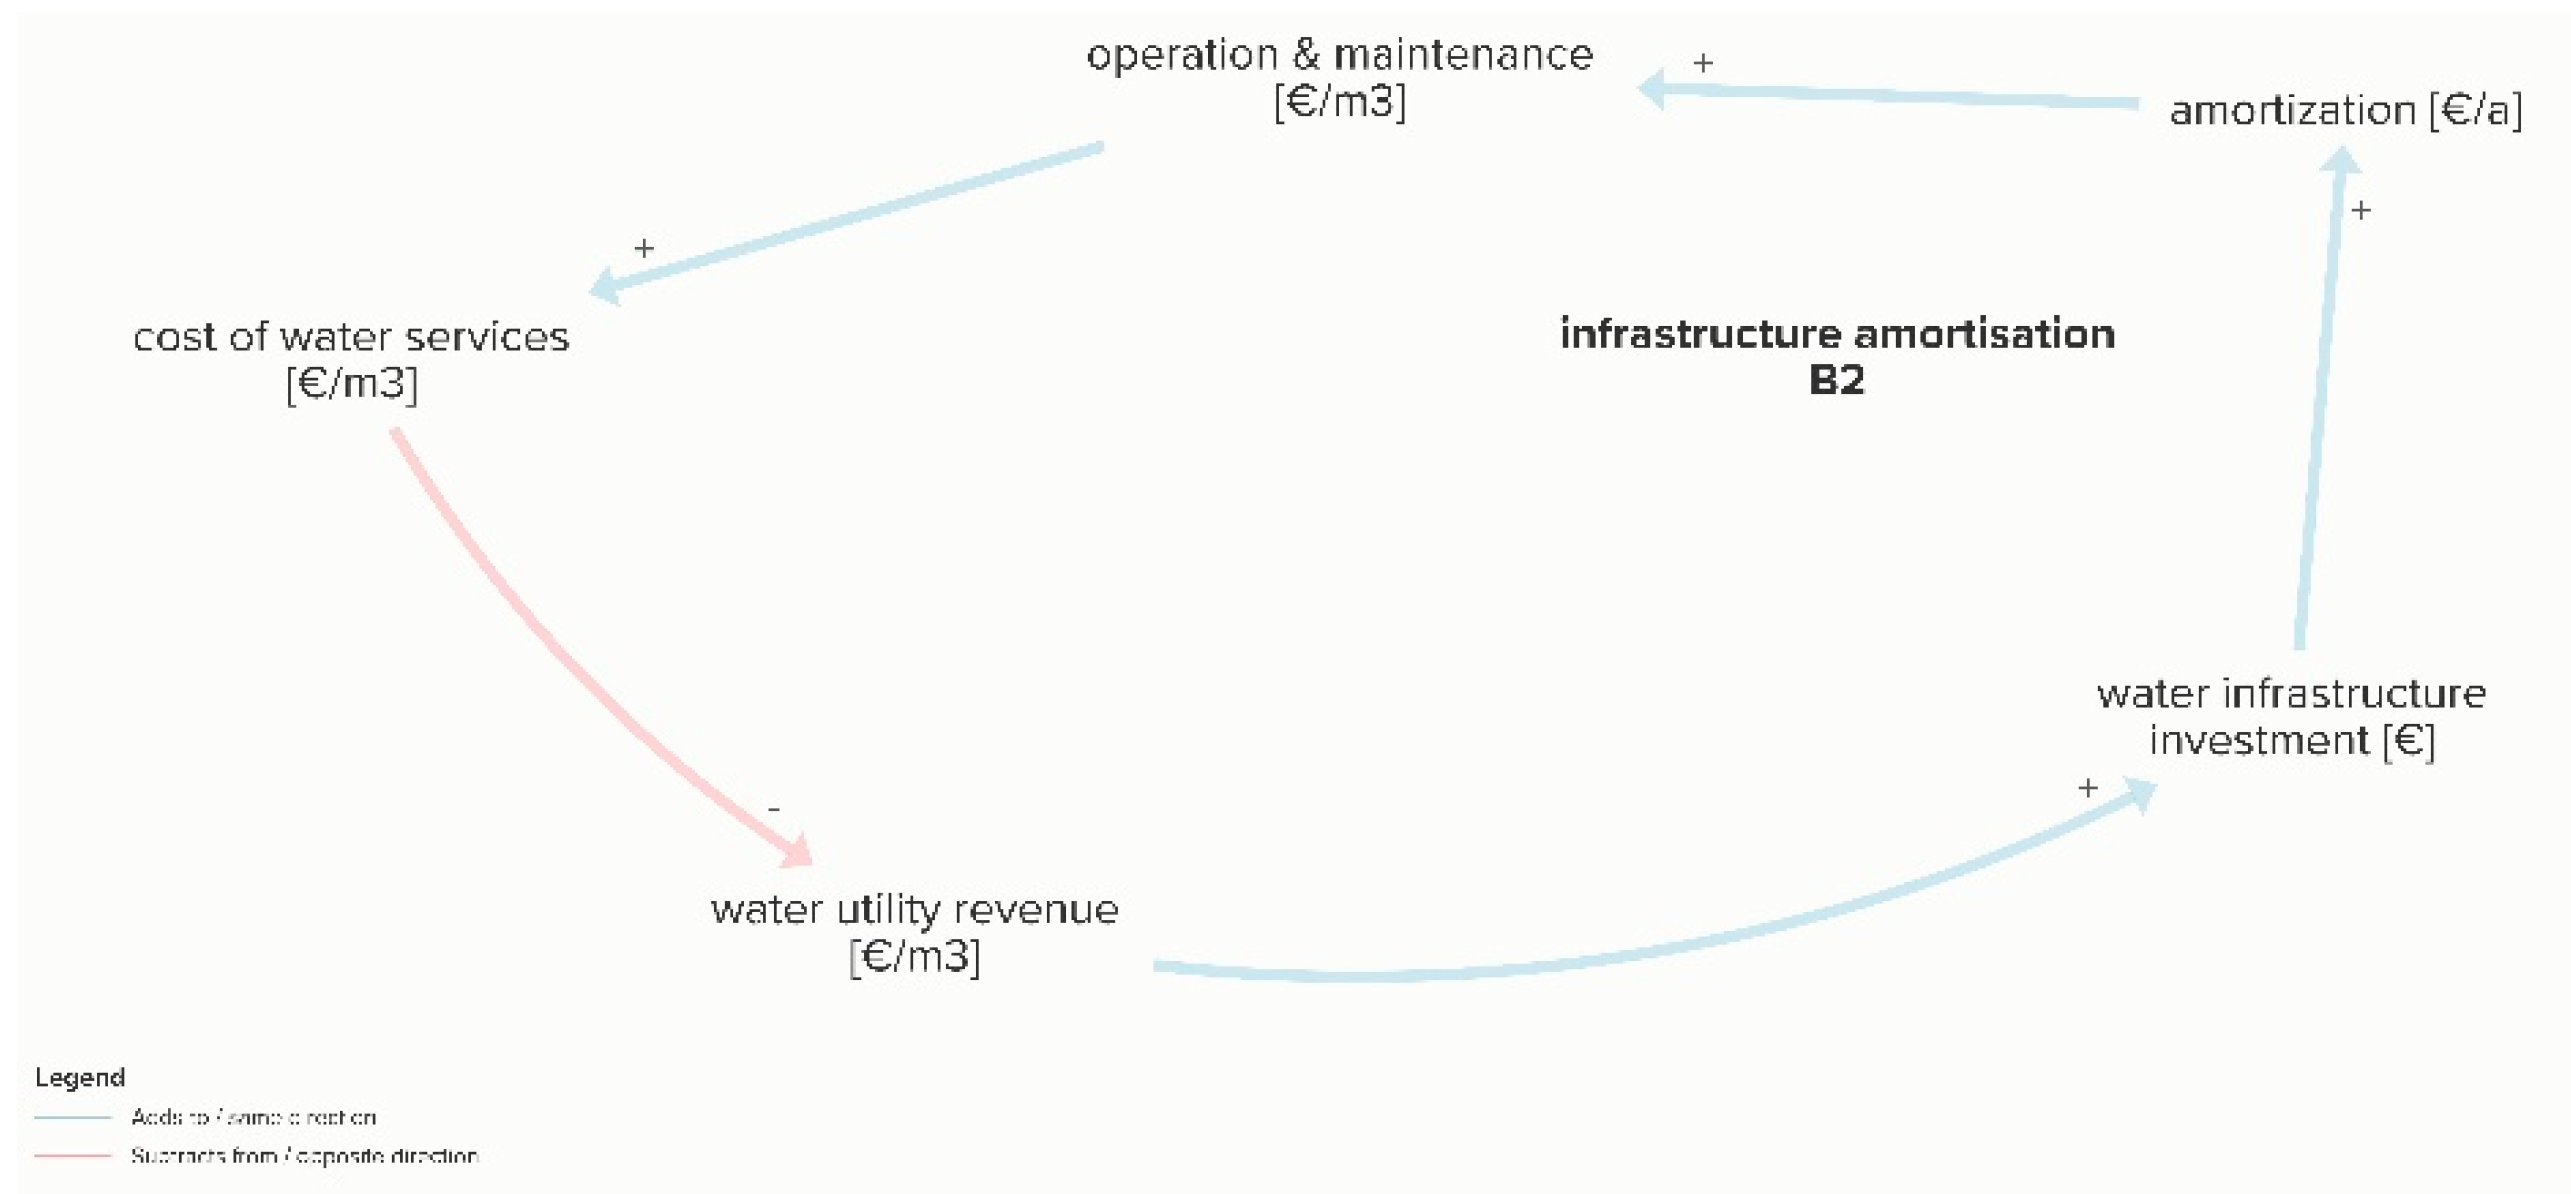
4.2. Cost Recovery
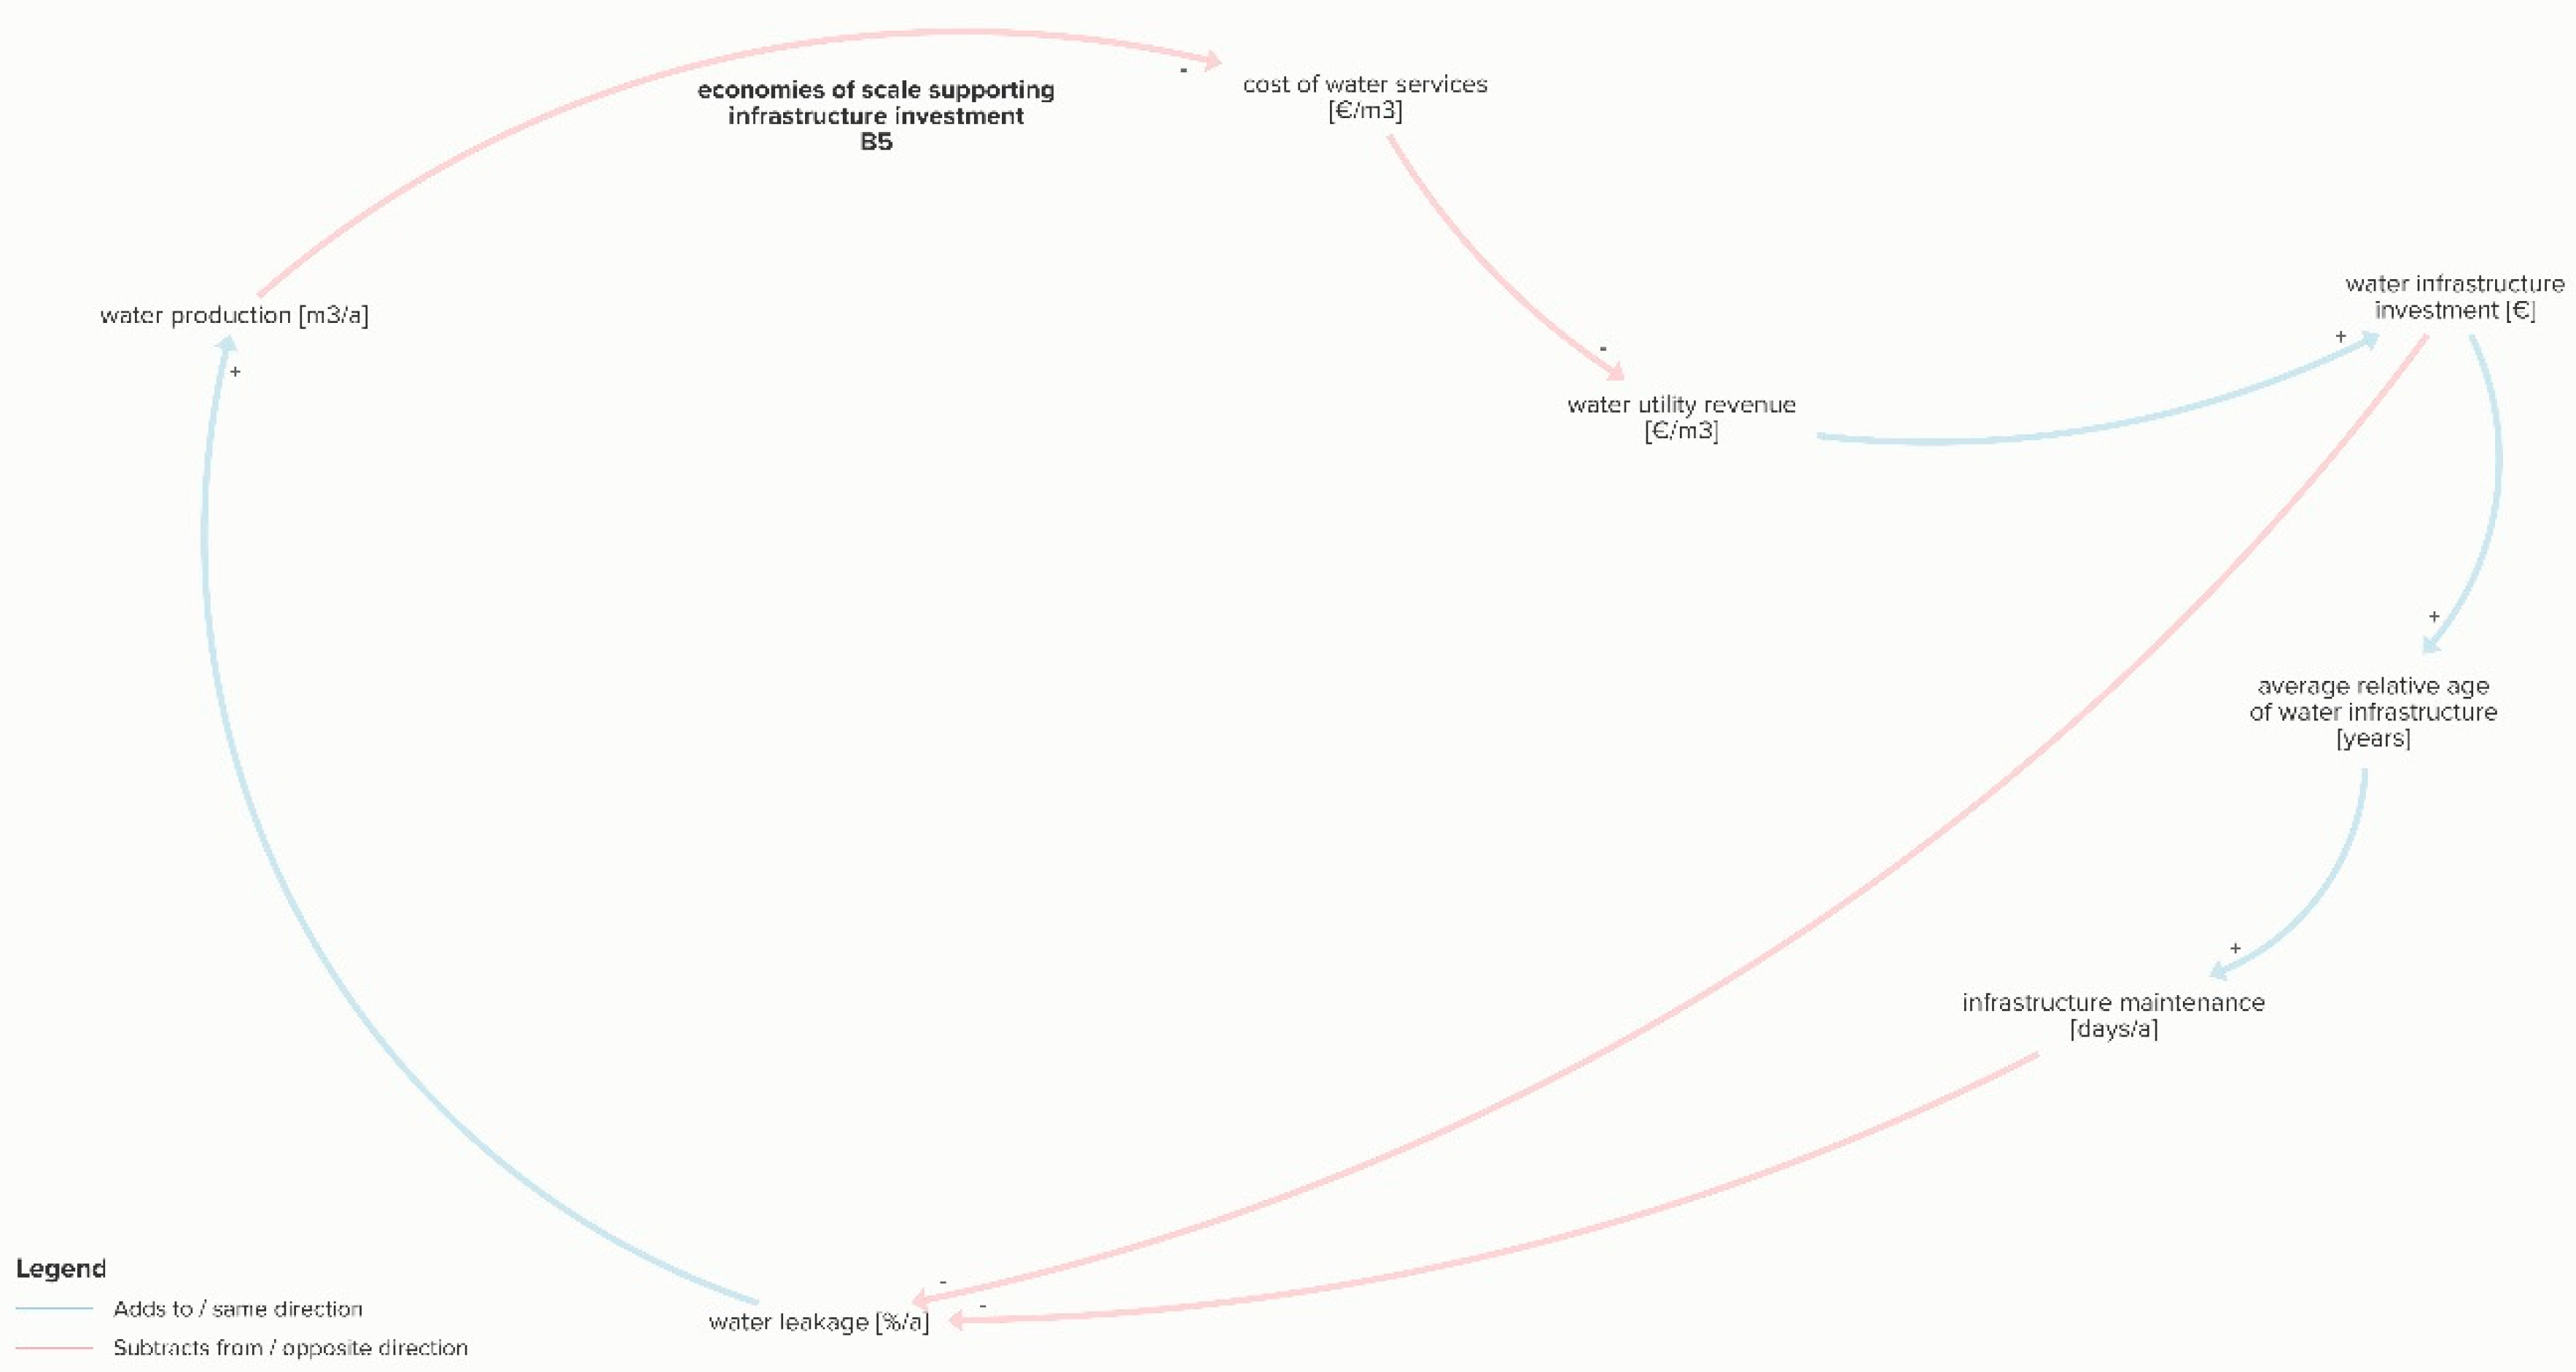
4.3. Economies of Scale Loop
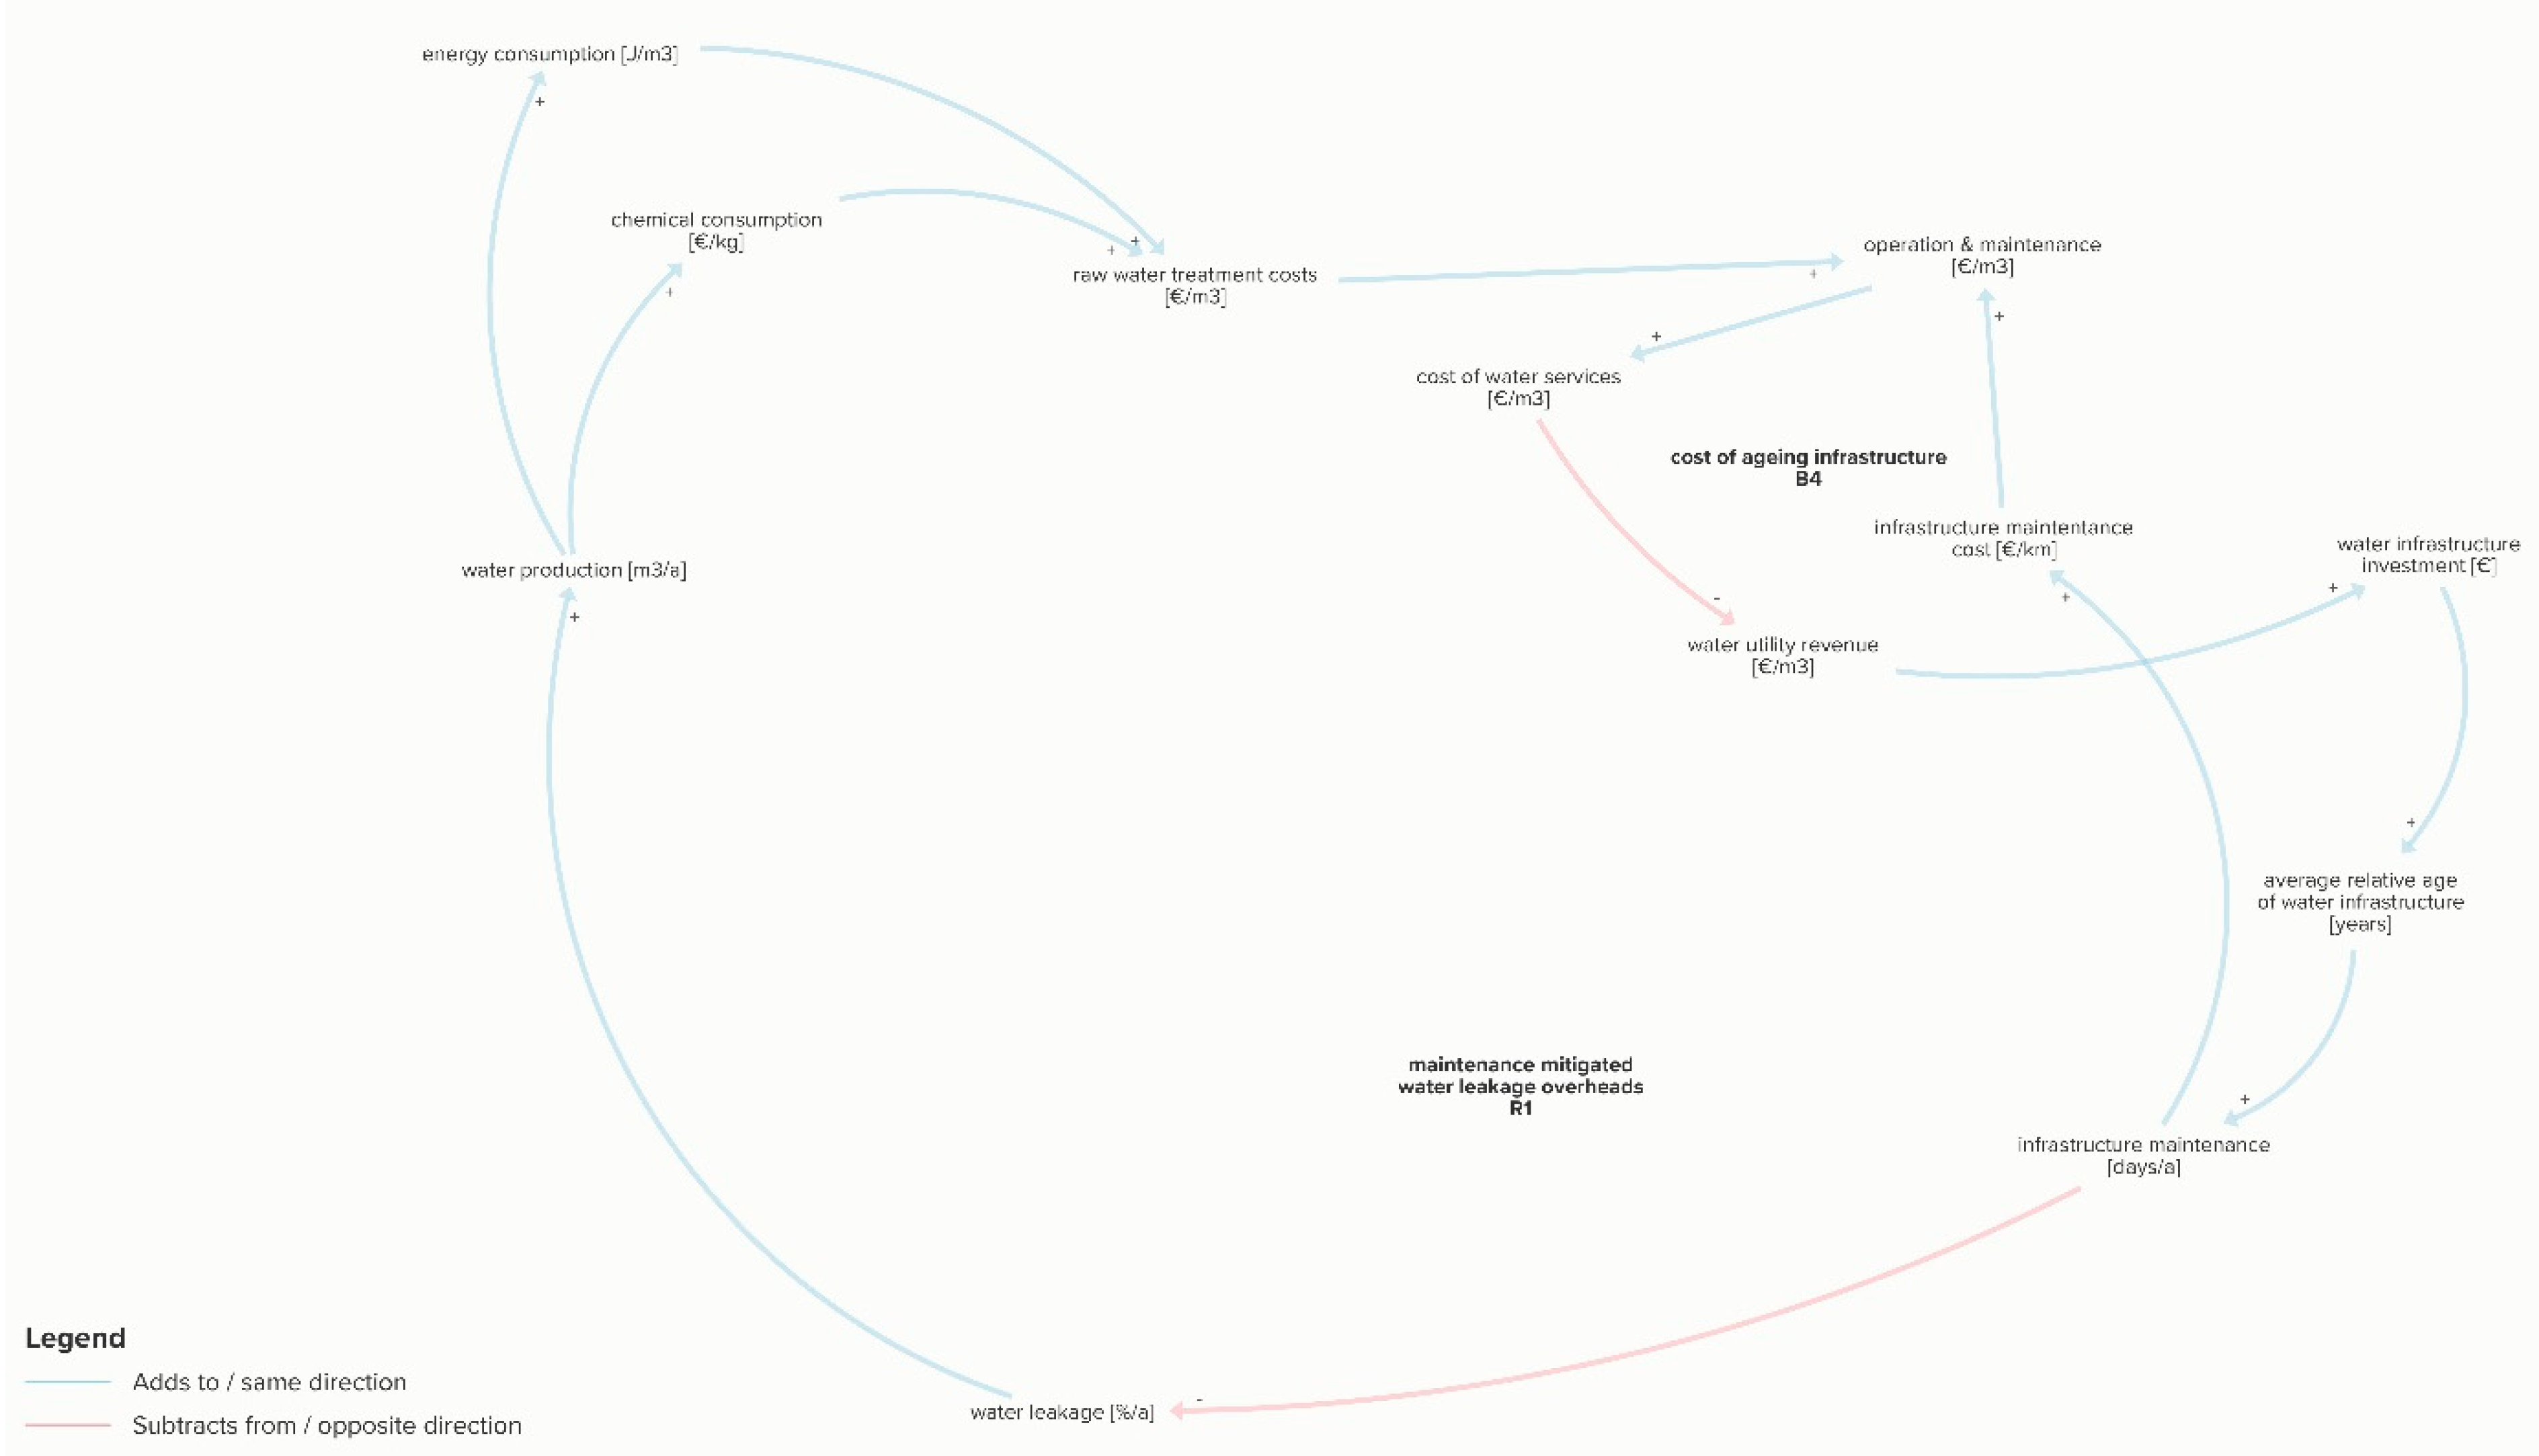
4.4. Overheads Loop
4.5. Resilience Investment Loop
5. Interview Findings
- The bankability of projects to draw in investor interest;
- Knowing the needs of the end consumers of the products recovered to ensure a market demand. (This was accomplished through intentional stakeholder engagement with methods, such as co-creation workshops, hackathons, summer camps, local seminars, and demonstration events where end consumers provided feedback that helped develop the design of the project)
- Legislation being an enabler of circular practices.
6. The Circular Water System
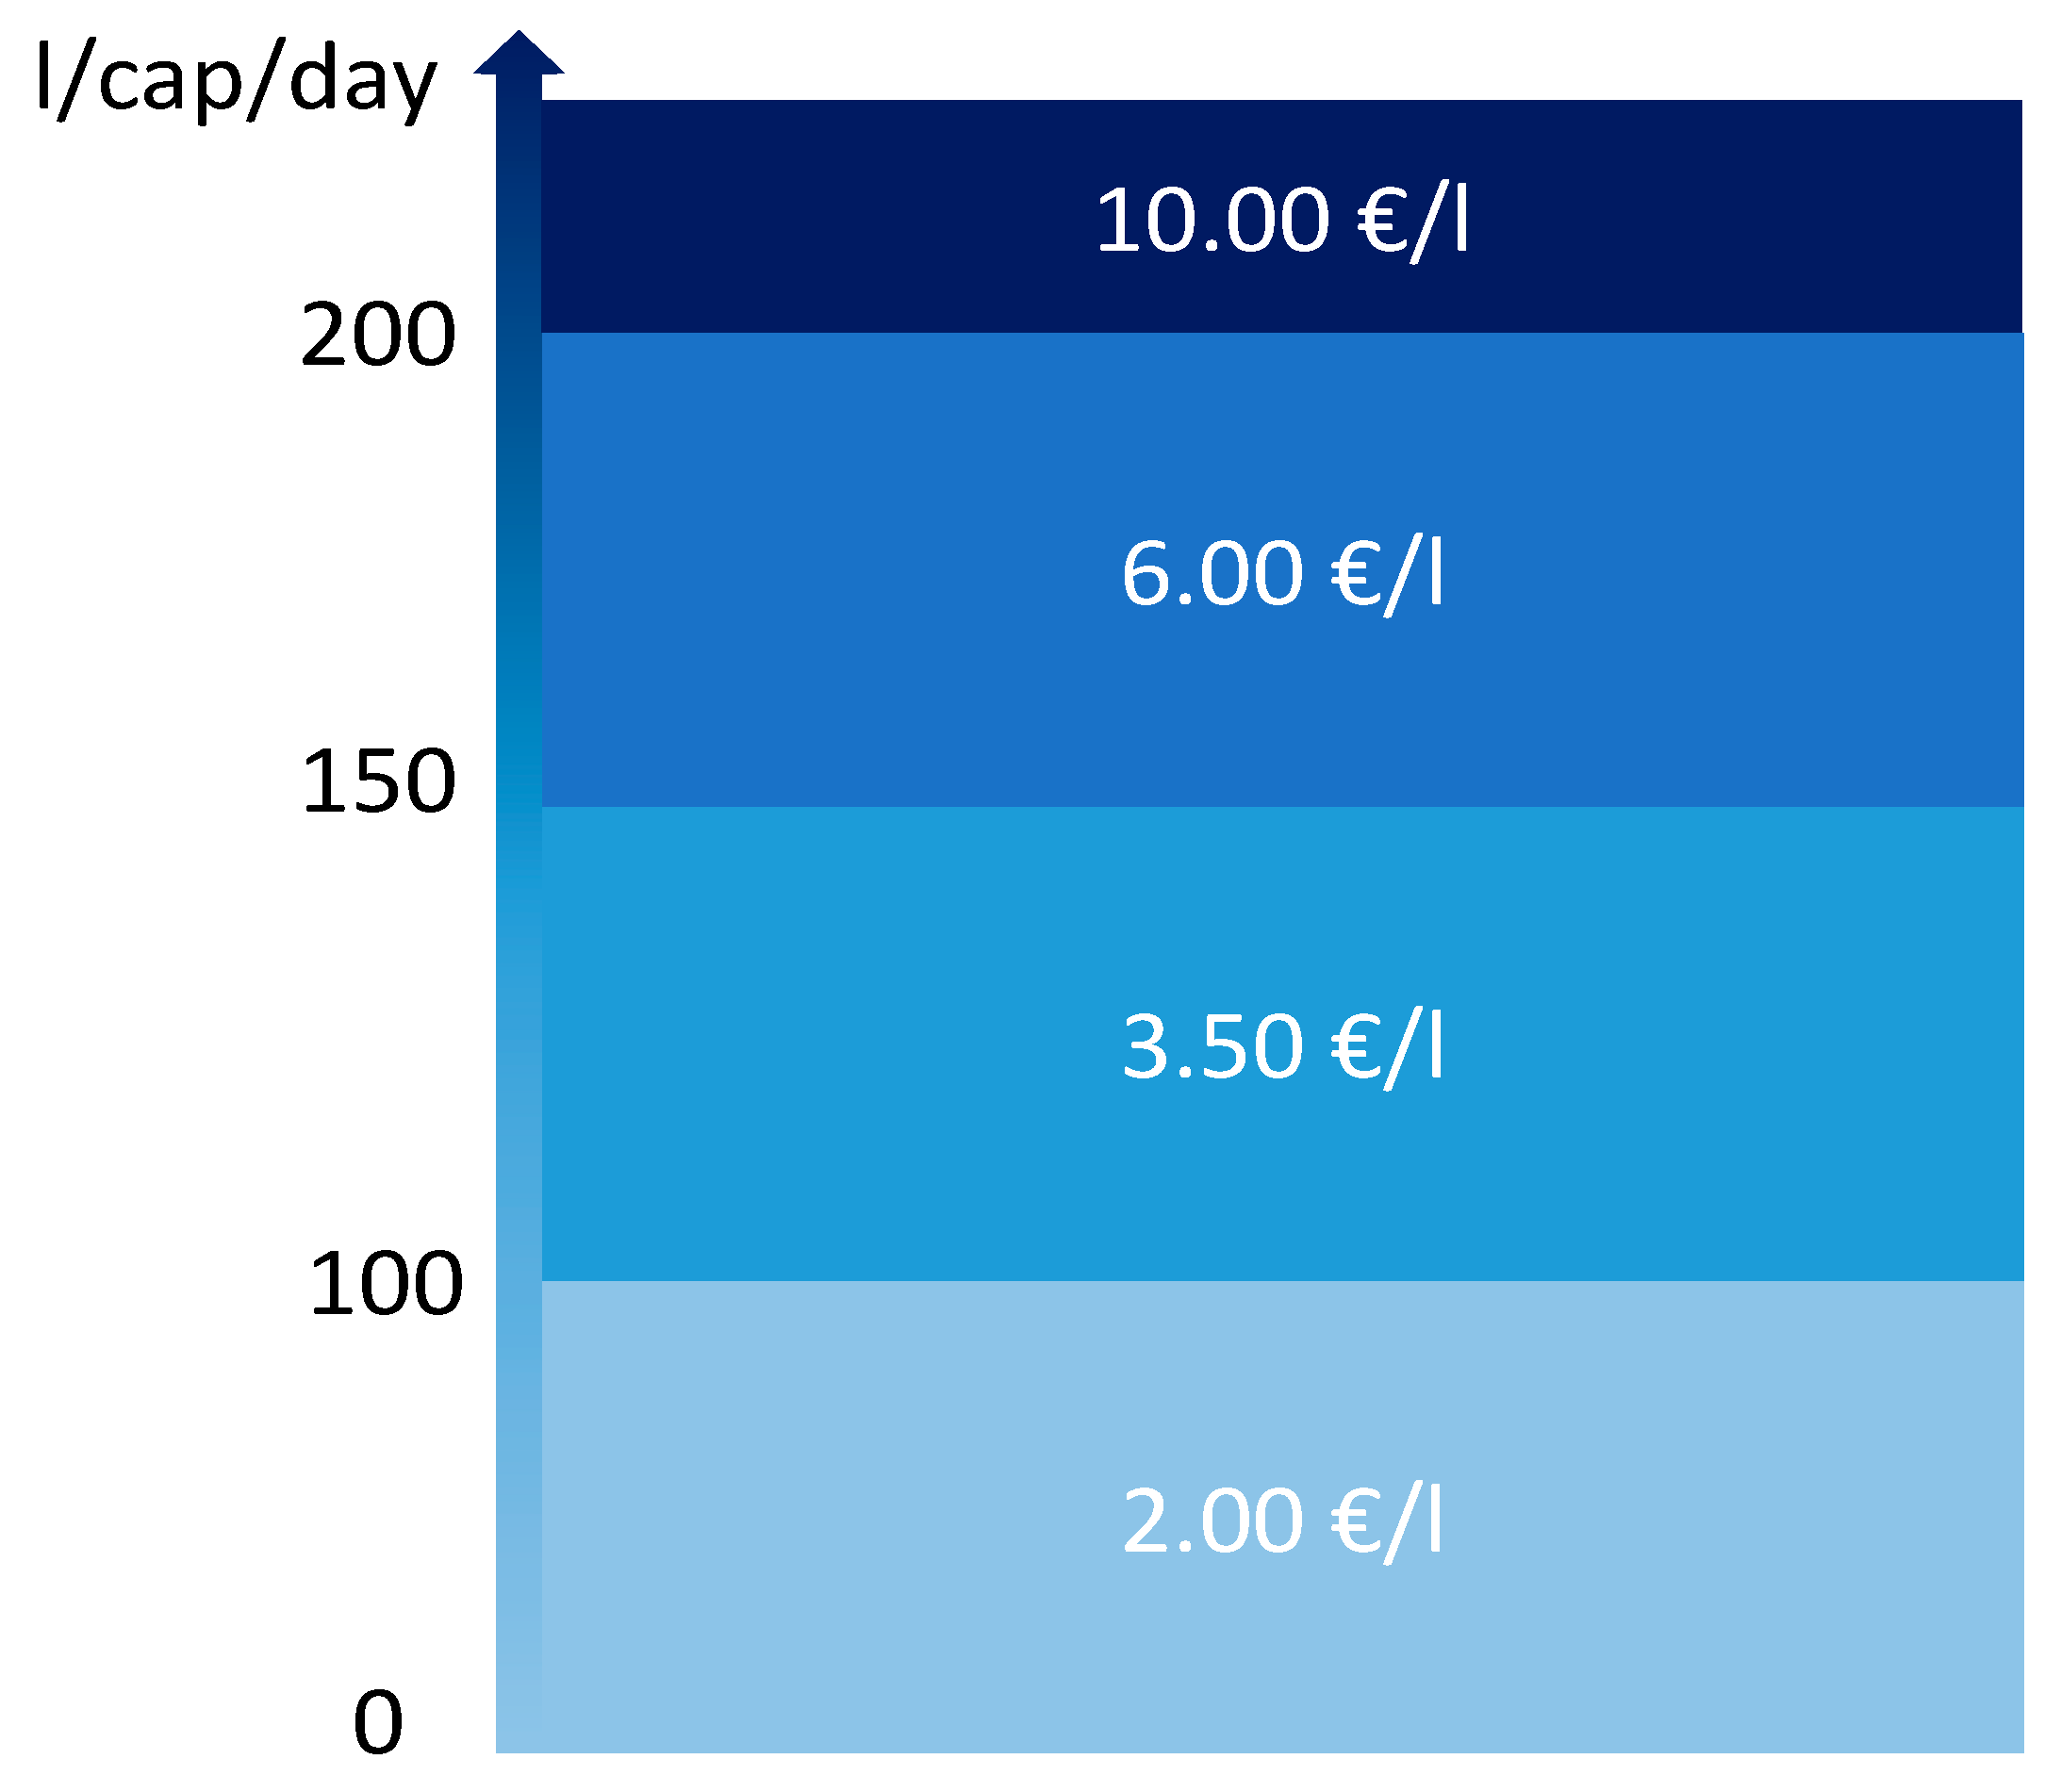
6.1. Alternative Water Billing
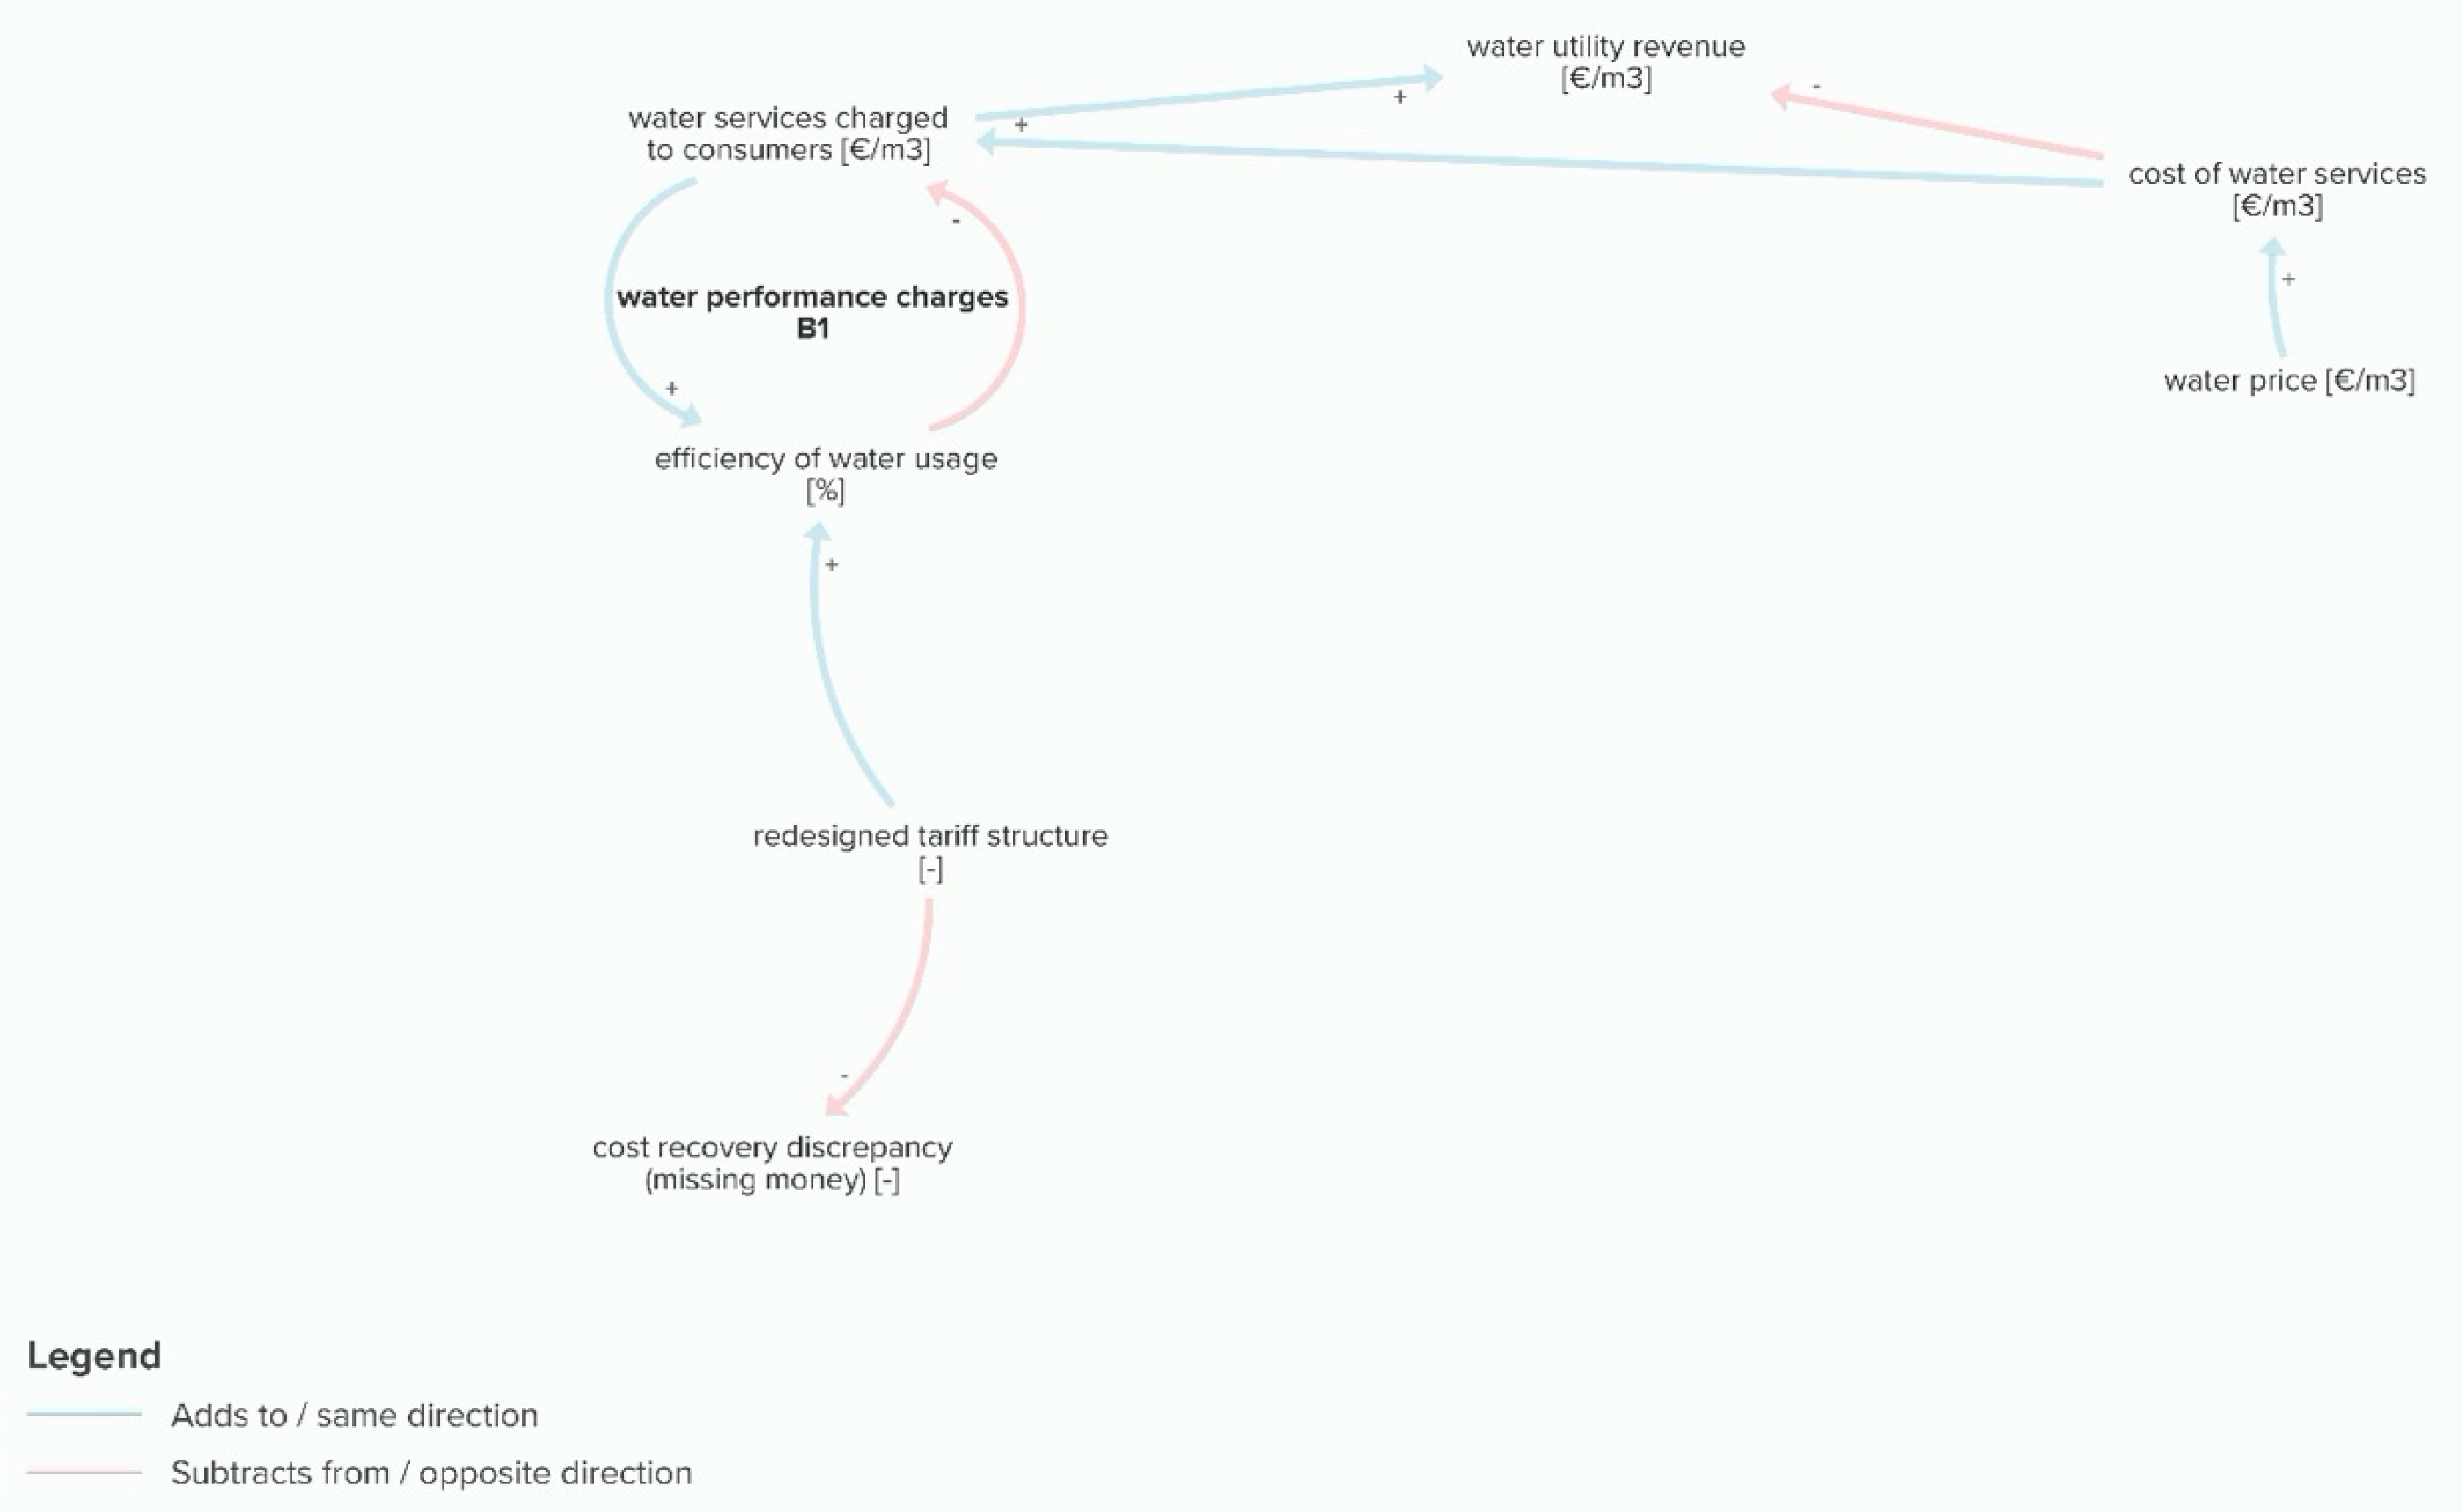
6.2. The Effects of Water-Performance Based Charges
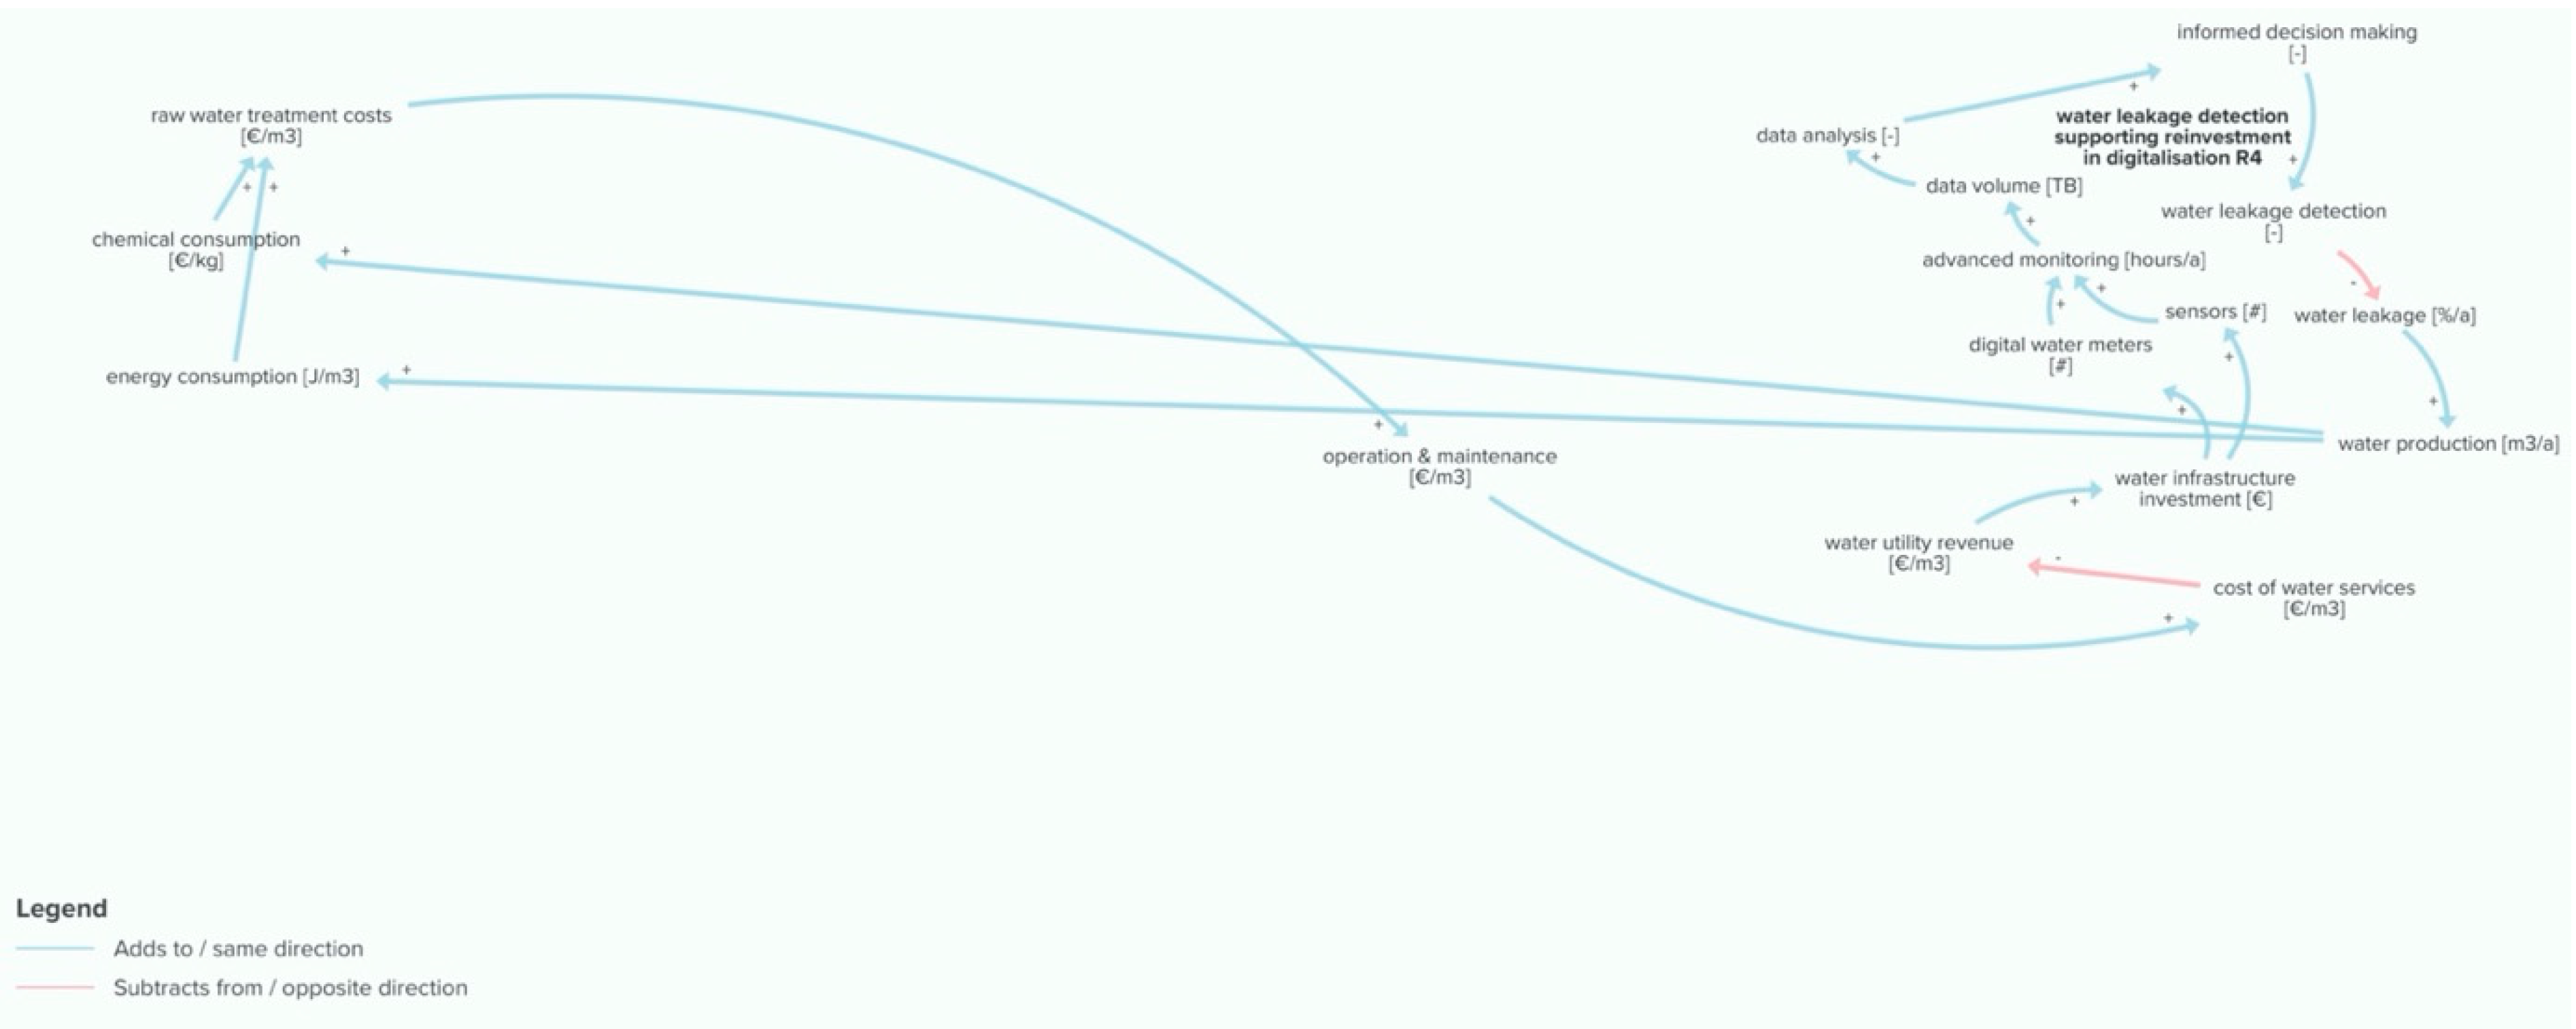
6.3. Digitalization Loop
6.4. Cost of Digitalization Loop
7. Discussion
- A substantial part of the water bill be variable (charged per cubic meter);
- Volumetric or increasing block (banded system) rates be used;
- Rates are high enough to enable water service suppliers to invest in (efficient and environmentally sound) improvements, innovation and expansion;
- Affordability be addressed by separate, social measures, and not by interventions reducing water price incentives (such as reduced VAT rates);
- Regional variations in water-scarcity and other relevant conditions are to be reflected in water prices;
- Different water users are treated on an equal footing;
- Differences in water prices are related to differences in water-use characteristics and not to the sector in question.
8. Conclusions
Author Contributions
Funding
Data Availability Statement
Acknowledgments
Conflicts of Interest
Appendix A
| Node | Description |
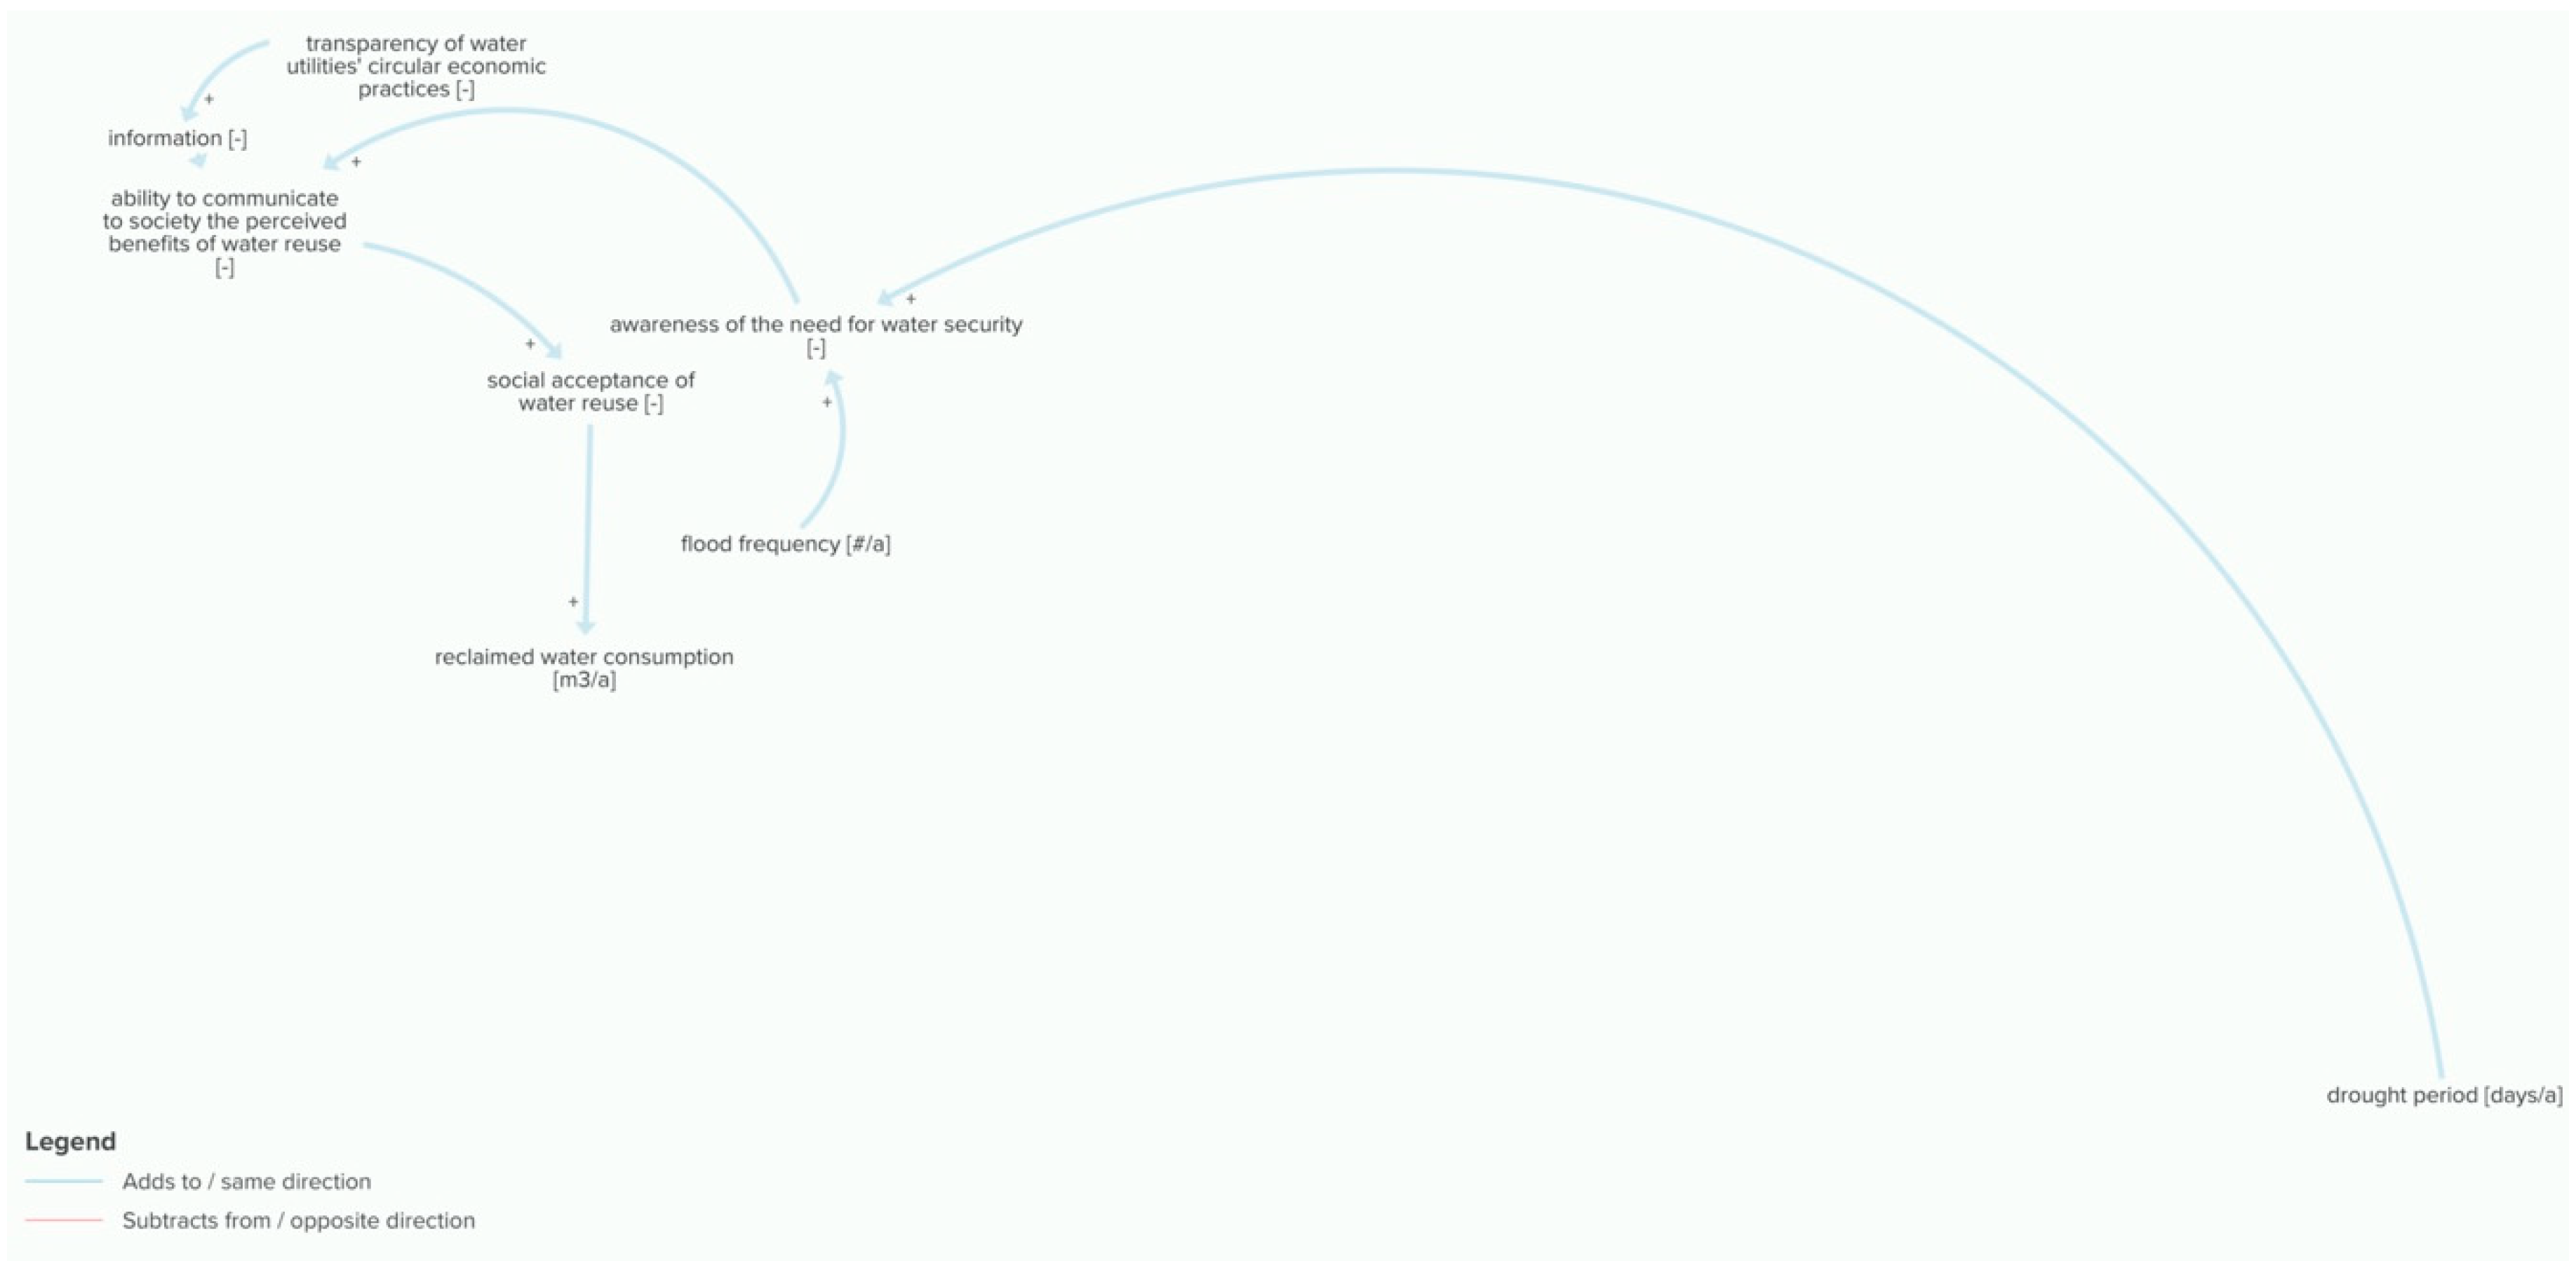
| ability to communicate to society the perceived benefits of water reuse (-) | the effectiveness of the level of communication used to convey to society the benefits of water reuse |
| actual cost recovery (%) | the portion of costs covered by revenues |
| advanced monitoring (-) | digital means of monitoring network state and water |
| agricultural farming (km2) | area of land dedicated to agricultural farming practices |
| agricultural water consumption (m3/a) | the volume of water consumed by agricultural farmers per year |
| amortization (€/a) | the capital expenses associated with investments over their useful life |
| average relative age of water infrastructure (years) | the average year’s infrastructure is in operation in a particular year |
| awareness of the need for water security (-) | the level of public perception for the need for water security |
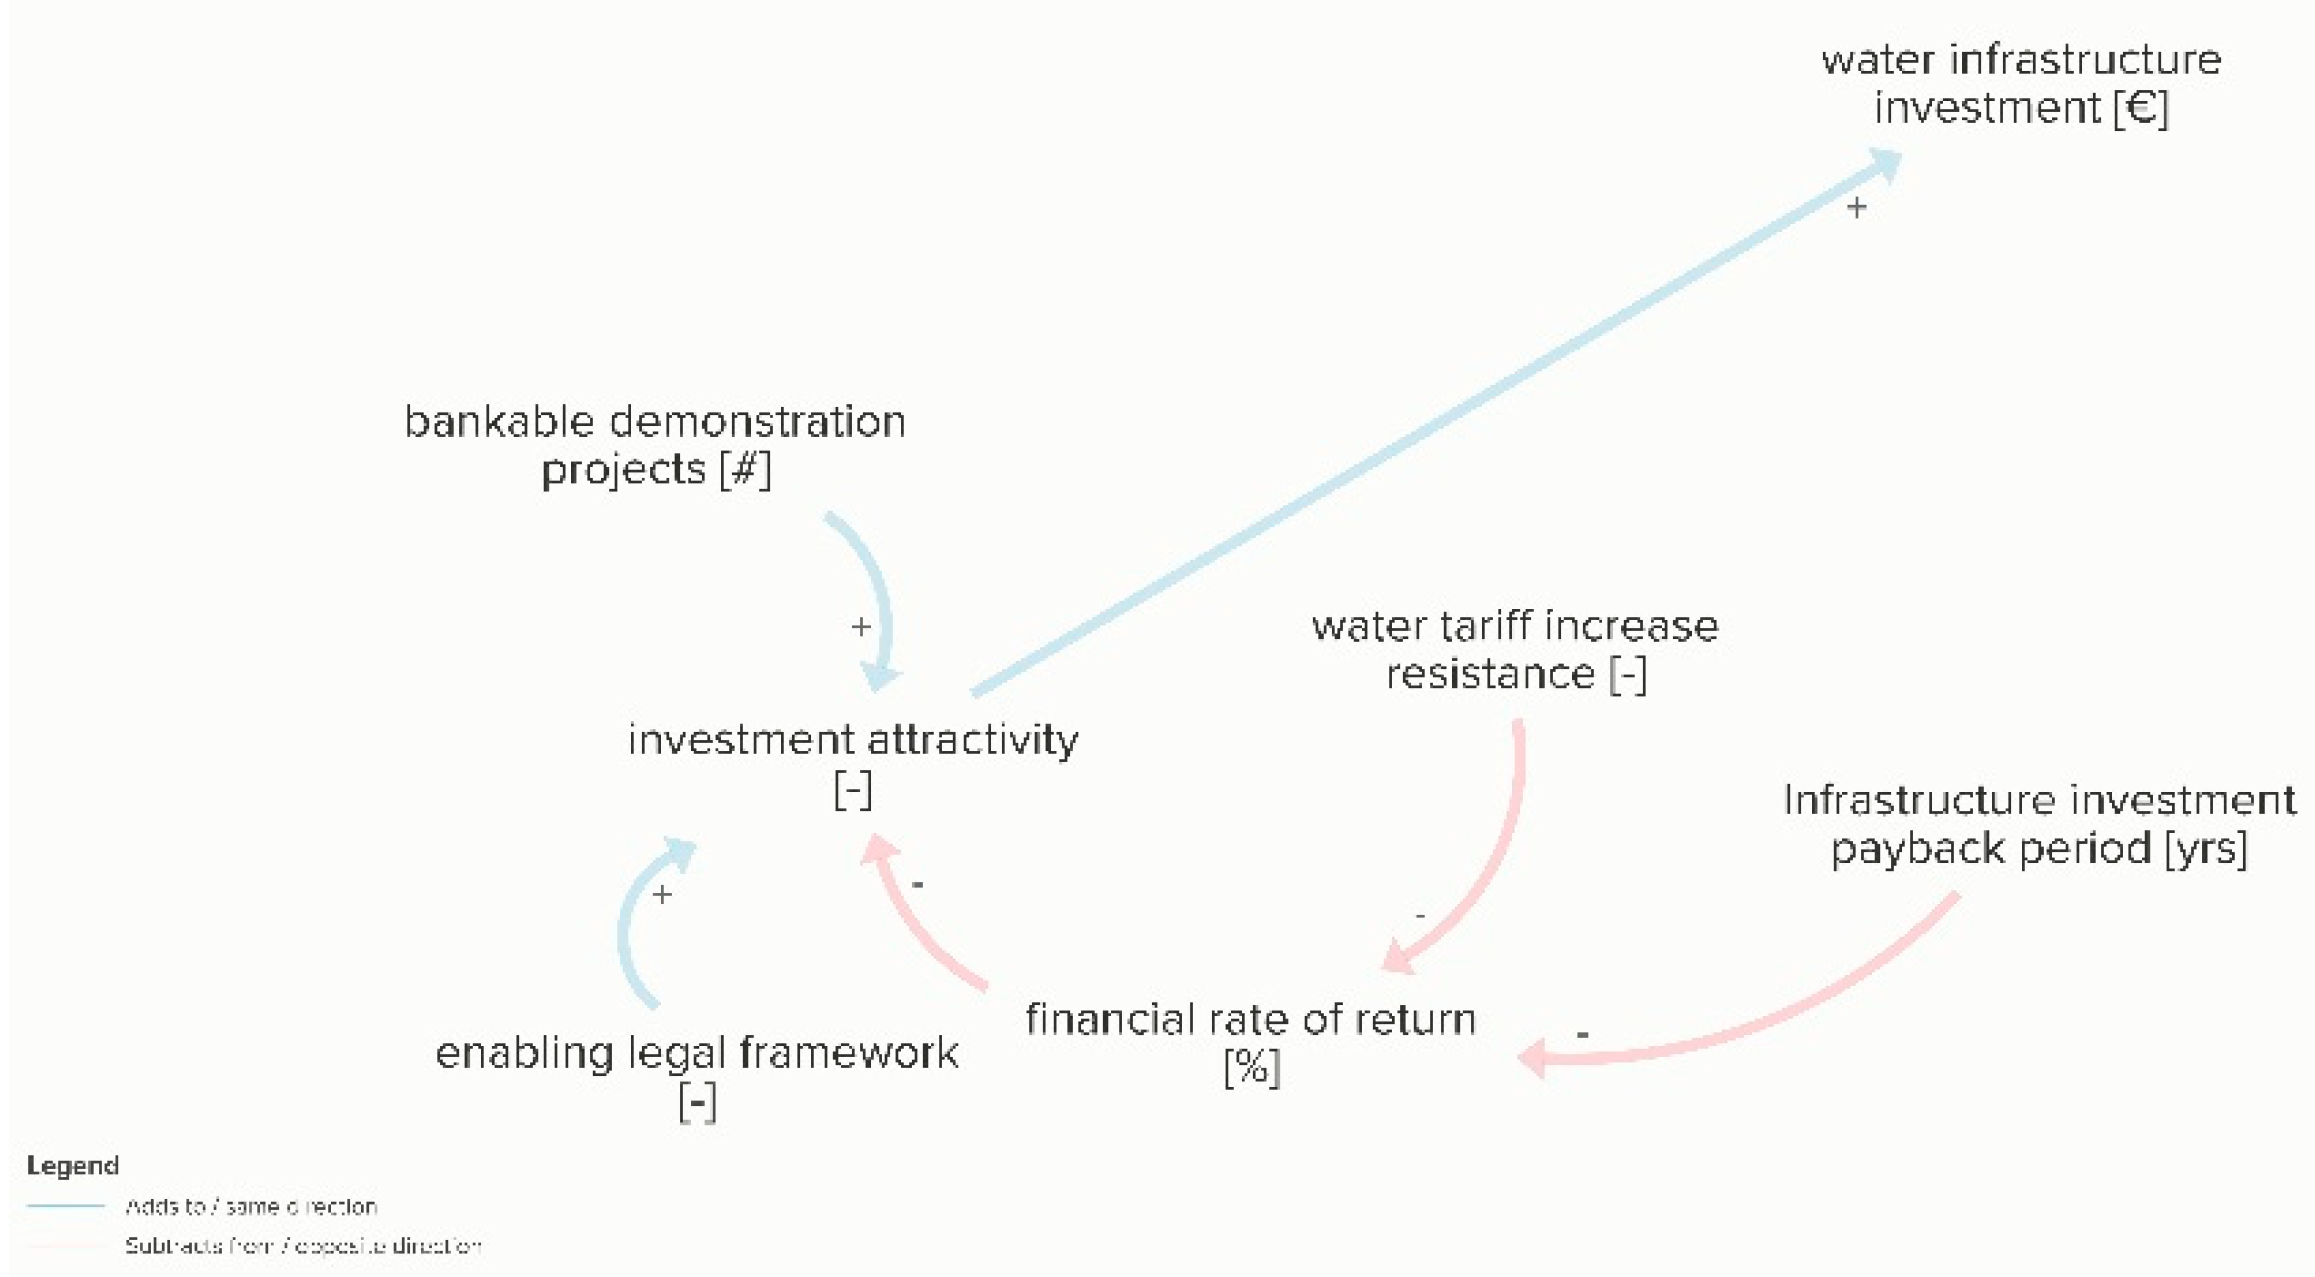
| bankable demonstration projects (#) | number of projects that have demonstrated bankability |
| biogas (m3/a) | the volume of biogas produced per year from anaerobic digestion of sludge |
| bioplastics production (t/a) | the mass of bioplastics produced from the treatment of wastewater effluent |
| built-up area (km2) | area of the built-up environment |
| chemical consumption (€/kg) | cost per weight of chemicals used for raw or wastewater treatment |
| consumption awareness (-) | the level of awareness consumers have of their consumption levels and over time patterns |
| cost of water services (€/m3) | costs incurred per volume of water for providing water services to consumers |
| cost recovery discrepancy (missing money) (-) | the difference between full cost recovery and the actual level of cost recovery of water utilities |
| customer affordability (%) | affordability of consumers measured as a percentage of national income average |
| cybersecurity concerns (-) | data protection concerns when storing, sharing and utilizing real-time data from critical infrastructure |
| data analysis (-) | converting collected and stored data into information and knowledge |
| data volume (TB) | the volume of stored data collected from the water network |
| decentralized water treatment systems (#) | the number of deployed decentralized treatment systems |
| digital consumption data services (-) | the service offered to consumers by water utilities displaying their current and past monthly consumption levels digitally |
| digital water meters (#) | the number of deployed smart water meters |
| the discrepancy between true and actual water price (€/m3) | the difference between the true value of water and the water tariffs passes on to consumers |
| domestic water consumption (m3/a) | the annual volume of water consumed in the residential sector |
| drought period (days/a) | drought frequency in the number of days per year |
| early pump failure detection (-) | the prediction of pump failure through digital means |
| the economic development of utility (%/a) | percentage change per year of net profit |
| the efficiency of water usage (%) | the percentage of water saved compared to the previous month and/or the same month of the previous year |
| enabling legal framework (-) | the existence of established coherent legislation and accompanying regulation on the EU-level |
| energy consumption (J/m3) | energy consumed per volume of water produced in process treatments and distribution |
| eutrophication (µg/L) | water pollution often induced by the discharge of nitrate or phosphate-containing detergents, fertilizers, or sewage into an aquatic system causing excessive enrichment; resulting in excessive growth of algae and oxygen depletion in water |
| financial rate of return (%) | the net gain or loss on the investment made by water utilities as a percentage of the investment’s initial cost |
| flood frequency (#/a) | flood frequency in the number of times per year |
| food production (t/a) | the amount of food produced from crops grown |
| freshwater resources (MCUM) | the combined volume of freshwater resources in water bodies in millions of cubic meters |
| full cost recovery (%) | when the revenue generated covers 100% or more of water utilities’ expenses |
| green capital funding allocation (m€) | the portion of government budget allocated to issuing green bonds to eligible projects |
| greenhouse gas emissions (CO2 eq/m3) | C02 eq. per volume of water produced |
| green investment attractiveness (-) | the degree to which the water industry exhibits investment potential for green investors |
| green nature-based infrastructure (km2) | the area of land dedicated to different types of green infrastructure |
| heat recovery (MJ/a) | the amount of thermal energy recovered a year for a secondary use |
| incineration (t/a) | the amount of waste from wastewater treatment plant sent to the incineration for final disposal |
| industrial water consumption (m3/a) | annual volume consumed in the industrial sector |
| information (-) | the amount of information shared with the public for educational purposes |
| informed decision-making (-) | the number of decisions that can be taken based on analyzed data that is converted into actionable information that enables decisive decision-making |
| Infrastructure investment payback period (y) | the time taken to recover the cost of investment |
| infrastructure maintenance (days/a) | time dedicated to infrastructure maintenance measured in days |
| infrastructure resilience (-) | the ability of the water infrastructure to maintain a level of service reliability despite any shocks |
| infrastructure resilience investment (€) | the level of investment that goes into fortifying the water infrastructure against external shocks |
| investment attractiveness (-) | the degree to which the water industry exhibits investment potential for investors |
| landfill (t/a) | the annual amount of waste wastewater utilities send to landfills |
| legislation obliging rainwater separation (-) | the enforcement of the collection of rainwater by law from all households |
| local municipal/government budget (m€/a) | the total annual budget government budget |
| manual overflow monitoring (#/month) | conventional monitoring of system overflows |
| market demand for water solutions providers (-) | a market created as a result of water solutions that are required but are not fulfilled by water utilities |
| national income average (€/a) | The median household income per annum |
| new services (-) | extended service offerings as a result of CE |
| nutrient recovery (t/a) | the amount of phosphate recovered from wastewater per year |
| operation and maintenance (€/m3) | cost per volume of water produced attributed to operation and maintenance |
| organic soil conditioner (t/a) | amount of bio-waste from sludge converted into soil conditioner for agricultural farmers |
| phosphate (t/a) | the amount of phosphorus compounds extracted from sludge |
| population growth (%/a) | the percentage increase of city dwellers per annum |
| predictive maintenance (-) | techniques applied to determine when maintenance should occur; enabled by technology that monitors the state of in-service equipment |
| rainwater harvesting (m3) | the volume of rainwater accumulated from rooftops and stored for reuse onsite for sanitation rather than allowing it to run off |
| raw water treatment costs (€/m3) | the cost of treating abstracted water per unit volume |
| reclaimed water (m3) | the volume of wastewater that is reused for the same or another purpose |
| redesigned tariff structure (-) | reconfiguration of the conventional flat or volume-based tariff structure |
| resource conservation (-) | the preservation of the quantity and quality of water resources |
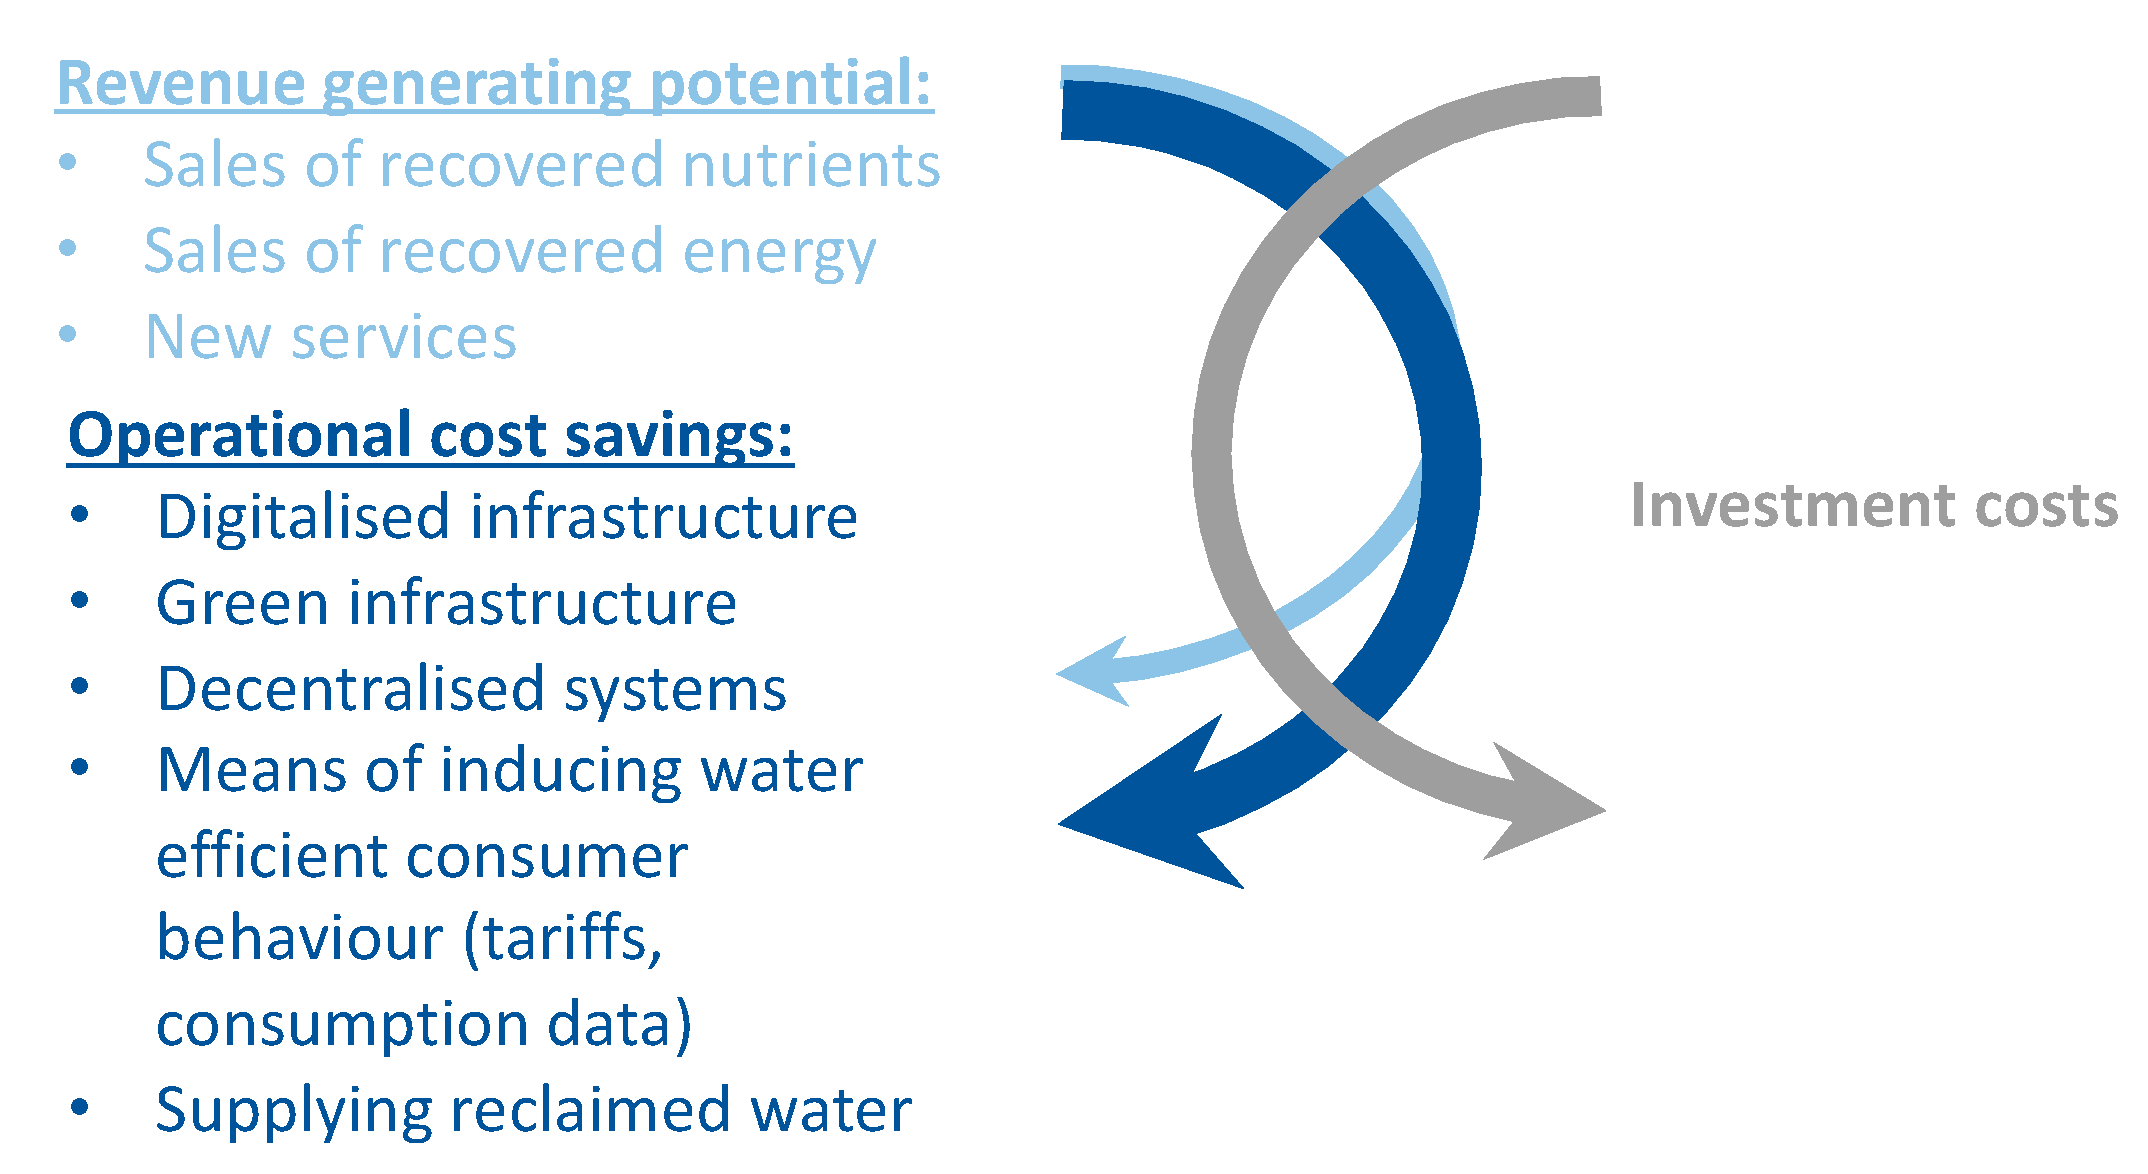
| revenue-generating potential (-) | the ability to create value |
| risk of urban drainage flooding (-) | the likelihood of flooding due to poor/insufficient urban drainage system |
| sensors (#) | the number of sensors deployed in the water network |
| shared infrastructure maintenance services (-) | sharing water infrastructure as a service offering to another unrelated field where maintenance is outsourced to water utilities |
| sludge (t/a) | the annual amount of residual, semi-solid material that is produced as a byproduct during sewage treatment of municipal wastewater |
| social acceptance of water reuse (-) | level of public support for water reuse |
| speed of runoff (m/s) | The speed of the flow of excess water (i.e., more than the land can absorb) across the surface of the land |
| stormwater overflow (m3/s) | the flow of excess water directly attributed to rain from extreme weather |
| system security measures (-) | measures in place to reinforce data security, limit the risk of a cyberattack and shield from the impacts of an attack |
| taxes (%) | taxes received by water utilitiesincome taxes that utilities pay |
| transparency of water utilities’ circular economic practices (-) | how much water utilities are willing to show, open up about and inform the public of their practices regarding CE and the outcomes |
| treated biosolid waste (t/a) | the amount of organic solid waste that results from treated sewage per year |
| treated effluent discharge (m3/a) | the amount of the liquid part of treated sewage discharged per year |
| treated sludge (t/a) | the annual amount of sewage sludge from wastewater that is treated per year |
| the true value of water (€/m3) | the price of water reflective of involved externalities and resources costs |
| untreated wastewater overflow (m3/s) | the flow of excess wastewater due to flooding |
| urbanization (%/a) | percentage change in the number of citizens moving to urban areas per year |
| urban runoff (L/s) | The flow of excess water (i.e., more than the urban drainage system can absorb) across the urban surface |
| wastewater (m3/a) | the volume of wastewater that needs to be treated per year |
| wastewater treatment (m3/a) | the volume of wastewater treated per year in a wastewater treatment plant |
| wastewater treatment costs (€/m3) | the cost of collecting, treating and disposing of wastewater (including any additional process steps for extraction of suspended contents) |
| water and sanitation subsidies (m€/a) | the number of government funds targeted at supporting water utilities’ operations expenditures as a result of the difference between the revenue generated and expenses incurred |
| water consumption (m3/a) | the total volume of water consumed per year |
| water consumption per capita (m3/cap/a) | the volume of water consumed per person per year |
| water infrastructure investment (€) | the amount of money spent on investing in water infrastructure |
| water leakage (%/a) | percentage per year of water supplied that is lost in the distribution before reaching consumers |
| water leakage detection (-) | the ability to locate water leakages along the water network |
| water management consulting (-) | service offered by water utilities to other sectors looking to implement sustainable water management |
| water pollution (ppm) | number of contaminants present in water resources in parts per million |
| water price (€/m3) | the price of water in the form of water tariffs, taxes or transfers |
| water production (m3/a) | the total volume of water abstracted, treated and supplied to consumers per year (including water lost) |
| water productivity (€/m3) | measures the amount of economic output produced (euros or PPS purchasing power standard) per unit of water abstracted (m3) and provides some indication of how efficiently water resources are used. |
| water quality (ppm) | the measure of the condition of water relative to the requirements of any human need or purpose |
| water-saving devices (#) | the number of water-saving devices sold by water utilities to be installed in consumer households |
| water services charged to consumers (€/m3) | the price of water services passed on to consumers per unit volume of water (different from the cost of water services) |
| water tariff increase resistance (-) | the level of opposition to the increase of water tariffs from water stakeholders |
| water utility revenue (€/m3) | net profit per unit volume of water supply and wastewater utilities |
| winter greenhouse energy consumption (kJ/a) | the annual energy consumption of winter greenhouses |
Appendix B
Appendix B.1. Barriers to Circular Economy in Water
Appendix B.2. The Price of Water
Appendix B.3. Infrastructure
Appendix B.4. Circular Practices
Appendix B.5. Digitalization
Appendix C
Appendix C.1. Transcript of Belgian University Professor and Water Utility Personnel
- The city government—it all starts with them to develop a new district. They have to include rational water use and sustainable water treatments as one of the criteria to the granted project.
- Project developers—to understand the need for water treatment and to implement it
- Technology providers—the technology has to be ready
- Operators—e.g., Farys to operate the treatment and also the energy service company
- Customers—for example in Ghent they are connected to the district heating system that better we use the district heating system the more revenue we make. Grey and blackwater needs to be separated. With blackwater we can treat kitchen waste so the better they separate their kitchen waste and avoid placing plastics in the waster the better the plant operates and the more revenue we can make.
Appendix C.2. Transcript of Dutch Utility Personnel
Appendix C.3. Transcript of HYDROUSA Project
- as an in-house revenue generating business activity
- sludge sold to a third party (e.g., Billund BioRefinery in Denmark)
- handling of sludge, treatment and recovery outsource to a third party that retains the sales revenue but also sells back/gives back some biogas produced for the wastewater treatment plant’s energy needs
- other
Appendix C.4. Transcript of CEO of Water Utility Solutions Company
Appendix C.5. Transcript of Private Software Corporation Utilities Specialist
Appendix D
Appendix D.1. Digitalization
- Reduce the water footprint up to 90%;
- Introduce safe recycling of nutrients for urban food production;
- Provide a user-friendly control and communication platform.
Appendix D.1.1. Accumulating Real Time Data from the Sewerage System
Appendix D.1.2. Improve Utility Management
Appendix D.1.3. Smart Information and Instant Action
Appendix D.1.4. Smarter Ways to Control Overflows
Appendix D.1.5. Smart Data Logging Improves Monitoring and Reporting of Data
Appendix D.1.6. Need for Smarter Data Use to Secure Water Quality in Norwegian Fjords
Appendix D.1.7. A System to Store Real-Time Data
Appendix D.1.8. Smart Data Storage Provides New Opportunities for Their Utilization
Appendix D.1.9. Need to Upgrade Wastewater Systems to Improve the Environment
Appendix D.1.10. Cloud-based Application for Economic Planning and Management
Appendix D.1.11. Improving Decision-Making and Prioritization among Different Options
- Reduced discharge of untreated wastewater: Increased water quality in our waters, in which people can enjoy a swim, and our natural habitat will thrive;
- Reduced flooding: People do not need to worry when rain is expected, and insurance companies are reducing their reimbursements;
- Reduced wastewater treatment costs: Reduced use of chemicals and lower operating costs;
- Cost-efficient long-term planning of infiltration and inflow management reduces the investments and makes more efficient use of existing infrastructure.
References
- Byers, E.A.; Coxon, G.; Freer, J.; Hall, J.W. Drought and climate change impacts on cooling water shortages and electricity prices in Great Britain. Nat. Commun. 2020, 11, 1–12. [Google Scholar] [CrossRef] [PubMed]
- Shastri, H.; Paul, S.; Ghosh, S.; Karmakar, S. Impacts of urbanization on Indian summer monsoon rainfall extremes Hiteshri. J. Geophys. Res. Atmos. 2015, 120, 495–516. [Google Scholar] [CrossRef]
- Vörösmarty, C.J.; Sahagian, D. Anthropogenic disturbance of the terrestrial water cycle. Bioscience 2000, 50, 753–765. [Google Scholar] [CrossRef] [Green Version]
- Marsh & McLennan Companies and Zurich Insurance Group. The Global Risks Report 2019; World Economic Forum: Geneva, Switzerland, 2019; Available online: http://wef.ch/risks2019 (accessed on 13 March 2019).
- European Environment Agency. Close Up—Water in the City; European Environment Agency: København, Denmark, 2019; Available online: https://www.eea.europa.eu/signals/signals-2018-content-list/articles/close-up-2014-water-in (accessed on 25 December 2019).
- European Environment Agency. Use of Freshwater Resources in Europe; European Environment Agency: København, Denmark, 2019; Available online: https://www.eea.europa.eu/data-and-maps/indicators/use-of-freshwater-resources-3/assessment-4 (accessed on 23 December 2019).
- Pearce, D.; Turner, K.; Pearce, D.W.; Turner, R.K. Economics of Natural Resources and the Environment. Am. J. Agric. Econ. 1991, 73, 227–228. [Google Scholar] [CrossRef]
- Stahel, W.R. The Product-Life Factor. In An Inquiry into the Nature of Sustainable Societies: The Role of the Private Sector (Series: 1982 Mitchell Prize Papers); NARC: Patan, Nepal, 1982; pp. 72–105. [Google Scholar] [CrossRef]
- European Commission. Communication from the Commission—Towards a circular economy: A zero waste programme for Europe. Eur. Comm. 2014, 398, 1–14. [Google Scholar]
- Tahir, S.; Steichen, T. Water and Circular Economy: White Paper. 2018. Available online: https://us.anteagroup.com/sites/default/files/Water_and_circular_economy_Co.Project_White_paper.pdf (accessed on 4 March 2019).
- Koszewska, M. Circular Economy–Challenges for the Textile and Clothing Industry. Autex Res. J. 2018, 18, 337–347. [Google Scholar] [CrossRef] [Green Version]
- Dobrucka, R. Bioplastic packaging materials in circular economy. Logforum 2019, 15, 129–137. [Google Scholar] [CrossRef]
- De Angelis, R.; Howard, M.; Miemczyk, J. Supply chain management and the circular economy: Towards the circular supply chain. Prod. Plan. Control 2018, 29, 425–437. [Google Scholar] [CrossRef] [Green Version]
- Pagliaro, M.; Meneguzzo, F. Lithium battery reusing and recycling: A circular economy insight. Heliyon 2019, 5, e01866. [Google Scholar] [CrossRef] [PubMed] [Green Version]
- Veolia. Water at the Heart of the Circular Economy. 2014. Available online: https://www.veolia.com/sites/g/files/dvc2491/files/document/2014/12/economy-circular-water.pdf?fbclid=IwAR18db6PZiMw1GkfrlM7s3m7HpVPzk7JjC150A5KVvlxOWAqdMXYeX2BFfA (accessed on 11 February 2021).
- Meyer, B. Macroeconomic Modelling of Sustainable Development and the Links between the Economy and the Environment. 2012. Available online: http://www.gws-os.com/discussionpapers/gws-researchreport12-1.pdf (accessed on 11 February 2021).
- Stanchev, P.; Vasilaki, V.; Dosta, J.; Katsou, E. Measuring the Circular Economy of Water Sector in the Three-Fold Linkage of Water, Energy and Materials. 2017. Available online: https://pdfs.semanticscholar.org/5824/dac5157d557328540dd109cc9bf3b39263fb.pdf (accessed on 28 September 2020).
- D’Odorico, P.; Davis, K.; Rosa, L.; Carr, J.; Chiarelli, D.; Dell’Angelo, J.; Gephart, J.; MacDonald, G.K.; Seekell, D.A.; Suweis, S.; et al. The Global Food-Energy-Water Nexus Paolo. 2018. Rev. Geophys. 2018, 56, 456–531. [Google Scholar] [CrossRef]
- Del Borghi, L.; Moreschi, L.; Gallo, M. Circular economy approach to reduce water–energy–food nexus. Curr. Opin. Environ. Sci. Heal. 2020, 13, 23–28. [Google Scholar] [CrossRef]
- Smol, M.; Adam, C.; Preisner, M. Circular economy model framework in the European water and wastewater sector. J. Mater. Cycles Waste Manag. 2020, 22, 682–697. [Google Scholar] [CrossRef] [Green Version]
- Smith, H.M.; Brouwer, P.J.; Frijins, J. Public responses to water reuse—Understanding the evidence. J. Environ. Manag. 2018, 207, 43–50. [Google Scholar] [CrossRef] [PubMed] [Green Version]
- Kakwani, N.S.; Kalbar, P.P. Review of Circular Economy in urban water sector: Challenges and opportunities in India. J. Environ. Manag. 2020, 271, 111010. [Google Scholar] [CrossRef] [PubMed]
- Makropoulos, C.K.; Butler, D. Distributed water infrastructure for sustainable communities. Water Resour. Manag. 2010, 24, 2795–2816. [Google Scholar] [CrossRef]
- Roest, K.; Smeets, P.; van den Brand, T.; Zwertvaegher, A.; Cortial, H.; van Odijk, S.; Klaversma, E. Applicability of decentralized versus centralized drinking water production and wastewater treatment in an office park as example of a sustainble circular economy in Amsterdam, The Netherlands. Procedia Environ. Sci. Eng. Manag. 2016, 3, 139–148. [Google Scholar]
- Espíndola, J.A.G.; Cordova, F.; Flores, C.C. The importance of urban rainwater harvesting in circular economy: The case of Guadalajara city. Manag. Res. Rev. 2018, 41, 533–553. [Google Scholar] [CrossRef]
- Stutchey, M. Rethinking the Water Cycle. 2015. Available online: https://www.mckinsey.com/business-functions/sustainability/our-insights/rethinking-the-water-cycle (accessed on 21 August 2019).
- United States Environmental Protection Agency. Green Infrastructure. 2019. Available online: https://www.epa.gov/green-infrastructure (accessed on 4 January 2020).
- Mauter, M.S.; Fiske, P. Desalination for a Circular Water Economy. Energy Environ. Sci. 2020, 13, 3180–3184. [Google Scholar] [CrossRef]
- European Commission Directorate-General for Communications Networks Content and Technology Smart Cities and Sustainability Unit. Emerging Topics and Technology Roadmap for Information and Communication Technologies for Water Management. 2016. Available online: https://www.ict4water.eu/wp-content/uploads/2015/10/ICT4WaterRoadmap2016_final.pdf (accessed on 7 January 2020).
- Anzaldi Varas, G.A.A. Digital Single Market for Water Services Action Plan; European Union: Brussels, Belgium, 2018. [Google Scholar] [CrossRef]
- Daigger, G.T.; Voutchkov, N.; Sarni, W.; Lall, U. The Future of Water: A collection of essays on ‘disruptive’ technologies that may transform the water sector in the next 10 years. Nature 2019, 504, 657. [Google Scholar] [CrossRef]
- Maxwell, S. Water Is Still Cheap: Dmeonstrating the True Value of Water. Am. Water Works Assoc. 2012, 104, 31–37. Available online: https://www.jstor.org/stable/10.2307/jamewatworass.104.5.31 (accessed on 2 January 2020). [CrossRef]
- The European Federation of National Associations of Water Services (EurEau). The Governance of Water Services in Europe. 2015. Available online: http://www.eureau.org/resources/publications/150-report-on-the-governance-of-water-services-in-europe/file (accessed on 21 August 2019).
- European Parliament and European Council. Water Framework Directive 2000/60/EC: Establishing a Framework for Community Action in the Field of Water Policy; European Parliament and European Council: Brussels, Belgium, 2000. [Google Scholar]
- European Environment Agency. Assessment of Cost Recovery through Water Pricing; EEA Technical Report; Environmental Economics; Amsterdam Global Change Institute: Amsterdam, The Netherlands, 2013. [Google Scholar] [CrossRef]
- European Commission. Communication from the Commission to the European Parliament, the Council, the European Economic and Social Committee and the Committee of the Regions; Roadmap to a Resource Efficient Europe; European Environment Agency: København, Denmark, 2012. [Google Scholar]
- Maaß, O.; Grundmann, P. Added-value from linking the value chains of wastewater treatment, crop production and bioenergy production: A case study on reusing wastewater and sludge in crop production in Braunschweig (Germany). Resour. Conserv. Recycl. 2016, 107, 195–211. [Google Scholar] [CrossRef]
- Dobbs, R.; Pohl, H.; Lin, D.-Y.; Mischke, J.; Garemo, N.; Hexter, J.; Matzinger, S.; Palter, R.; Nanavatty, R. Infrastructure Productivity: How to Save $1 Trillion a Year. 2013. Available online: http://scholar.google.com/sch (accessed on 23 December 2019).
- Abu-Ghunmi, D.; Abu-Ghunmi, L.; Kayal, B.; Bino, A. Circular economy and the opportunity cost of not ‘closing the loop’ of water industry: The case of Jordan. J. Clean. Prod. 2016, 131, 228–236. [Google Scholar] [CrossRef]
- Binder, T.; Vox, A.; Belyazid, S.; Haraldsson, H.; Svensson, M. Developing System Dynamics Models from Causal Loop Diagrams. In Proceedings of the 22nd International Conference of the System Dynamic Society, Oxford, UK, 25–29 July 2004; pp. 1–21. Available online: https://pdfs.semanticscholar.org (accessed on 30 December 2017).
- Meadows, D.H. Thinking in Systems: A Primer; Earthscan: London, UK, 2008. [Google Scholar]
- Purwanto, A.; Sušnik, J.; Suryadi, F.X.; De Fraiture, C. Using group model building to develop a causal loop mapping of the water-energy-food security nexus in Karawang Regency, Indonesia. J. Clean. Prod. 2019, 240, 118170. [Google Scholar] [CrossRef]
- Voulvoulis, N. Water reuse from a circular economy perspective and potential risks from an unregulated approach. Curr. Opin. Environ. Sci. Health 2018, 2, 32–45. [Google Scholar] [CrossRef]
- Lipińska, D. The Water–Wastewater–Sludge Sector and the Circular Economy. Comp. Econ. Res. 2018, 21, 121–137. [Google Scholar] [CrossRef] [Green Version]
- Werner, B.; Collins, R. Towards Efficient Use of Water Resources in Europe; EEA: Copenhagen, Denmark, 2012. [Google Scholar] [CrossRef]
- Babamiri, A.S.; Pishvaee, M.S.; Mirzamohammadi, S. The analysis of financially sustainable management strategies of urban water distribution network under increasing block tariff structure: A system dynamics approach. Sustain. Cities Soc. 2020, 60, 102193. [Google Scholar] [CrossRef]
- McKinsey & Company. The Circular Economy: Moving from Theory to Practice; McKinsey & Company: New York, NY, USA, 2016. [Google Scholar]
- Mhatre, P.; Panchal, R.; Singh, A.; Bibyan, S. A systematic literature review on the circular economy initiatives in the European Union. Sustain. Prod. Consum. 2021, 26, 187–202. [Google Scholar] [CrossRef]
- Amec Foster Wheeler; IEEP; ACTeon; IMDEA; NTUA. EU-Level Instruments on Water Reuse: Final Report to Support the Commission’s Impact Assessment; European Union: Luxemburgo, 2016. [Google Scholar] [CrossRef]
- Shaddel, S.; Bakhtiary-Davijany, H.; Kabbe, C.; Dadgar, F.; Østerhus, S.W. Sustainable sewage sludge management: From current practices to emerging nutrient recovery technologies. Sustainability 2019, 11, 3435. [Google Scholar] [CrossRef] [Green Version]
- Ellen MacArthur Foundation. Towards the Circular Economy: Opportunities for the Consumer Goods Sector; Ellen MacArthur Foundation: Cowes, UK, 2013. [Google Scholar] [CrossRef] [Green Version]


| Rs | Definition |
|---|---|
| Reduce | Freshwater consumption decrease |
| Reuse | The use of wastewater in its crude form (i.e., without prior treatment or processing) for various purposes inside or outside the loop. |
| Recycle | The use of treated wastewater within the same loop or in the same process |
| Reclaim | Treatment of wastewater and its use outside the loop |
| Recovery | Extraction of valuable resources (e.g. energy, material) present in wastewater |
| Restore | Replenish water resources through artificial interventions (e.g. rainwater harvesting, managed aquifer recharge, rejuvenation of water bodies) |
| Notation | Description | Example |
|---|---|---|
 | Change in A, causes change in B in the same direction. If A increases/decreases, B also increases/decreases. |  |
 | Change in A, causes change in B in the opposite direction. If A increases/decreases, conversely B decreases/increases. |  |
 | Reinforcing or positive feedback loop, if it contains an even number of negative causal links |  |
 | Balancing or negative feedback loop, if it contains an odd number of negative causal links |  |
 | Delay the system when the system’s resonse lags |  |
| Findings | Description | |
|---|---|---|
| Barriers to CE | Outdated legislation | Disincentives CE: Nutrient recycling is made difficult in those countries requiring permits The legal status of waste hinders reclaimed water or recovered phosphate fertilizers from entering the food industry |
| Health and safety risks | Hamper social acceptance | |
| Fluctuating fertilizer quality that cannot always be guaranteed with varying concentrations in WW | Hampers market acceptance | |
| Social acceptance | Strong psychological effect in society against direct waste recycling | |
| Expensive technology | Such as online meters (e.g., E. coli, N2O probes) increase overheads for organizations | |
| A high-level of IT readiness and capability for handling big data | Increases overheads for organizations | |
| Prioritization of investments | Between large-scale infrastructure and decentralized systems because this ensures that the massive 50-year investment made in centralized infrastructure does not become redundant as a result of a complete shift to decentralized systems. | |
| CE remains a concept | Making it difficult for companies to adopt practically | |
| The price of water | The price of water is not reflective of the true cost of externalities | Increasing the price of water is not considered a viable solution by two respondents. |
| The cost of closing the loop will need to be socialized | ||
| There is a need to redesign tariff structures, i.e., alternative billing | Charge for water is to factor in the associated costs into the tariff cost structure using a rising block banded system. Ensures that water remains affordable, but at the same time disincentivizes irresponsible usage An “extreme method” is to not only base charges on the quantity consumed on the supply side but also on the quality discharged on the collection side, similar to a polluter pays principle, but for all consumers. This motivates hospitals and industry to improve the quality of water discharged even if it means they need to include an additional process step locally before discharging. Eventually, the desired effect would be that heavy polluters end up paying less as a result of the additional treatment step prior to discharge because it should cost less than the charge for heavily polluted water. The quality of water discharged to wastewater treatment plants (WWTPs) would improve, making CE easier to implement and the costs of treatment less for WWTPs. Fluctuating water prices for all sectors based on seasonal availability. In periods of drought, the tariffs would be higher. Currently, time-based tariffs in the water sector are a “thinking experiment” | |
| Infrastructure | Infrastructure is a financial burden | Very large investments that depreciate over the next 30 to 50 years are supposed to be funded by water sales revenue |
| Centralized infrastructure is a deterrent to circularity | Large-scale utilities find themselves stuck with the technology and infrastructure they have for decades without the opportunity of rapidly adapting the network or directly investing in and implementing new technologies CE requires | |
| Decentralized systems are an alternative to avoid the burdens of centralized infrastructure | In Flanders, Belgium, decentralized systems are looking to be deployed; financially, it makes sense to install them in new builds, cities and districts. A complete shift to decentralization will not occur, but rather decentralized systems will complement centralized treatment to form a hybrid network | |
| Decentralized systems are not expected to be very lucrative for WUs | They do, however, promise a less capital-intensive outlay of investment; make it easier to shift more rapidly to new technologies because the scale of investment is smaller; and create a demand for water solutions companies to build, operate and maintain decentralized systemsA Flanders WU is carrying out a pilot on decentralized systems and expects a return on investment between 8% and 12%, with a payback time of 10 to 12 years | |
| In the Netherlands, a WU is strategically deploying decentralized systems | At specific points, pollution sources, such as hospitals, where a decentralized water solutions company, Pharmafilter®, is the owner and monitor of such systems. WW is being treated before being discharged to the WWTP, and the (medicinal) waste is being recovered for reuse by Pharmafilter® | |
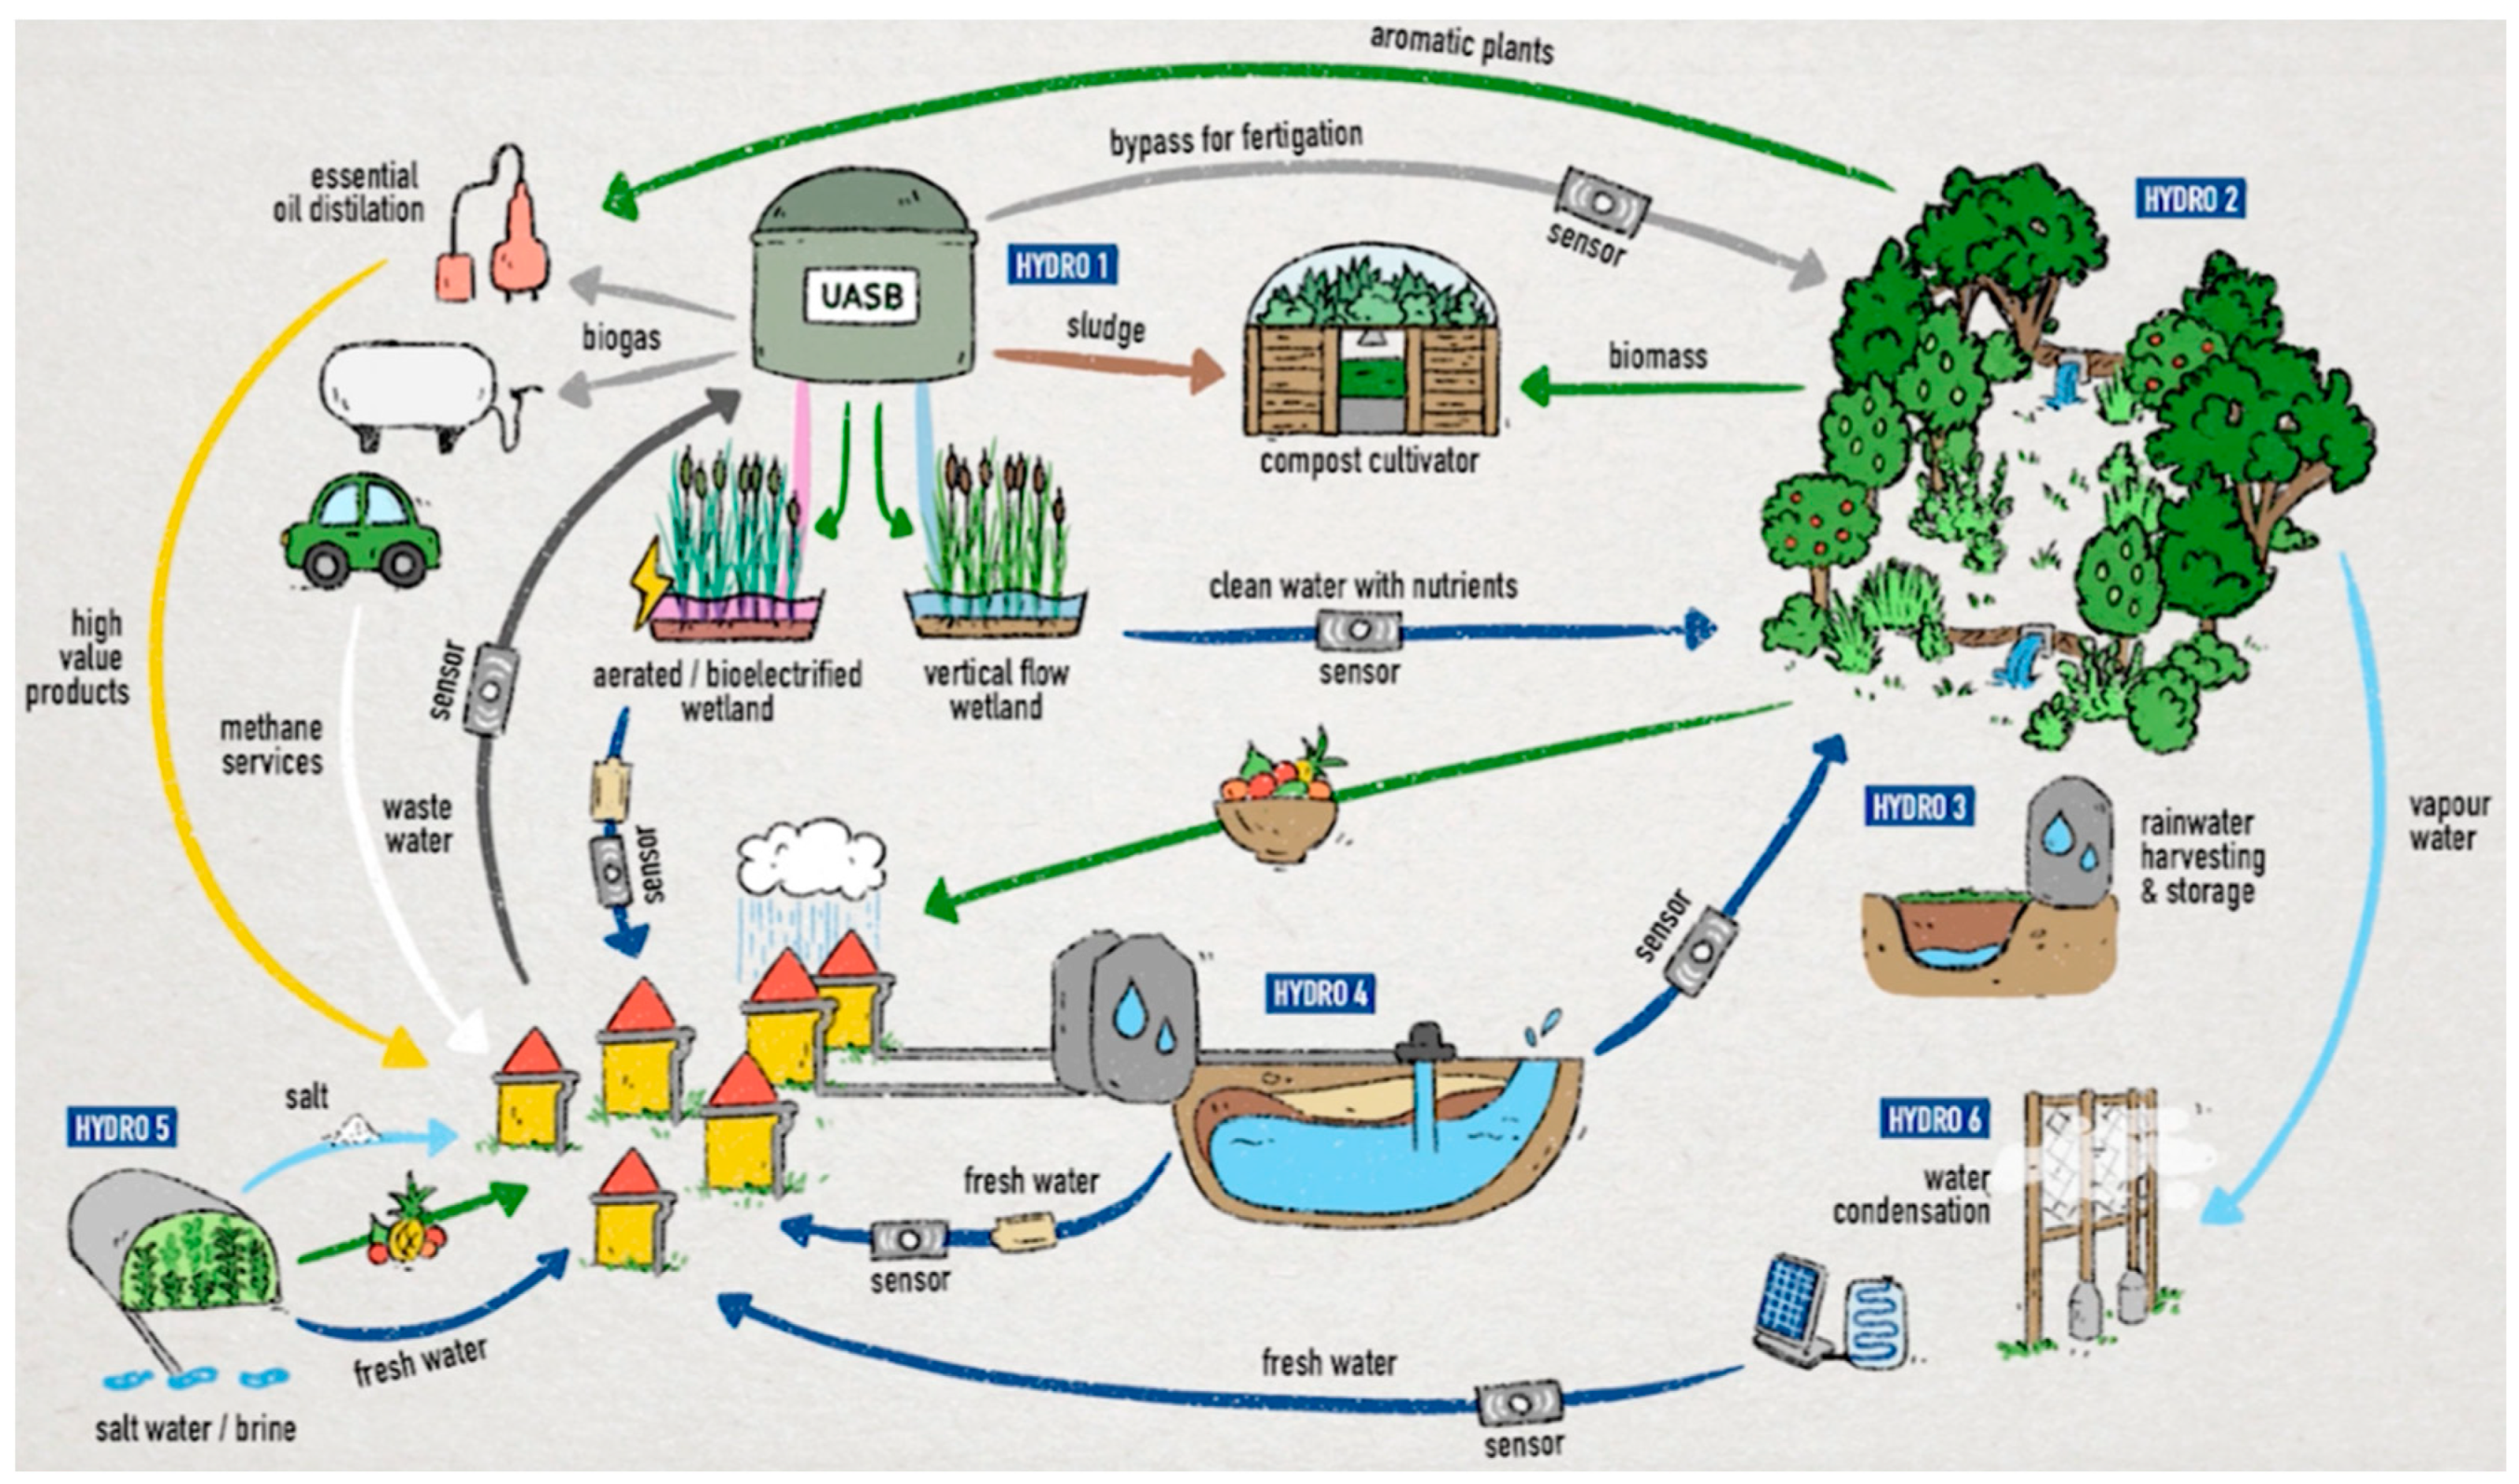
| An EU Horizon 2020 project, HYDROUSA (Figure 12), is focused on local decentralized circular solutions in the Greek Islands | Local supply chains that recover water, energy and materials are being developed for valorizing at the local level for the benefit of the local communityHYDROUSA is focusing on providing low-cost, nature-based solutions, which require less operational costs than conventional activated sludge processes for the treatment of WW | |
| Circular Practices | Water-as-a-service company practices water reuse for irrigation | Reclaimed water, originally from desalination on island nations in the Americas, is predominantly used for irrigation. The sewage is given to farmers for free due to legal complications hindering nutrient recovery prospects Alternatively, the WW is treated for potable use |
| Salt recovery from desalination | For the water-as-a-service company, the business case for salt recovery is suboptimal, with salt being a cheap commodity and the surface area required for evaporation being substantial For the HYDROUSA project, nature-based desalination with the help of mangrove tree roots and the recovery of salt sold to the local community is being demonstrated. It is yet to be seen whether this nature-based form of salt recovery is financially viable | |
| Production of biogas and biomethane from anaerobic digestion of dewatered sludge | In Flanders, the experience has been that unless a sizeable amount of organic matter is available, meager energy yields are sufficient for only heating the reactor for the digestion process. They are thus looking to improve energy yields by integrating the food waste network with the sewage network to increase the organic content for biogas production. Prior to this, the legal obstacle hindering the network merger must be overcome. In the Dutch case, the biomethane cheapens WW treatment by a few cents per cubic meter, where it is injected into the gas grid and is found to be a worthwhile business case. The Dutch WU and HYDROUSA are producing biogas for transportation. | |
| HYDROUSA is attempting to close the water loop and, in turn, the nutrient and energy loops for full circularity | This involves: digesting and drying sludge for compost and fertigation of agro-forestry and herbs for essential oils production using nature-based infrastructure to purify WW effluent destined for irrigation and households rainwater harvesting and storage | |
| Recovery | The Dutch WUs send their sludge to a third-party company with the aim of producing phosphate fertilizer, bioplastics and treating the sludge for final disposal. Further aspirations for circularity include treating and reusing the WW effluent for recreational water bodies designated for swimming instead of discharging into the sea and, in so doing, effectively storing water for drier periods | |
| Digitalization | HYDROUSA is deploying many low-cost sensors | To evaluate the water quality by measuring pH, temperature and conductivity to determine the salt content of water in case any seawater has seeped into the groundwater |
| HYDROUSA is deploying energy meters | To determine the energy efficiency of the systems | |
| The utility in Flanders is in the development phase when it comes to smart meters | Online data would be shared with the families, informing them of the presence of leaks and providing daily consumption data for comparison with other households in order to create awareness about their water consumption | |
| In the Netherlands, smart water meters have been rolled out | Consumers are updated regularly on their usage patterns. Due to privacy issues, the consumption data of other consumers cannot be shared. If end-users are exceeding their usual consumption levels, the utility passes on tips for conserving water | |
| In Flanders, online flow meters are being used | To monitor the network efficiency and to detect leaks using district metered areas (DMAs). DMAs can locate and identify leakages with automated online data analysis using statistics to define where the leakage is and for how long it has been there. |
Publisher’s Note: MDPI stays neutral with regard to jurisdictional claims in published maps and institutional affiliations. |
© 2021 by the authors. Licensee MDPI, Basel, Switzerland. This article is an open access article distributed under the terms and conditions of the Creative Commons Attribution (CC BY) license (http://creativecommons.org/licenses/by/4.0/).
Share and Cite
Mbavarira, T.M.; Grimm, C. A Systemic View on Circular Economy in the Water Industry: Learnings from a Belgian and Dutch Case. Sustainability 2021, 13, 3313. https://doi.org/10.3390/su13063313
Mbavarira TM, Grimm C. A Systemic View on Circular Economy in the Water Industry: Learnings from a Belgian and Dutch Case. Sustainability. 2021; 13(6):3313. https://doi.org/10.3390/su13063313
Chicago/Turabian StyleMbavarira, Tanaka Mandy, and Christine Grimm. 2021. "A Systemic View on Circular Economy in the Water Industry: Learnings from a Belgian and Dutch Case" Sustainability 13, no. 6: 3313. https://doi.org/10.3390/su13063313
APA StyleMbavarira, T. M., & Grimm, C. (2021). A Systemic View on Circular Economy in the Water Industry: Learnings from a Belgian and Dutch Case. Sustainability, 13(6), 3313. https://doi.org/10.3390/su13063313