Article

Study on the Bending and Joint Performances of Reinforced Concrete Beams Using High-Strength Rebars

1
Institute of Construction Technology, Seoul National University of Science and Technology, Seoul 01811, Korea
2
Department of Architecture Engineering, Songwon University, Gwangju 61756, Korea
3
Department of Mechanical and Shipbuilding Convergence Engineering, Pukyong National University, Busan 48547, Korea
*
Authors to whom correspondence should be addressed.
Sustainability 2021, 13(6), 3482; https://doi.org/10.3390/su13063482
Submission received: 16 January 2021 / Revised: 8 March 2021 / Accepted: 9 March 2021 / Published: 21 March 2021

Abstract

:
High-strength reinforcing bars have high yield strengths. It is possible to reduce the number of reinforcing bars placed in a building. Accordingly, as the amount of reinforcement decreases, the spacing of reinforcing bars increases, workability improves, and the construction period shortens. To evaluate the structural performance of high-strength reinforcing bars and the joint performance of high-strength threaded reinforcing bars, flexural performance tests were performed in this study on 12 beam members with the compressive strength of concrete, the yield strength of the tensile reinforcing bars, and the tensile reinforcing bar ratio as variables. The yield strengths of the tensile reinforcement and joint methods were used as variables, and joint performance tests were performed for six beam members. Based on this study, the foundation for using high-strength reinforcing bars with a design standard yield strength equal to 600 MPa was established. Accordingly, mechanical joints of high-strength threaded reinforcing bars (600 and 670 MPa) can be used. All six specimens were destroyed under more than the expected nominal strength. Lap splice caused brittle fractures because it was not reinforced in stirrup. Increases of 21% to 47% in the loads of specimens using a coupler and a lock nut were observed. Shape yield represents destruction—a section must ensure sufficient ductility after yielding. Therefore, a coupler and lock nut are effective.

1. Introduction

Many skyscrapers are currently being planned for construction as countermeasures to resolve overpopulation issues, increase public notice, minimize environmental impact by increasing green areas, maximize land use efficiency, and improve the image of a city in which skyscrapers will be constructed. Recently, the construction of high-rise structures has been increasing. When high-strength reinforcing bars are used in the construction of high-rise structures, it is possible to reduce the amount of reinforcement compared to general strength reinforcement. It is thus possible to provide a margin for the reinforcement spacing between members, thus improving workability and shortening the construction period. Currently, Eurocode II permits design standard yield strengths of up to 600 MPa for the main reinforcing bars, while Japan and the United States are gradually allowing the use of high-strength reinforcing bars [1,2,3]. In the concrete structural design standard of the Korea Concrete Institute (KCI), the current domestic design standard, the upper limit of the design standard yield strength of the main reinforcing bars is limited to 550 MPa. However, this standard is applied when designing according to the provisions of 1.2.5 [3]—“special survey research”. If the performance associated with the use of reinforcing bars with yield strengths of 600 MPa or higher is proved experimentally, it is judged that reinforcing bars with yield strengths of 600 MPa can be used. Standard revision work is in progress. In Korea, Choi [4] and others [5,6] evaluated the applicability of the current design standards to the fixing and jointing of SD600 rebars. High-strength reinforcing bars exhibit different adhesion characteristics from general reinforcing bars because the nonlinearity of the stress–strain relationship becomes more prominent and the yield floor becomes shorter as the yield strength of the design standard increases. To evaluate the applicability of the current design standard to Class B joints of SD600 reinforcement, an overlapping joint experiment was performed [7,8,9].
Goksu et al. [10] experimentally investigated the effect of lap splice length on the cyclic lateral load behavior of low-strength reinforced concrete (RC) columns with plain longitudinal bars (14 mm diameters). The specimens were designed to represent columns with low axial loads. The geometric ratio of the longitudinal reinforcement and the volumetric ratio of the lateral reinforcement of the columns are 1% and 0.8%, respectively. The test program included five RC columns with lap splice lengths 25, 35, 44, and 55 times the longitudinal bar diameter, as well as a reference specimen with continuous longitudinal bars. The test results clearly demonstrated that the presence of 180° hooks at the ends of the lap splice reduces the negative influence of the inadequate lap splice length on RC member performance, even in the case of low-strength concrete. Ghatte [11] conducted experimental and numerical investigations on the load–deflection performance of six T-shaped SCC (self-compacting concrete) beam–column connections on the top floor of a building. Goksu et al. [12] proposed a bond–slip model to consider the effects of corrosion on the bond characteristics between extremely low-strength concrete and plain reinforcing bars. The test results demonstrated that the corrosion of reinforcing bars had a significant effect on the strength and deformability characteristics of substandard reinforced concrete columns subjected to the combined actions of axial and reversed cyclic lateral loads. Ghatte [13] used one of the feasible retrofitting techniques for existing reinforced concrete (RC) structures—fiber-reinforced polymers (FRPs). The findings demonstrate that carbon fiber-reinforced polymer (CFRP) jackets and external steel ties are considerably useful in comparison to the used retrofitting strategy, specifically concerning ductility and energy dissipation capacity. Sun et al. [14] established a three-dimensional nonlinear finite element (FE) model using explicit algorithms to simulate the behavior of beams reinforced with glass fiber reinforced polymer (GFRP) bars cast using lightweight aggregate concrete (LWAC) with or without steel fibers and used a gradual damage model to simulate the rupture of GFRPs. The developed FE model was evaluated and the test results showed good consistency in terms of moment-biased response serviceability performance, final capacity, and failure mode. Karayannis et al. [15] experimentally investigated the behavior of seven slender concrete beams reinforced with CFRP bars during static load increases. They presented and described load capacity, deflection, stiffness before and after cracking, sudden local strength degradation, failure modes, and crack propagation. Special attention was paid to the coupling conditions of the fixture length of the tensile CFRP bar. Nardone et al. [16] discussed an analytical model for reinforced concrete (RC) members reinforced with mechanically fastened (MF) FRP strips. This model describes the balance, compatibility, and configuration relationships of components. Specifically, the slip between the substrate surface and the FRP strip due to the movement of the fixture is explicitly described.
The confinement model coupled with the proposed computation algorithm proposed by Lignola et al. [17] is able to predict the fundamentals of the behavior of hollow rectangular members in FRPs in terms of tracing the strength and ductility of the occurrence of the brittle mechanisms—namely, concrete cover spalling and reinforcement buckling (a common failure mode of hollow members)—and the evolution of stress and strains in the concrete and in the confinement jacket, allowing evaluation of the multiaxial state of stress at each load step and eventually the failure of concrete or of external FRP reinforcement. The main output of the proposed model is also the assessment of the member deformability in terms of both curvature and displacement ductility. The results of theoretical analyses and experimental tests show that a good agreement was achieved.
Regarding the parameters of the cubic specimen, the design standard yield strength of the overlap joint reinforcement was 600 MPa, and 12 overlapped joint specimens were produced by combining the compressive strength of concrete at 24 MPa, 28 MPa, and 60 MPa. D13, D22, and D32 were used as reinforcing bars, and lengths of 0.6 to 1.02 for Class B joints were used as overlapping joint lengths. The current design standard for overlapping joints of SD600 D13 reinforcement is on the safe side [18,19,20,21]. Therefore, in the case where SD600 reinforcing bars of D22 or higher are used, the actual reinforcement stress is not safe if the horizontal reinforcement is placed within the overlapping joint section, while ensuring that the distance from the reinforcement to the cover thickness is >50 mm. However, if the joint length is applied in accordance with the current design standard, the joint length increases. When the ductility was evaluated by the deflection ductility coefficient that can be obtained from the load–deflection relationship, the ductility coefficient was used as the ratio of the deflection at yield and the deflection at break as a means of evaluating the ductility of a member. However, the value may differ depending on which condition is regarded as the surrender of the member and which condition is regarded as the failure condition [21].
This can hinder economic improvement owing to the reduction in the number of rebars used and the amount of rebar that constitutes the purpose of the use of high-strength rebar. Currently, various joint methods are used in Korea, such as overlapping, welding, and mechanical joints. In general structure construction, overlapping joints do not require rebar processing or skilled workers. Thus, joints are simple, and there is no initial slip caused by mechanical joints. Thus, overlapping joints are mostly used. However, as the diameter of the reinforcing bar increases, the length of the joint increases; thus, mechanical joints, such as welded joints, are frequently used [22]. The performance of welding joints is determined according to the dexterity of skilled workers, and it is not used extensively because of the disadvantages of welding equipment. Mechanical joints are used only for vertical members because the strength of the material decreases, or initial slip occurs owing to the processing of the reinforcing bar [23,24]. In the case of threaded joints, there is a disadvantage in that stress is lost during the processing of the cross-section of the rebar. To evaluate the joint performance of high-strength threaded reinforcing bars in which the shape of the reinforcing bar that can compensate for the disadvantages of these mechanical joints is screwed, tensile and flexural member joint performance tests are conducted to ascertain whether it meets the current KCI standards.

2. Materials and Methods

2.1. Experimental Design

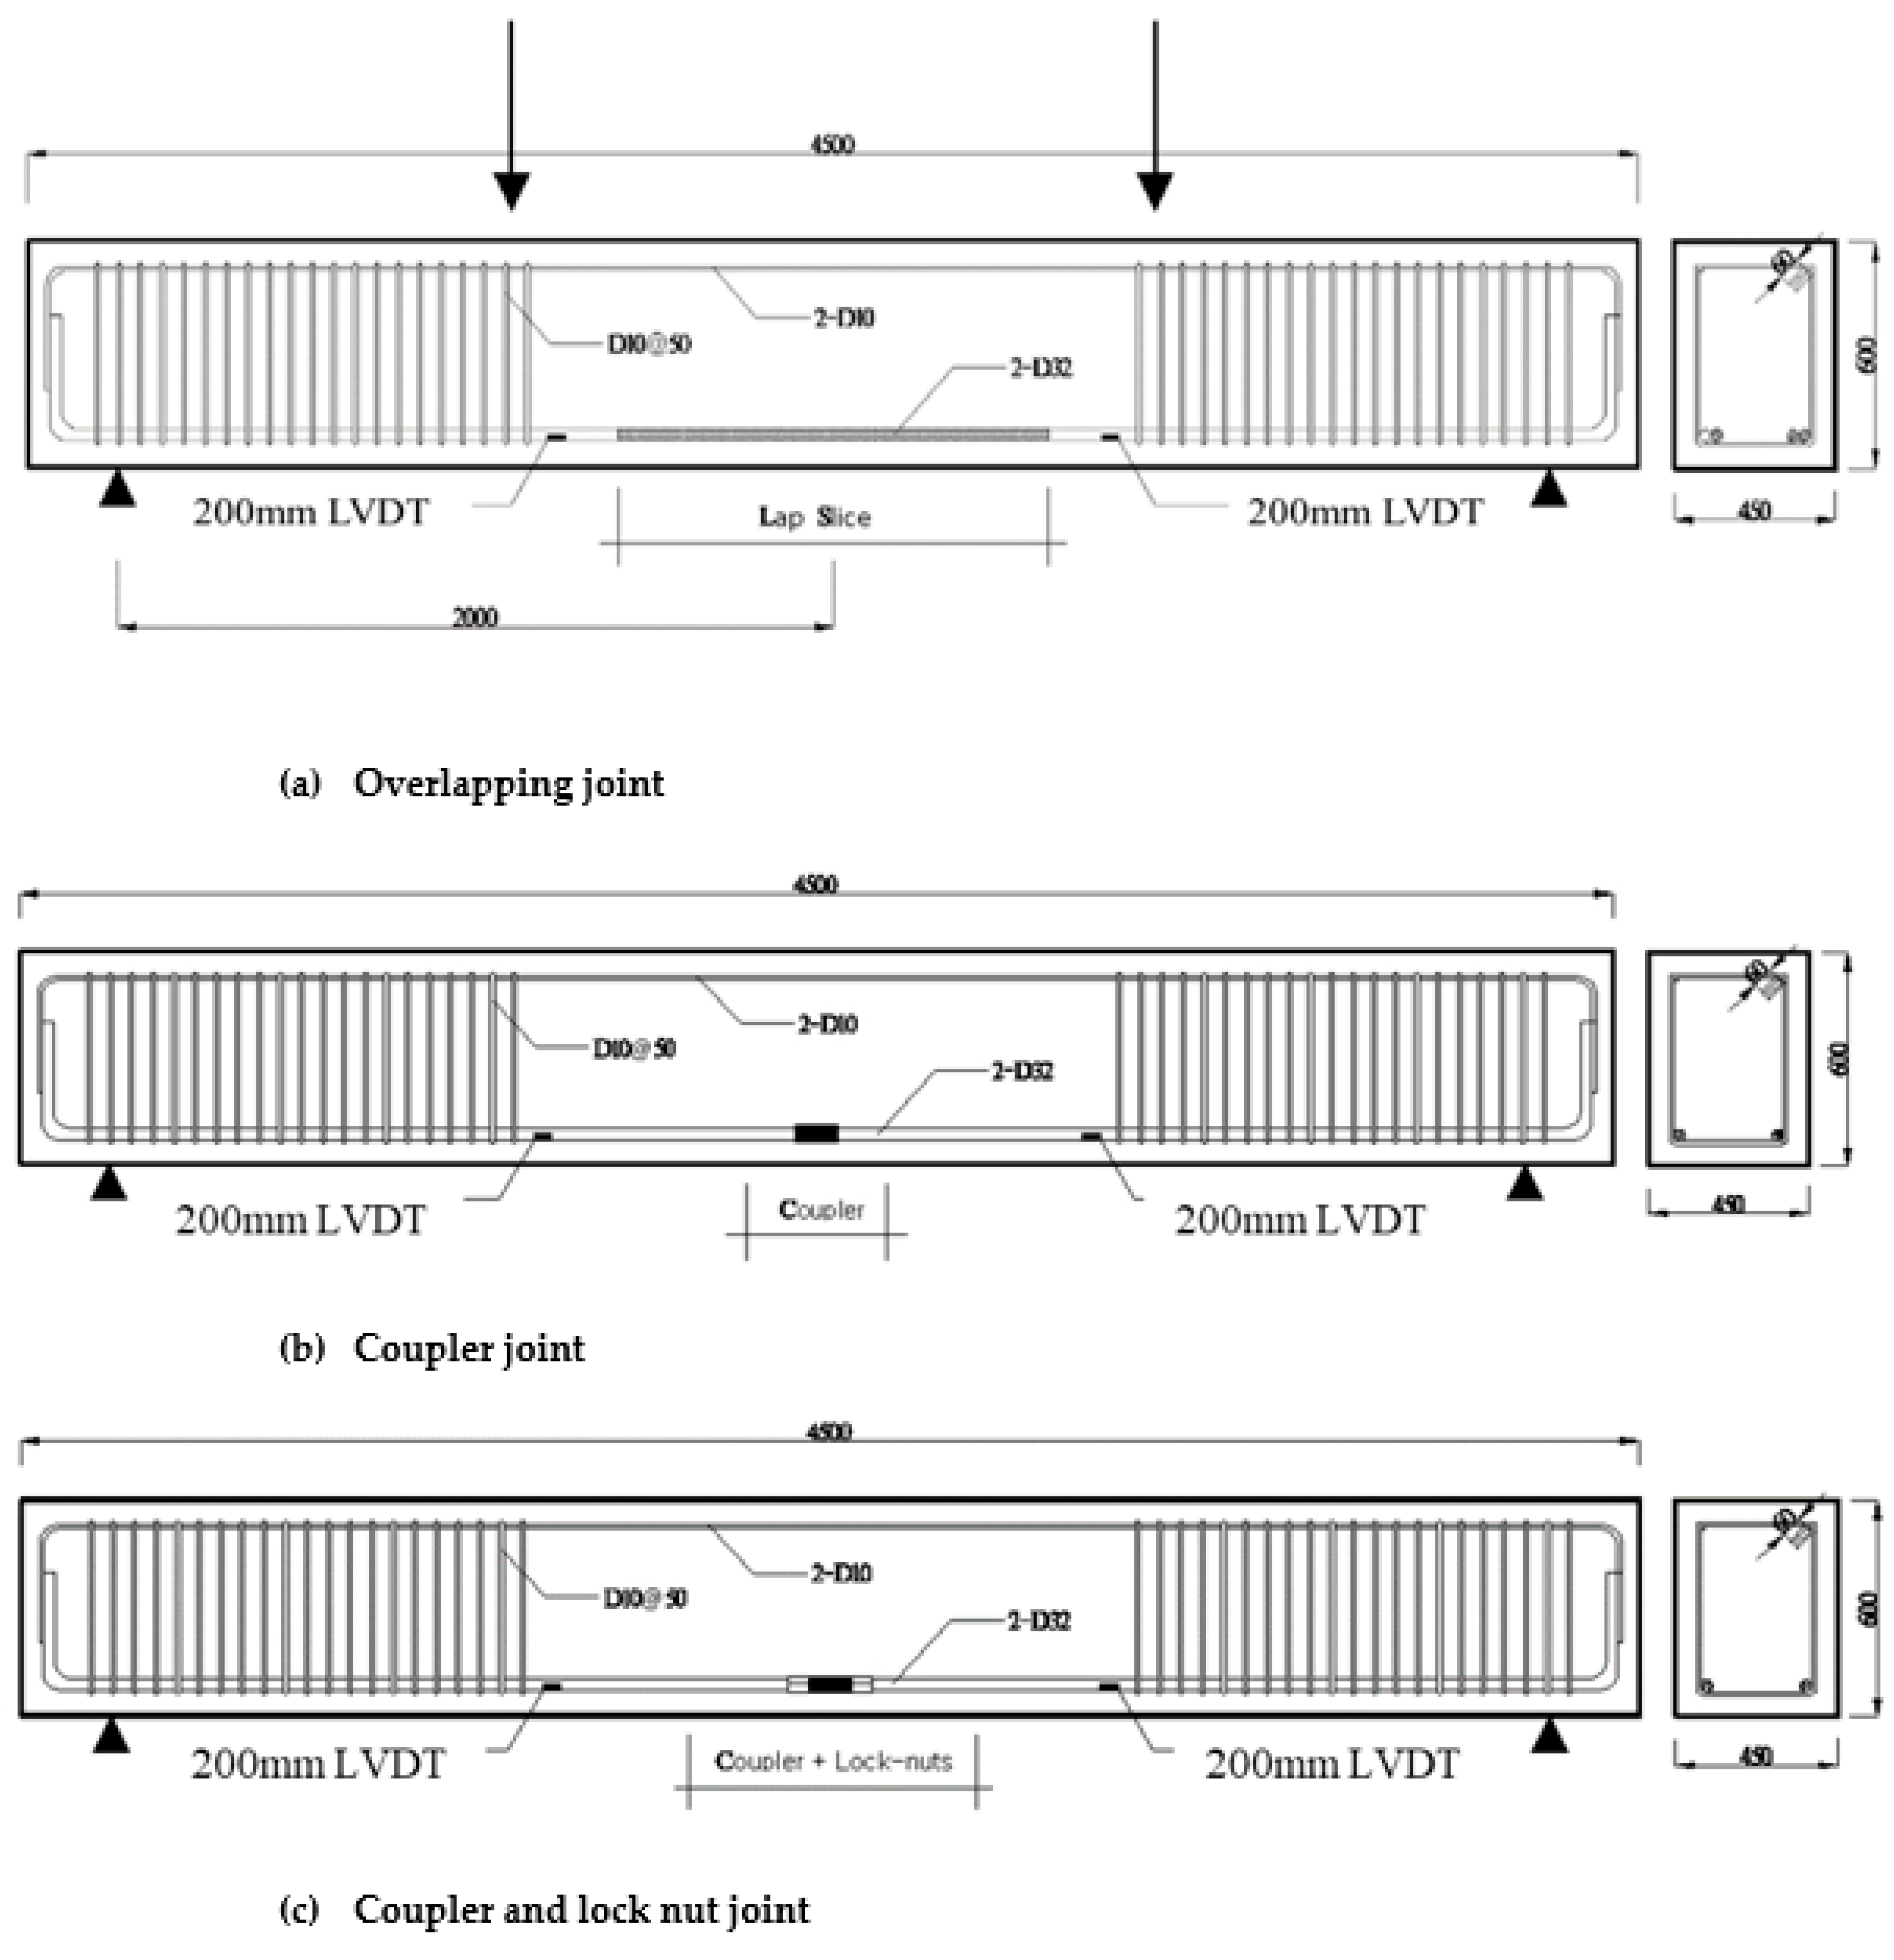
2.1.1. Joint Performance Test

To evaluate the joint performance of reinforced concrete bending members using threaded reinforcement, an experiment was performed on a simple beam with a length of 4500 mm. The main variables of the experiment were overlapping and coupler joints, coupler and locking nut joints, the design standard yield strength, and rebar diameter. We attempted to determine whether it can be applied to the standard with the use of the test specimens of 600 MPa and 670 MPa overlapping joints designed according to the current KCI Structural Design Standard Joint Regulations. Based on the use of the joint test specimens with coupler joints, couplers, and lock nuts with the same strength, we tried to understand the mechanical joint performance. In total, six specimens were produced, which were designed in consideration of the size of the beams and the laboratory conditions designed for actual high-rise structures, and their shapes are shown in Figure 1.
The design of the overlapped joint test specimen, which is considered as the reference test, was designed according to the joint regulations of 8.6.2 tensile deformed reinforcing bars and deformed wires in the KCI Concrete Structural Design Standard [19]. The joint length is calculated with Equation (1).
l d = 0.9 d b f y f c k α β γ λ ( c + K t r d b )
  • d b : Thickness of the reinforcing bar (mm)
  • f y : Lap splice rebar (MPa)
  • f c k : Concrete grade (MPa)
  • K t r : Lateral rebar index
where d b is the thickness of the reinforcing bar. Based on the results of the analysis in the entire section of the joint, it is not the case that the number of reinforced joints used is more than twice the amount of the required reinforcement, and the number of reinforced bars in the required overlapping joint length is not less than the total number of reinforcing bars. Thus, the joint length was calculated to be 1.3 l d . α β γ λ and a value of 1.0 was obtained during the design process of the specimen. α is the coefficient of the location of rebar placement, with 1.3 for horizontal reinforcement with concrete not hardened more than 300 mm below the upper reinforcement settlement length or overlap joints, and 1.0 for other reinforcement. β is the epoxy coating coefficient and is 1.5 for epoxy coating reinforcement or steel wires with a sheath thickness of less than 3 d b or a momentary distance of less than 6 d b , 1.2 for other epoxy coating reinforcement or steel wires, and 1.0. For λ, 1.0 was used for normal concrete, so that f c k / 1.76 f s p is greater than 1.0 for light concrete given 1.3 f s p of light concrete not given as a coefficient of light concrete. γ is the coefficient of size of rebars or steel wires. A value of 0.8 was used for steel bars below D19 and 1.0 for steel bars above D22. The dimension c related to the reinforcing bar spacing or cover thickness was determined by the values of c b ,   c s o   and   c s l . However, the value obtained during the design process of the specimen was equal to one, and the dimension c related to the rebar spacing or cover thickness was determined by the distances from the center of the reinforcement to the concrete surface ( c b + d b 2 ), and from ( c s o + d b 2 ) to the overlapping joints. It was determined to be the smallest value among ( c s l + d b 2 ), which is 1/2 of the distance between the centers of the reinforcing bars. In this experiment, ( c b + d b 2 ) was planned to be the value of c, and transverse reinforcement bars in the joint section were not placed to assess only the joint performance. Accordingly, the transverse reinforcing bar index became equal to zero, and c + K t r d b was 2.69 (it was designed to be equal to ≥2.5). Because of the design specification, the joint length of the specimen was calculated. The details of the specimen are listed in Table 1.

2.1.2. Direct Tensile Test

The direct tensile test consists of a 600 MPa D32 rebar and a coupler joint, one joint which uses a coupler and a lock nut, and a design standard yield strength of 670 MPa D30 reinforcement and coupler joint. A total of six specimens were manufactured with a length of 1000 mm, and direct tensile tests were performed.

2.2. Materials Used

To analyze the material mechanical properties of the concrete and reinforcement used in the production of the joint performance test specimen, a strength test was conducted on concrete columnar specimens of the same mix and on the reinforcing bars of the same diameter as those of the reinforcing bars placed in the specimen.

2.2.1. Direct Tension Test

The concrete used in the experiment was aimed at a design standard compressive strength of 70 MPa or higher, it was mixed and poured by Heungkuk Industrial Co., Ltd., and the air was hardened after steam curing for 48 h. The concrete mix ratio values are listed in Table 2.
According to KS F 2405, 18 cylindrical specimens with a diameter of 100 mm and a height of 200 m were produced at the same time, as the specimen was cast. The test results of the concrete compressive strength of the specimen are shown in Table 3, and the average value is the average compressive strength of the three specimens.

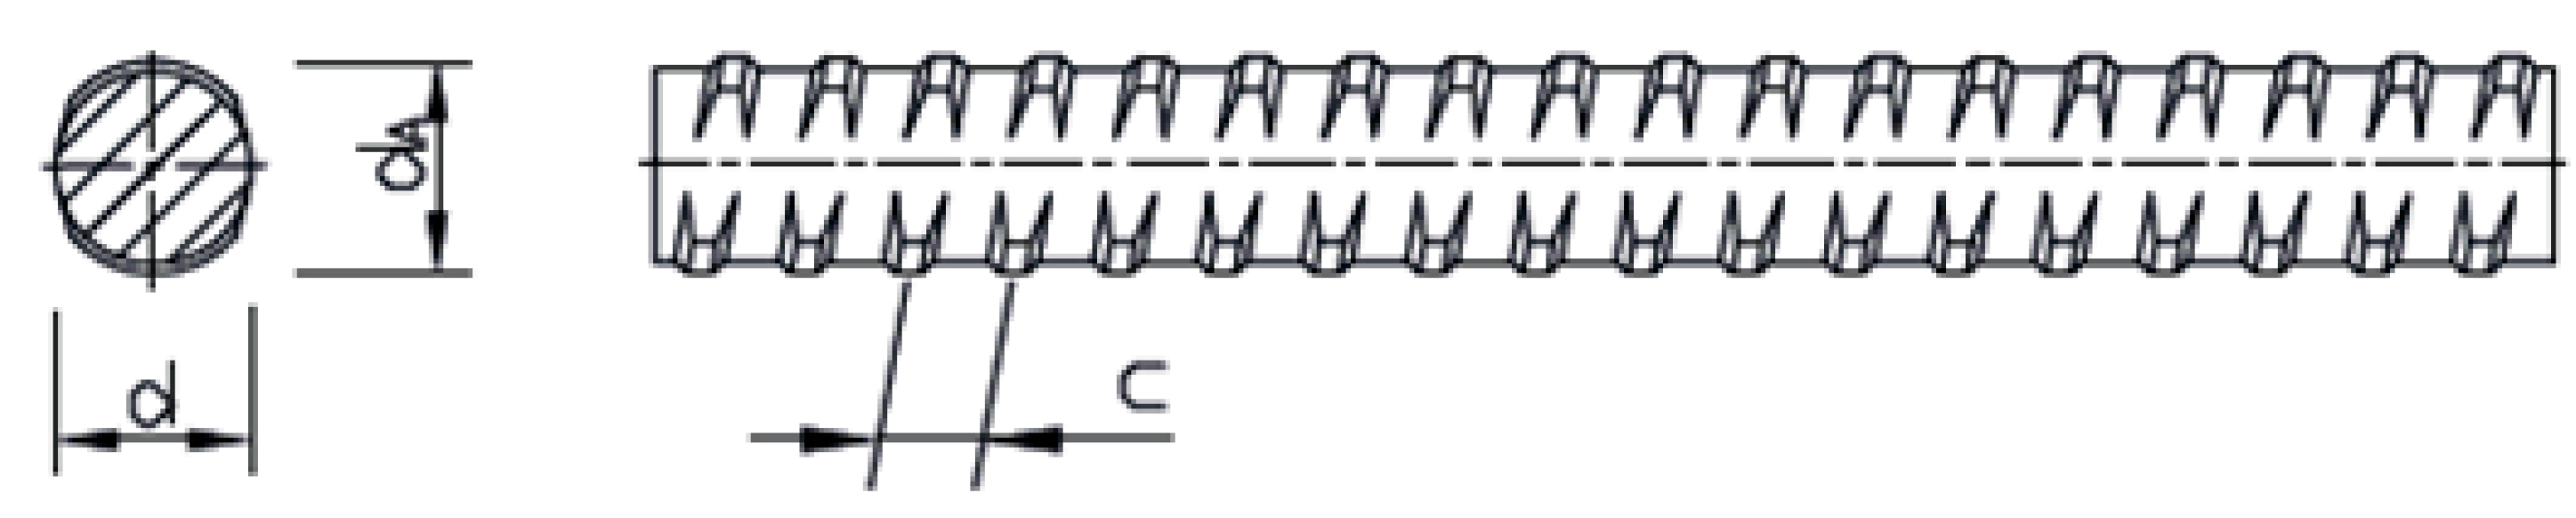
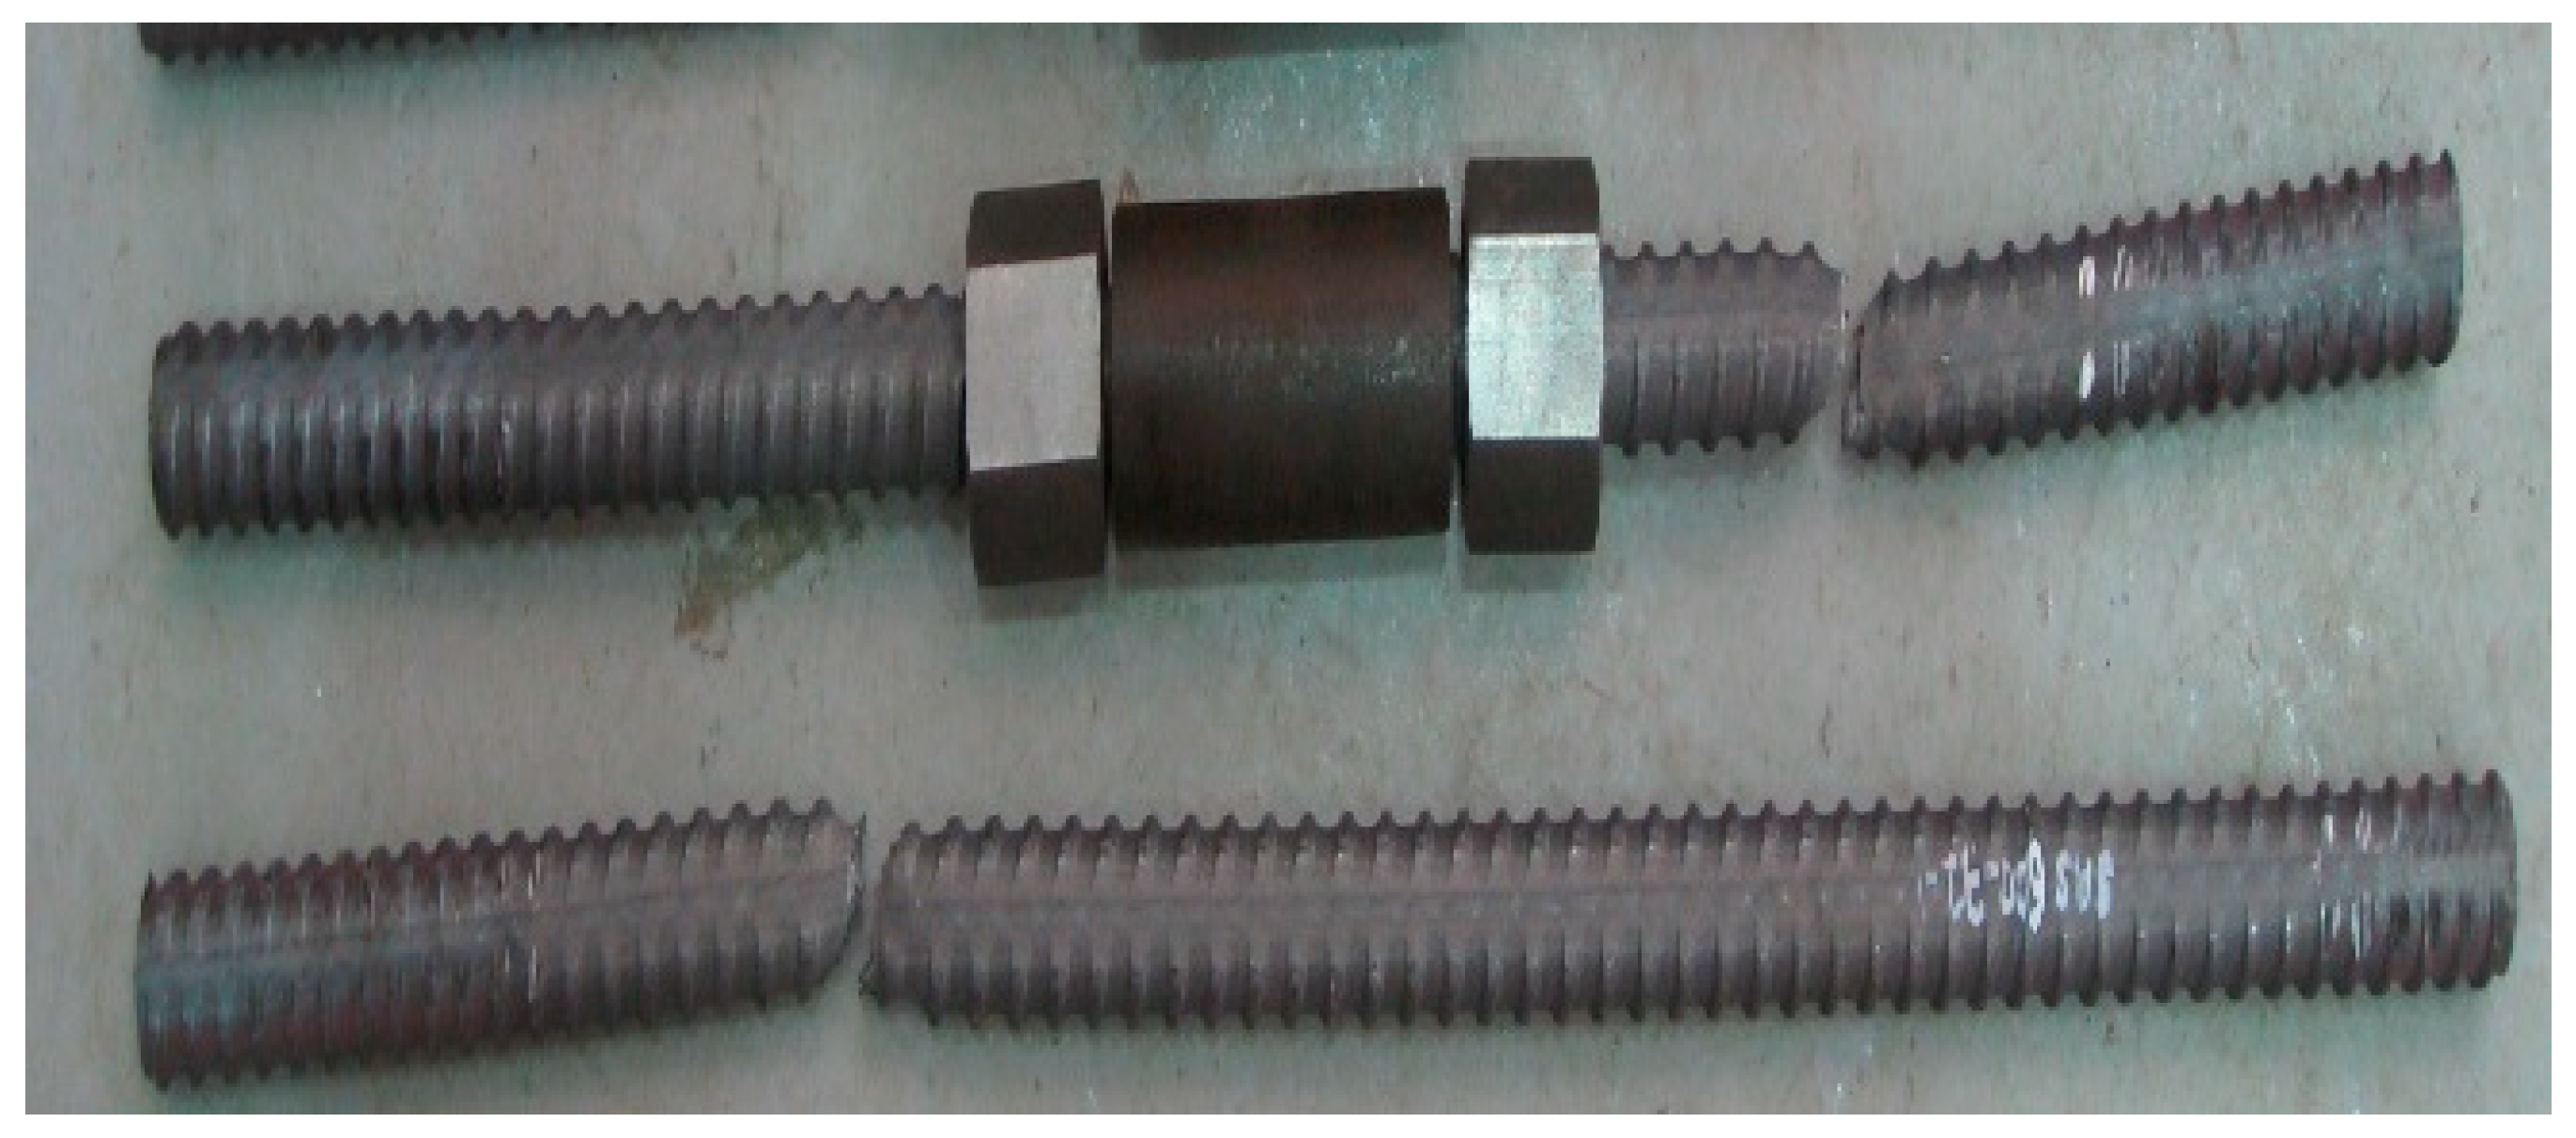
2.2.2. High-Strength Threaded Reinforcement

The rebar was made in Germany and is shown in Figure 2. As shown, it is made of reinforcing bars with threaded joints. Thus, mechanical joints are possible regardless of the cutting position. The types of coupler joints and lock nuts are shown in Figure 3. The specifications of the threaded reinforcement are summarized in Table 4. In the case of the 600 MPa rebar, the thread was made with a right-hand thread, and the 670 MPa rebar was made with a left-hand thread. There is no problem with respect to the transmission of the compressive force between the two cut reinforcing bars when they are connected with a coupler, but when tension is applied, there is a risk of rebar slipping or thread collapse due to the thread gap between the rebar and coupler. It is a fastening method that is used at the same time to prevent slipping of reinforcing bars and requires a torque of 244 N·m when assembling.
In the case of a coupler joint fastened with a lock nut with a machine with a torque moment of 3.0 kN·m for D35 (as rated by the manufacturer), the slip generated for repeated tensile tests of 0.75 f v or less had a very small value of 0.2 mm or less. The slip phenomenon that occurred when only a coupler was used can be prevented by applying an initial tensile force by tightly fastening the lock nut.

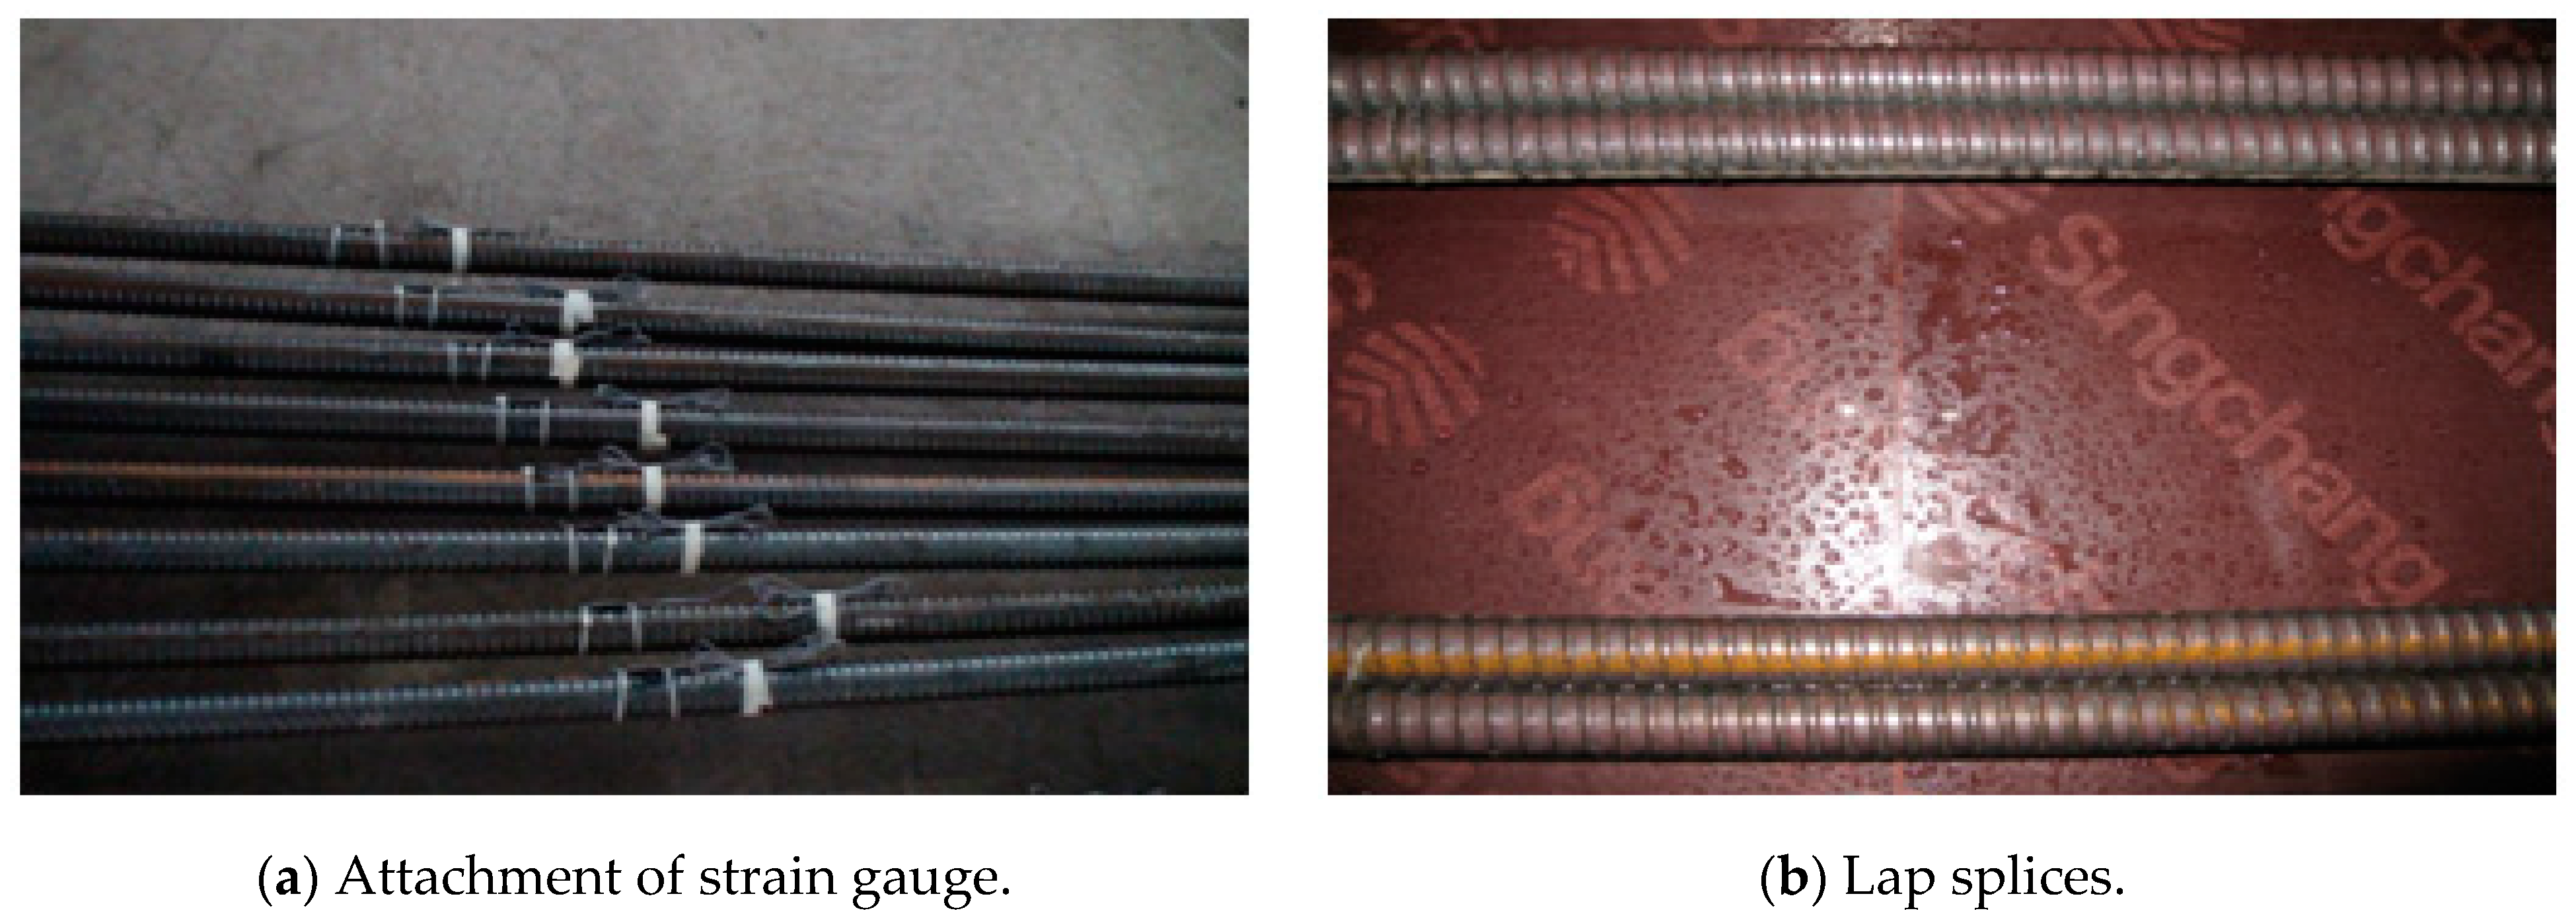
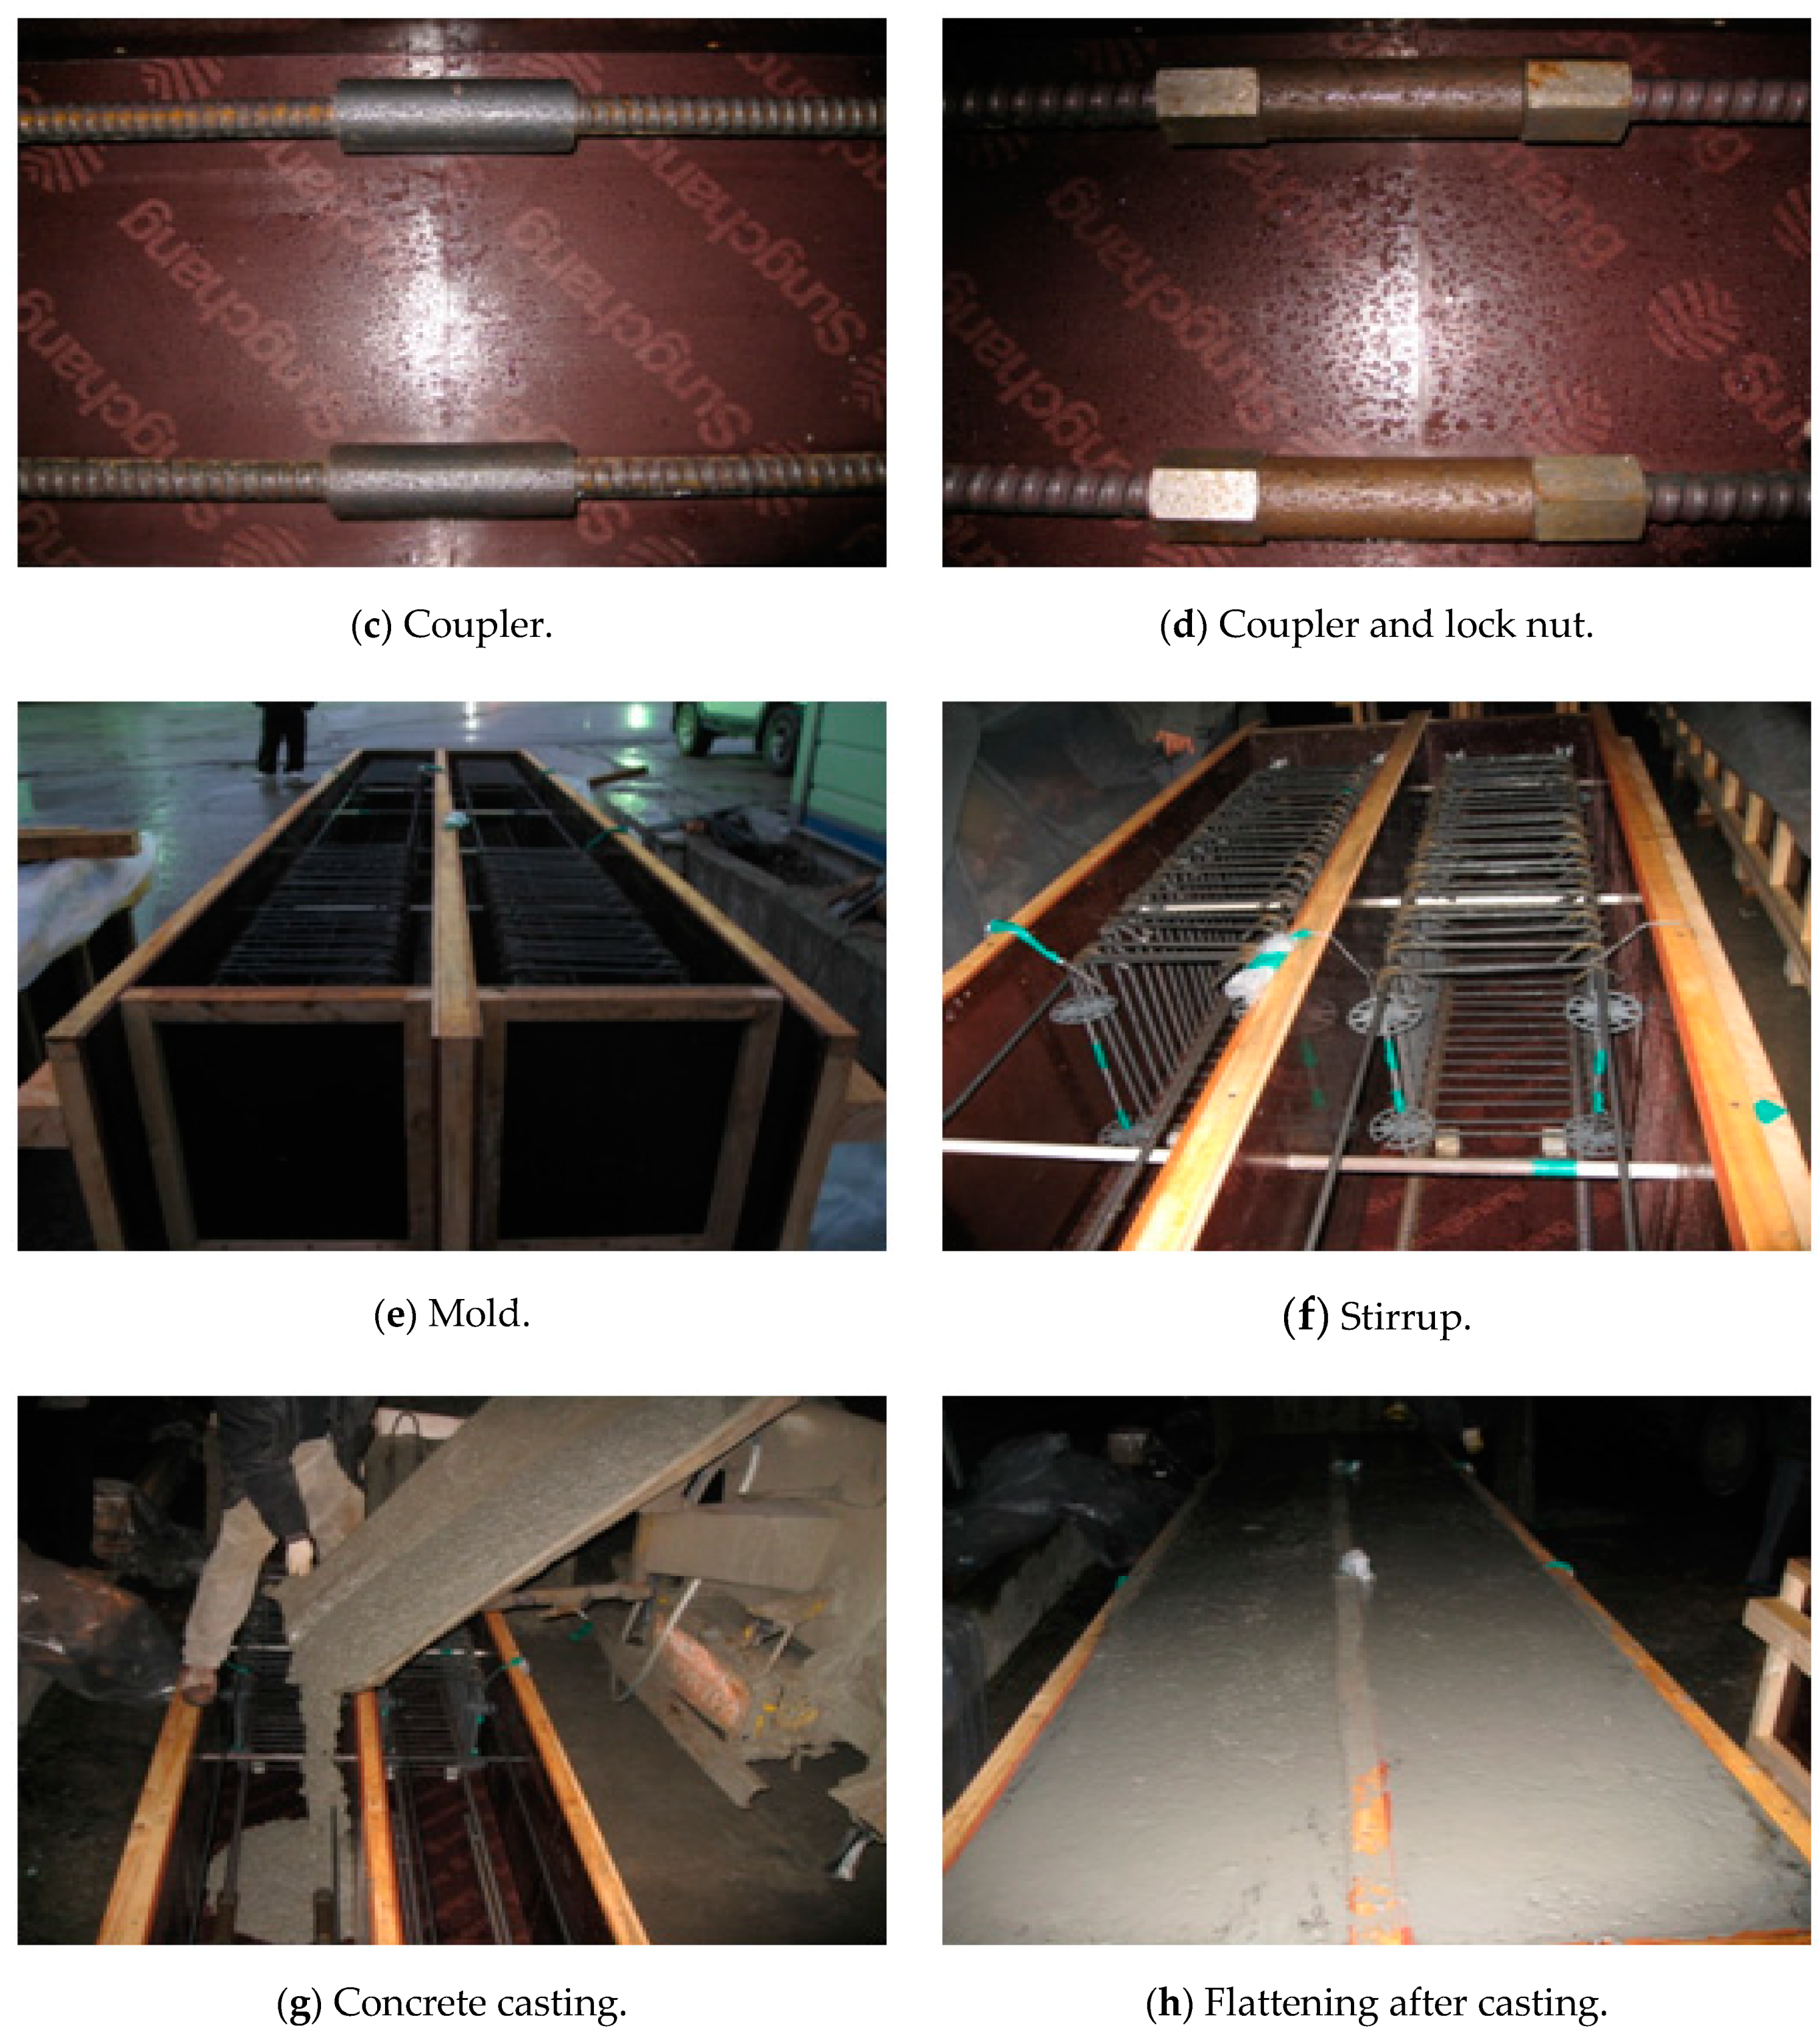
2.3. Experimental Specimen Production

As for the specimens, a total of 6 specimens were fabricated, one by one with lap splices, coupler, coupler + lock nut joints, and rebars of TD 600 and 670 as variables. The specimen was connected to the central part, and Figure 4 shows the details of the lap splice specimen, coupler joint specimen, and coupler and lock nut joint specimen. When assembling the coupler test body and the test body using the coupler and lock nut, the length of the reinforcing bar end was tightened by using tools such as spanners and pipe wrenches from both sides of 75 mm, and the tightening force was expected to be 320 N·m. This is equivalent to 80% of the clamping force suggested by the rebar manufacturer. Four strain gauges were installed at the position of the loading point, and the deformation of the rebar was measured. Four strain gauges were attached to each specimen at the loading points. In order to determine the joint performance, the lateral reinforcement was not applied, as shown in Figure 4, and the experimental body was mixed, casted, and atmospheric after 48 h of steam curing.

2.4. Experimental Method

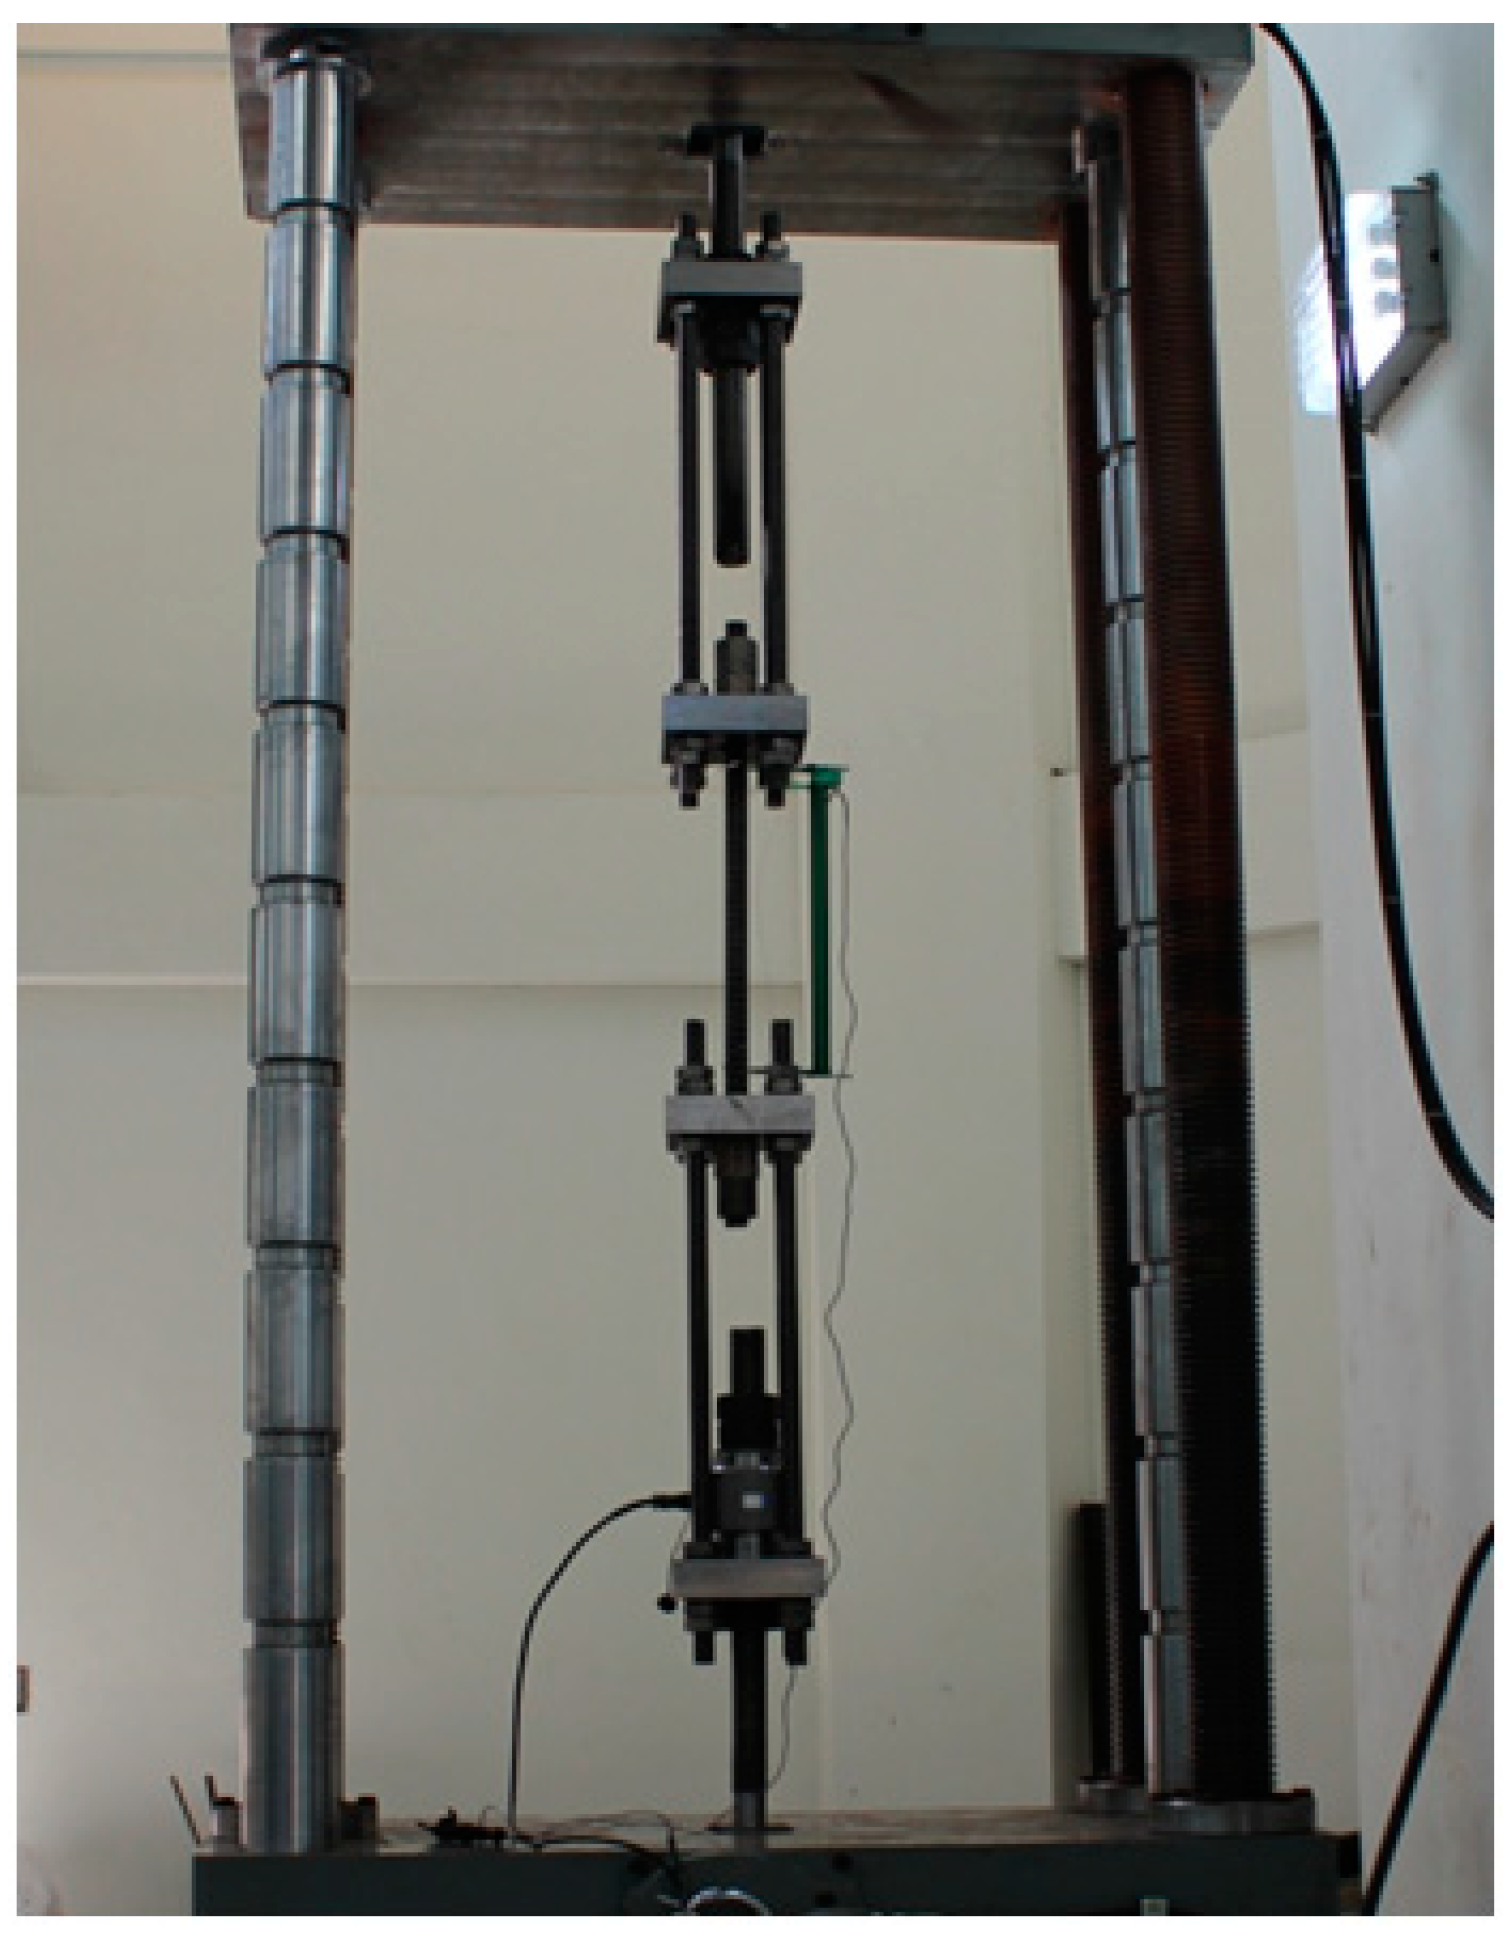
2.4.1. Direct Tensile Test

The direct tensile test outcomes of the rebar are shown in Figure 5. As shown, the force was applied using a universal testing machine (UTM), and the upper and lower parts of the specimen were designed with two hinges to prevent eccentricity from occurring during the experiment. To measure the deformation and load, a 500 mm capacity extensometer was installed at the center of the specimen, and a 1500 kN load cell was installed at the lower part of the hinge. Load–displacement data were collected with a dynamic strain gauge.
In the experiment, the performance of the reinforcing bar was investigated as a nonjointed reinforcement. Additionally, the joint performance was investigated by testing the coupler joint and the specimen was connected with the coupler and lock nut. In the case of the jointed specimen, a torque wrench was used, as shown in Figure 6. A torque moment of 244 kN·m suggested by the manufacturer was applied to the coupler joint specimen, and the joint specimen with a coupler and lock nut yielded a torque moment of 400 kN·m.

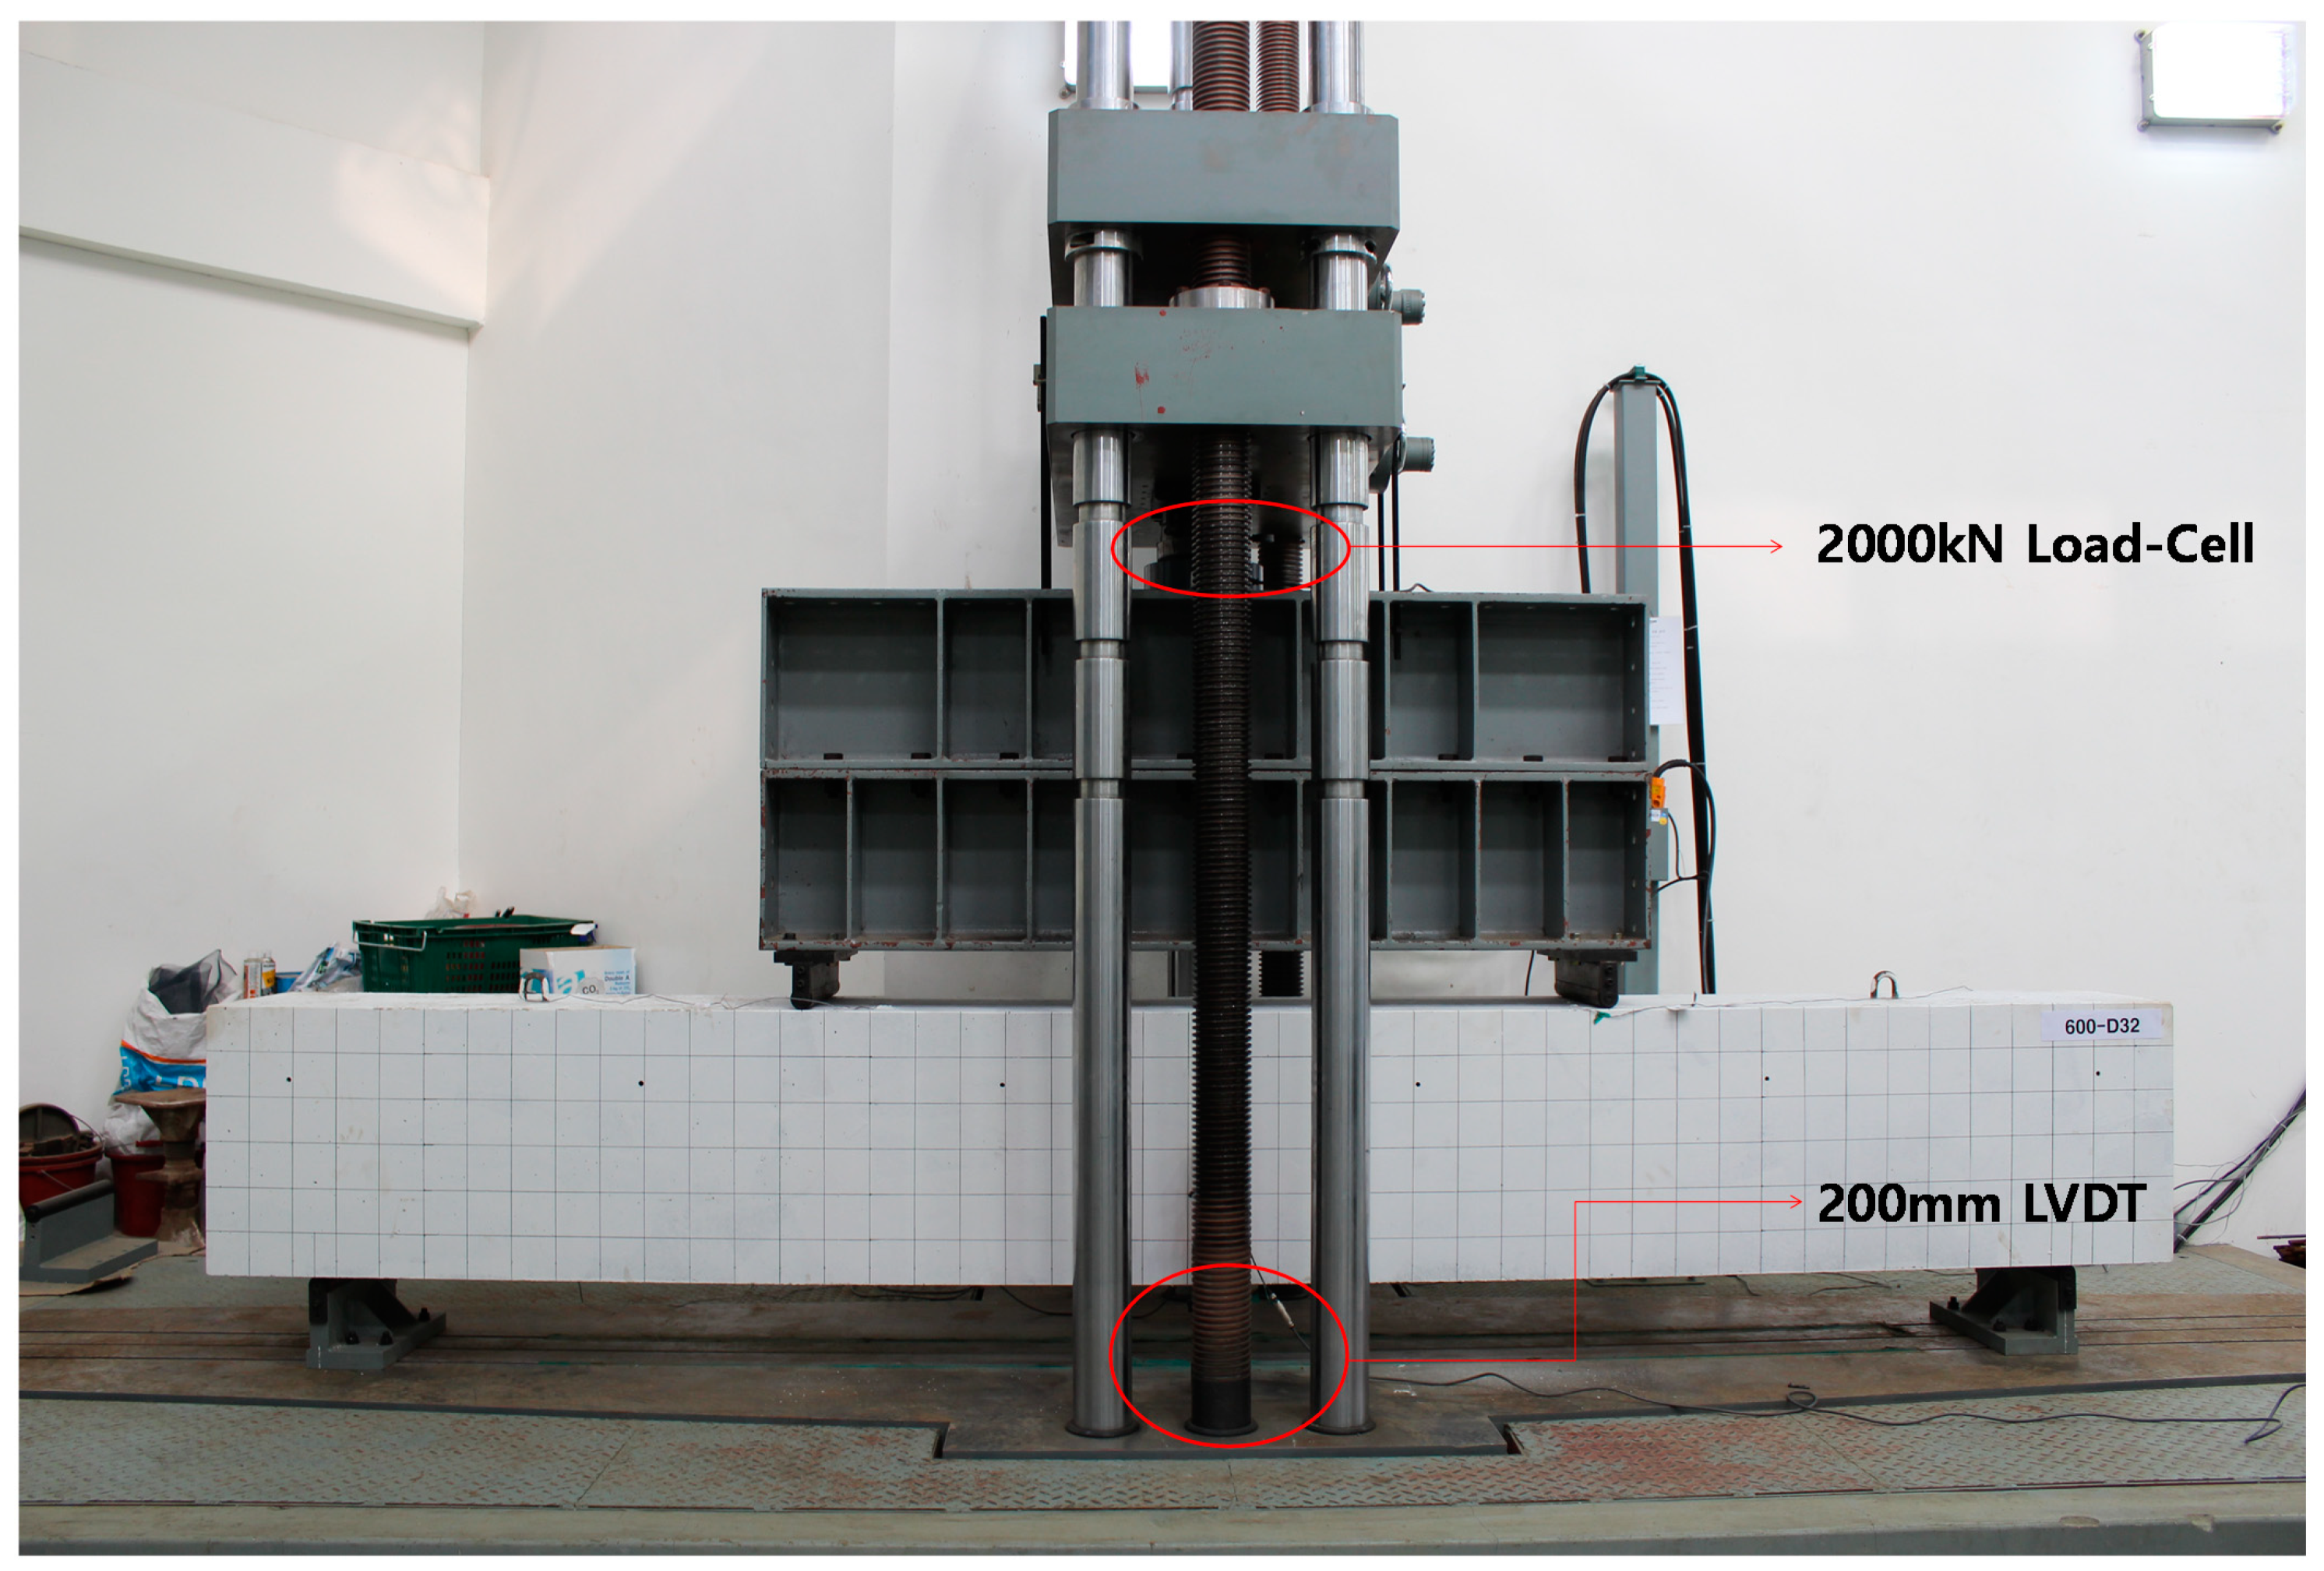
2.4.2. Joint Performance Test

Overlapping joints, coupler joints, joint specimens with a coupler, and a locking nut were loaded on a UTM to receive an equally distributed moment in the joint section. Furthermore, hinge supports were installed at a distance of 250 mm from both ends. To support the specimen, a 2000 kN load cell was installed in the center to collect the loading data, and a 200 mm linear displacement measuring instrument (LVDT) was installed. The load and deflection were measured with a dynamic strain meter. The installation of the specimen is shown in Figure 7.
The load was subjected to displacement control, and the load was applied at a speed of 3 mm/min until the maximum load was reached.

3. Experimental Results and Analyses

3.1. Direct Tensile Test

The results of the experiment are shown in Table 5. High-strength reinforcing bars have the characteristic that the higher the design standard yield strength, the stronger the nonlinearity of the stress–strain relationship, and the shorter the yield floor is. Figure 8 shows that the yield floor is shorter in the case of 600D32, unlike the existing general strength reinforcement. Conversely, in the case of 670D30, the yield floor could not be confirmed, and the yield strength for 670D30 provided the value of the strain and the position at which the change in the strain increased abruptly. Figure 8 shows that the inclination before yielding is slightly different from the results of the specimens of the coupler and coupler + lock-nut, compared with the tension of the pure reinforcing bar. It can be observed that the displacement occurs owing to the occurrence of the acupressure, as shown in Table 5. Table 5 lists results classified as the initial acupressure state, used acupressure state, and yield acupressure state. It can be observed that the deformation owing to the pressure increases.
It can be observed that the yield strength of the reinforcing bars is approximately 8–10% higher compared with the design standard yield strength. This value satisfies the requirement that the yield strength must be greater than the value corresponding to the design standard yield strength when testing reinforcing bars of 600 MPa or more according to KS D 3504 regulations, and it can be confirmed that the tensile strength also exceeds 710 MPa and satisfies the regulations. In the case of 670 MPa, it can be confirmed that the specification is satisfied because it has a value that exceeds the calculated value of 773 MPa when linear interpolation of the tensile strength specifications of 600 MPa and 700 MPa is used. Figure 9 shows the fracture of the 600 MPa D32 specimens after the tensile test was completed, while the 670 MPa D30 specimens also show similar appearances. In the case of specimens which use a coupler and a lock nut, the lock nut at the position receiving pure tension only adds a small tightening force of the torque pressure difference of 400 N·m of the lock nut compared with 244 N·m of the initial coupler. It was confirmed that it could not play a role. If the machine is not used to give a large torque moment, the lock nut will not play a large role.

3.2. Joint Performance Test

In the experiment, two points of simple support were used, and the deflection of the central part was measured. In the case of the overlapped joint specimen, the concrete cover was peeled off and destroyed when the maximum load was reached. Furthermore, the coupler joint and coupler and locking nut joint specimens cracked in the direction of the end point after vertical bending cracks occurred in the maximum bending moment section of the middle part of the specimen. It proceeded by a typical flexural failure by increasing the number and increasing the height and width of the vertical cracks. To prevent shear failure at both ends, the shear reinforcement was laid with D10 reinforcement at 50 mm intervals so the crack occurred at the center. After reaching the yield load, the load slowly increased, and the displacement increased rapidly. Figure 10 shows the progress of the experiment for each load step.
The overlapped joint specimen is shown in Figure 11a. As indicated, both 600D32 and 670D30 exhibited splitting failure characteristics. This experiment was conducted to check whether it is applicable to the current design standards, and it was designed to confirm pure joint performance. Because there was no transverse reinforcing bar in the joint section, the reinforcing bar was widened, the concrete was peeled off, and splitting failure occurred. Even without transverse reinforcing bars, the load exceeded the expected load, and despite the maximum stress point joint section, it is considered to be usable because it exceeds the expected load calculated by the model design standard. However, given that the experimental results cannot confirm that the reinforcing bar yields, as shown in Table 6, it was considered that an additional experiment with transverse reinforcement was necessary to use the threaded reinforcement as an overlap joint.
Conversely, the coupler joint and the specimens connected with the coupler and locking nut are shown in Figure 11b. Based on these outcomes, it was confirmed that the failure mode proceeded as flexural failure even under the same conditions. In addition, compared with the 600D32 specimen’s maximum load of 902.6 kN, the coupler joint was 1096.4 kN, and the coupler and lock nut joint was 1155.4 kN, which was 21.5 to 28% higher. It can be observed that the joint is 1206.3 kN and the coupler and lock nut joint is 1228.5 kN, which is 45.1–47% higher. Coupler joints, coupler, and lock nut joints are considered to be sufficiently applicable to current regulations.
Figure 12a shows the result of the overlapping joint, coupler joint, coupler, and lock nut joint with a 600 MPa reinforcing bar, and Figure 12b is the result of the overlapping joint, coupler joint, coupler, and locking nut joint with the 670 MPa rebar.
The initial displacements and crack loads for the 600D32 (which was an overlapping joint specimen) and 670D30 specimens were 1.33 mm and 1.3 mm at 180 kN, respectively. Similar stiffness values were obtained in the cases of the coupler joint and coupler (135 kN/mm and 146 kN/mm, respectively). The lock nut joint tester 670D30C yielded a displacement of 2.1 mm at 276 kN, while 600D32CL yielded 2.1 mm at 240 kN, and 670D32CL yielded 0.65 mm at 85.5 kN, with respective stiffnesses of 131 kN/mm, 120 kN/mm, and 131 kN/mm. It was confirmed that the initial stiffnesses were small. This was attributed to the slip which occurred in the mechanical joint.
It can be observed that the slope of the graph after the occurrence of the crack is different from the slope of the overlap joint. This can be attributed to the acupressure stress between the reinforcing bar and coupler, as was confirmed experimentally.

4. Discussion and Conclusions

To understand the joint performance of high-strength threaded reinforcing bars, this study evaluated six specimens with the reinforcing bar types of 600 MPa D32 and 670 MPa D30 with the joint method, and with the overlap joint, coupler joint, coupler, and lock nut joint, as the test variables. In addition, to understand the material properties of threaded reinforcing bars, specimens were prepared for each variable and direct tensile tests were performed:
(1)
The experimental results of 600D32 and 670D30, which are overlapping joint experiments with joint lengths calculated by the current structural design standard formula, are both above the nominal strength, which is expected to apply the current regulations. In addition, the overlap joint experiments exceed the nominal load given by the current design basis, even though they do not have a lateral reinforcement. In Seliem et al. [8], the number of experiments with lateral reinforcement increases by 1.28 times compared to those without lateral reinforcement.
(2)
Second, the results of the joint performance tests showed that the joint length test results of the 600D32 and 670D30 test specimens calculated with Equation (1) listed in the KCI Concrete Structural Design Standard were all above the nominal strength.
(3)
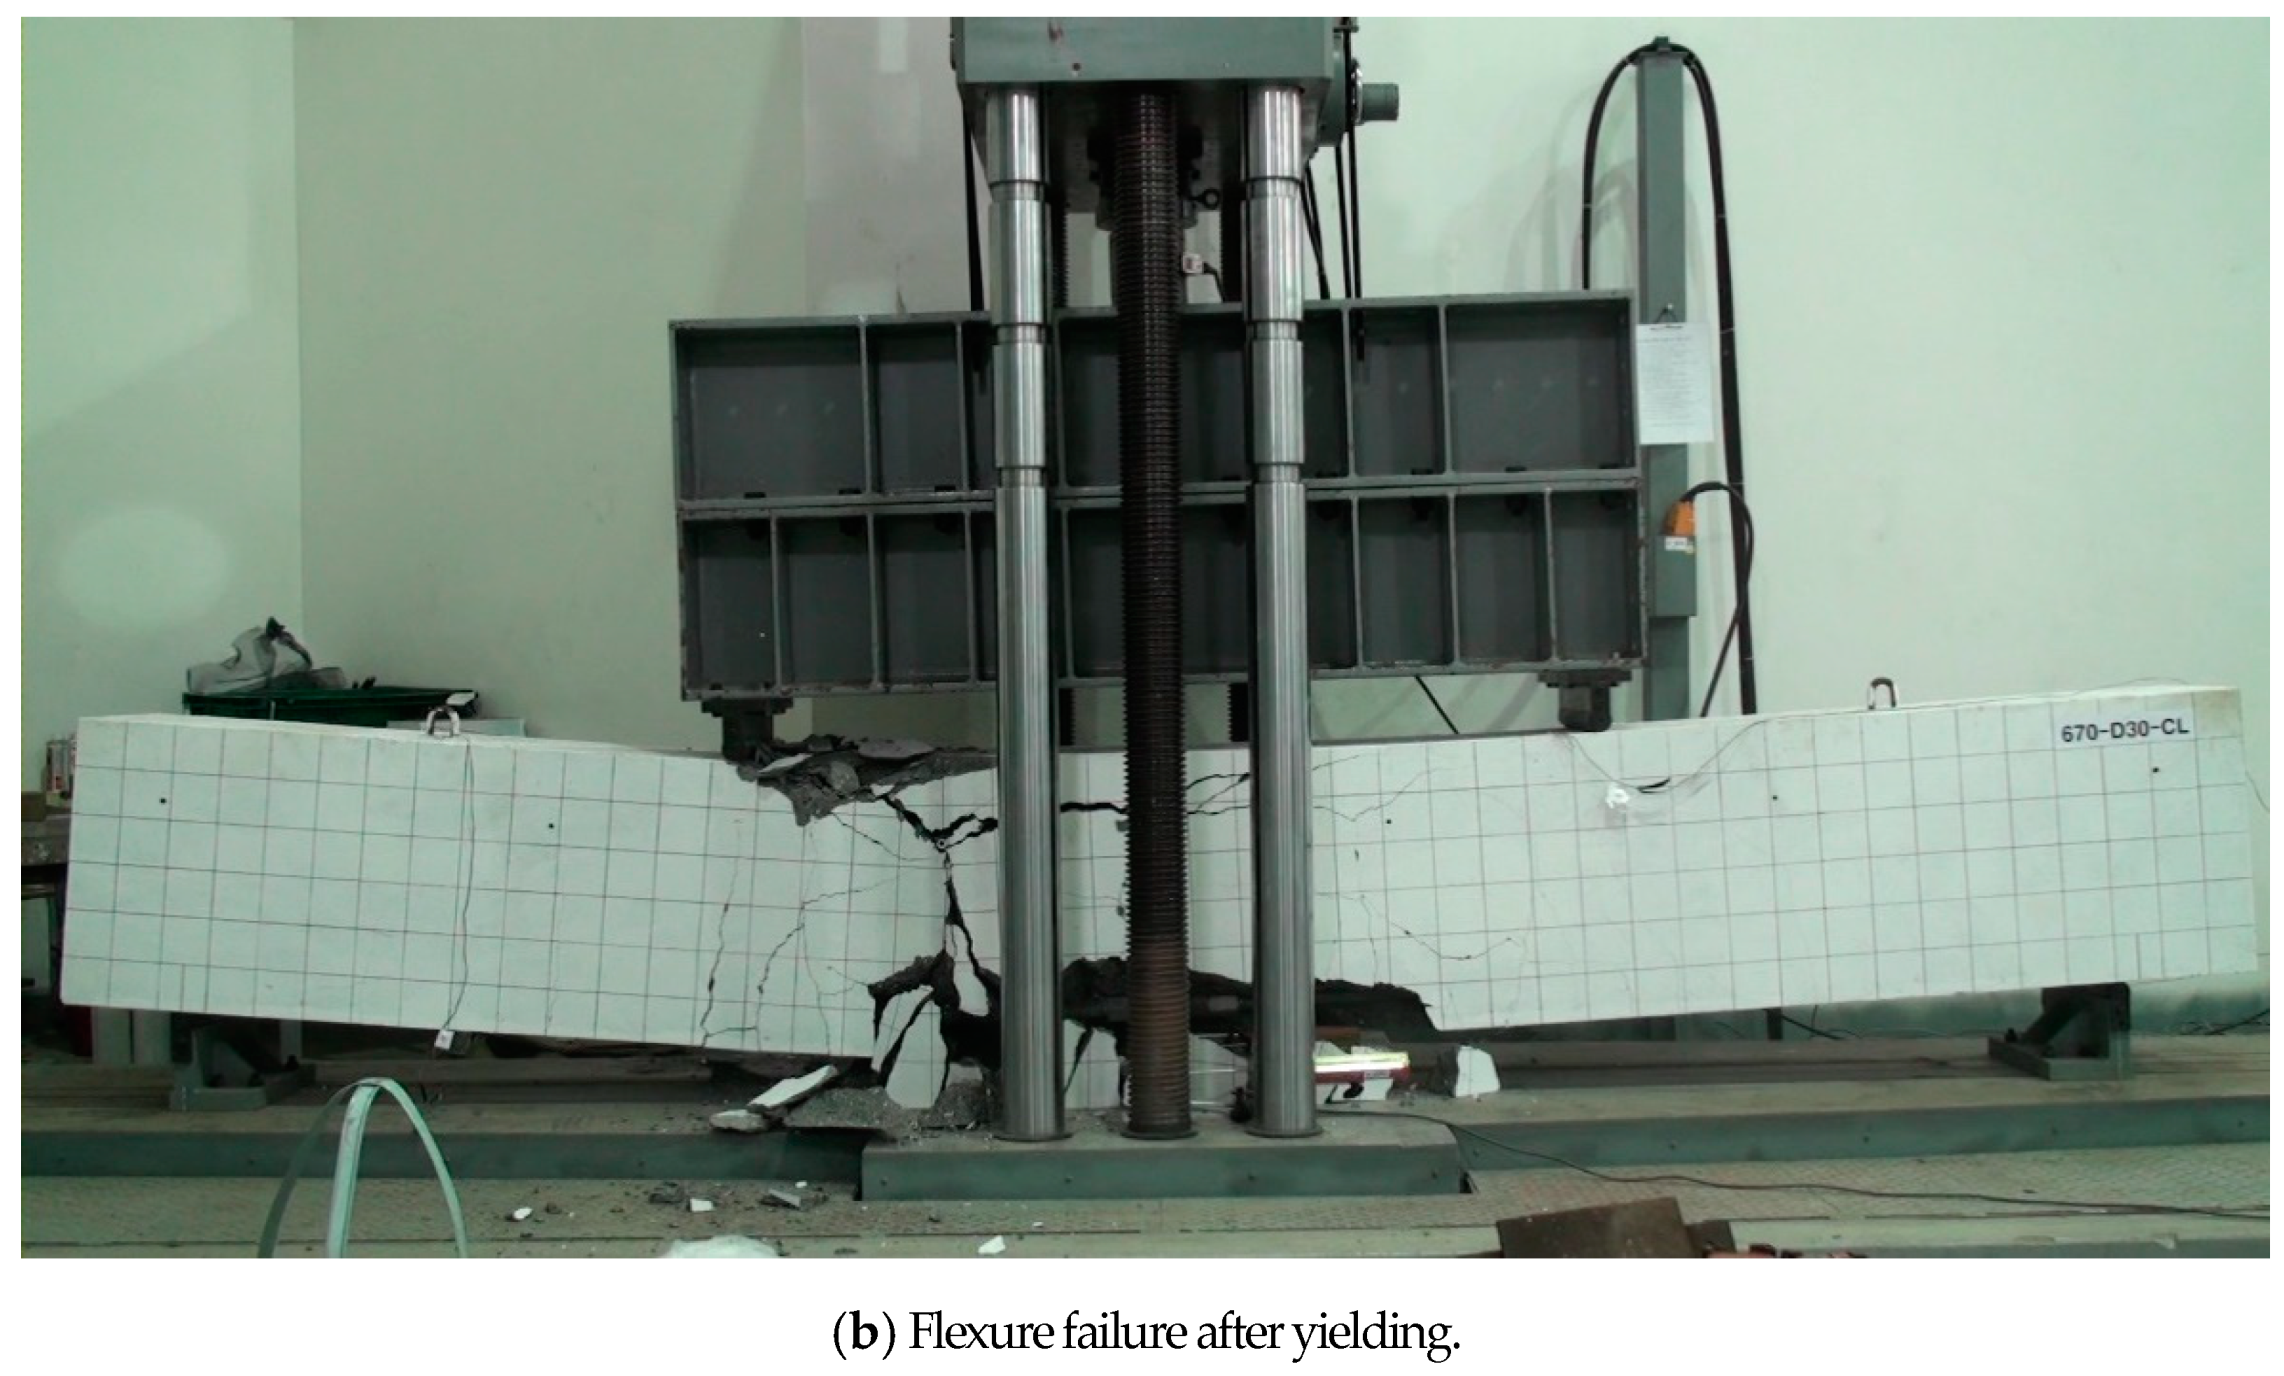
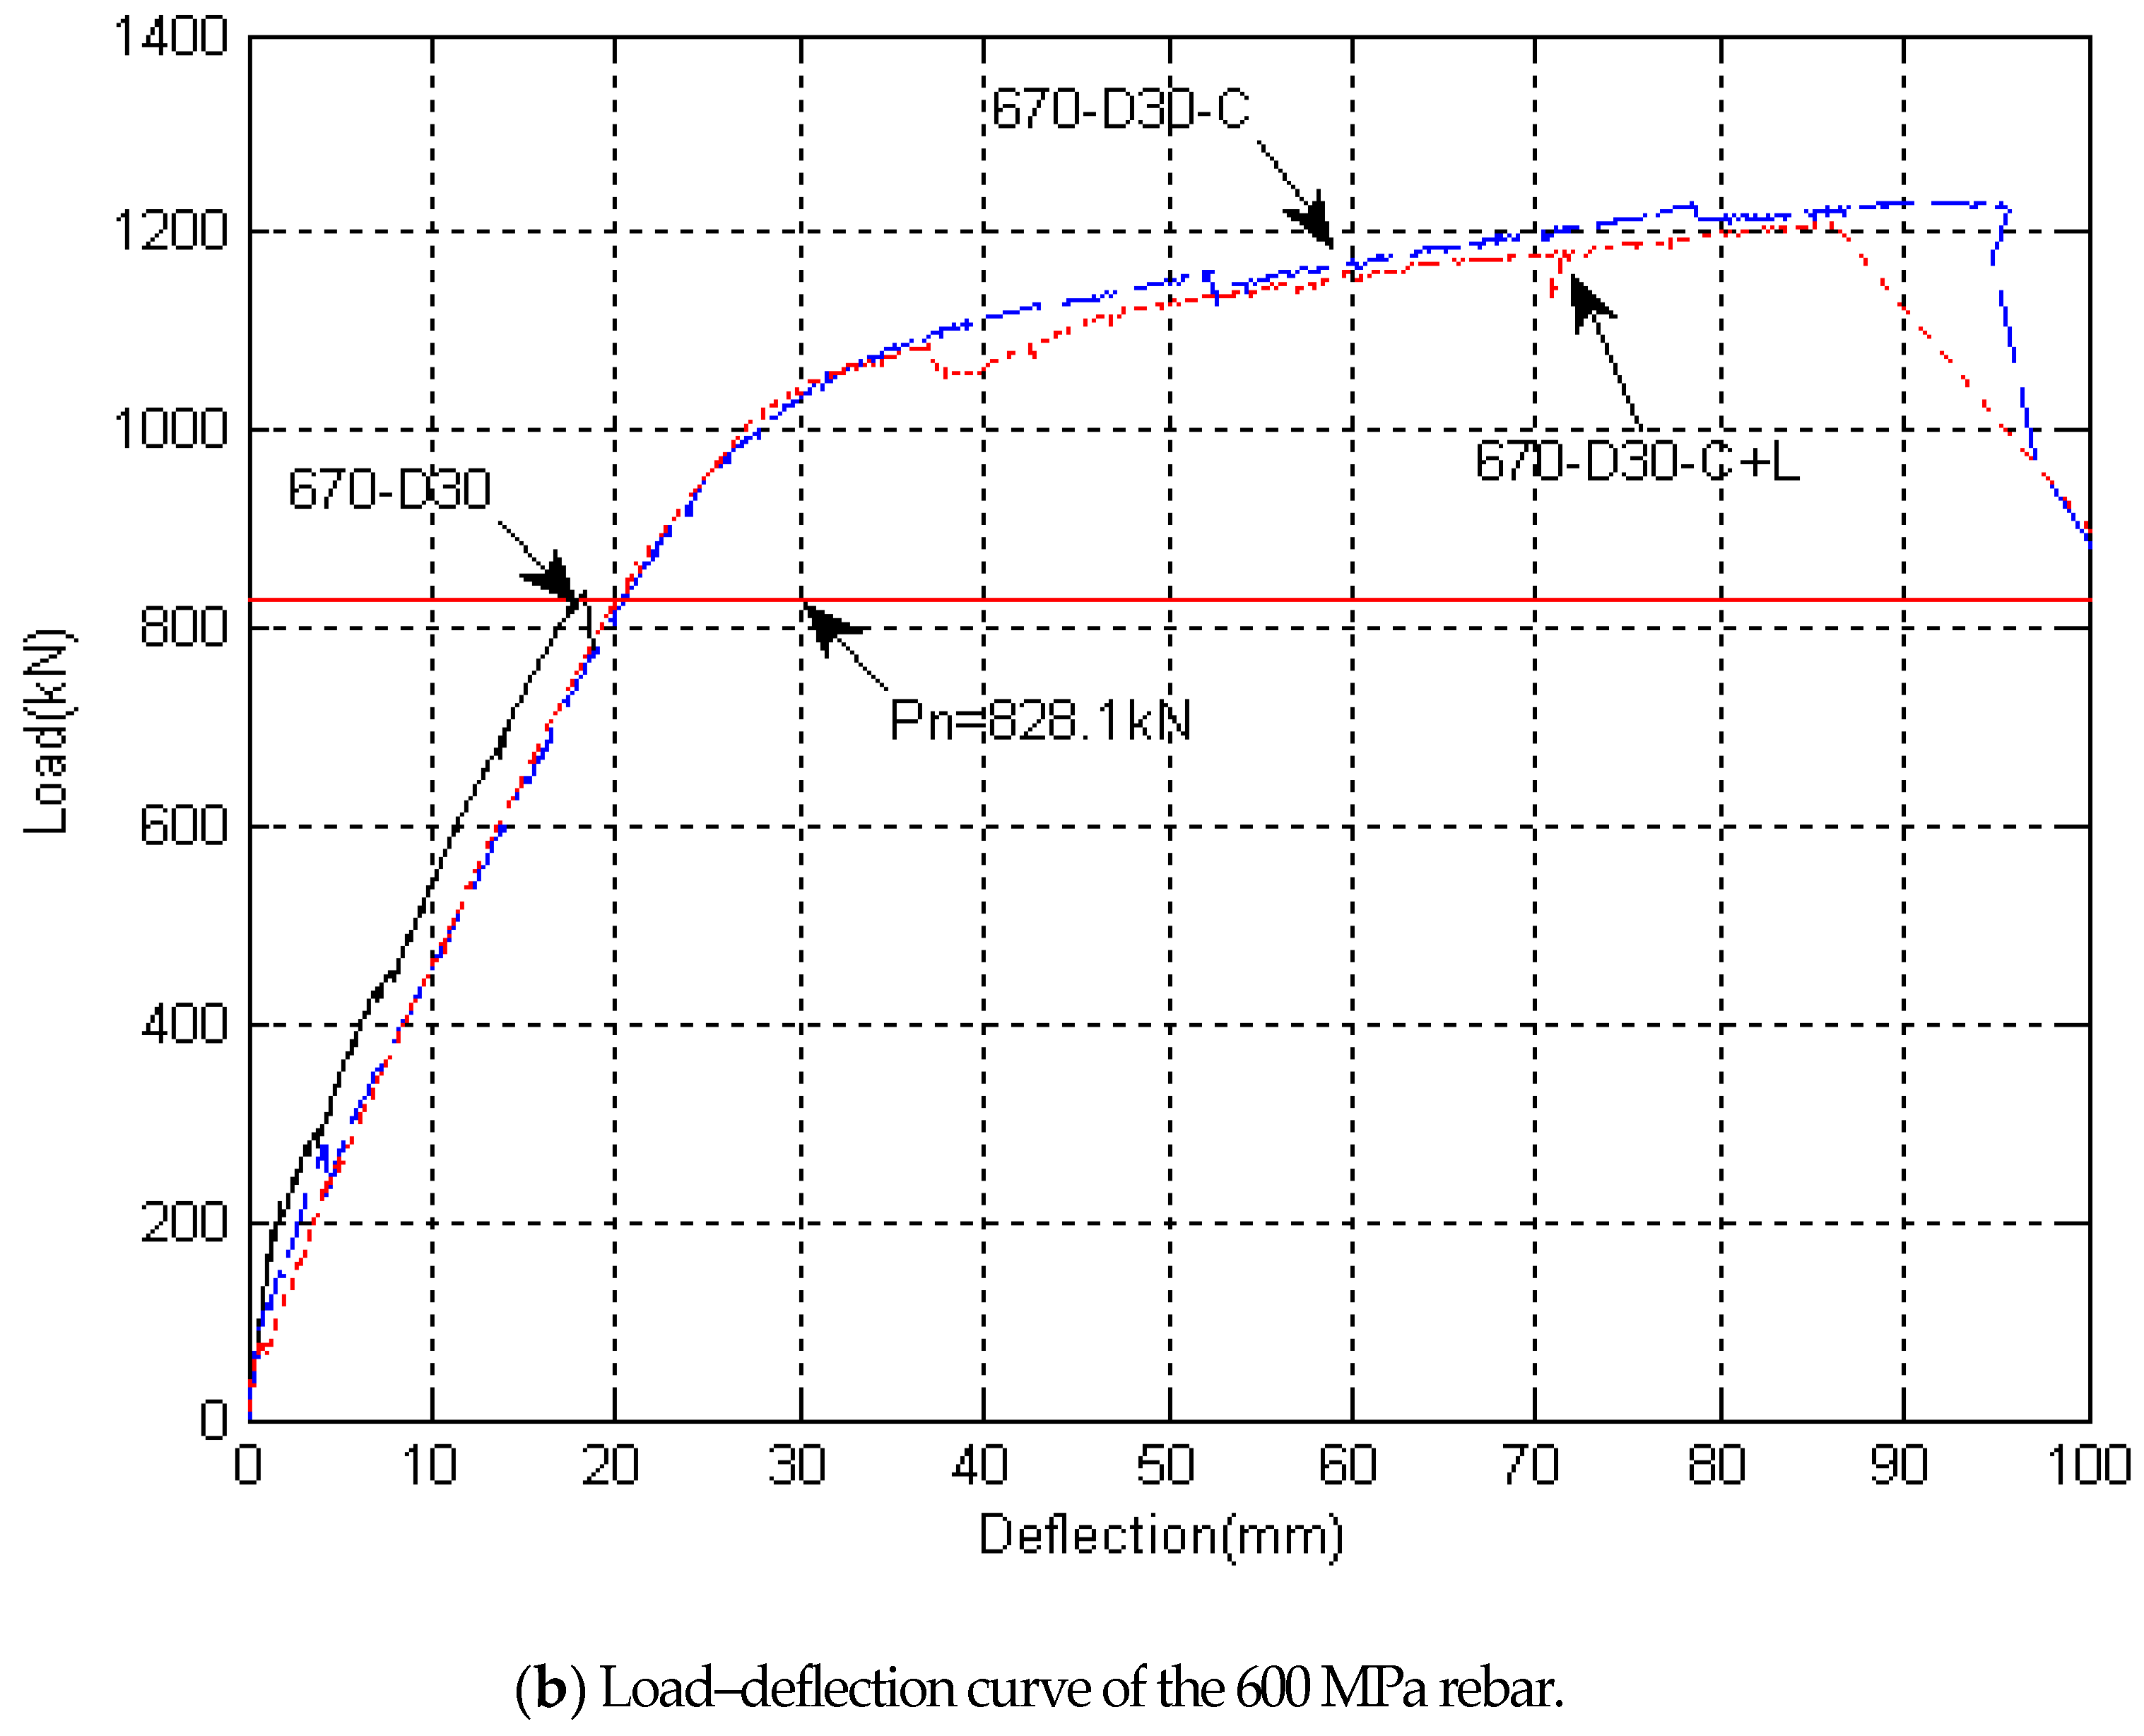
The maximum loads of the coupler joint specimens were 21.5% and 47.9% higher in the cases of the 600D32C and 670D30C specimens compared with the overlap joint specimens, respectively. They were destroyed after the ductile section after the yield load. Therefore, it is judged that the coupler joint is more effective than the overlap joint. The overlapping joint test specimen could not confirm the yield of the reinforcing bar, which is believed to be attributed to the fact that the transverse constraining reinforcement was not placed. To use the threaded reinforcement for the overlapping joint, an additional experiment with transverse constraining reinforcing bars is necessary.
(4)
When comparing the maximum load for the coupler and lock nut joint test specimen, the 600D32CL specimen increased the load by 5.4% compared with the 600D32C specimen, and the 670D30CL specimen reduced the load by 1.8% compared with the 670D30C specimen. Therefore, it is inferred that the joints between the coupler and the lock nut and the coupler joint subjected to bending stresses have similar performances.

Author Contributions

Conceptualization, S.C.; methodology, S.C.; investigation, M.L.; data curation, M.L.; writing—original draft preparation, C.L.; writing—review and editing, C.L. All authors have read and agreed to the published version of the manuscript.

Funding

This work was supported by a National Research Foundation of Korea (NRF) grant funded by the Korean government (NRF-2018R1D1A1B07049390).

Institutional Review Board Statement

Not applicable.

Informed Consent Statement

Not applicable.

Data Availability Statement

Not applicable.

Conflicts of Interest

The authors declare no conflict of interest.

References

  1. Rizkalla, S.; El-Hacha, R.; Elagroudy, H. Bond Characteristics of High-Strength Steel Reinforcement. ACI Struct. J. 2006, 103, 1–46. [Google Scholar] [CrossRef]
  2. Seliem, H.M.; Hosny, A.; Rizkalla, S.; Zia, P.; Briggs, M.; Miller, S.; Darwin, D.; Browning, J.; Glass, G.M.; Hoyt, K.; et al. Bond Characteristics of ASTM A1035 Steel Reinforcing Bars. ACI Struct. J. 2009, 106, 530–539. [Google Scholar]
  3. Hamad, B.S.; Jirsa, J.O.; Natalie, I.; De Paulo, D. Anchorage Strength of Epoxy-Coated Hooked Bars. ACI Struct. J. 1993, 90, 210–217. [Google Scholar]
  4. Choi, W.S. Applicability of Current Design Code for Development and Splice of SD600 Re-Bars. Master’s Thesis, Seoul National University, Seoul, Korea, 2011. [Google Scholar]
  5. Han, K.B. A Study on the Characteristics of Mechanical Spice of Deformed Reinforcing Bar. Master’s Thesis, Gunkuk University, Seoul, Korea, 2000. [Google Scholar]
  6. Han, B.S. A Study of Tensile Strength on the Mechanical Joint of Reinforcing Bar. Master’s Thesis, Kangwon National University, Chuncheon, Korea, 2002. [Google Scholar]
  7. ACI Committee 439. Mechanical Connections of Reinforcing Bars (ACI439.3R-91); American Concrete Institute: Farmington Hills, MI, USA, 1999; pp. 1–16. [Google Scholar]
  8. Choi, W.S.; Park, H.G.; Chung, L.; Kim, J.K. Experimental Study for Class B Lap Splice of 600 MPa (87 ksi) Reinforcing Bars. ACI Struct. J. 2014, 111, 49–58. [Google Scholar]
  9. Apostolopoulos, C.A.; Michalopoulos, D.; Dimitrov, L. Numerical simulation of tensile mechanical behavior of lap welded reinforcing steel bar joints. Bulgarian. J. Eng. Des. 2009, 3, 5–11. [Google Scholar]
  10. Goksu, C.; Yilmaz, H.; Chowdhury, S.; Orakcal, K.; Ilki, A. The Effect of Lap Splice Length on the Cyclic Lateral Load Behavior of RC Members with Low-Strength Concrete and Plain Bars. Adv. Struct. Eng. 2014, 17, 639–658. [Google Scholar] [CrossRef]
  11. Ghatte, H.F. Failure mechanisms and cracking performance of T-shaped SCC beam-column connections at top floor: Test results and FE modeling. Structures 2020, 28, 1009–1018. [Google Scholar] [CrossRef]
  12. Goksu, C.; Inci, P.; Ilki, A. Effect of Corrosion on Bond Mechanism between Extremely Low-Strength Concrete and Plain Reinforcing Bars. J. Perform. Constr. Facil. 2016, 30, 04015055. [Google Scholar] [CrossRef]
  13. Ghatte, H.F. External steel ties and CFRP jacketing effects on seismic performance and failure mechanisms of substandard rectangular RC columns. Compos. Struct. 2020, 248, 112542. [Google Scholar] [CrossRef]
  14. Sun, Y.; Liu, Y.; Wu, T.; Liu, X.; Lu, H. Numerical Analysis on Flexural Behavior of Steel Fiber-Reinforced LWAC Beams Reinforced with GFRP Bars. Appl. Sci. 2019, 9, 5128. [Google Scholar] [CrossRef] [Green Version]
  15. Karayannis, C.G.; Kosmidou, P.-M.K.; Chalioris, C.E. Reinforced Concrete Beams with Carbon-Fiber-Reinforced Polymer Bars—Experimental Study. Fibers 2018, 6, 99. [Google Scholar] [CrossRef] [Green Version]
  16. Nardone, F.; Lignola, G.P.; Prota, A.; Manfredi, G.; Nanni, A. Modeling of flexural behavior of RC beams strengthened with mechanically fastened FRP strips. Compos. Struct. 2011, 93, 1973–1985. [Google Scholar] [CrossRef]
  17. Lignola, G.; Prota, A.; Manfredi, G.; Cosenza, E. Non-linear modeling of RC rectangular hollow piers confined with CFRP. Compos. Struct. 2009, 88, 56–64. [Google Scholar] [CrossRef]
  18. Standard National Institute (BSN). Procedure of Earthquake Resistant for Building Structure and Non-Building (SNI 1726-2012); BSN Publisher: Jakarta, Indonesia, 2012. [Google Scholar]
  19. Standard National Institute (BSN). Structural Concrete Requirement for Building (SNI 2847-2013); BSN Publisher: Bandung, Indonesia, 2013. [Google Scholar]
  20. Wight, J.K.; Rabbat, B.G. Building Code Requirements for Structural Concrete and Commentary (ACI 318M-05); American Concrete Institute (ACI) Publisher: Farmington Hills, MI, USA, 2005. [Google Scholar]
  21. Bsisu, K.A.; Hunaiti, Y.; Younes, R. Flexural ductility behavior of strengthened reinforced concrete beams using steel and CFRP plate. Jordan J. Civ. Eng. 2012, 6, 304–312. [Google Scholar]
  22. Ho, J.M.C.; Kwan, A.K.H. Fluxural Ductility Assessment and Concurrent Flexural Strength and Ductility Design of Rein-forced Concrete Beams. In Proceedings of the 14th World Conference on Earthquake Engineering, Beijing, China, 12–17 October 2008. [Google Scholar]
  23. Kwan, A.K.H.; Ho, J.M.C.; Pam, H.J. Flexural strength and ductility of reinforced concrete beams. Proc. Inst. Civ. Eng. Struct. Build. 2002, 152, 361–369. [Google Scholar] [CrossRef]
  24. Mahlisani, N.; Teguh, M. Flexural Performance of RC Beams with Variety Joints of Reinforcing Steel Rebars. In Proceedings of the 4th ICSBE and the 3rd ISTEcS Proceeding, FTSP, UII, Yogyakarta, Indonesia, 21–22 October 2014. [Google Scholar]
Figure 1. Test model design, Where, LVDT is linear variable displacement transducer.
Sustainability 13 03482 g001
Figure 2. Threaded steel bar.
Sustainability 13 03482 g002
Figure 3. Threaded steel bar coupler and lock nut.
Sustainability 13 03482 g003
Figure 4. Construction of test model.
Sustainability 13 03482 g004aSustainability 13 03482 g004b
Figure 5. Threaded steel bar.
Sustainability 13 03482 g005
Figure 6. Tension test setup.
Sustainability 13 03482 g006
Figure 7. Splice test setup.
Sustainability 13 03482 g007
Figure 8. Tensile test result.
Sustainability 13 03482 g008
Figure 9. Threshold bar tension failure.
Sustainability 13 03482 g009
Figure 10. Failure mechanism.
Sustainability 13 03482 g010
Figure 11. Test model failure mode.
Sustainability 13 03482 g011aSustainability 13 03482 g011b
Figure 12. Test model failure mode.
Sustainability 13 03482 g012aSustainability 13 03482 g012b
Table 1. Design properties of test specimens.
Test Model
Name
Concrete Grade
f ck
(MPa)
Lap Splice Rebar
f y
(MPa)
Cover and Bar SpacingStirrup at Splicec (mm) c + K t r d b 1.3 l d
(mm)
Load
P n
(kN)
c b c s o c s l
600D3270600707086No862.691074822.9
600D32Ccoupler
600D32CLcoupler + lock nut
670D30670707086No862.691125828.1
670D30Ccoupler
670D30CLcoupler + lock nut
Table 2. Mix proportions.
W/B (%)S/a (%)Unit Weight (kgf/m3)
WBCEFASFS1GAD3
23.847.5114650481130397358359.75
Table 3. Concrete compressive strengths.
Age3 Days7 Days14 Days28 Days56 Days
Average
(MPa)
52.762.276.083.591.8
Table 4. Properties of threaded bar and accessories.
Threaded BarMaximum
Diameter
Pitch
(c, mm)
AreaWeight
(kg/m)
CouplerSize
d × L (mm)
Weight
(kg)
Lock NutSize
d × L (mm)
Weight
(kg)
SAS600 D3236168046.31Th-3003-3255 × 1501.32T-2002-3255 × 600.86
SAS670 D3034117075.55Tr3003-3055 × 1501.83TR-2003-3050 × 600.67
Table 5. Tension test results.
Threaded BarYield Strength f y
(MPa)
Tensile Strength f u
(MPa)
Bearing Displacement
Initial State
(mm)
Work State
(mm)
Yield State
(mm)
600D32651761---
600D32 Coupler6407590.10.370.58
600D32 Coupler + Lock nut6507610.10.250.43
670D30743874---
670D30 Coupler7258740.140.411.07
670D30 Coupler + Lock nut7248710.010.151.05
Table 6. Test result of specimens and failure mode.
Test ModelLoads
p n
(kN)
Yielding LoadMaximum Load p y p n p m a x p n Failure Mode
p y
(kN)
Deflection
(mm)
p m a x
(kN)
Deflection
(mm)
600D32822.9--902.619.8-1.09splitting
600D32C973.725.31096.469.41.181.33yielding
600D32CL987.126.51155.496.01.201.40yielding
670D30828.1--830.818.3-1.00splitting
670D30C942.423.11206.394.81.141.45yielding
670D30CL934.422.51228.586.51.131.48yielding
Publisher’s Note: MDPI stays neutral with regard to jurisdictional claims in published maps and institutional affiliations.

