Article

Analytical Modeling and Optimization of a Heat Sink Design for Passive Cooling of Solar PV Panel

1
Department of Mechanical and Energy Engineering, College of Engineering, Imam Abdulrahman Bin Faisal University, Dammam P.O. Box 1982, Saudi Arabia
2
Department of Mathematical and Natural Sciences, Prince Mohammad Bin Fahd University, Al Khobar P.O. Box 1664, Saudi Arabia
*
Author to whom correspondence should be addressed.
Sustainability 2021, 13(6), 3490; https://doi.org/10.3390/su13063490
Submission received: 21 February 2021 / Revised: 1 March 2021 / Accepted: 10 March 2021 / Published: 22 March 2021

Abstract

:
High temperature is the primary challenge in the development of solar photovoltaic (PV) systems in an arid climate. A rise in temperature diminishes the performance of the PV systems and shortens their lifespan. The goal of this manuscript is to develop an analytical model to predict the temperature of PV panels under a passive cooling system for an arid environment. Taking into consideration the link between solar panel temperature and its conversion efficiency, Kirchhoff’s and Ohm’s laws for a complex circuit were applied to calculate the heat flux in the solar panel system, and hence obtain the temperatures of each layer in the system. Closed-form analytical expressions for temperature, output power, and conversion efficiency of the solar panel were deduced and presented as functions of solar irradiance, ambient temperature, emissivity, wind velocity, tilt angle, and dimensions of fins. Comparison between the results presented in the literature and those predicted by the developed analytical model validated the presented model. Moreover, the length of the fins required for safe thermal operation of solar panels in harsh desert environment were also obtained from analysis. Furthermore, the effect of using such a cooling system on the temperature and efficiency of the solar panels was verified by using the developed model under real conditions in Dammam city during summer and winter seasons. The results showed that the optimized heat sink could raise the solar panel power by 8.7% during summer and by 6.5% during winter.

1. Introduction

Solar energy is considered a clean, sustainable, and free source of energy. It is an efficient and promising solution to combat the growing demand of global energy consumption and the fast increase of greenhouse gas emissions. Owing to a decline of price by 89% since 2010, noise-free design, and low maintenance cost, solar energy has become the most friendly and popular renewable energy source for electricity generation [1,2]. The solar energy falling on the earth in an hour and a half is sufficient to cover the world’s total annual energy demand [2]. There are two different ways to produce electricity from the sun: directly by using photovoltaic (PV) and indirectly by using solar thermal technologies. The efficiency and the lifespan of photovoltaic systems depend on environmental factors (such as solar irradiance, humidity, wind velocity, rainfall, ambient temperature, and dust), installation methods (tilt angle, orientation, and positioning), materials, and operating point of the PV module) [3]. Among these factors, the most crucial one is the PV module temperature, and its impact becomes worse in arid and desert climates [4]. It is known that only 20% of the incident solar energy is transformed to electricity and the remainder is converted to heat [5]. The decline of PV module efficiency by high temperature is due to the accumulation of heat that leads to increase the operating temperature and thus fall of the electrical efficiency of the solar panel. An increase of PV cell temperature by 1 °C decreases the cell voltage by approximately 2.2 mV, depending on module technology and manufacturer, and causes a drop in output power [6,7].

2. Related Work

Much research work has been performed to assess the impact of temperature on the efficiency and lifetime of the PV system and to find a solution to this fundamental problem. The impact of weather on the efficiency of PV panels in different locations and for different technologies has been studied by Mussard and Amara 2018 [8]. Results revealed that the high temperature affects the performance of the PV panel for all technologies and the multi-Si technology was slightly less sensitive. According to [9], an increase of 1 °C in the PV panel’s temperature leads to decrease the PV cell efficiency by ± 0.4–0.5% for crystalline silicon. The effect of environment temperature and wind velocity on the efficiency of the PV module has been evaluated by Bhattacharya, Chakraborty et al., 2014 [10]. The results revealed that the efficiency of the PV system was directly proportional to the ambient temperature. An investigation study on the impact of operating temperature on the output performance of monocrystalline PV panel in Malaysia showed that the solar irradiance and ambient temperature have a negative effect on the output performance of the PV panel [11]. A comparative study of non-ventilated and ventilated BIPV panels in the Netherlands reported drops of PV panel output power by 6% and 86% for the ventilated and the nonventilated cases, respectively [12]. In addition, the high operating temperature of the PV panel can deteriorate the PV module material and thus shorten its lifetime and its conversion performance [13,14]. An evaluation of the efficiency of photovoltaic thermal system under the environmental conditions of Saudi Arabia was performed by Al Harbi, Eugenio et al., 1998 [15]. It was concluded from the research work that during summer time, the high ambient temperature increased the PV operation temperature to reach above 100 °C, and decreased the power generation by more than 30%.
Substantial research has been reported on developing PV cooling systems, which are categorized into passive and active. Passive systems are characterized by their simplicity, affordable initial cost, and zero operational costs, while the active systems ensure a high improvement in PV panel efficiency [16,17]. A comparison of different cooling technologies has been elaborated by Özkul, Kayabasi et al., 2018 [18]. It has been noticed that the passive methods are restricted with the flowrates and the use of nanofluid in the PV cooling system seems to be promising. Ahmad, Khandakar et al., 2018 [19] developed a cooling system using water for a harsh climate like Qatar; dust could be removed by water flow on the front and back of PV panels and the efficiency could be improved by more than 10%. Devaraj, Mageshwaran et al., 2019 [20] tested two types of cooling systems: in the first type, fins were attached to the rear of the panel while the second type employed phase change material (PCM). The fin cooling system was found more efficient than PCM-based cooling in reducing the PV panel temperature.
An experimental method was used by Luo, Li et al., 2019 [21] to illustrate several heat sinks with flared fin configurations, and an overall reduction in thermal resistance of up to 10% was achieved. Grubišić-Čabo, Nižetić et al., 2018, Grubišić-Čabo, Nižetić et al., 2019 [22,23] studied aluminum fins arranged on the backside of a medium PV panel and developed a numerical model of heat flow on one PV cell with individual fin; they found that the aluminum fins were not efficient enough to decrease the PV module and more fins should be added to get a significant cooling effect. In addition, the developed model showed a difference between the frontside and backside temperature. The use of heat sink with a rectangular variable cross section has been studied experimentally and theoretically to improve the performance of PV panels by Hasan 2018 [24]. The results showed a drop of the average temperature of solar panel by 5.7 °C and an amelioration of the output power by 15.5%. A mathematical model to predict the efficiency of PV/thermal for different fin configurations was developed by Elsafi and Gandhidasan 2015 [25]; they found that the pin fins could significantly enhance the PV performance. Nehari, Benlakam et al., 2016 [26] analyzed the internal fin length inside a PV-PCM system by using a two-dimensional numerical simulation and showed an improvement in cooling the PV module for fin length configurations of 25, 30, and 35 mm. Popovici, Hudişteanu et al., 2016 [27] studied the efficiency of heat sink with ribs in cooling PV panel by changing the angle between the ribs and the base plate. The results indicated that the output power increased from 6.97% to 7.55% as the angle of rib decreased from 90° to 45°.
Determination of the operating temperature of PV panel is essential and crucial in the amelioration of the PV panel performance. A large number of correlations can be found in the literature for predicting the operating temperature of the PV module as a function of many parameters related to the operating environment and PV installation methods. The Ross thermal model developed by Jakhrani, Othman et al., 2011 [28] is the most popular equation used to estimate the PV cell temperature by using the normal operating temperature. Ciulla, Lo Brano et al., 2013 [29] developed a correlation to estimate the operating temperature of solar panel by using artificial neural networks (ANNs). A three-dimensional thermal model to portend the temperature of a PV module was developed for PV panels installed in the United Arab Emirates [30].

3. Experimental Setup

The operating temperature of the PV panel recommended by the manufacturers is in the range 50–80 °C (Fernández et al., 2014); however, the outdoor experimental data under desert weather conditions showed that the operating temperature could exceed 100 °C [15]. Thus, designing a cooling system to maintain the operating temperature within the acceptable range in such harsh weather is very much essential. The current paper aims to develop an analytical model to predict the operating temperature of the PV panel under real conditions in the desert climate. The effect of integrating heat sink to the rear of the solar panel is also considered. The novelty of this model is that it provides closed form expressions for the temperature, efficiency, and output power of the solar panel where the rejected heat from front and back surfaces of the panel are taken into consideration. To analytically solve such a complex problem, heat flux through different layers of solar panel was calculated by mimicking Kirchhoff’s and Ohm’s law for an electric circuit. The coupling between solar cell temperature, its efficiency, and the impact of different parameters such as the ambient temperature, irradiation, the wind speed, the tilt angle, the emissivity, the length, and the thickness of fins on the panel temperature were taken into consideration in detail. Furthermore, the desired length of heat sink for its safe operation in harsh desert environment are also presented from analysis.

4. Materials and Methods

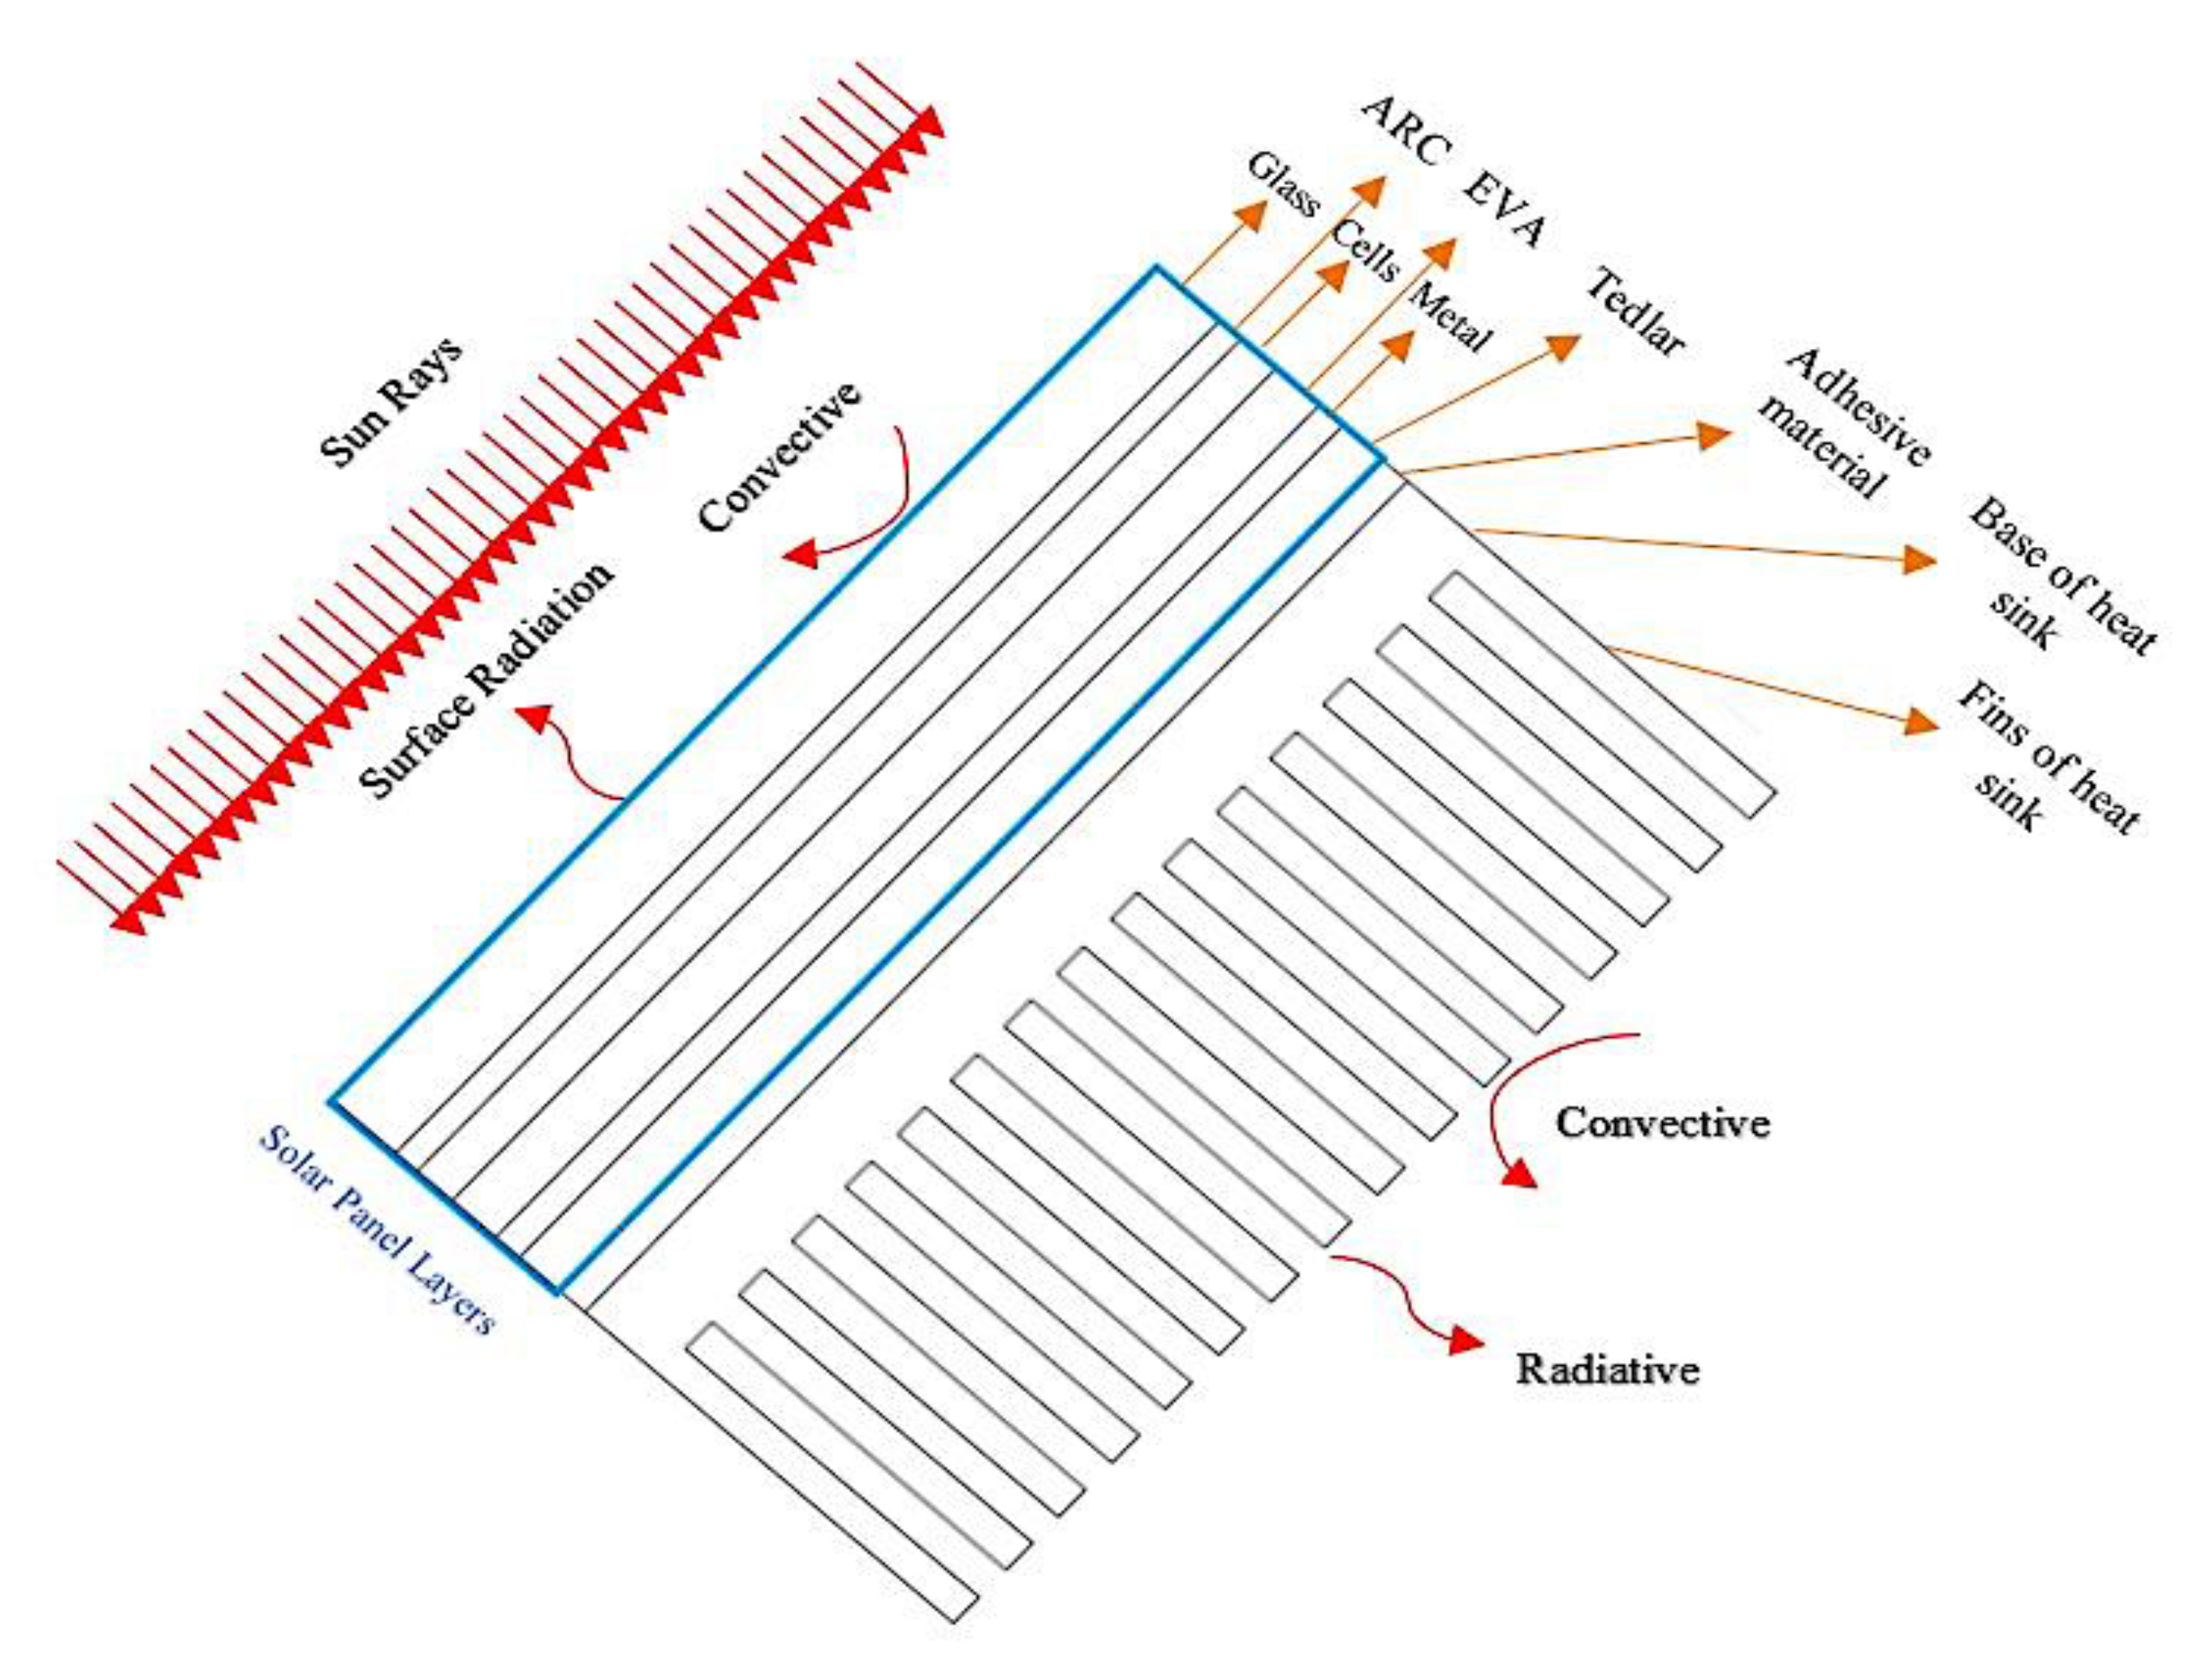
4.1. Problem Geometry and Description

The system of PV panel with the cooling of a heat sink (PV-HS) consists of several layers and different materials. Each layer has different thermal properties and thicknesses, while the front and back surfaces of the system are in direct contact with the ambient environment. Figure 1 shows the layout of the considered system, and Table 1 displays the properties of the different layers of the PV panel.
The following assumptions were necessary to develop a novel analytical model for predicting the solar panel temperature:
-
The amount of solar irradiance is identical to all cells, which means no clouds in the sky or dust in the front surface.
-
Since the time response of the system is short, the heat flow is assumed to be steady.
-
The side walls are adiabatic.
-
Since the total thickness of the system is small compared to its length and width, the flow is one-dimensional.

4.2. Mathematical Formulation and Analytical Solution

When sunlight strikes the front surface of the solar panel, a small part is reflected, while the majority is transmitted to the solar cell layer. In the solar cell layer, some part of light energy is turned into electrical energy, whereas the remainder is converted to heat. The generated heat is dissipated to the environment through both the front and back sides of the solar panel. By using Ohm’s and Kirchhoff’s current laws as an analogy, the total heat flow of the solar panel can be expressed as the sum of the heat flow of the front side (Q1) and the backside of the solar panel (Q2) as shown in Figure 2. It is expressed as:
Q t   =   Q 1 + Q 2   =   I   × A   × ( 1 η ) ×   α a b s ×   τ t r a n
where I is the incident light (W/m2), A is the area of solar panel (m2), τtran is the transmissivity of the glass cover, αabs is the absorptivity of the solar cell, and η is the efficiency of the solar panel. Solar cell efficiency decreases linearly with the operating temperature, and the decrement rate depends on the material of the PV used. There are several correlations presented in the literature expressing the cell efficiency as a function of its value at lab reference temperature, material property, and operating temperature [31]. Evans and Florschuetz (1977) [32] proposed the following correlation:
η   =   η T , r e f [ 1 β r e f ( T r e f T s o l a r ) ]
where ηT,ref is the efficiency of the solar panel at standard test conditions (STC), βref is the temperature coefficient at STC, and Tref is the reference test temperature.
The temperature of the solar panel (Tsolar) can be estimated by using the heat flow of the front part of the solar panel or by utilizing the heat flow of the backside:
T s o l a r   =   Q 1 × Σ R t h ( f ) +   T a m b
T s o l a r   =   Q 2 × Σ R t h ( b ) +   T a m b
where ΣRth(f) is the total thermal resistance at the front side, ΣRth(b) is the total thermal resistance at the backside, and Tamb is ambient temperature.
By substituting Equation (3) into Equation (4), the following expression is obtained:
Q 2 × Σ R t h ( b )   =   Q 1 × Σ R t h ( f )
Using Equation (1) and substituting in Equation (5):
Q 1   =   R t h ( b ) R t h ( f ) Q t R t h ( b ) R t h ( f ) Q 1
The expression of the heat flow of the front side as a function of the total heat is:
Q 1   =   { Σ R t h ( b ) Σ R t h ( f ) + Σ R t h ( b ) ] } Q t
By substituting Equations (1), (2), and (7) into Equation (3), the temperature of the solar panel can be expressed as:
T s o l a r   =   φ × ( 1 η T , r e f [ 1 β r e f T r e f ] + ( 1 η T , r e f ) ) + T a m b ( 1 φ ( 1 β r e f η T , r e f ) ) w h e r e :   φ   =   ( I   × A × α a b s ×   τ t r a n × Σ R t h ( f ) × Σ R t h ( b ) ) ( Σ R t h ( f ) + Σ R t h ( b ) )
The thermal resistance circuit of the system is displayed in Figure 2. The calculation of the total thermal resistance of the front and back sides will be described in the next two subsections.

4.2.1. Estimation of the Total Front Resistance

Σ R t h ( f ) = R t f = R g l a s s + R A R C + R r a d i a t i o n ( r ) R c o n v e c t i o n ( f ) R r a d i a t i o n   ( f ) + R c o n v e c t i o n ( f )
where Rglass is the resistance of the glass cover (Ω), RARC is the anti-reflective layer resistance, Rradiation(f) is the radiation resistance on the front surface (Ω), and Rconvection(f) is the resistance of combined (forced and natural) convection on the front surface (Ω). The resistance of the glass cover (Ω) is calculated using:
R g l a s s     =   t g l a s s K g l a s s A g l a s s
where Kglass is the thermal conductivity of glass on the solar panel (W/m·K), Aglass is the area of the glass in the solar panel (m2), and tglass is the thickness of the glass in the solar panel (m).
The anti-reflective layer resistance in the solar panel is defined by:
R A R C   =   t A R C K A R C A A R C
where KARC is the thermal conductivity of the anti-reflective layer on the solar panel (W/m·K), AARC is the area of the anti-reflective layer (m2), and tARC is the thickness of the anti-reflective layer in the solar panel (m).
The radiation resistance on the front surface is estimated by (Weiss, Amara et al., 2016) [33]:
R r a d i a t i o n     =   1 h r a d f × A
where A is the solar panel area, h r a d f   =   4 × σ × ε s i × ( T ) 3 , εsi is the emissivity of silicon, T∞ is the ambient temperature in (Singal, Saini et al.) [34], and σ is the Stefan-Boltzmann constant. The resistance of combined (forced and natural) convection on the front surface is estimated by:
R c o n v e c t i o n   =   1 h f × A
where A is the area of the solar panel and hf is forced convection heat transfer coefficient from front surface, and it can be estimated by (Kaplani and Kaplanis 2014) [35]:
h f   =   ( h f f ) 3 + ( h f n ) 3 3
h f f   =   0.848   k [ sin β cos u w γ p r u ] 0.5 ( L C t 2 ) 0.5
The convective heat transfer coefficient in natural convection mode hfn can be expressed as a function of the Nusslet number as follows (Álvarez, Xamán et al., 2008) [36]:
h f n   =   N u f n × k L
where hff and hfn are the forced convection and natural confection coefficients from the front surface, respectively. β is the tilt angle of solar panel, uw is the wind velocity (m/s), γ is the angle of wind speed, Pr is the Prandtl number of air, Lct is the characteristic length (m), L is the solar length (m), k is the thermal conductivity of air, and Nuf is the Nusselt number for front surface, and it can be calculated by (Álvarez, Xamán et al., 2008) [36]:
N u f n   =   { [ 0.13 { ( R a ) 1 3 ( G r c P r ) 1 3 } + 0.56 ( G r c P r s i n β ) 1 4 ] ;       i f   β > 30 ° [ 0.13 ( R a ) 1 3 ] ;                                                                                                                                                       i f   β 30 °  
where Grc is the critical Grashof number and Ra is the Rayleigh number. They are given by:
Grc   =   1.327 × 10 10   exp { 3.708 ( π / 2 β ) }
R a   =   g ( T a v g T ) L c t 3 P r ( 0.25 T a v g + 0.75 T ) v 3

4.2.2. Estimation of the Total Back Resistance

Σ R t h ( b ) = R t b = R E V A + R M B C + R T e d l a r + R a d + R h b + R b a s e × R f i n s R b a s e + R f i n s
where REVA is the resistance of the ethylene vinyl acetate (Ω), RMBC is the resistance of the sheet back metal on the solar panel (Ω), Rbase is the resistance of base of fin for both radiation and convection, RTedlar is the resistance of the Tedlar polymer on the solar panel (Ω), Rad is the resistance of the adhesive material (Ω), Rhb is the conductive resistance of the heat sink base (Ω), and Rfins is the resistance of base of fin for both radiation and convection (Ω).
The resistance of the ethylene vinyl acetate (Ω) is estimated by:
R E V A   = t E V A K E V A A E V A
where KEVA is the thermal conductivity of the ethylene-vinyl acetate on the solar panel (W/m). AEVA is the area of the ethylene-vinyl acetate in the Solar panel (m2), and tEVA is the thickness of the ethylene-vinyl acetate in the solar panel (m). The resistance of the sheet back metal on the solar panel is given by:
R M B C   =   t M B C K M B C A M B C
where KMBC is the thermal conductivity of the back-sheet metal of the solar panel (W/m·K), AMBC is the area of the back-sheet metal of the solar panel (m2), and tMBC is the thickness of the metal in the solar panel (m). The resistance of the Tedlar polymer on the solar panel is expressed as:
R T e d l a r   =   t t d K t d A t d
where Ktd is the thermal conductivity of the Tedlar polymer back sheet of the solar panel (W/m·K), Atd is the area of the Tedlar polymer in the solar panel (m2), and ttdl is the thickness of the Tedlar polymer in the solar panel in m. The resistance of the adhesive material is estimated by:
R a d   =   t a d K a d A a d
where Kad is the thermal conductivity of adhesive material (W/m·K), Aad is the area of the adhesive material (m2), and tad is the thickness of the adhesive material (m). The conductive resistance of the heat sink base is calculated by:
R h b   =   t h b K h b A h b
where Khb is the thermal conductivity of heat sink base contacted with heat sink (W/m·K), Ahb is the area of the heat sink base (m2), and thb is the thickness of the heat sink base (m). The resistance of base of fin for both radiation and convection is expressed as:
R b a s e   =   R c o n v e c t i o n ( b a s e ) × R r a d i a t i o n ( b a s e ) R c o n v e c t i o n ( b a s e ) + R r a d i a t i o n ( b a s e )
where Rconvection (base) is the resistance of combined (forced and natural) convection on the back surface (Ω) and Rradiation (base) is the radiation resistance of the back surface (Ω).
The resistance of combined forced and natural convection on the back surface is expressed as [35]:
R c o n v e c t i o n ( b a s e )   =   1 h b t o t × A b
h b t o t   =   ( h b n ) 3 × ( h b f ) 3 3
h b n   =   0.02772 × N u b n L
h b f   =   { 5.74 w 0.8 L c t 0.2 ;           i f   E c / L c t 0.05 5.74 w 0.8 L c t 0.2 16.46 L c t 1 ;           i f   0.05 < E c / L c t < 0.95 3.83 w 0.5 L c t 0.5 ;           i f   E c / L c t 0.95
where Ab is the area of the base of heat sink and is estimated by: ( L × W ) ( N × t × L ) , Nub is the natural Nusselt number from back surface and εalum is the emissivity of the aluminum back in resistance. The natural Nusselt number from back surface can be estimated by [36]:
N u b n   =   { 0.58 ( R a ) 1 / 5 ;           i f   β 2 ° 0.58 ( R a   s i n β ) 1 / 5 ;           i f   2 ° <   β < 30 ° [ 0.825 + 0.387 ( R a   s i n β ) 1 / 6 { 1 + ( 0.492 / P r ) 9 / 16 } 8 / 27 ] ;           β 30 °
The radiation resistance of the back surface is [33]:
R r a d i a t i o n ( b a s e )   =   1 A b × h r a d b a c k ( b a s e )
h r a d b a c k ( b a s e )   =   4 × σ × ε a l u m × ( T ) 3 × ( 1 2 F b a s e f i n )
where εalum is the emissivity of the aluminum back in resistance.
F(fins-fins) and F(base-fin) are the view factor of three-dimensional geometry [37] and are given by:
F i j   = 2 π B U ( ln [ ( 1 + B 2 ) ( 1 + U 2 ) 1 + B 2 + U 2 ] 1 / 2               +   B ( 1 + U 2 ) 1 / 2 tan 1 B ( 1 + U 2 ) 1 / 2               + U ( 1 + B 2 ) 1 / 2 tan 1 U ( 1 + B 2 ) 1 / 2 B tan 1 B U tan 1 U )
where B   =   l f s ,   U   =   L s ,   B = l f s , U = L s , lf is the length of fin (m), L is the length of the solar panel (m), and s is the spacing between fins (m). The resistance of base of fin for both radiation and convection is given by:
R f i n s   =   R c o n v e c t i o n ( f i n s ) × R r a d i a t i o n ( f i n s ) R c o n v e c t i o n ( f i n s ) + R r a d i a t i o n ( f i n s )
Rconvection (fins) and Rradiation(fins) are given by:
R c o n v e c t i o n ( f i n s )   =   1 h b t o t × N × η f × A f  
R r a d i a t i o n ( f i n s )   =   1 A f × N × h r a d b a c k ( f i n s )
where N is the number of fins, hbtot is the total heat transfer coefficient from the back, hradback(fins) is the radiation heat transfer coefficient of the base of the heat sink, and Af is the area of a single fin.
Af and hradback(fins) are calculated by:
A f   =   2 L × [ l f + t 2 ]
h r a d b a c k ( f i n s )   =   4 × σ × ε a l u m × ( T ) 3 × ( 1 F f i n s f i n s F f i n b a s e )
where L is the solar panel length (m), Ffin-base is the view factor of fin-base, Ffins-fins is the view factor of fins-fins, and η f is the efficiency of the fins and is described as the ratio of the heat transfer to the fin to the heat transfer to an ideal fin under the adiabatic condition:
η f   =   tanh m L c m L c
m is a constant and it is expressed as:
m   =   4 h b t o t k t
where hbtot is the total heat transfer coefficient from the back
Lc is characteristic length and is estimated by:
L c   =   l f + t 2

4.2.3. Estimation of the Solar Panel Efficiency and Produced Power

Once the solar panel temperature is obtained, the efficiency of the solar panel can be calculated using Equation (2), and the output power can be calculated using the following equation:
P   =   I A ( 1 η ) α a b s τ t r a n

5. Results and Discussion

The presented analytical model was validated by using the experimental data from the literature, along with obtaining the optimum fin length for peak thermal performance. Subsequently, the model was used for investigating the impact of parameters such as length and thickness of fins, wind velocity, tilt angle, ambient temperature, and emissivity of heat sink surface on the solar panel temperature. The results are presented in the following sub-sections.

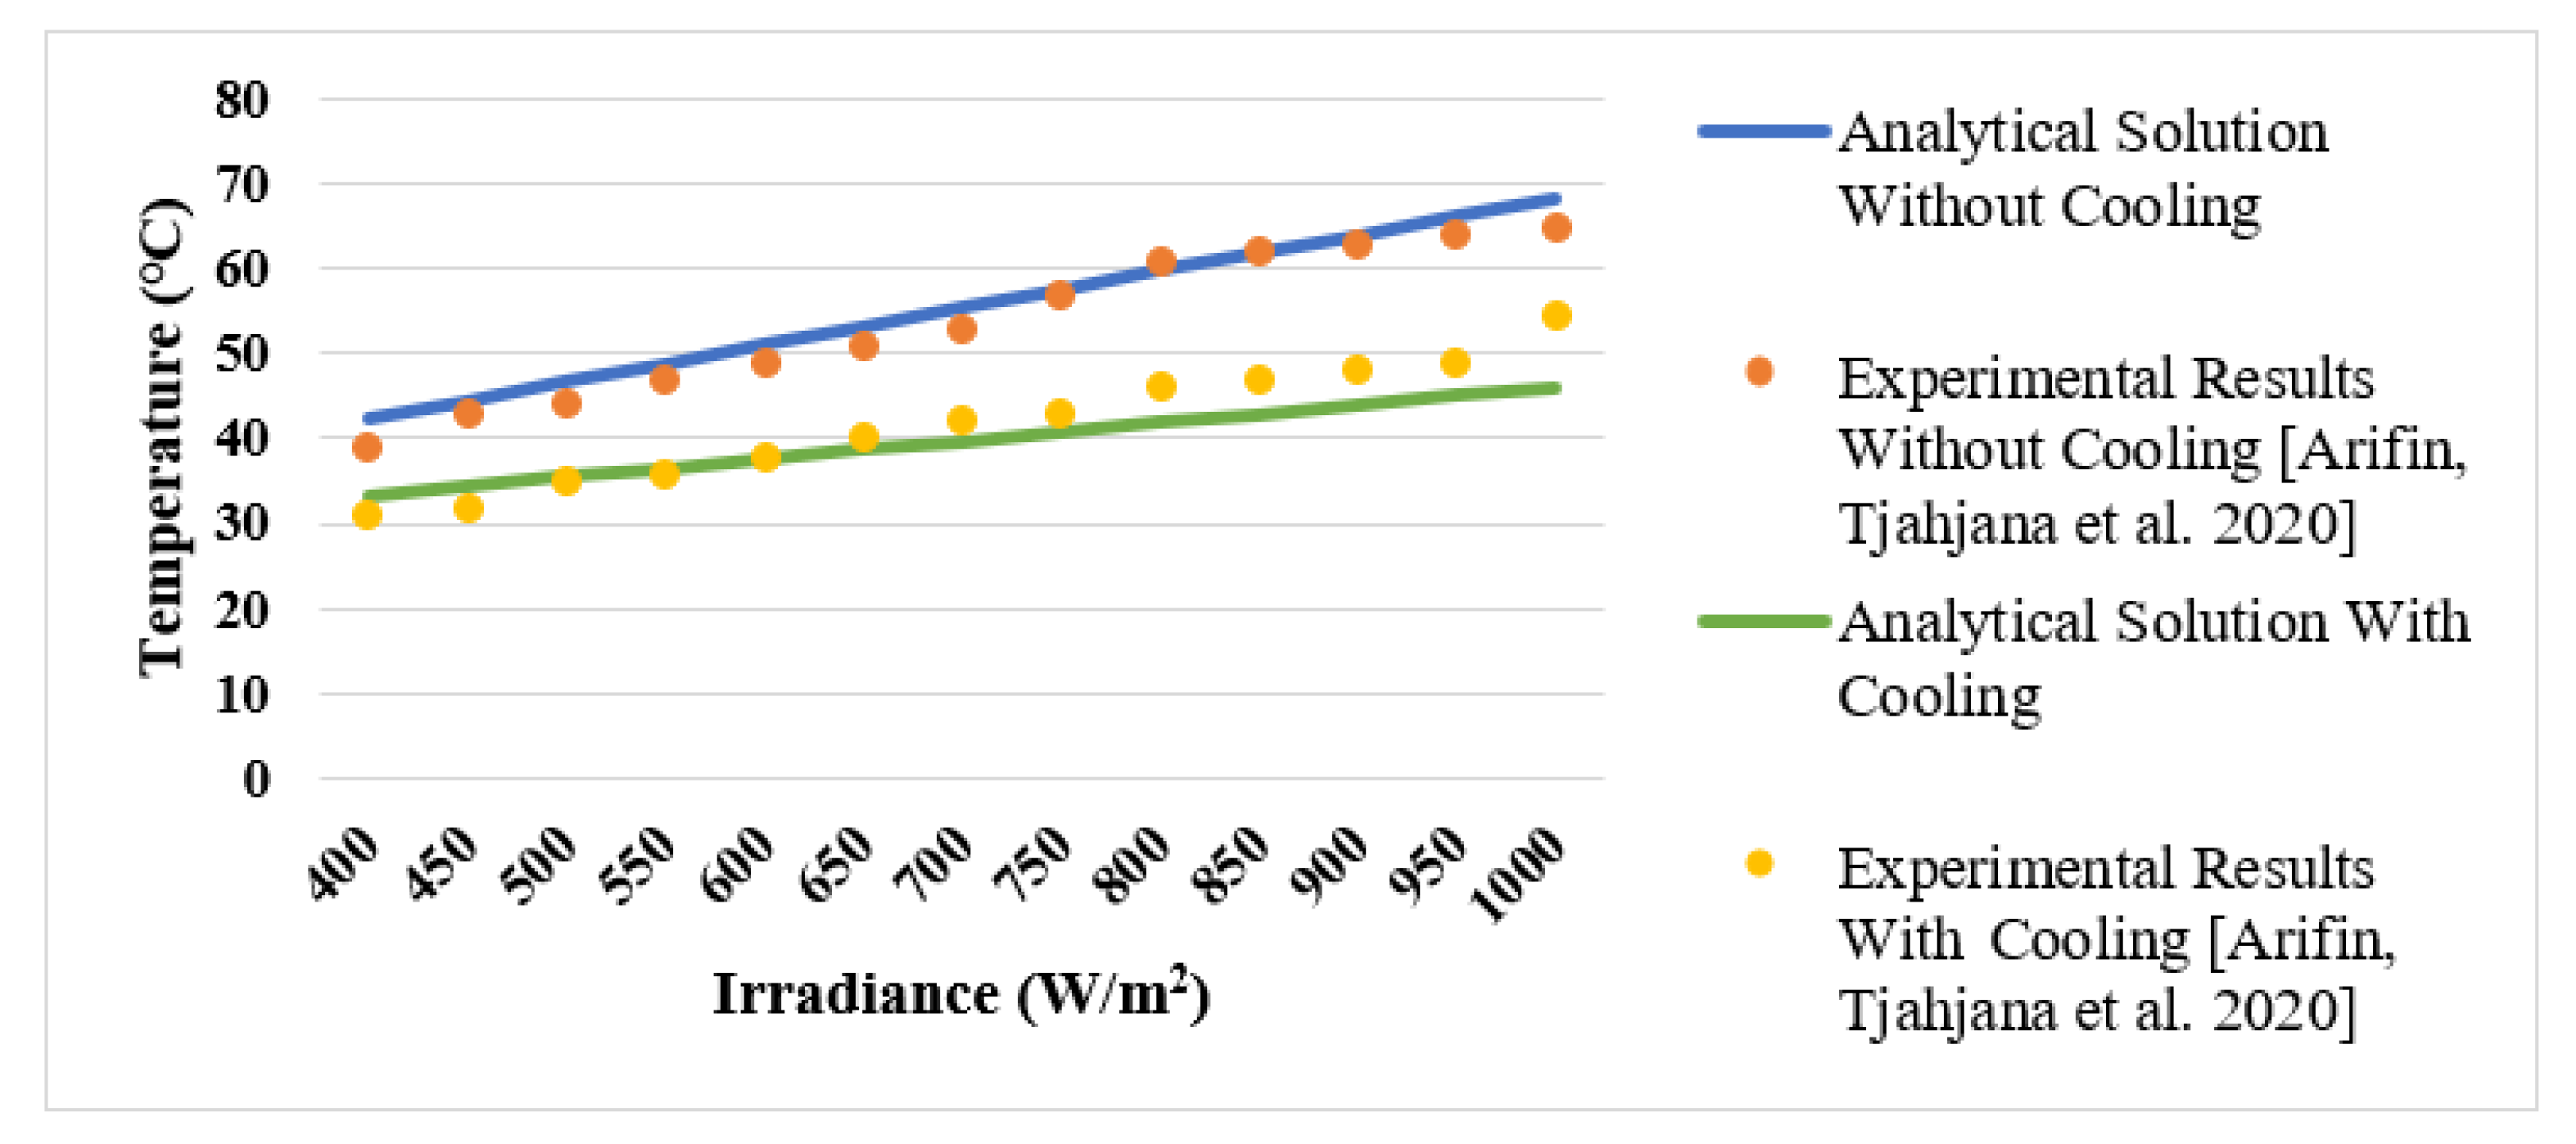
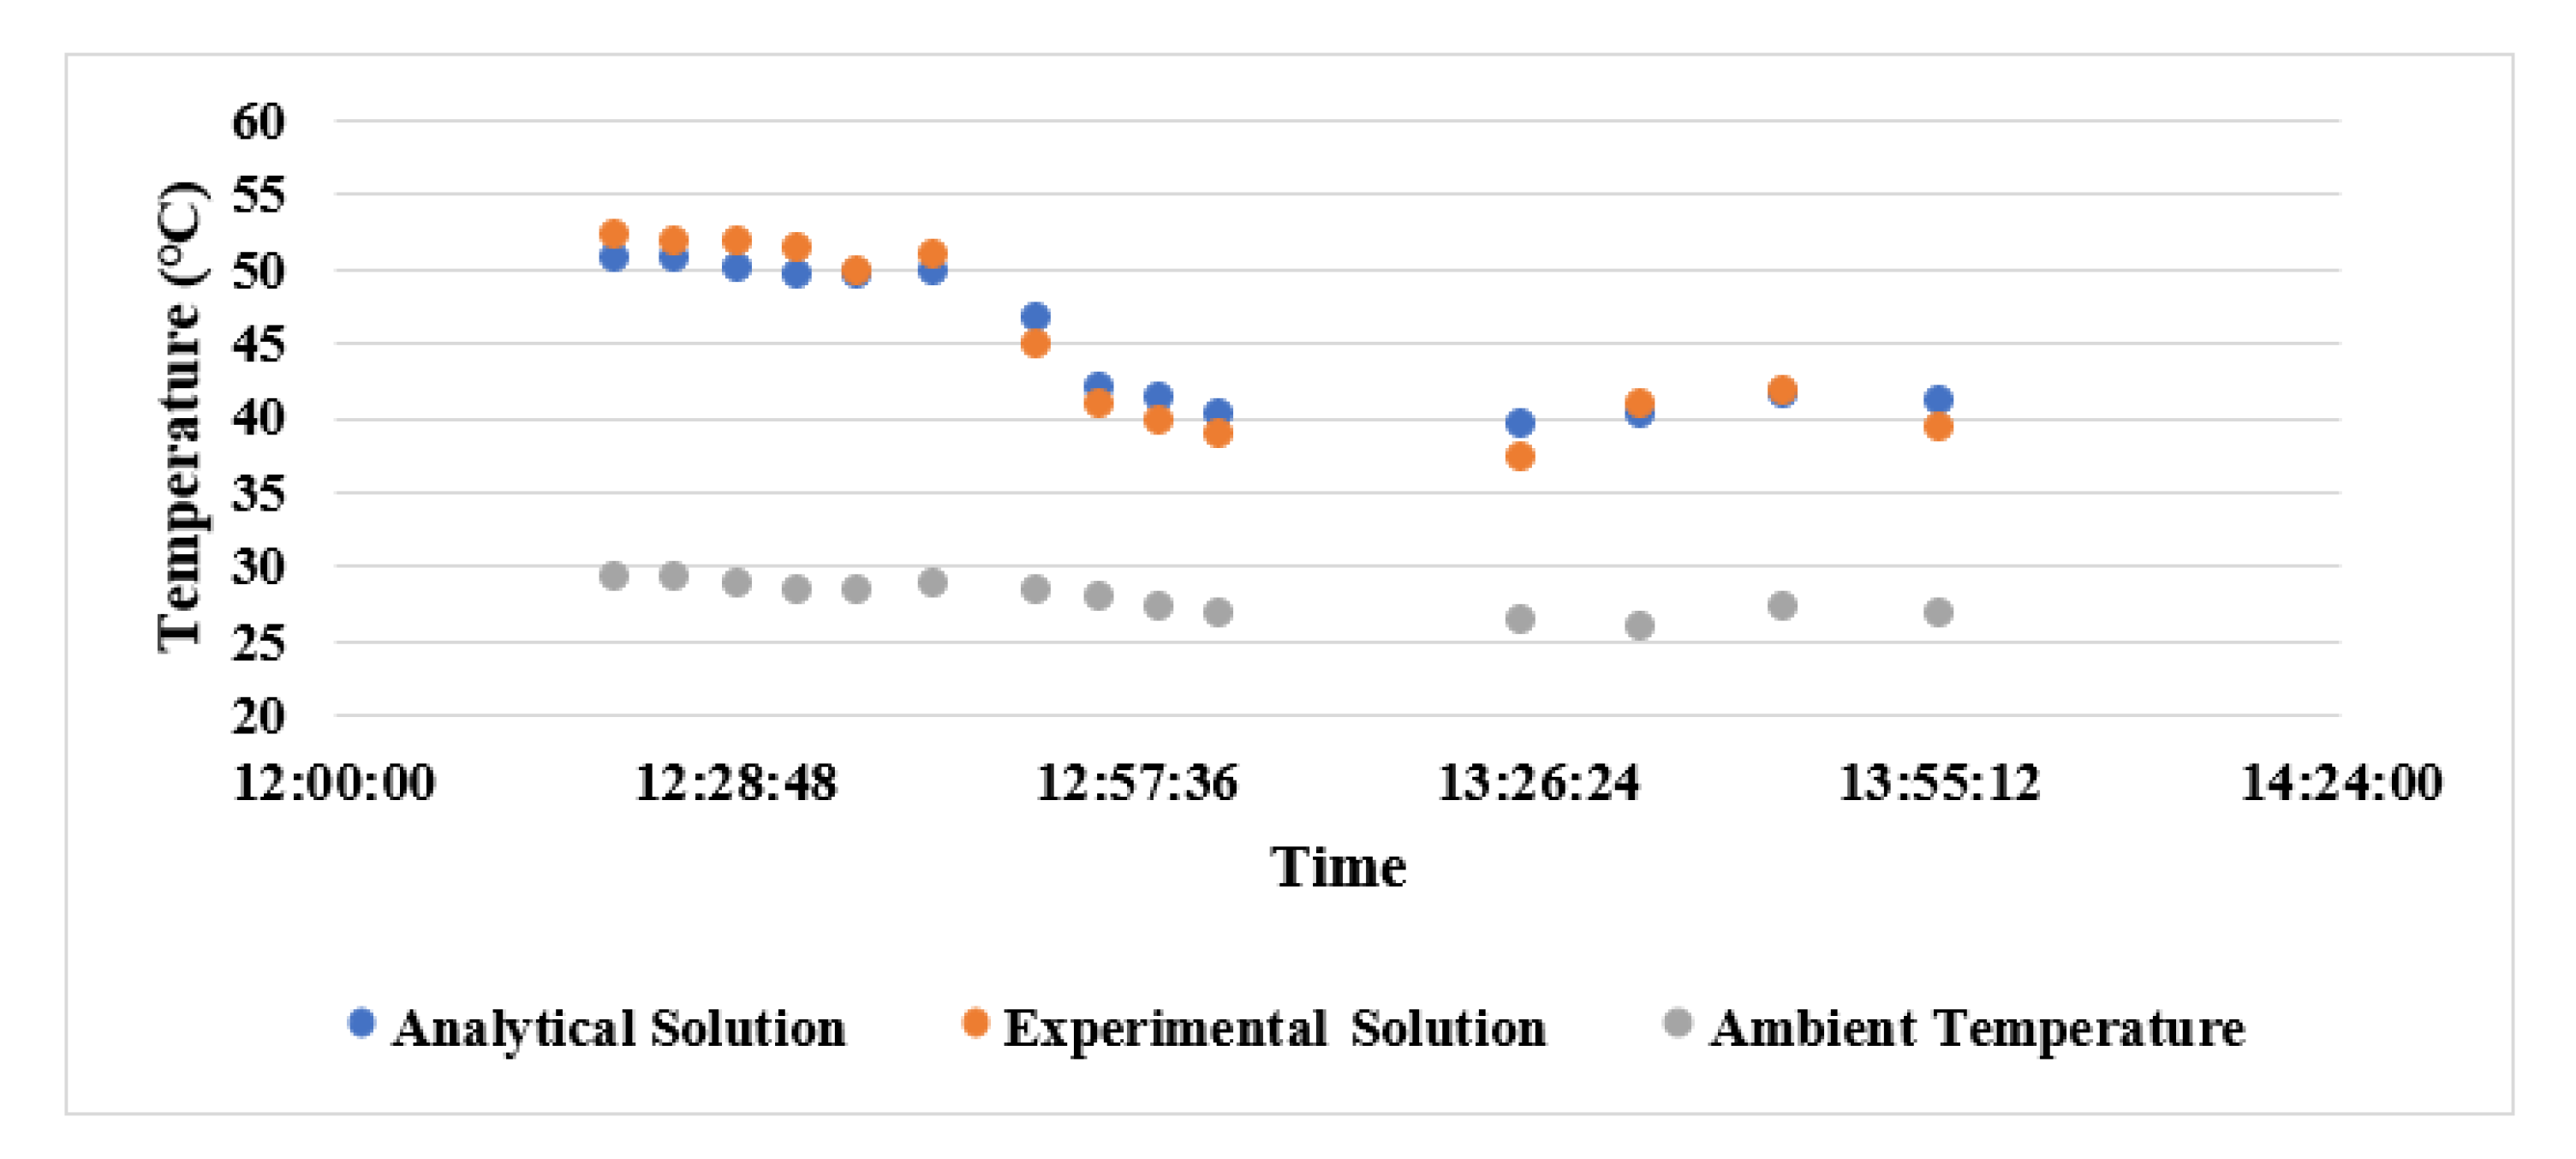
5.1. Model Validation

The present analytical results were compared with the indoor experimental results with and without cooling system of Arifin, Tjahjana et al. (2020) [38] whose cooling method was similar to the present method, and the outdoor experimental results without cooling system of Li, Ma et al. (2019) [39] and Ahmad, Khandakar et al. (2018) [19]. The inputs utilized in the studies mentioned in Table 2 were used in the present paper for generating results for validation.
The accuracy of the developed model in estimating the solar panel temperature was checked by the calculation of root mean square error (RMSE), coefficient of determination (R2), Chi-square test, and maximum standard deviation:
R 2   =   [ ( i   =   1 N ( y i z i ) 2 i   =   1 N ( x i y i ) 2 i   =   1 N ( y i z i ) 2 ]
R M S E   =   [ ( i   =   1 N ( y i x i ) 2 N ) ] 1 / 2
C h i s q u a r e   =   i   =   1 N ( x i y i ) 2 y i
M a x i m u m   s t a n d a r d   e r r o r   =   x   =   1 N ( x i y i ) 2 N 1
where (xi), (yi), and (zi) are the experimental result, predicted result of the developed model, and mean of the experimental results, respectively.
Figure 3 presents the comparison of impact of irradiance on the solar panel temperature with and without cooling system between the presented analytical model and the experimental results of reported by Arifin, Tjahjana et al. (2020) [38]. It can be observed that for a solar panel without cooling system, there is an excellent agreement between the two solutions. However, in the case of adding a cooling system, more difference can be observed between the curves at 800 W/m2 solar irradiance and above.
The comparison of the variation of solar panel temperature during the daytime between the experimental results presented by Li, Ma et al. (2019) [39] and the presented model are as shown in Figure 4. It is obvious that the two curves are similar and in excellent agreement, which verifies the accuracy of the present model in predicting the performance of solar panel under real operating conditions.
Figure 5 illustrates the comparison between the experimental results reported by Ahmad, Khandakar et al. (2018) [19] and the results from the developed model without a cooling system for some hours during day time. The results show good agreement with each other, thus validating the presented analytical model.
According to the values of RMSE, R2, Chi-square, and maximum standard deviation (Table 3), it can be concluded that the developed model has a good accuracy in estimating the solar panel temperature. It can be seen in Figure 3 that the highest difference between the experimental and analytical results of Arifin, Tjahjana et al. (2020) [38] in the case of using cooling system is recorded for one point (the last point), which caused the high value of maximum deviation.

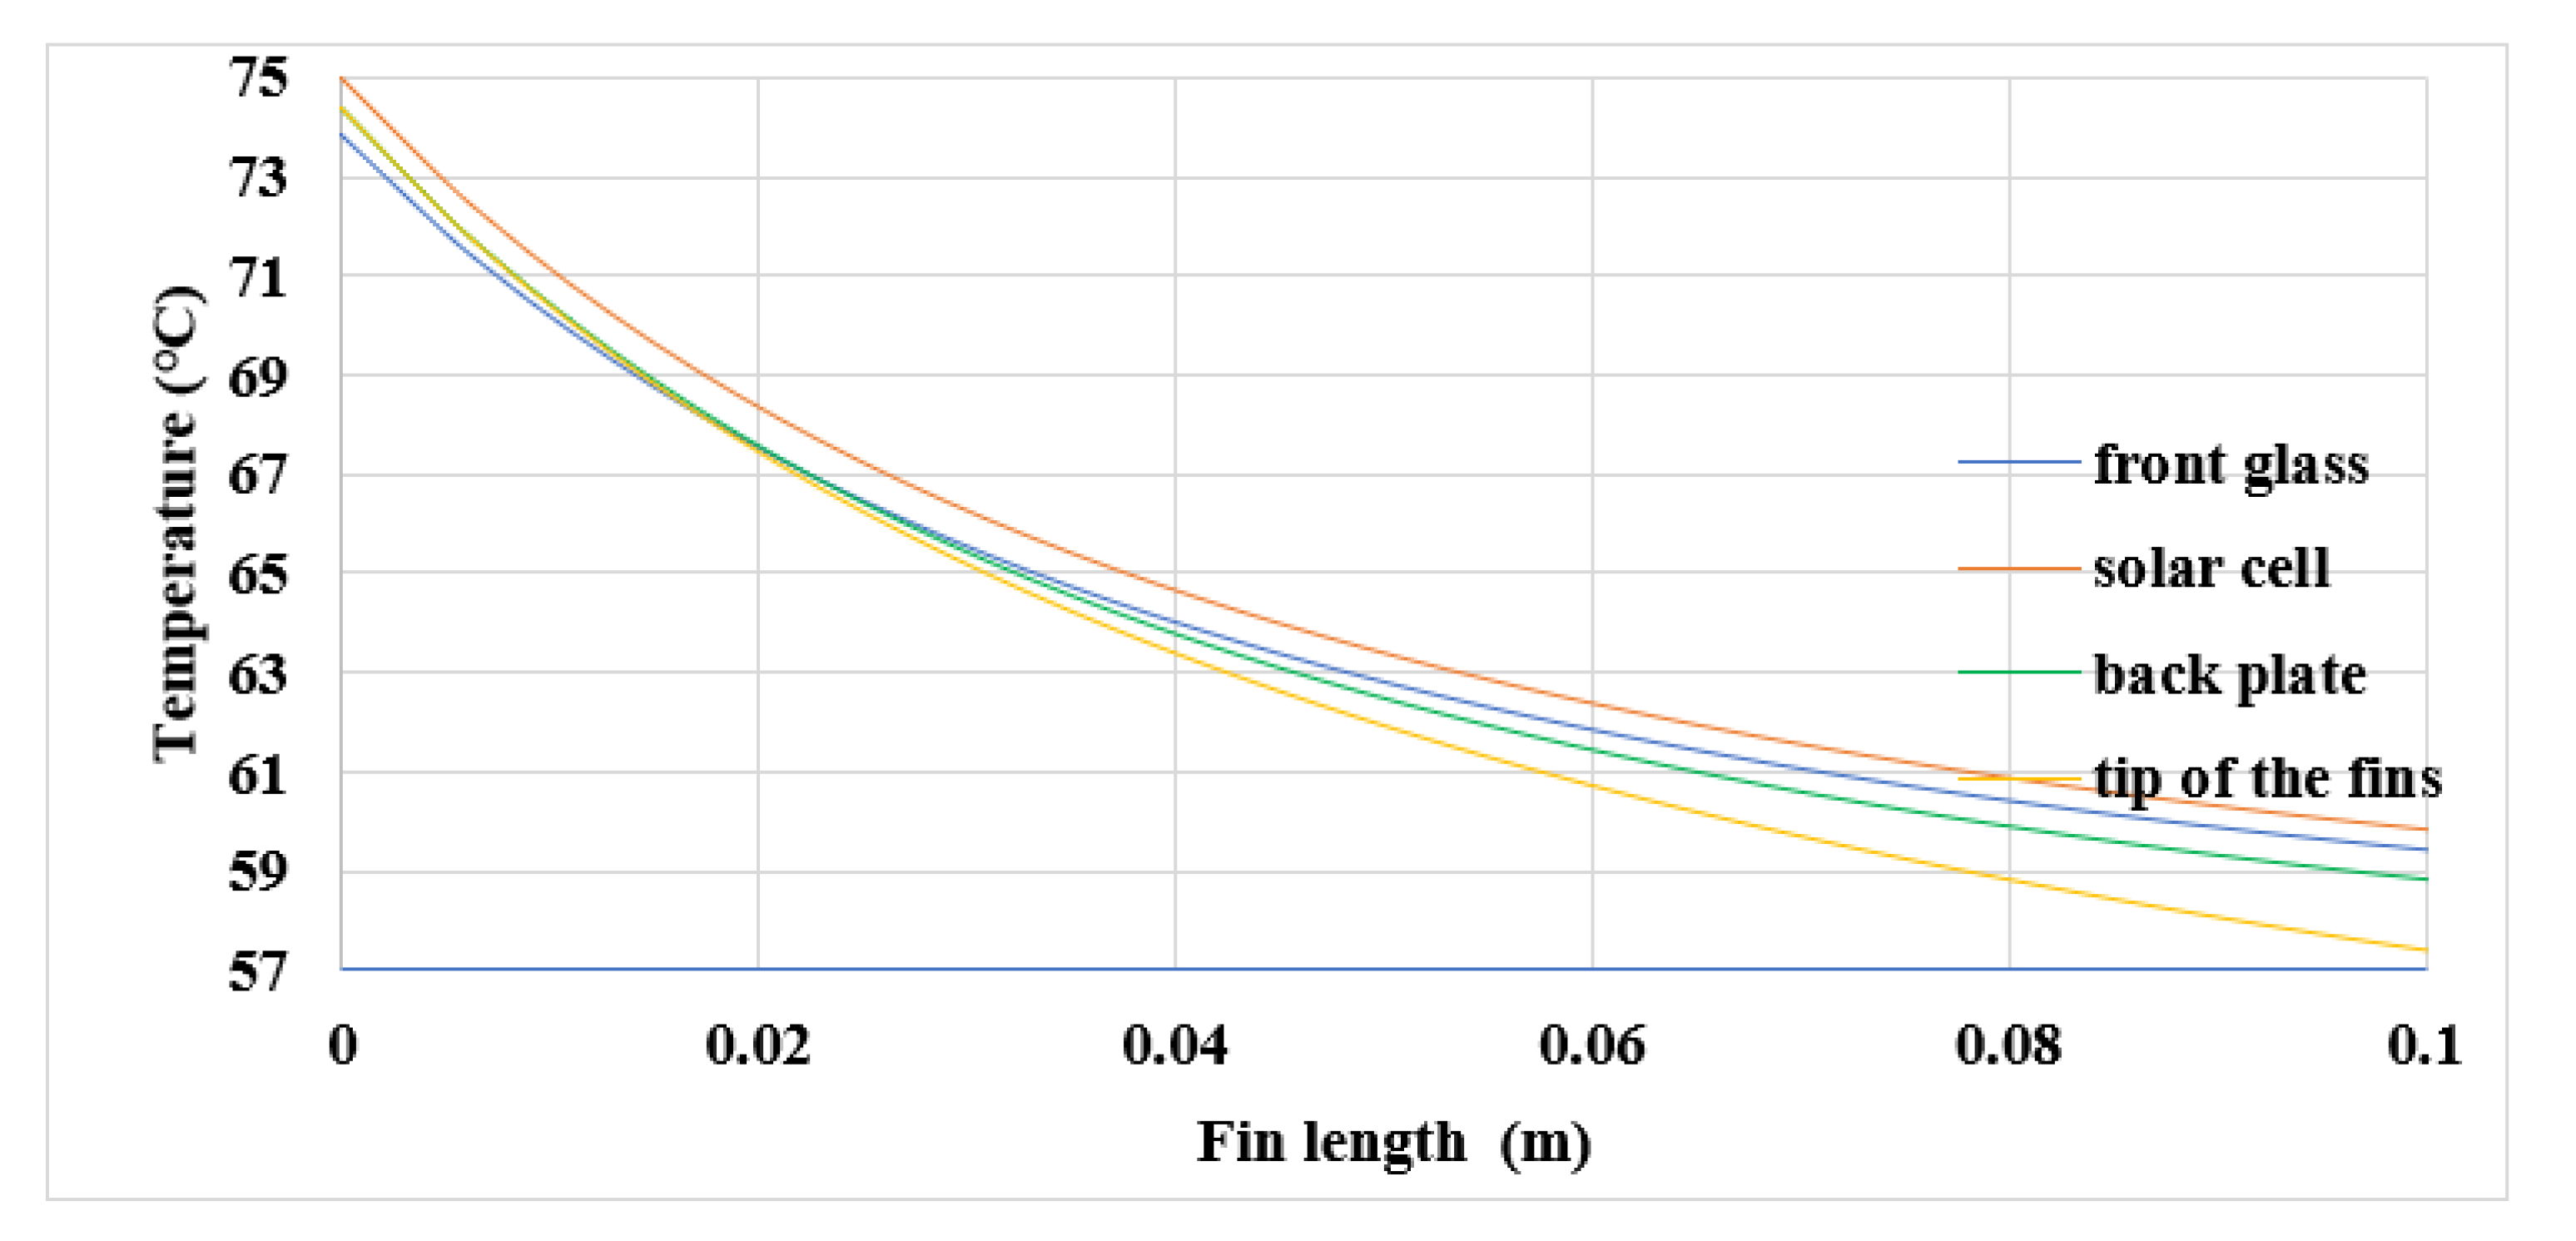
5.2. Optimal Length of Fins

The quantity of heat dissipated from a heat sink depends on the fin surface area and the heat dissipated per square meter. More heat can be removed by adding more fins up to a certain number at which the air flow rate is hindered to cause a drop-in heat transfer. Therefore, the fin length and the space between fins play an important role in achieving the best thermal performance, which necessitates the optimization of fin length and the fin spacing. Many studies have been conducted to find the optimum design of fins. An equation was developed by Bar-Cohen and Rohsenow (1984) [40] to find the optimal spacing between fins for a rectangular array as a function of Rayleigh number and characteristic length. The equation is:
S o p t i m a l   =   2.714 L R a 0.25
where L is the length of the array and Ra is the Rayleigh number. It has been found that the optimal spacing is 0.015459 m. The parameters of the worst scenario of harsh environment as presented in Table 4 (i.e., when v = 0 m/s, T   =   50   ° C ,   I   =   1000   W / m 2) are used to estimate the optimal length of fins (lf,opt) by replacing them in Equation (8). It has been found that the optimal length of fin at which the solar panel operates below the recommended safe temperature is 0.07 cm.

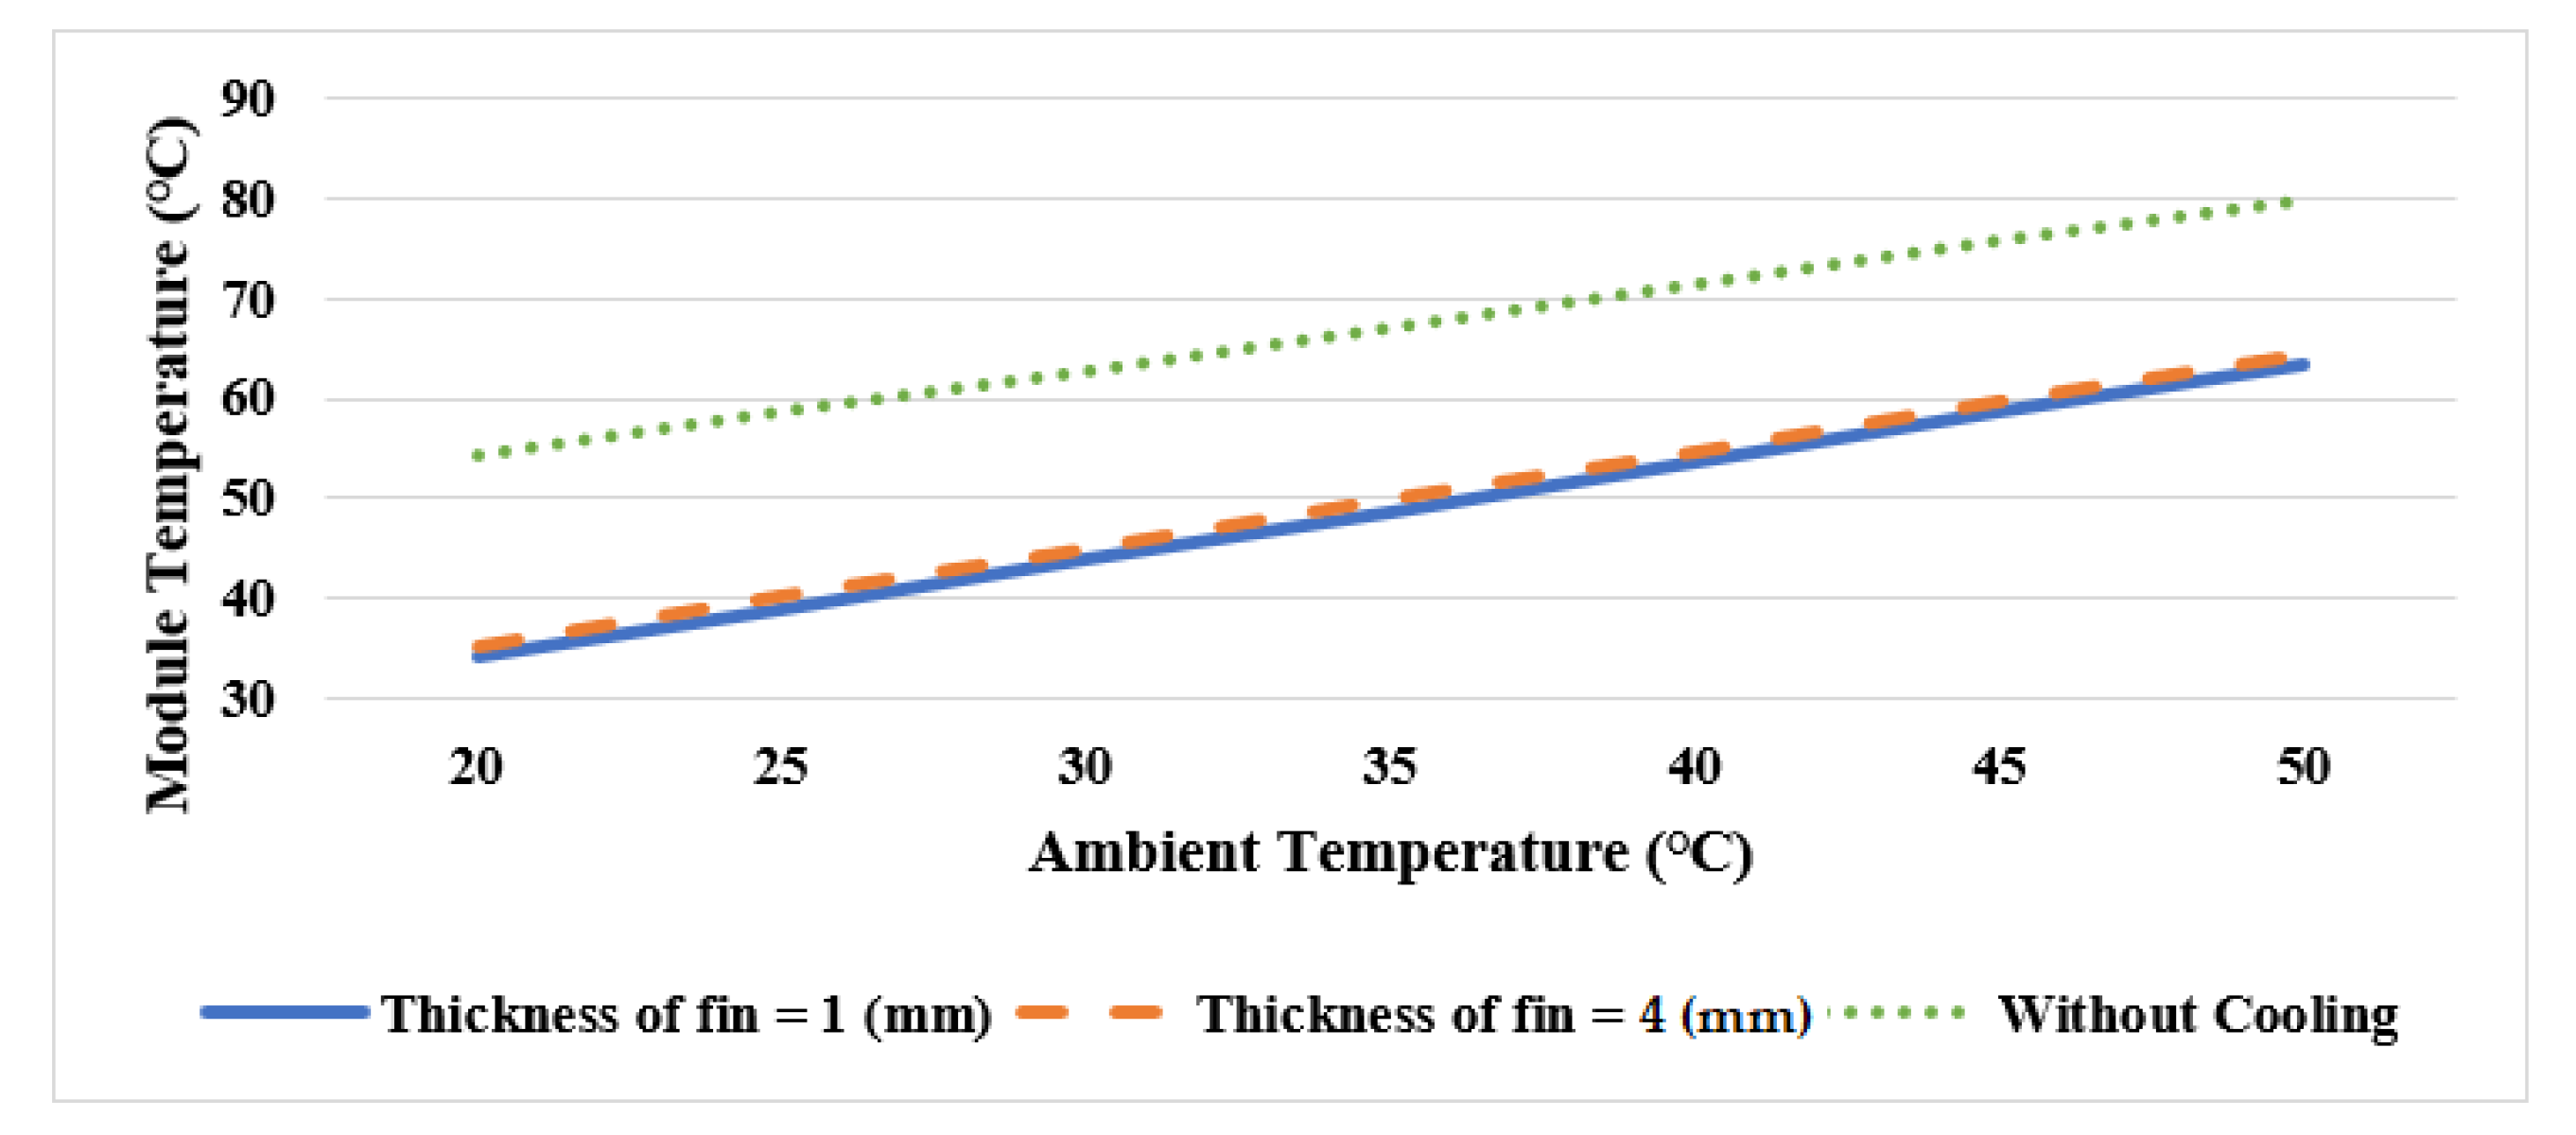
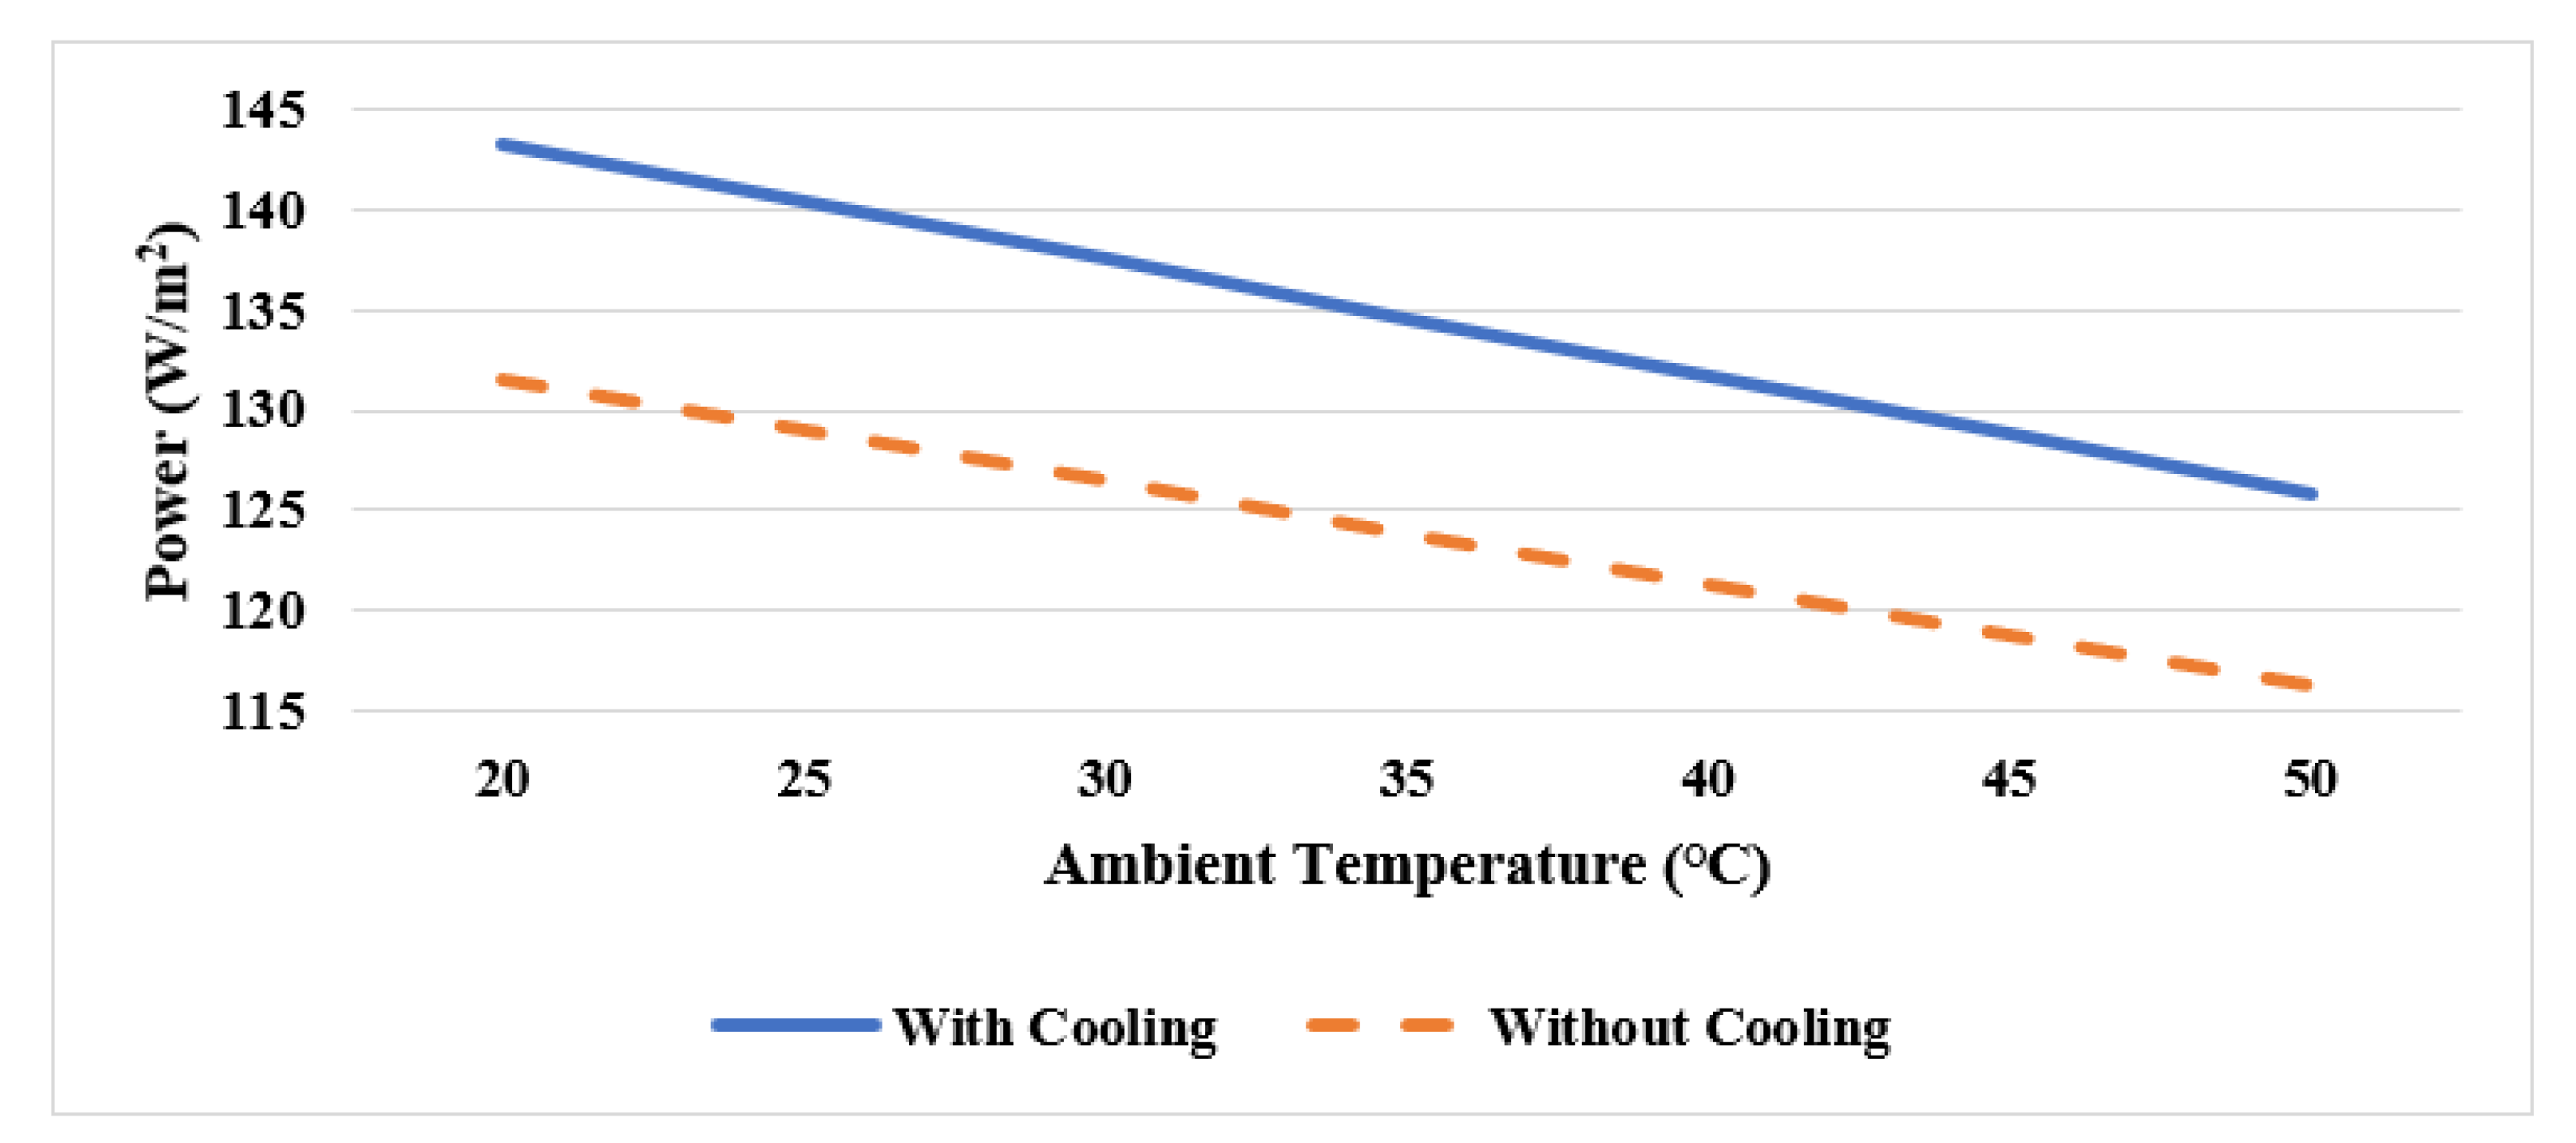
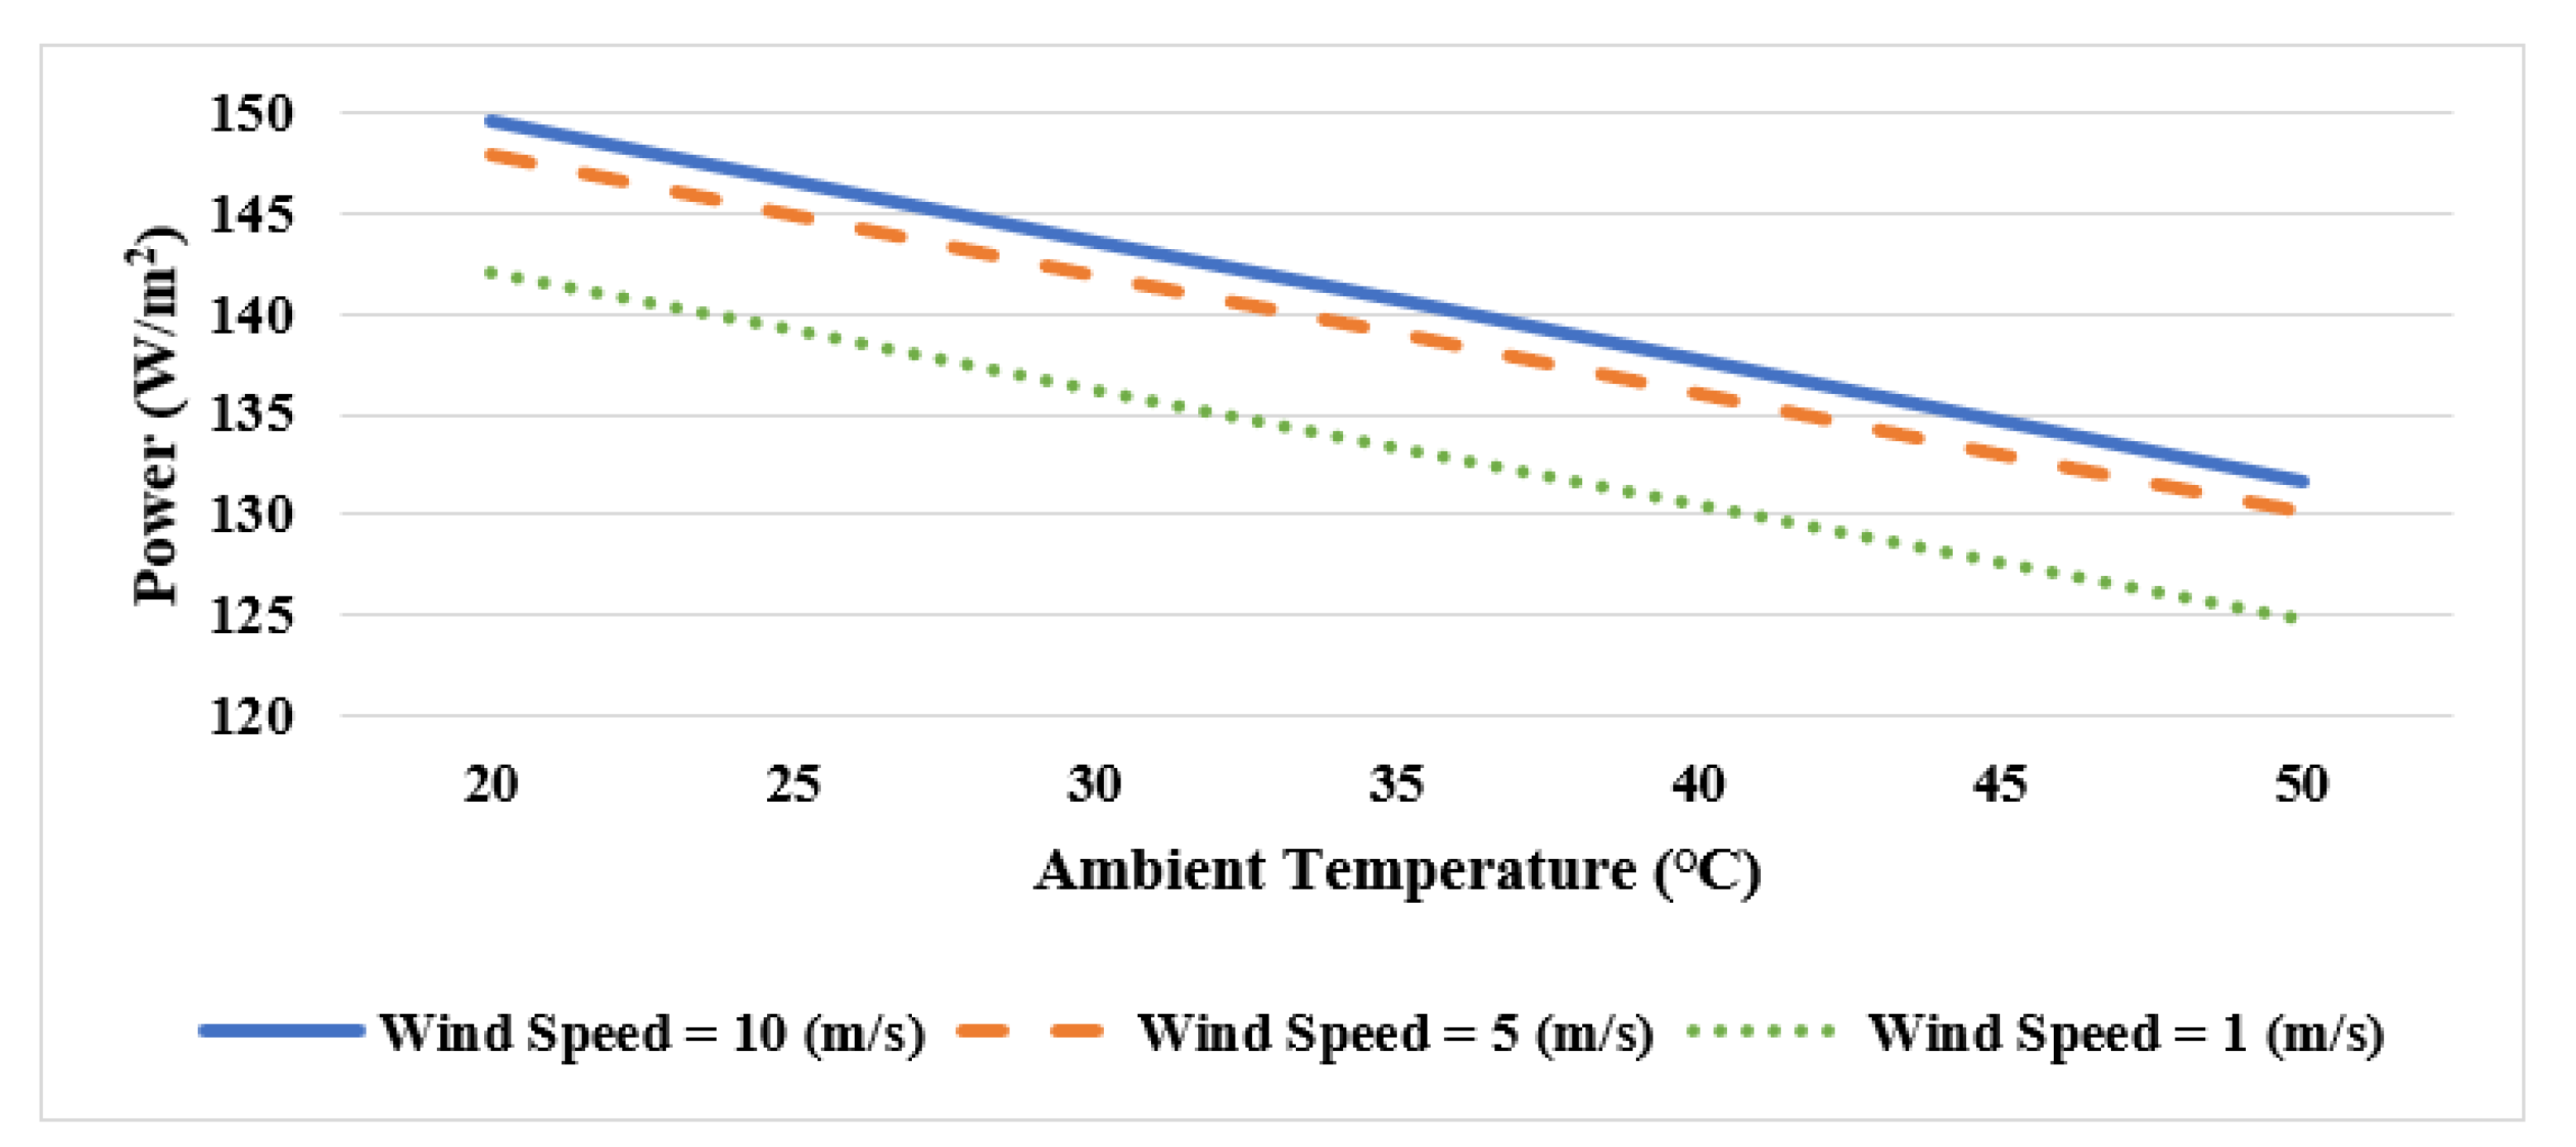
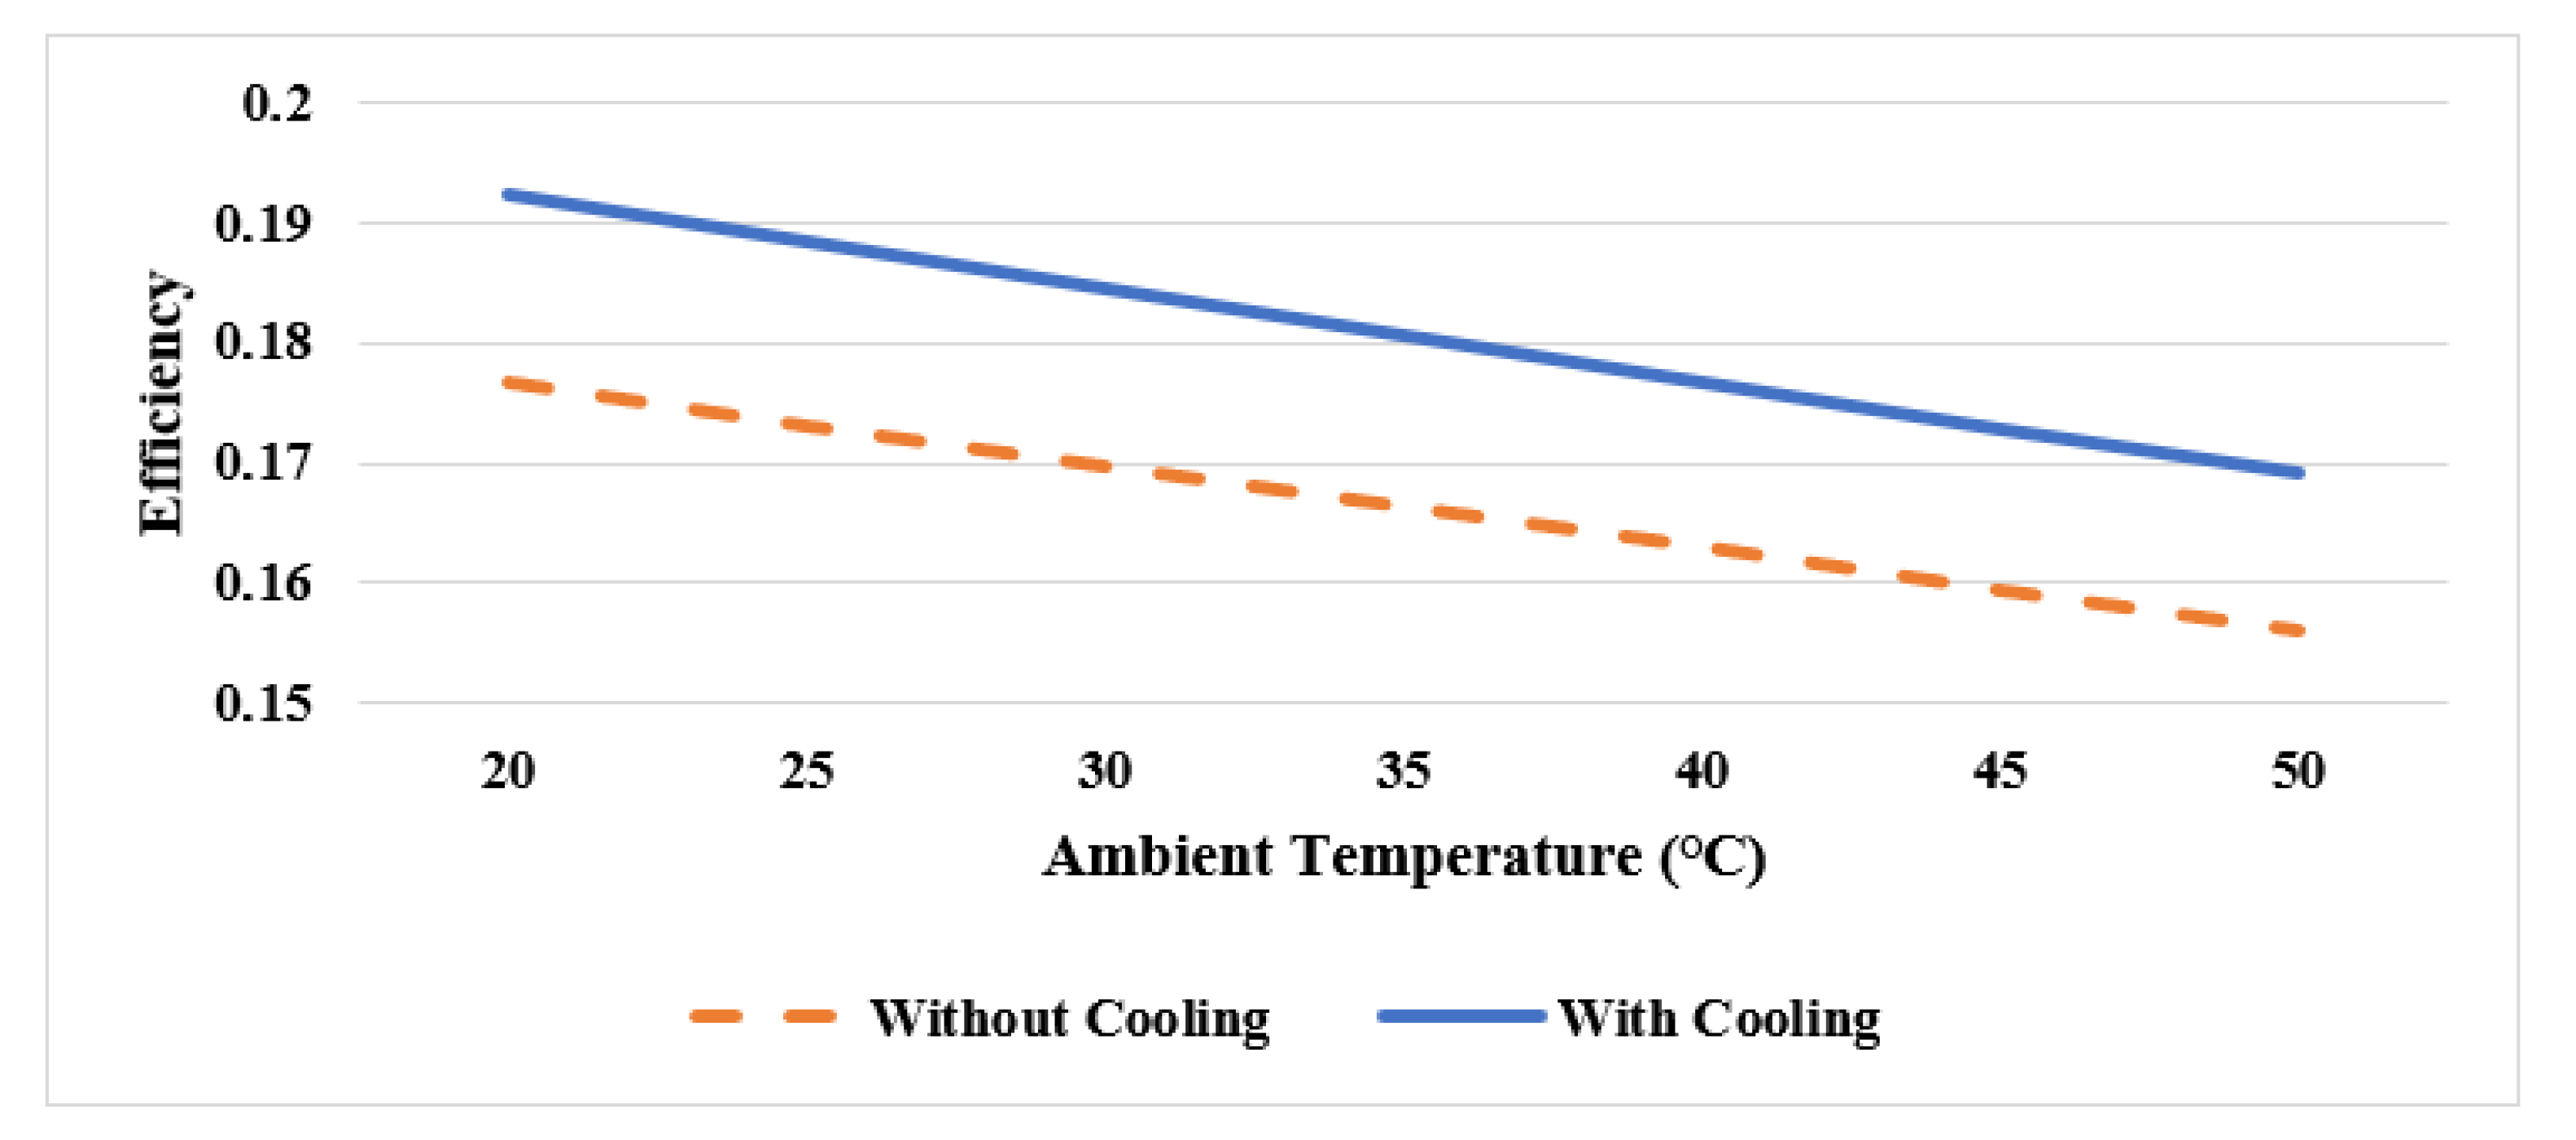
5.3. Impact of Ambient Temperature on Solar Panel Temperature

Figure 6 depicts the impact of ambient temperature, for wind speed [34] (Singal, Saini et al.) = 1 m/s and irradiance (Singal, Saini et al.) = 800 W/m2, on the solar panel temperature with and without heat sink for fin lengths of 3 cm, 7 cm, and 10 cm. The maximum power and the efficiency of analyzed PV module at STC is 400 W. It can be seen that an increase of the ambient temperature from 20 °C to 50 °C has contributed to raising the temperature of the solar panel from 57 °C to 82 °C without the cooling system, which means that the solar panel operates above the safe temperature at such high levels of ambient temperatures. However, the use of the cooling system has significantly reduced the solar panel temperature, and the reduction increased as the length of fins increased. For T∞ = 50 °C, the solar panel temperature was reduced by 10.1 °C, 16.5 °C, and 19 °C for fin lengths of 3 cm, 7 cm, and 10 cm, respectively. In contrast, the thickness of fins was found to have a trivial impact on the solar panel temperature as illustrated in Figure 7.
Figure 8 depicts the effect of the ambient temperature on the power of solar panels with and without a cooling system. The power of solar panel decreases from 143 W/m2 to126 W/m2 and from 132 W/m2 to 116 W/m2 as the ambient temperature increases from 20 °C to 50 °C with and without a cooling system, respectively. In other words, using a heat sink increases the produced power by 8.3% and 8.6% at 20 °C and 50 °C, respectively.
The influence of ambient temperature on the solar panel power with cooling system at different wind speeds is presented in Figure 9. It can be noticed that the effect of ambient temperature on the solar panel power was mitigated with the rise of wind speed. The solar panel power decreased from 149 W/m2 to 132 W/m2 as the ambient temperature increased from 20 °C to 50 °C at a wind speed of 10 m/s. However, it decreased from 142 W/m2 to 124 W/m2 as the ambient temperature increased from 20 °C to 50 °C at a wind speed of 1 m/s.
The impact of ambient temperature on the solar panel efficiency with and without a cooling system is shown in Figure 10. It can be observed that the efficiency reduces with the increase of ambient temperature, while the use of cooling system enhanced the PV panel efficiency. Hence, the efficiency decreases from 19.2% to 16.9% (2.3%) by using the cooling system, while it decreased from 17.7% to 15.7% (1.9%) without using cooling system as the ambient temperature increased from 20 °C to 50 °C at a wind speed of 1 m/s. This implies that, when the cooling system was used, the solar panel efficiency increased by 8.5% and 7.6% at 20 °C and 50 °C, respectively.

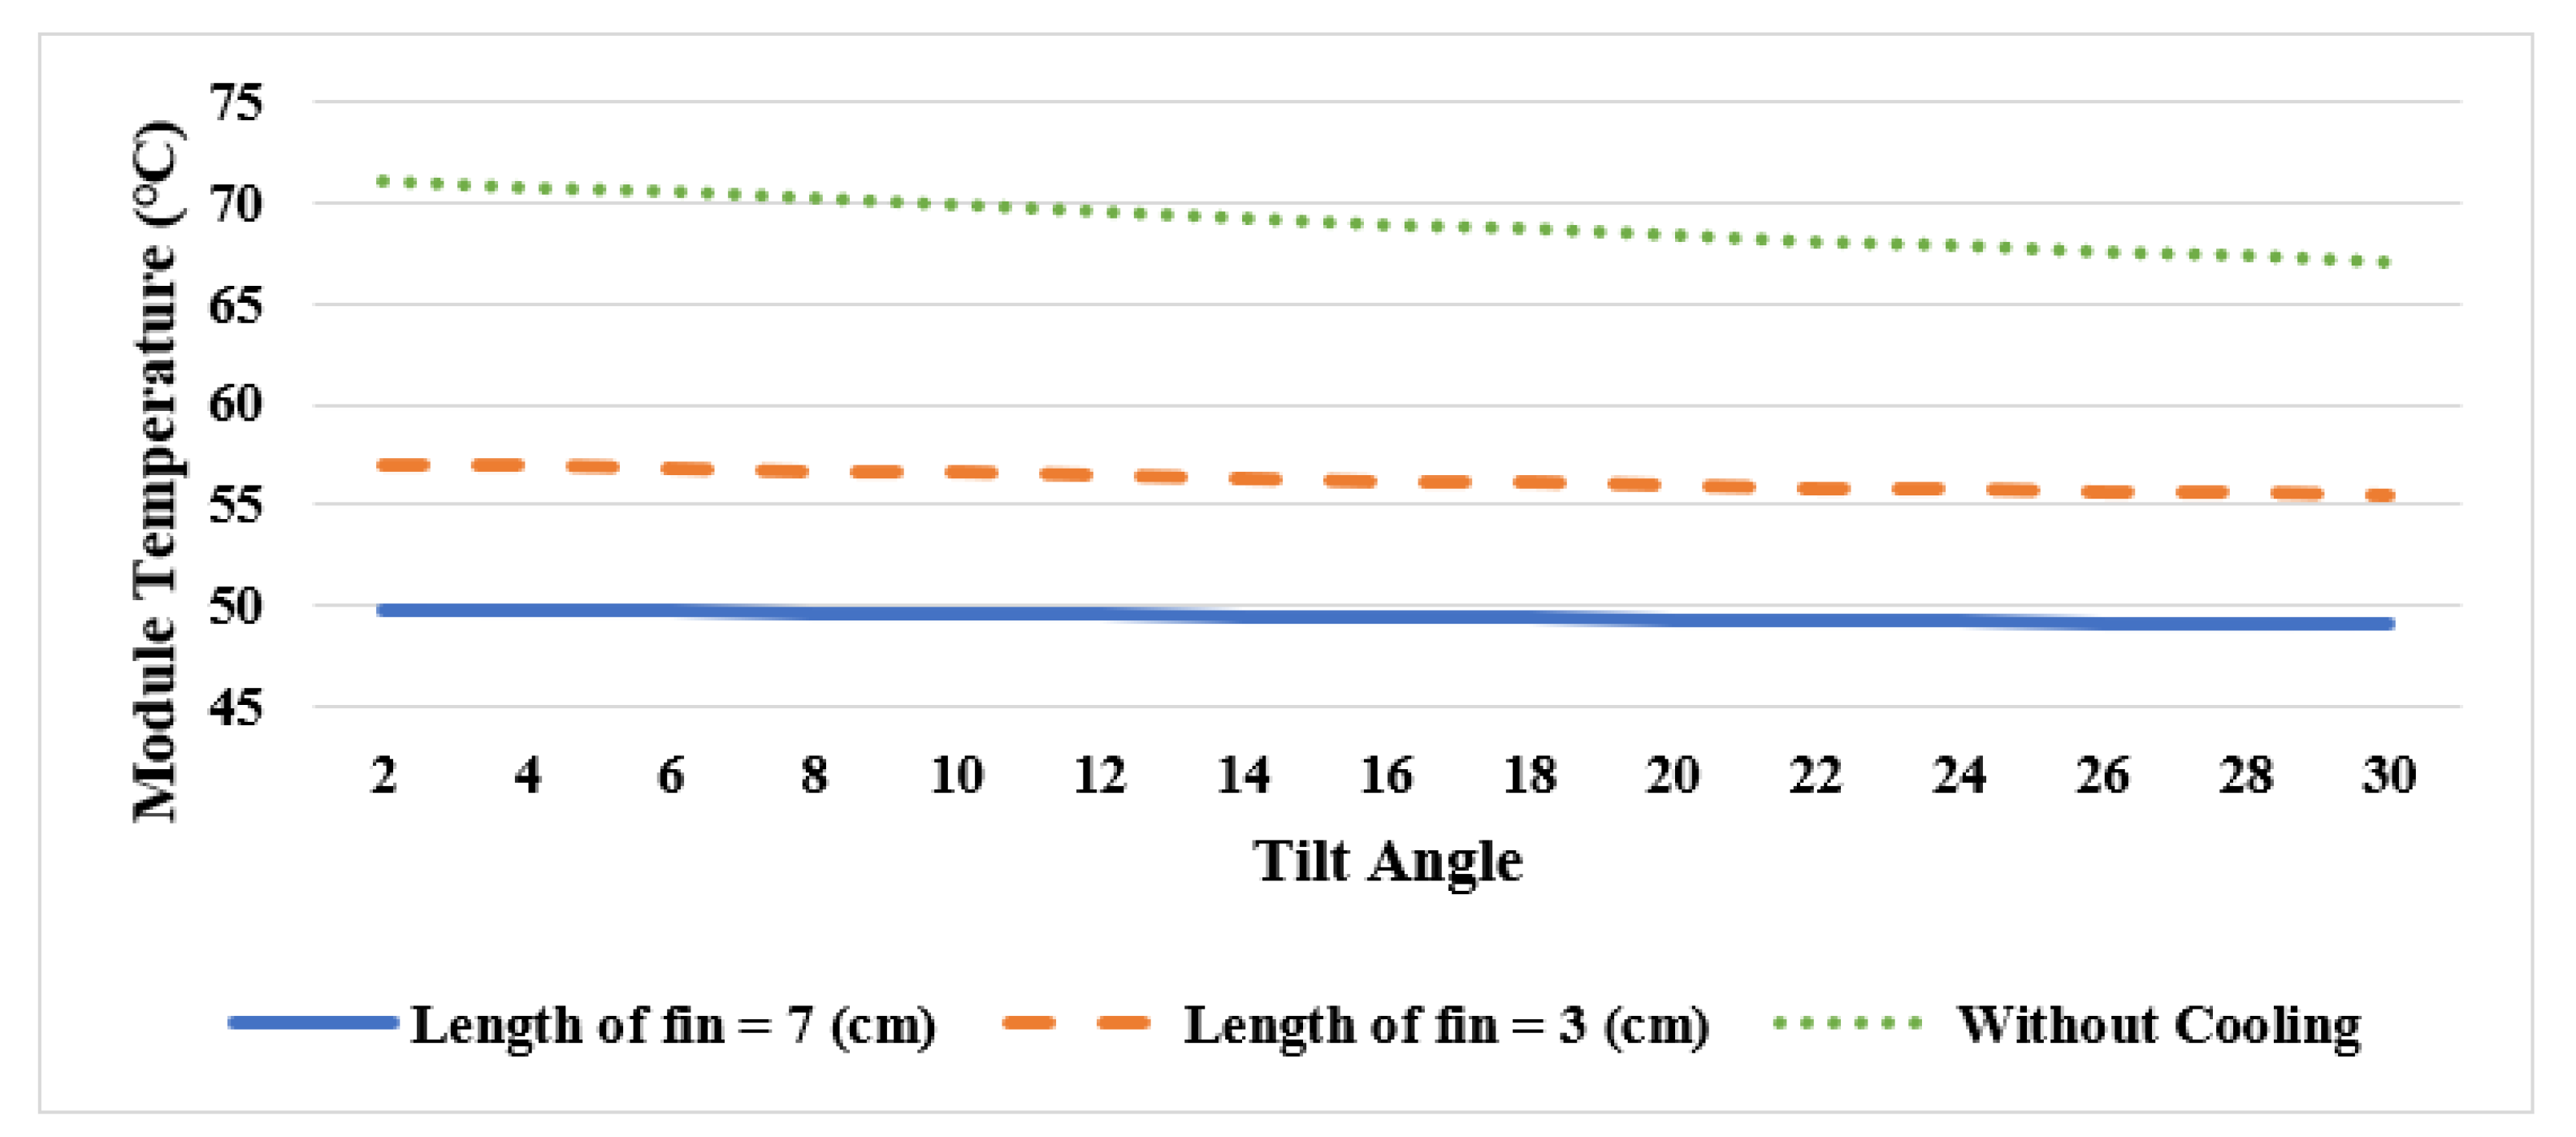
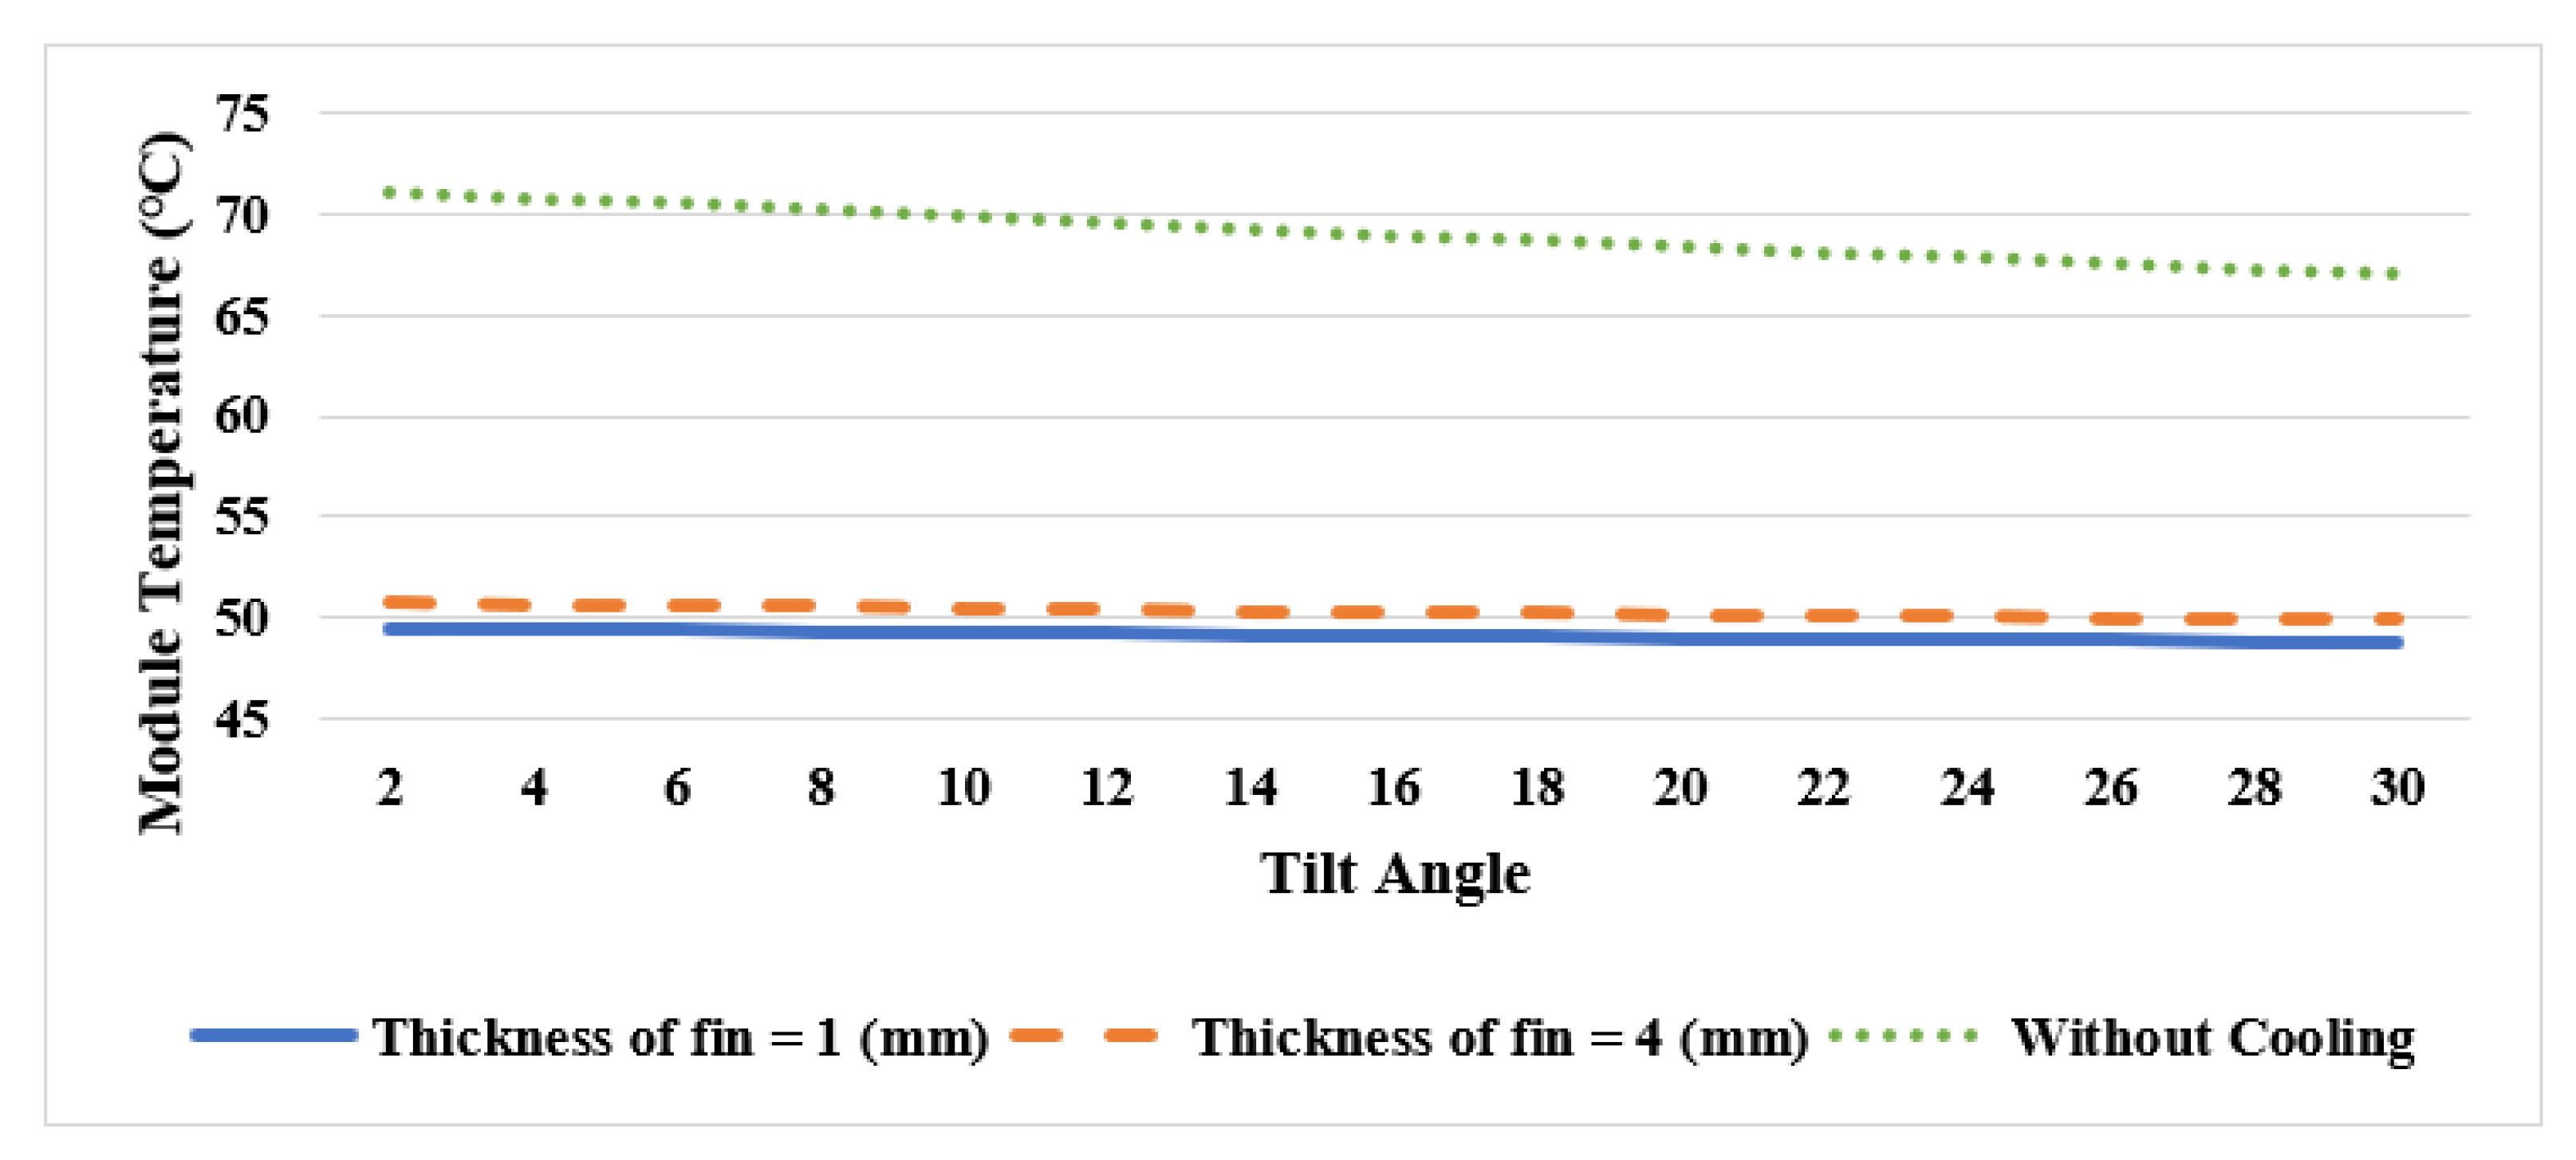
5.4. Impact of Tilt Angle on Panel Temperature for Different Fin Lengths and Thicknesses

Figure 11 shows the effect of the tilt angle on the solar panel temperature with and without heat sink for fin-lengths of 3 cm and 7 cm. It can be observed that the panel temperature slightly decreased with the increase of tilt angle, and the use of cooling system reduced the tilt angle effect. Furthermore, the increase of fin length increases the heat sink’s efficiency, causing further reduction in the panel temperature.
The impact of the tilt angle on the temperature of the solar panel without and with heat sink for two different thicknesses of fins (1 mm and 4 mm) is as shown in Figure 12. For no cooling system, the solar panel temperature decreased by 4 °C when the tilt angle increased from 2° to 30°. However, for the cooling system, the drop in solar panel temperature was less than 1 °C, which could be neglected. Furthermore, it can be noticed that decrease in the fin thickness slightly decreases the solar panel temperature.

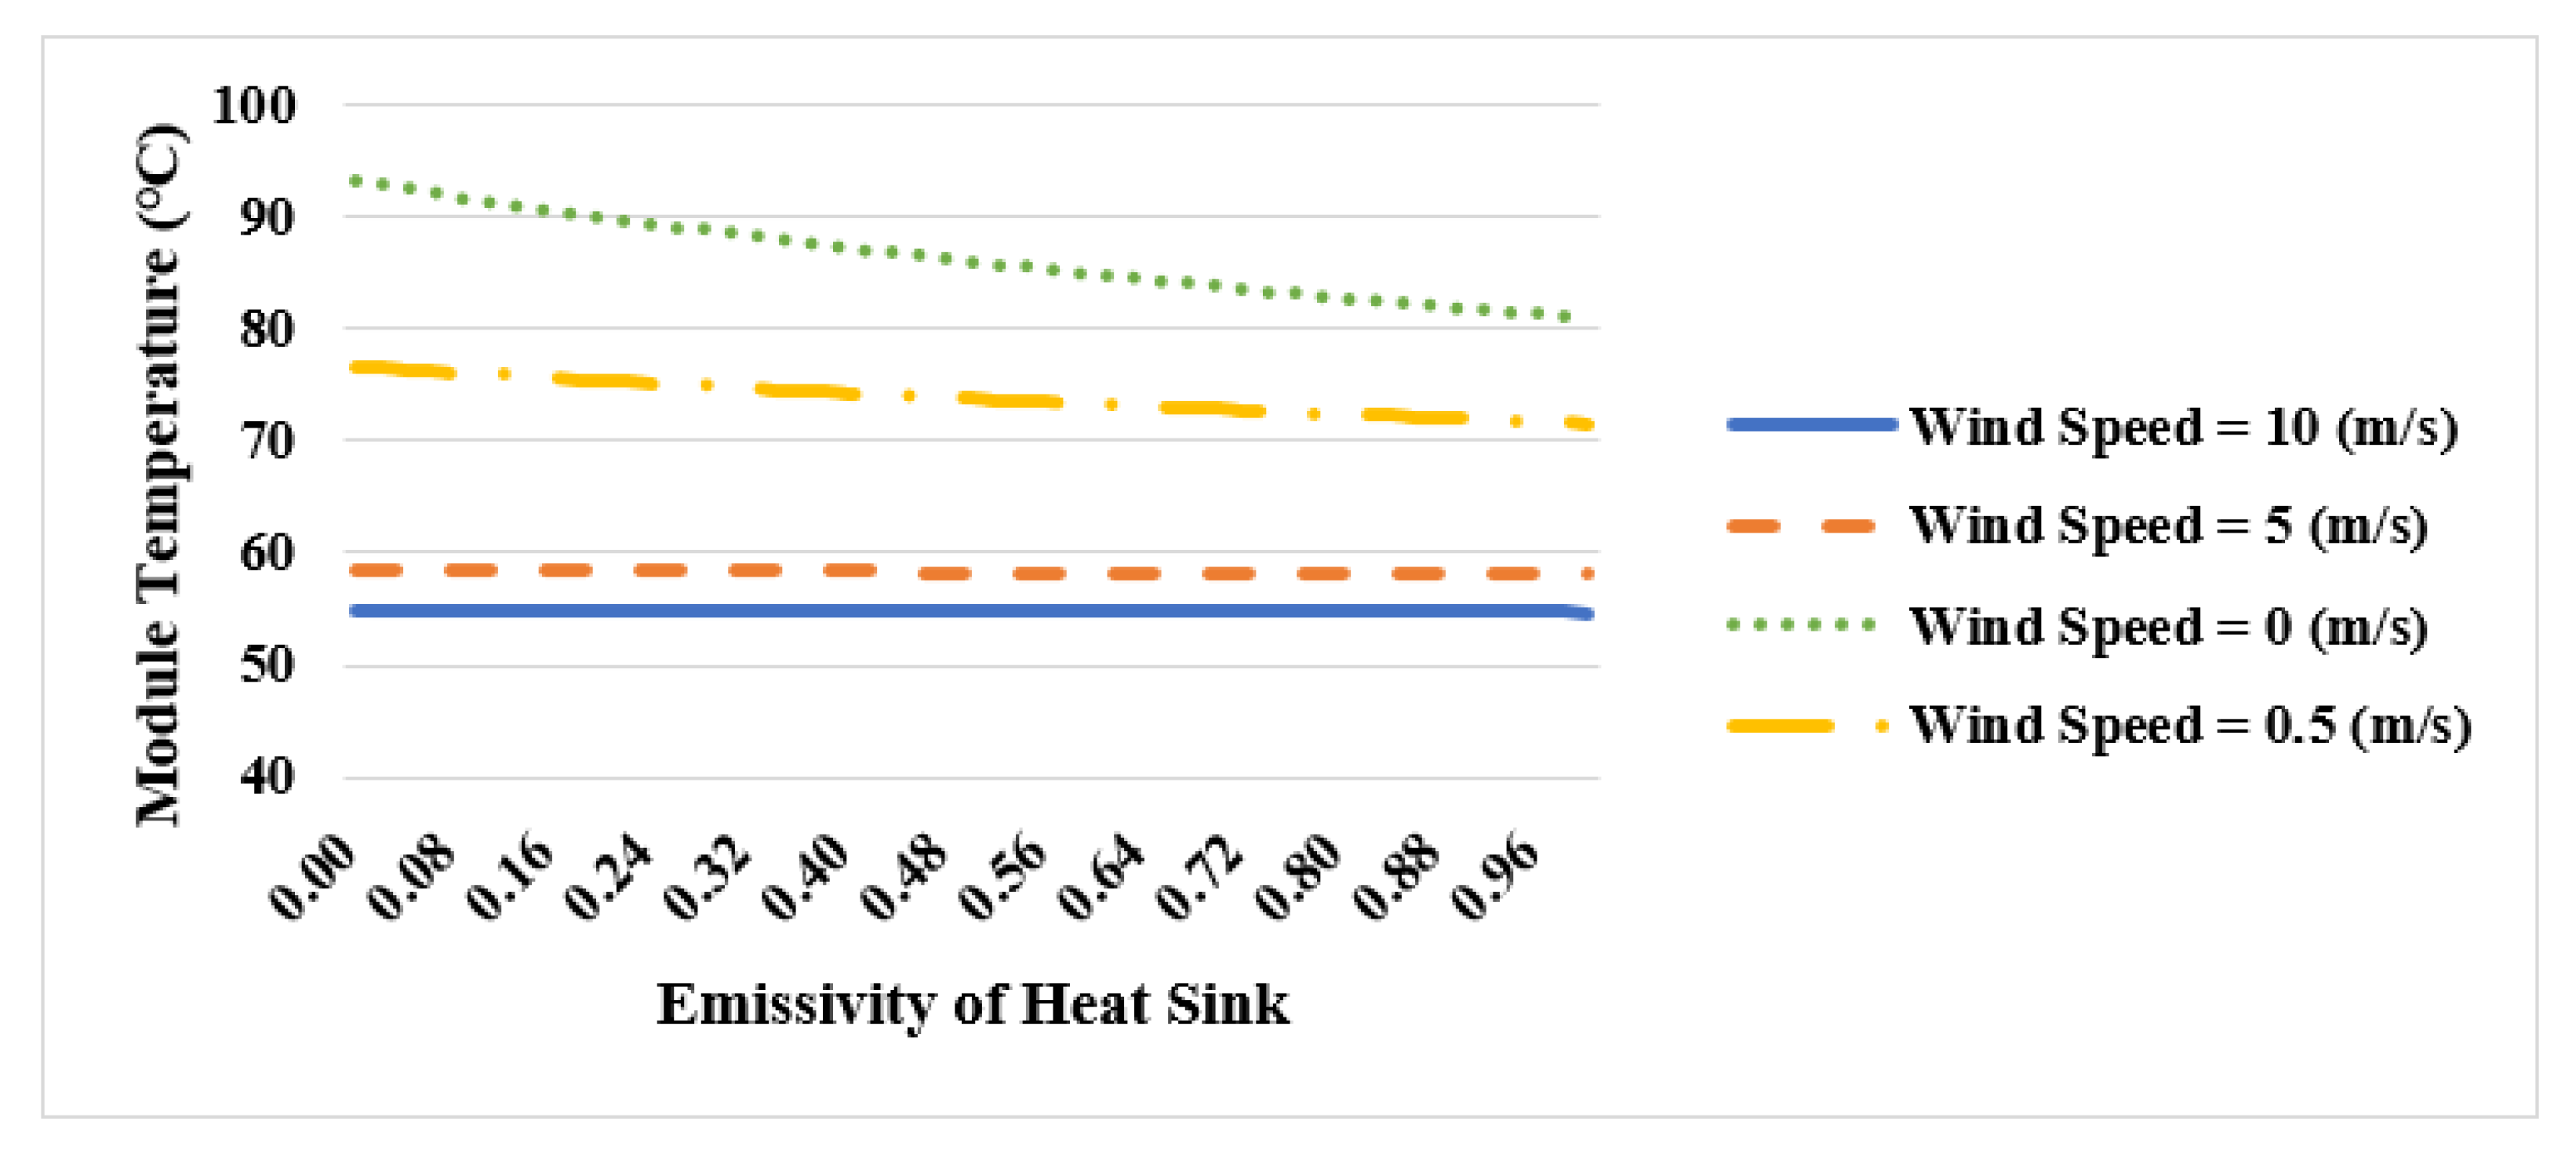
5.5. Effect of Emissivity on Solar Panel Temperature at Different wind Speeds

Figure 13 depicts the impact of emissivity of the heat sink surface on the solar panel temperature when the ambient temperature was 50 °C, at wind speeds of 0 m/s (pure free convection), 0.5 m/s (dominant free convection), 5 m/s (dominant forced convection), and 10 m/s (pure forced convection). For the wind speed of 0 m/s, the solar panel temperature decreased with the increase of emissivity, whilst for 5 m/s and 10 m/s, the panel temperature remained constant with the rise of emissivity (i.e., effect of surface radiation can be neglected when forced convection is dominant). Furthermore, the high wind speed significantly decreased the solar panel temperature.

5.6. Effect of Irradiance on Solar Panel Temperature at Different Emissivity Values

Figure 14 shows the effect of irradiance on solar panel temperature for three different emissivity values, under pure free convection and T∞ = 50 °C. The solar panel temperature increased significantly with the rise of irradiance whereas the rise of emissivity suppressed this increment. For an emissivity of 1, the solar panel temperature increased from 55 °C to 81 °C, and for an emissivity of 0, it increased from 59 °C to 93 °C when the irradiance increased from 200 W/m2 to 1000 W/m2.

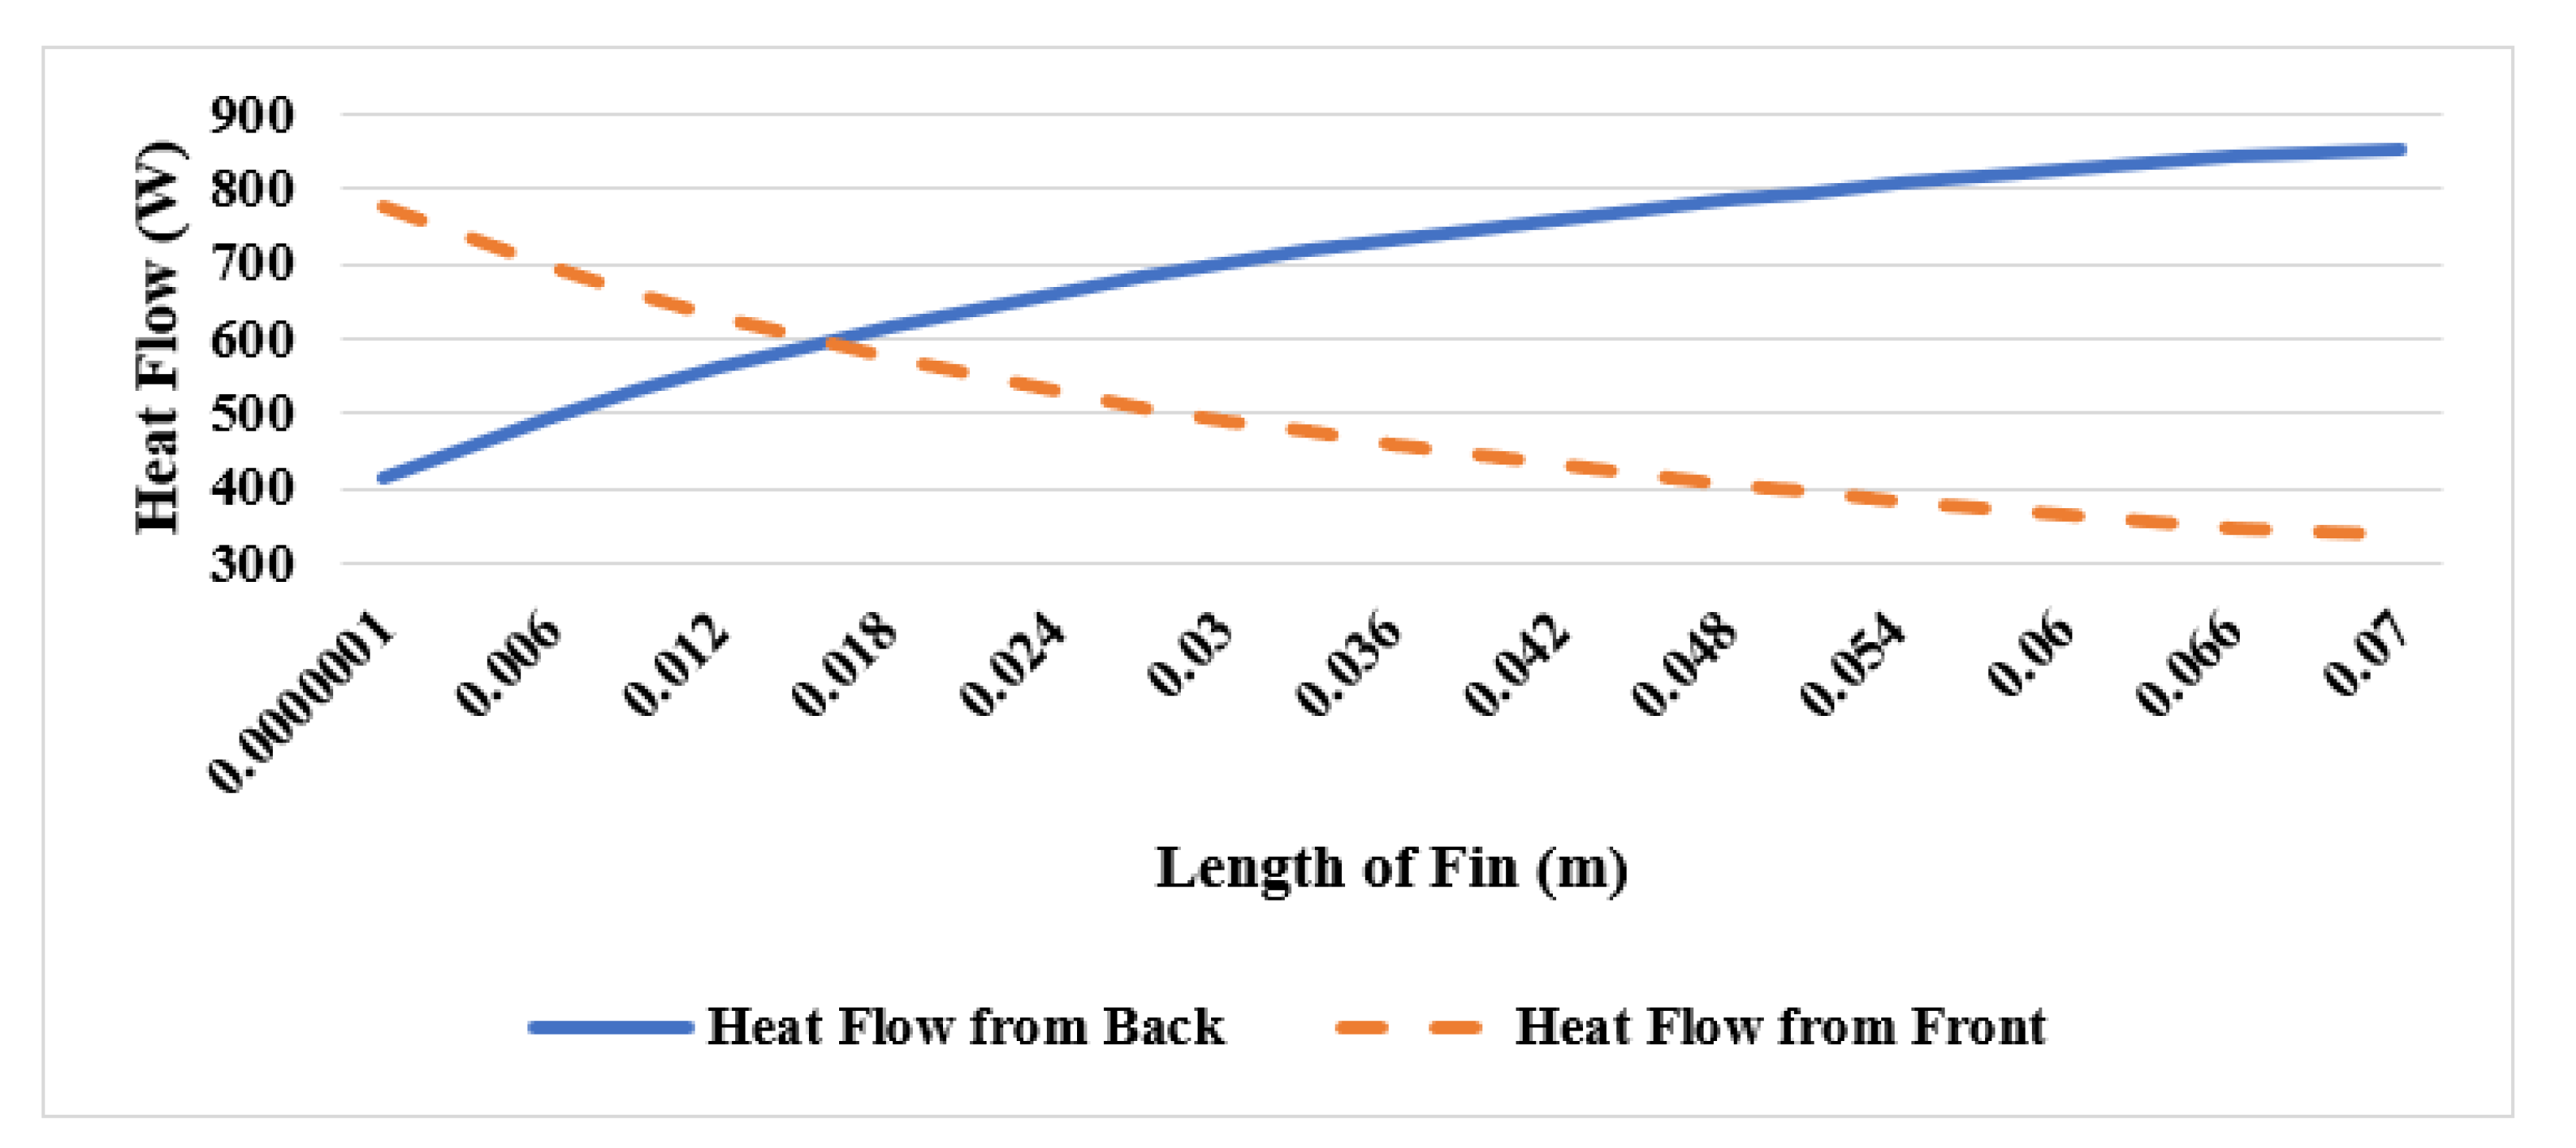
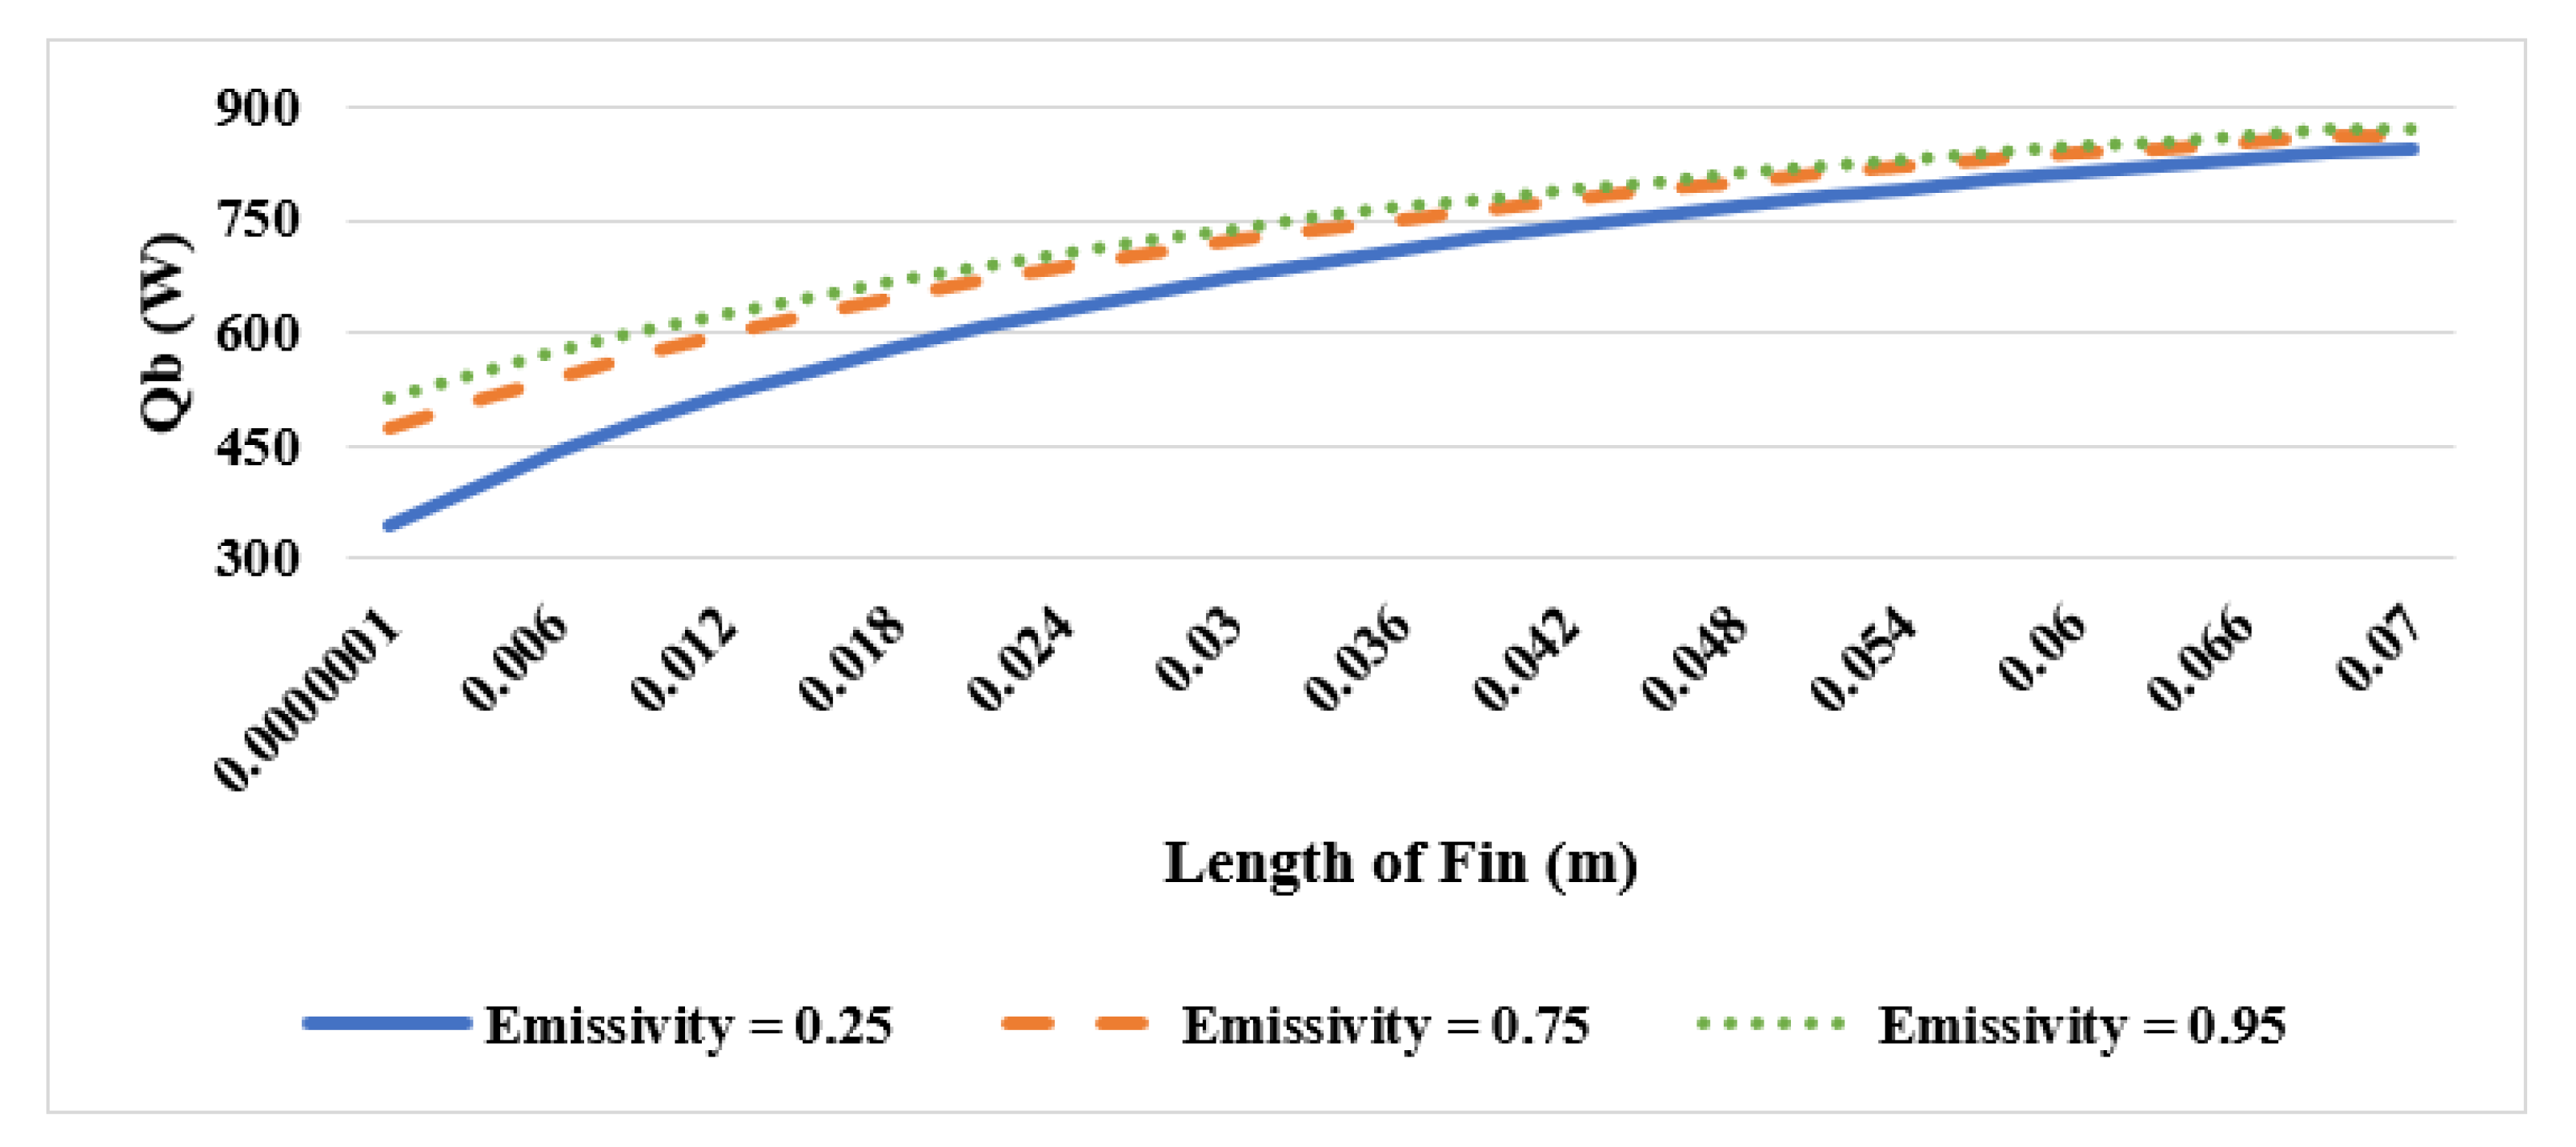
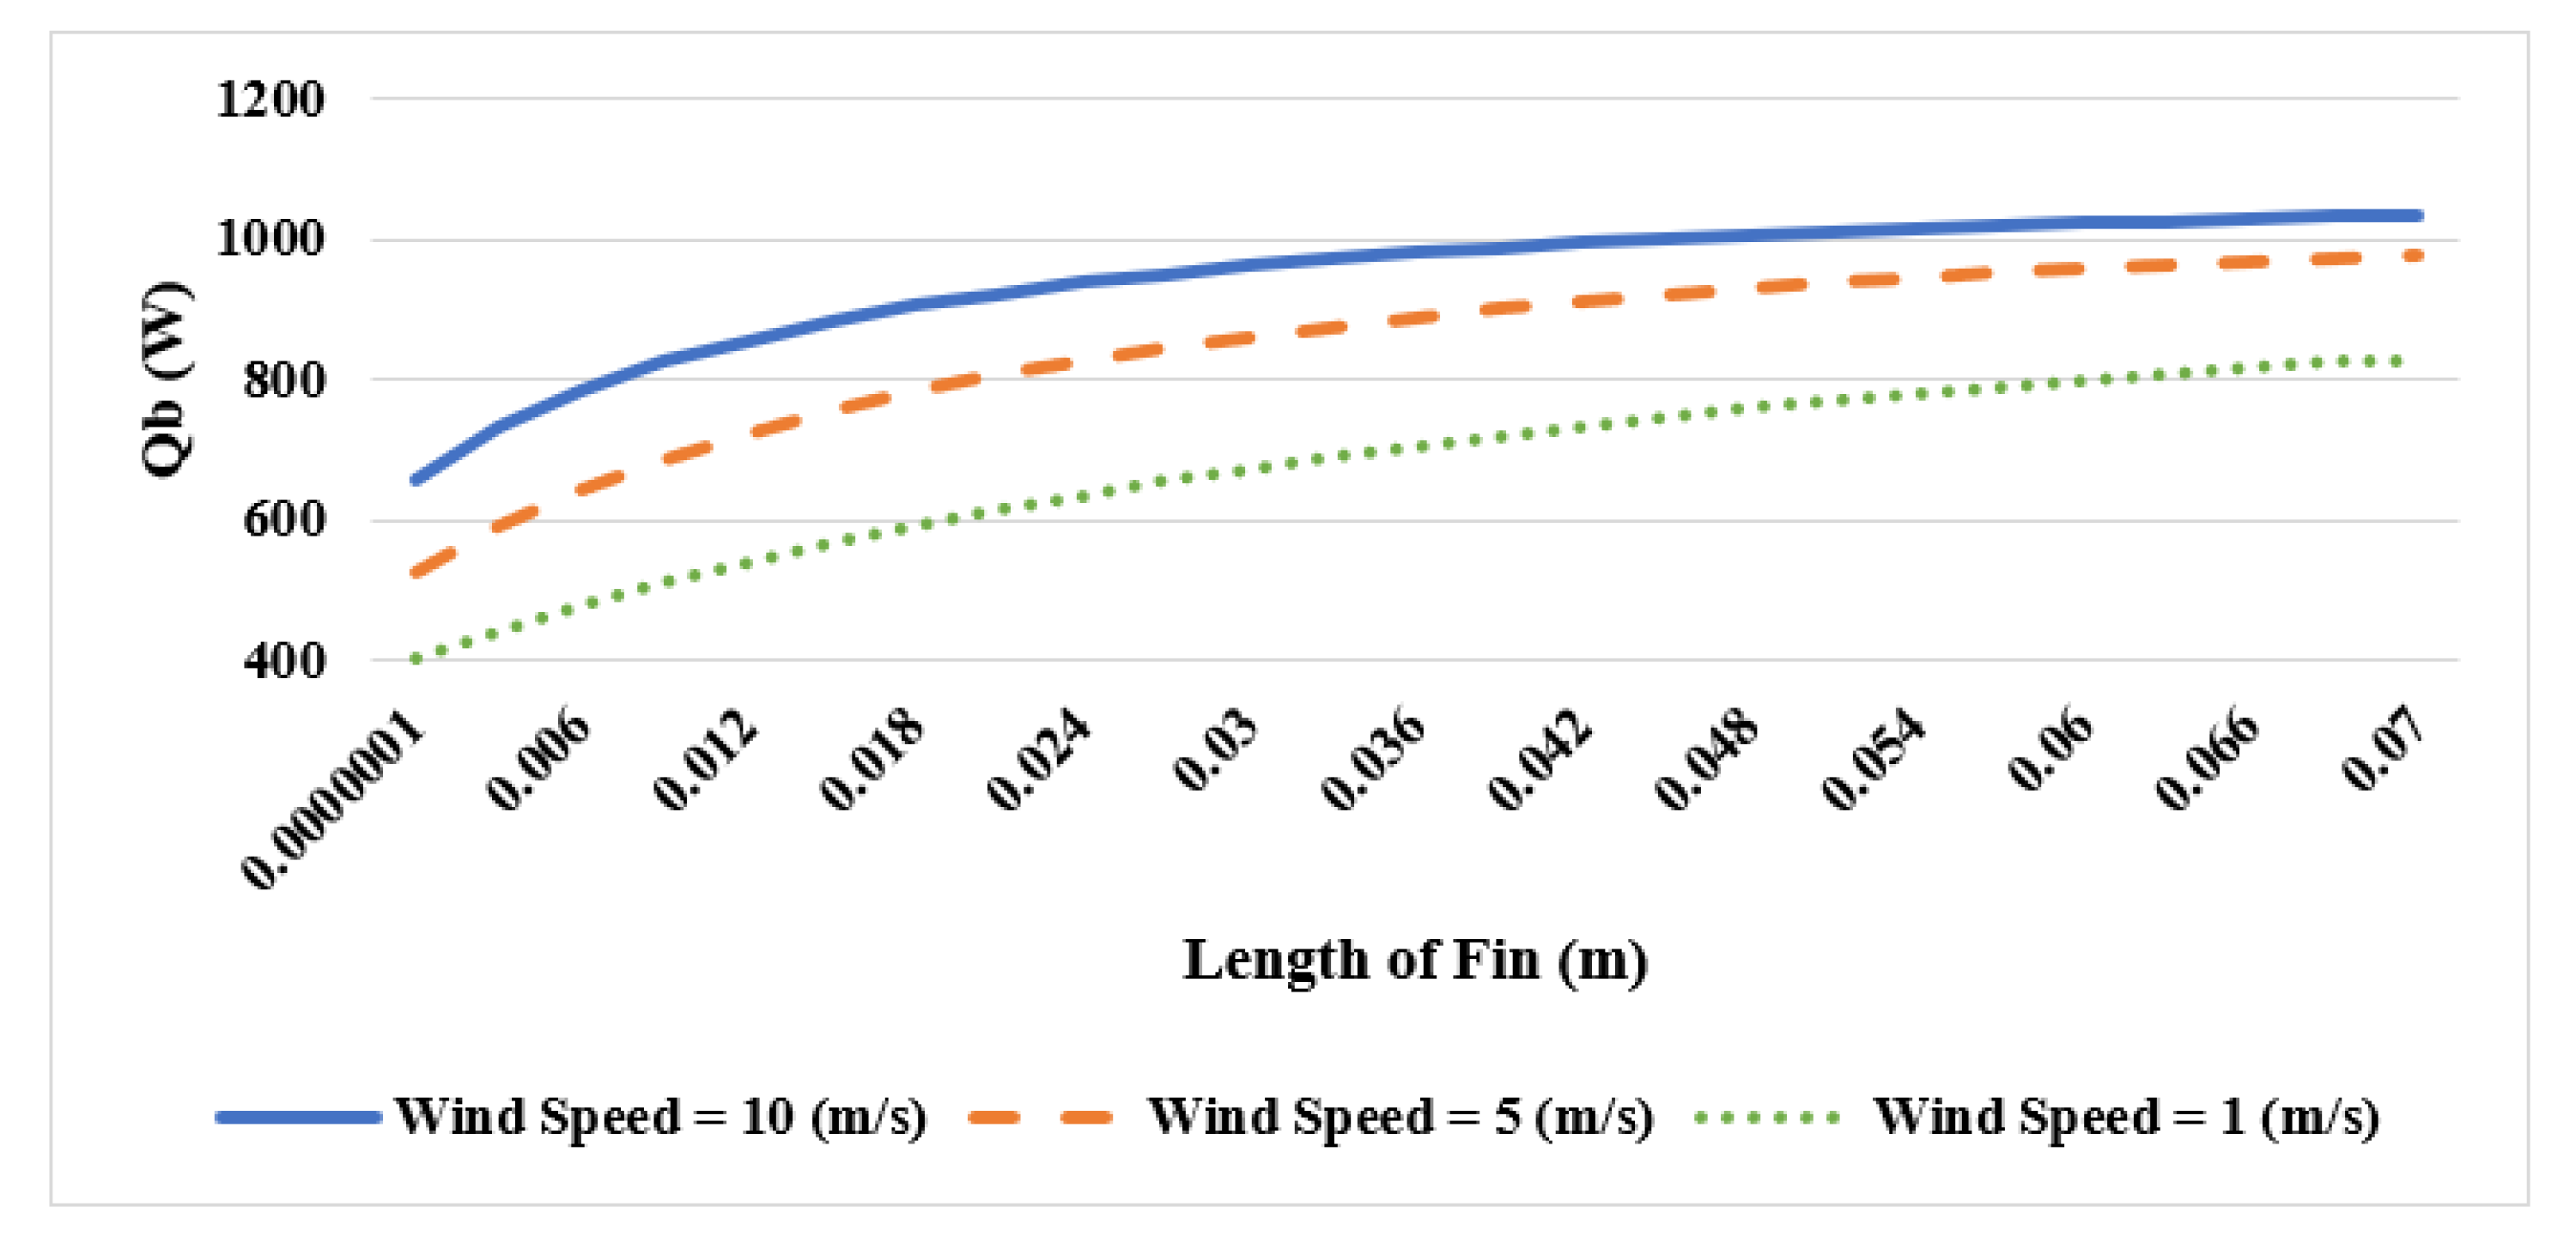
5.7. Effect of Fin Length on the Heat Flow Rejected from the Panel

Figure 15 presents the amount of heat rejected from the back and the front surfaces of the solar panel as a function of fin length. When there was no cooling, the heat rejected from the front surface was almost double that from the backside. However, when the heat sink was attached to the backside and as fin length rose, the heat rejected from the backside increased until it became more than double that from the front side at optimal fin length. To satisfy the conservation of energy, the heat rejected from the front decreased with the increase of fin length. Moreover, the equilibrium point was registered for a fin length of 0.02 m, which means that the heat rejected from the front side and backside were equal for a fin length of 0.02 m. Therefore, the heat rejected from the backside became larger than that from the front side with a fin length bigger than 0.02 m. The temperatures of different layers as function of fin length are shown in Figure 16; the temperature difference between solar cell and front glass was higher when no cooling system was employed.
The impact of fin length on the heat rejected from the backside of the solar panel for different emissivity values is illustrated in Figure 17. It can be noticed that the backside heat rejection increased with the increase of fin length, and the high emissivity has increased the backside heat rejection. For an emissivity of 0.95, the heat rejection increased from 520 W to 820 W, and it increased from 380 W to 800 W for an emissivity of 0.25 as the fin length increased from 0.0001 m to 0.07 m.
Figure 18 illustrates the impact of fin length on the backside heat rejection for three different wind speeds. The heat rejection increased with the raise of fin length, and the high wind speed accelerated the heat rejection. The heat transfer increased from 420 W to 820 W at a wind speed of 1 m/s and it increased from 650 W to 1020 W for a wind speed of 10 m/s as the fin length increased from 0.0001 m to 0.07 m.

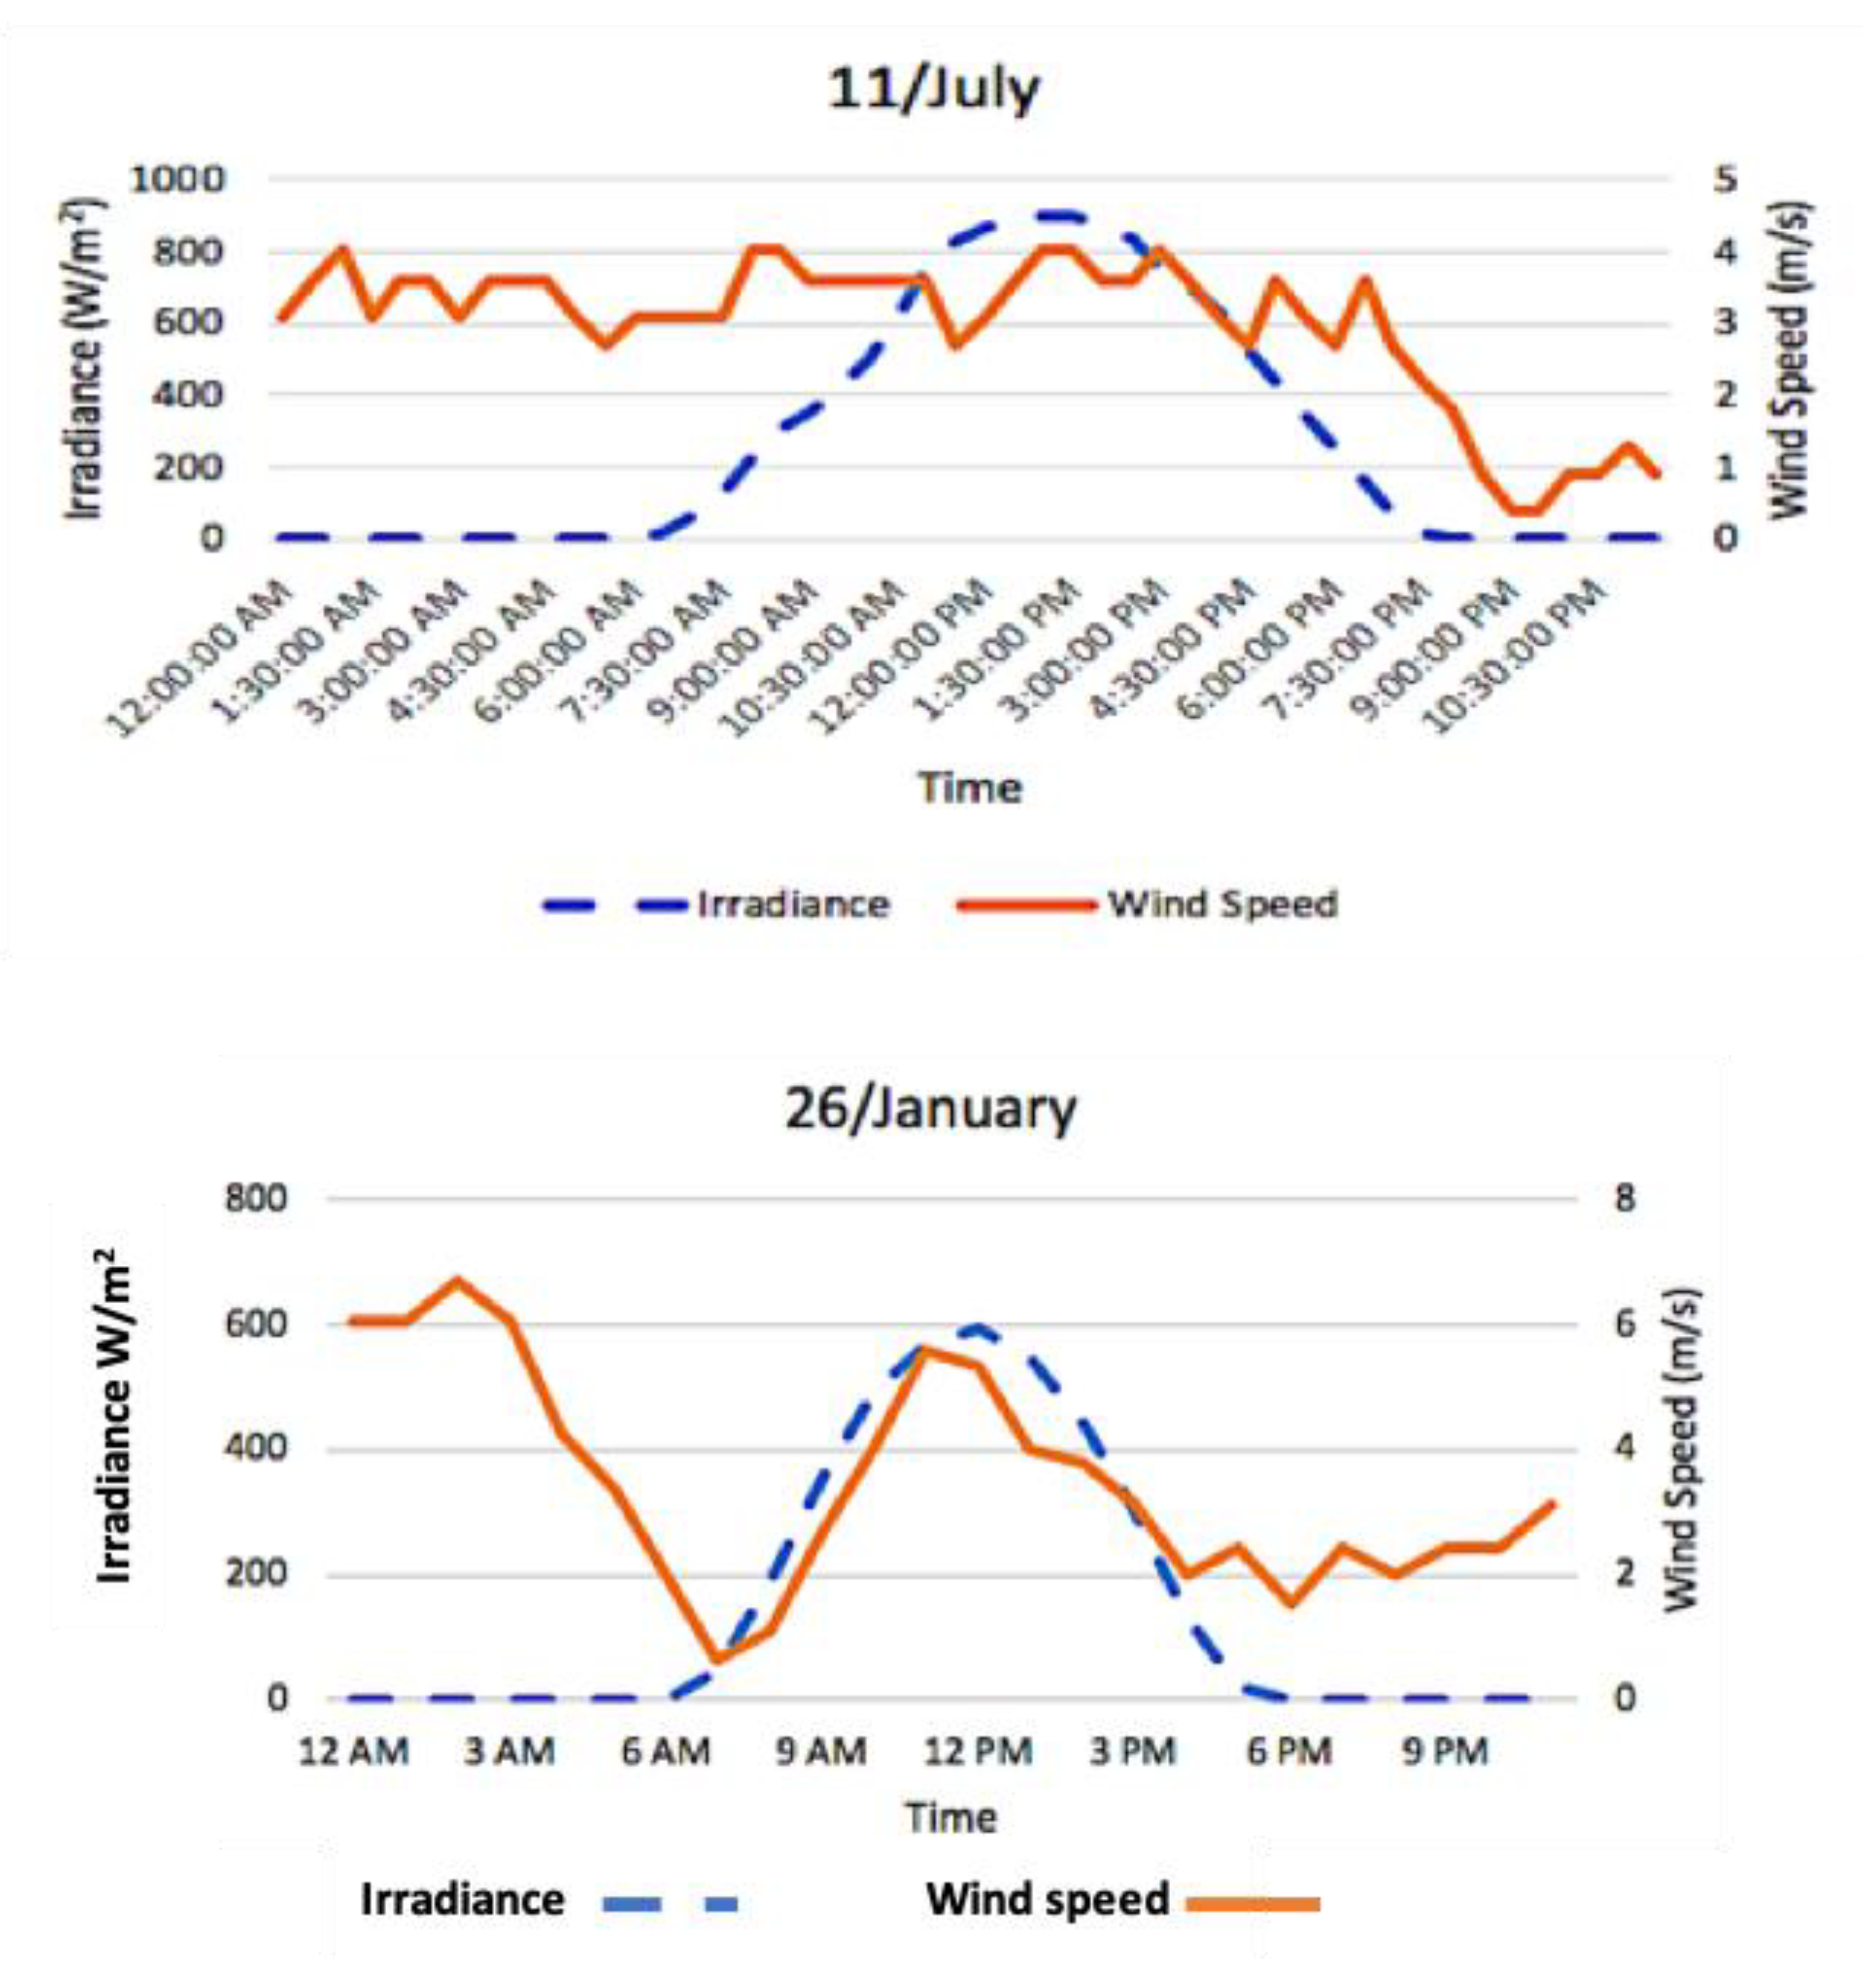
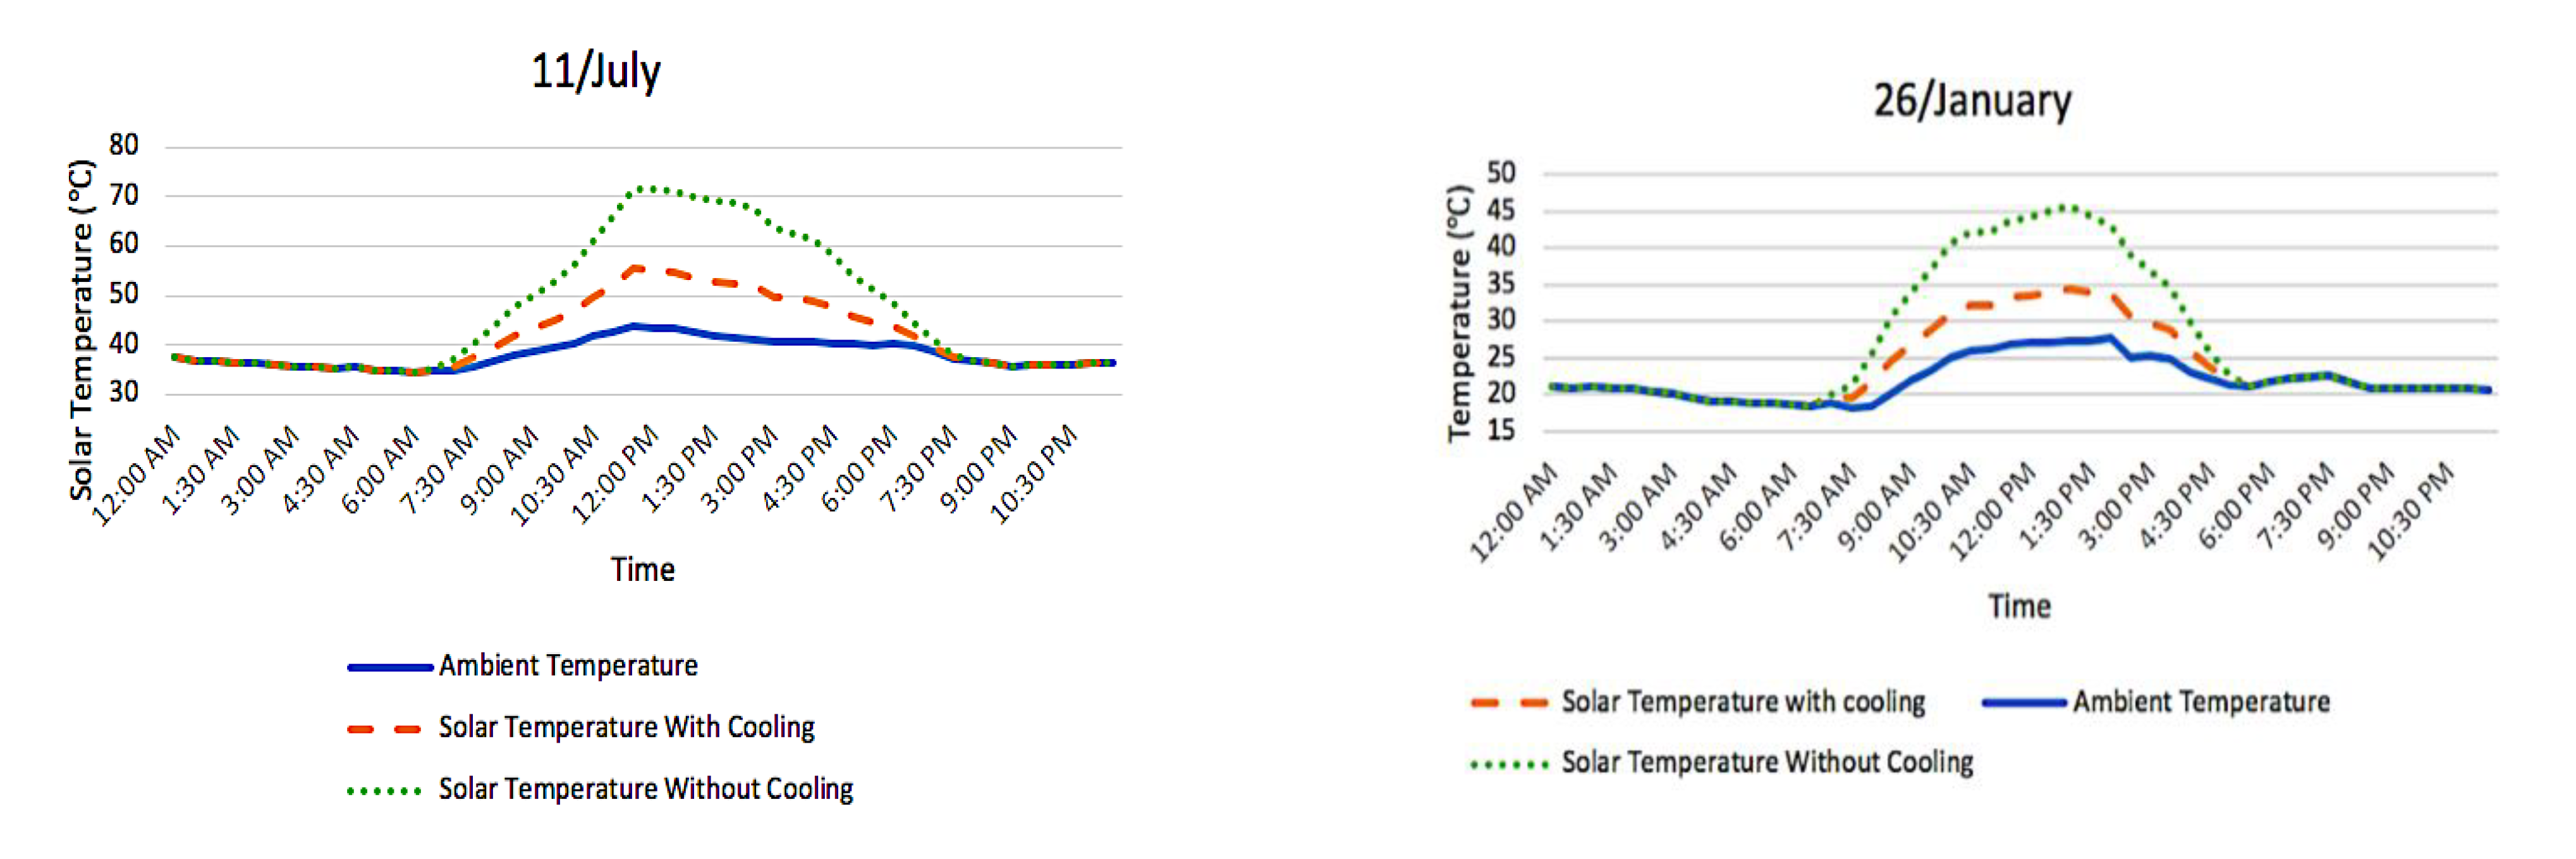
6. Case Study: Dammam City

An hourly collection of wind speed, solar radiation, and ambient temperature of Dammam city situated in the Eastern province of the Kingdom of Saudi Arabia was conducted during 2019. A comparison between the recorded values of wind speed and irradiance between summer (July) and winter (January) is presented in Figure 19. The highest and the lowest temperature recorded in Dammam in 2019 were on 11 July and 26 January, respectively. It can be noticed that during summer, the solar irradiance starts to rise at 6:00 a.m., reaches its maximum of 900 W/m2 at noon, and decreases thereafter to reach zero at 8:00 p.m. A similar trend is shown during winter except that the peak solar irradiance is 600 W/m2 at noon. In summer, the wind speed fluctuates between 2.5 m/s and 4 m/s from 12:00 a.m. till 8:00 p.m. and then it decreases to reach its minimum at 9:00 p.m.; during winter, it fluctuates between 0.8 m/s and 6.5 m/s.
The temperatures of two solar panels with and without cooling system under real conditions of Dammam city during summer and winter seasons were calculated by using the developed model. The trends of variation in panel temperature with and without cooling system for a typical day during summer and winter are illustrated in Figure 20. The maximum ambient temperatures in summer and winter were 41 °C and 26 °C, respectively. It can be observed that the maximum solar panel temperature without using cooling system was 71 °C in the summer, while it was 45 °C in the winter. However, with the cooling system, the peak panel temperatures were brought down to 58 °C and 35 °C in summer and winter, respectively.
The effect of passive cooling on the PV power output during summer and winter seasons in Dammam city is shown in Figure 21. During summer, by using the cooling system, the generated power starts rising from 6:00 a.m. and reaches a maximum of 160 W/m2 at noon, while it reaches a maximum of 140 W/m2 at noon without using the cooling system. However, during winter, the generated power starts rising from 7:00 a.m. and reaches a maximum of 110 W/m2 at noon by using a cooling system while it reaches a maximum of 100 W/m2 at noon without using cooling system. It can be concluded that the passive cooling has contributed to rise the solar panel power by 8.7%, 6.5% during summer and winter respectively.

7. Conclusions

The presented research work has focused on developing an analytical model and optimization of plate heat sink for passive cooling of a PV panel to improve its efficiency and life span. An analytical model was developed by using inputs such as length and width of solar panel, length of heat sink fin, thickness of heat sink fin, wind speed, and ambient temperature. The model was successfully validated by using real data from the literature. Furthermore, the optimal length of fins required for safe operation of solar panel in a harsh desert environment was also investigated using worst environmental conditions. In addition, a parametric study was also conducted using the presented analytical model to analyze the effects of various parameters on solar panel temperature, efficiency, and power. The model was also employed to investigate the impact of the proposed cooling system on PV panel temperature and power output under real-world environmental conditions of Dammam city in both summer and winter. The main findings from the presented research work are summarized below.
  • Without cooling system, the majority of heat absorbed on the PV panel is rejected from the front side of the panel, and the panel temperature can exceed 90 °C in the harsh climate.
  • With the proposed heat sink cooling with optimal fin length, the heat rejected from the backside is doubled, and the solar panel temperature cannot exceed 80 °C even at the worst possible weather conditions.
  • At low values of wind velocity (dominant free convection), the surface radiation from the back surface is significant and can reduce the panel temperature by 12 °C. However, at high values of wind speed (forced convection mode), surface radiation effects can be neglected.
A case study was conducted in Dammam city to collect real data during summer and winter, and the data were utilized in the present model to demonstrate the impact of the proposed passive cooling system on the solar panel temperature and power output. The results revealed the contribution of the cooling system in increasing the solar panel power by 8.7% during the summer season and by 6.5% during the winter season.

Author Contributions

Conceptualization, F.A.; methodology, F.A.; software, F.A., M.A. (Mohammed AlZahrani) and M.A. (Mohammed Aboulebdeh); validation, G.A., F.A., M.A. (Mohammed AlZahrani) and M.A. (Mohammed Aboulebdeh); formal analysis, G.A.; investigation, F.A.; resources, M.A. (Mohammed AlZahrani) and M.A. (Mohammed Aboulebdeh); data curation, M.A. (Mohammed AlZahrani) and G.A.; writing—original draft preparation, G.A.; writing—review and editing, G.A.; visualization, F.A.; supervision, F.A.; project administration, F.A. All authors have read and agreed to the published version of the manuscript.

Funding

This research received no external funding.

Institutional Review Board Statement

Not applicable.

Informed Consent Statement

Not applicable.

Data Availability Statement

Not applicable.

Conflicts of Interest

The authors declare no conflict of interest.

References

  1. Fu, R.; Feldman, D.J.; Margolis, R.M. US Solar Photovoltaic System Cost Benchmark: Q1 2018; National Renewable Energy Laboratory (NREL): Golden, CO, USA, 2018. [Google Scholar]
  2. Taylor, M.; Ralon, P.; Ilas, A. The Power to Change: Solar and Wind cost Reduction Potential to 2025; International Renewable Energy Agency (IRENA): Abu Dhabi, United Arab Emirates, 2016. [Google Scholar]
  3. Mustafa, R.J.; Gomaa, M.R.; Al-Dhaifallah, M.; Rezk, A.H. Environmental Impacts on the Performance of Solar Photovoltaic Systems. Sustain. J. Rec. 2020, 12, 608. [Google Scholar] [CrossRef] [Green Version]
  4. Vidyanandan, K. An overview of factors affecting the performance of solar PV systems. Energy Scan 2017, 27, 2–8. [Google Scholar]
  5. Zhang, X.; Shen, J.; Xu, P.; Zhao, X.; Xu, Y. Socio-economic performance of a novel solar photovoltaic/loop-heat-pipe heat pump water heating system in three different climatic regions. Appl. Energy 2014, 135, 20–34. [Google Scholar] [CrossRef]
  6. U.S. Department of Energy. Solar Energy Technology Basics. 2013. Available online: https://www.energy.gov/eere/solar/articles/solar-energy-technology-basics (accessed on 18 January 2021).
  7. Mah, O. Fundamentals of Photovoltaic Materials. National Solar Power Research Institute. Inc. Calif. 1998, 12, 21–98. [Google Scholar]
  8. Mussard, M.; Amara, M. Performance of solar photovoltaic modules under arid climatic conditions: A review. Sol. Energy 2018, 174, 409–421. [Google Scholar] [CrossRef]
  9. Wu, S.; Xiong, C. Passive cooling technology for photovoltaic panels for domestic houses. Int. J. Low-Carbon Technol. 2014, 9, 118–126. [Google Scholar] [CrossRef] [Green Version]
  10. Bhattacharya, T.; Chakraborty, A.K.; Pal, K. Effects of Ambient Temperature and Wind Speed on Performance of Monocrystalline Solar Photovoltaic Module in Tripura, India. J. Sol. Energy 2014, 2014, 817078. [Google Scholar] [CrossRef] [Green Version]
  11. Razak, A.; Irwan, Y.; Leow, W.; Irwanto, M.; Safwati, I.; Zhafarina, M. Investigation of the Effect Temperature on Photovoltaic (PV) Panel Output Performance. Int. J. Adv. Sci. Eng. Inf. Technol. 2016, 6, 682. [Google Scholar] [CrossRef]
  12. Ritzen, M.; Vroon, Z.; Rovers, R.; Geurts, C. Comparative performance assessment of a non-ventilated and ventilated BIPV rooftop configurations in the Netherlands. Sol. Energy 2017, 146, 389–400. [Google Scholar] [CrossRef]
  13. Dhimish, M.; AlRashidi, A. Photovoltaic Degradation Rate Affected by Different Weather Conditions: A Case Study Based on PV Systems in the UK and Australia. Electronics 2020, 9, 650. [Google Scholar] [CrossRef] [Green Version]
  14. Koteswararao, B.; Radha, K.; Vijay, P.; Raja, R. Experimental Analysis of solar panel efficiency with different modes of cooling. Int. J. Eng. Technol. (IJET) 2016, 8, 1451–1456. [Google Scholar]
  15. Al Harbi, Y.; Eugenio, N.; Al Zahrani, S. Photovoltaic-thermal solar energy experiment in Saudi Arabia. Renew. Energy 1998, 15, 483–486. [Google Scholar] [CrossRef]
  16. Hasanuzzaman, M.; Malek, A.; Islam, M.; Pandey, A.; Rahim, N. Global advancement of cooling technologies for PV systems: A review. Sol. Energy 2016, 137, 25–45. [Google Scholar] [CrossRef]
  17. Mazón-Hernández, R.; García-Cascales, J.; Vera-García, F.; Káiser, A.; Zamora, B. Improving the electrical parameters of a photovoltaic panel by means of an induced or forced air stream. Int. J. Photoenergy 2013, 2013, 830968. [Google Scholar] [CrossRef]
  18. Özkul, F.B.; Kayabasi, E.; Çelık, E.; Kurt, H.; Arcaklioğlu, E. Investigating the effects of cooling options on photovoltaic panel efficiency: State of the art and future plan. In Proceedings of the 2018 International Conference on Photovoltaic Science and Technologies (PVCon), Ankara, Turkey, 4–6 July 2018; IEEE: Piscataway, NJ, USA, 2018. [Google Scholar]
  19. Ahmad, N.; Khandakar, A.; El-Tayeb, A.; Benhmed, K.; Iqbal, A.; Touati, F. Novel Design for Thermal Management of PV Cells in Harsh Environmental Conditions. Energies 2018, 11, 3231. [Google Scholar] [CrossRef] [Green Version]
  20. Devaraj, R.; Mageshwaran, G.; Gokulachandran, R.; Mani, R. Experimental investigation on a hybrid solar collector to predict safe operating condition. Int. J. Ambient. Energy 2017, 40, 467–469. [Google Scholar] [CrossRef]
  21. Luo, Q.; Li, P.; Cai, L.; Chen, X.; Yan, H.; Zhu, H.; Zhai, P.; Li, P.; Zhang, Q. Experimental investigation on the heat dissipation performance of flared-fin heat sinks for concentration photovoltaic modules. Appl. Therm. Eng. 2019, 157, 113666. [Google Scholar] [CrossRef]
  22. Grubišić-Čabo, F.; Nižetić, S.; Čoko, D.; Kragić, I.M.; Papadopoulos, A. Experimental investigation of the passive cooled free-standing photovoltaic panel with fixed aluminum fins on the backside surface. J. Clean. Prod. 2018, 176, 119–129. [Google Scholar] [CrossRef]
  23. Grubišić-Čabo, F.; Nižetić, S.; Kragić, I.M.; Čoko, D. Further progress in the research of fin-based passive cooling technique for the free-standing silicon photovoltaic panels. Int. J. Energy Res. 2019, 43, 3475–3495. [Google Scholar] [CrossRef]
  24. Hasan, I.A. Enhancement the Performance of PV Panel by Using Fins as Heat Sink. Eng. Technol. J. 2018, 36, 798–805. [Google Scholar]
  25. Elsafi, A.; Gandhidasan, P. Performance of a Photovoltaic or Thermal Double-Pass Solar Air Heater with Different Fin Configurations. J. Clean Energy Technol. 2015, 3, 28–33. [Google Scholar] [CrossRef] [Green Version]
  26. Nehari, T.; Benlakam, M.; Nehari, D. Effect of the Fins Length for the Passive Cooling of the Photovoltaic Panels. Period. Polytech. Mech. Eng. 2016, 60, 89–95. [Google Scholar] [CrossRef] [Green Version]
  27. Popovici, C.G.; Hudişteanu, S.V.; Mateescu, T.D.; Cherecheş, N.-C. Efficiency Improvement of Photovoltaic Panels by Using Air Cooled Heat Sinks. Energy Procedia 2016, 85, 425–432. [Google Scholar] [CrossRef] [Green Version]
  28. Jakhrani, A.; Othman, A.; Rigit, A.; Samo, S. Comparison of solar photovoltaic module temperature models. World Appl. Sci. J. 2011, 14, 1–8. [Google Scholar]
  29. Ciulla, G.; Brano, V.L.; Moreci, E. Forecasting the Cell Temperature of PV Modules with an Adaptive System. Int. J. Photoenergy 2013, 2013, 192854. [Google Scholar] [CrossRef]
  30. Olukan, T.A.; Emziane, M. A Comparative Analysis of PV Module Temperature Models. Energy Procedia 2014, 62, 694–703. [Google Scholar] [CrossRef] [Green Version]
  31. Dubey, S.; Sarvaiya, J.N.; Seshadri, B. Temperature Dependent Photovoltaic (PV) Efficiency and Its Effect on PV Production in the World—A Review. Energy Procedia 2013, 33, 311–321. [Google Scholar] [CrossRef] [Green Version]
  32. Evans, D.; Florschuetz, L. Cost studies on terrestrial photovoltaic power systems with sunlight concentration. Sol. Energy 1977, 19, 255–262. [Google Scholar] [CrossRef]
  33. Weiss, L.; Amara, M.; Ménézo, C. Impact of radiative-heat transfer on photovoltaic module temperature. Prog. Photovolt. Res. Appl. 2016, 24, 12–27. [Google Scholar] [CrossRef]
  34. Singal, S.; Saini, R.; Raghuvanshi, C. Analysis for cost estimation of low head run-of-river small hydropower schemes. Energy Sustain. Dev. 2010, 14, 117–126. [Google Scholar] [CrossRef]
  35. Kaplani, E.; Kaplanis, S. Thermal modelling and experimental assessment of the dependence of PV module temperature on wind velocity and direction, module orientation and inclination. Sol. Energy 2014, 107, 443–460. [Google Scholar] [CrossRef] [Green Version]
  36. Álvarez, G.; Xamán, J.; Flores, J.; Alvarado, R. Nusselt Number for the Natural Convection and Surface Thermal Radiation in Solar Collectors. In Proceedings of the ISES World Congress 2007; Springer: Berlin/Heidelberg, Germany, 2008; Volumes I–V. [Google Scholar]
  37. Incropera, F.P.; Lavine, A.S.; Bergman, T.L.; DeWitt, D.P. Fundamentals of Heat and Mass Transfer; Wiley: New York, NY, USA, 2007. [Google Scholar]
  38. Arifin, Z.; Tjahjana, D.D.D.P.; Hadi, S.; Rachmanto, R.A.; Setyohandoko, G.; Sutanto, B. Numerical and Experimental Investigation of Air Cooling for Photovoltaic Panels Using Aluminum Heat Sinks. Int. J. Photoenergy 2020, 2020, 1574274. [Google Scholar] [CrossRef]
  39. Li, Z.; Ma, T.; Zhao, J.; Song, A.; Cheng, Y. Experimental study and performance analysis on solar photovoltaic panel integrated with phase change material. Energy 2019, 178, 471–486. [Google Scholar] [CrossRef]
  40. Bar-Cohen, A.; Rohsenow, W.M. Thermally Optimum Spacing of Vertical, Natural Convection Cooled, Parallel Plates. J. Heat Transf. 1984, 106, 116–123. [Google Scholar] [CrossRef]
Figure 1. Layout of the photovoltaic (PV) panel with the considered cooling system.
Sustainability 13 03490 g001
Figure 2. Thermal resistance circuit of the problem.
Sustainability 13 03490 g002
Figure 3. Model validation of the solar panel temperature compared with Arifin, Tjahjana et al. (2020) [38].
Sustainability 13 03490 g003
Figure 4. Model validation of the solar panel temperature compared with Li, Ma et al. (2019) [39].
Sustainability 13 03490 g004
Figure 5. Model validation of the solar panel temperature compared with Ahmad, Khandakar et al. (2018) [19].
Sustainability 13 03490 g005
Figure 6. Impact of the ambient temperature on the solar panel temperature for different fins lengths.
Sustainability 13 03490 g006
Figure 7. Impact of the ambient temperature on the solar panel temperature for different fins thicknesses.
Sustainability 13 03490 g007
Figure 8. Impact of ambient temperature on the power of solar panel by using the cooling system and without using the cooling system.
Sustainability 13 03490 g008
Figure 9. Impact of ambient temperature on the power of solar panel at different wind speeds.
Sustainability 13 03490 g009
Figure 10. Impact of ambient temperature on the efficiency of solar panel with and without using cooling system.
Sustainability 13 03490 g010
Figure 11. Effect of tilt angle of solar panel temperature for two different fin lengths.
Sustainability 13 03490 g011
Figure 12. The effect of tilt angle of solar panel temperature for two different fin thicknesses.
Sustainability 13 03490 g012
Figure 13. Effect of emissivity on solar panel temperature at different wind speeds.
Sustainability 13 03490 g013
Figure 14. Effect of irradiance on solar panel temperature for different emissivity values.
Sustainability 13 03490 g014
Figure 15. Effect of fin length on the heat flow rejected from solar panel.
Sustainability 13 03490 g015
Figure 16. Temperature of different layers as a function of fin length.
Sustainability 13 03490 g016
Figure 17. Effect of fin length on heat flow rejected from the back side at different emissivity values.
Sustainability 13 03490 g017
Figure 18. Impact of fin length on the heat flow for different wind speed.
Sustainability 13 03490 g018
Figure 19. Hourly irradiance and wind speed registered in summer and winter seasons in Dammam city.
Sustainability 13 03490 g019
Figure 20. Comparison of the solar panel temperature with and without cooling between summer and winter season in Dammam city.
Sustainability 13 03490 g020
Figure 21. Effect of cooling system on solar panel power in summer and winter for Dammam city.
Sustainability 13 03490 g021
Table 1. Properties of the layers of the PV panel.
LayerThickness (m)Thermal Conductivity (W/m K)
Glass0.0031.8
ARC0.000000132
PV cells0.000225148
EVA0.00050.35
Rear contact0.00001237
Tedlar0.000010.2
Adhesive material0.00011.5
Heat sink0.0005205
Table 2. Inputs used by some available experimental data in the literature.
Inputs Used by (Arifin, Tjahjana et al., 2020) [38]Inputs Used by
(Li, Ma et al., 2019) [39]
Inputs Used by
(Ahmad, Khandakar et al., 2018)
Width0.65 m1 m0.054 m
Length0.672 m1.19 m
Wind speed1.5 m/sReal variable valuesReal variable values
Irradiation Real variable valuesReal variable values
Ambient temperature25 °CReal variable valuesReal variable values
Length of fin0.03 m--
Thickness of fin0.002 m--
Table 3. Values of root mean square error (RMSE), R2, Chi-square, and Max standard deviation.
RMSER2Chi-SquareMax Deviation
(Arifin, Tjahjana et al., 2020) [38]Without cooling system1.460.970.998.58%
With cooling system3.760.690.9815%
(Li, Ma et al., 2019) [39]Without cooling system2.130.970.997.47%
Ahmad, Khandakar et al., 2018) [19]Without cooling system1.650.9214.85%
Table 4. Parameters used in the worst scenario.
Solar panel width1 m
Solar panel length2 m
Wind speed0 m/s
Recommended safe solar temperature80 °C
Irradiance1000 W/m2
Ambient temperature50 °C
Thickness of fin0.001 m
Spacing between fins (optimal)0.015459 m
Emissivity of silicon0.85
Emissivity of aluminum0.95
Publisher’s Note: MDPI stays neutral with regard to jurisdictional claims in published maps and institutional affiliations.

