Abstract
The article aims to explore which types of proximity approach can foster university–industry (U-I) collaborations for innovation and discuss the role of different dimension regional absorptive capacity in cooperation to promote inter-regional partnerships from “unbalance” to “coordination”. Therefore, we intercept 484 pairs of cooperative entities and analyze proximity effects and heterogeneity cross-regional U-I collaborations by hierarchical regression. The results show: (1) In non-local contexts, geographic distance is not a hamper for improving innovation performance. The economic development level has no significantly different effects on such a role. (2) Technological proximity plays a negative role in increasing innovative performance, and the eastern region has the most noticeable results. (3) The closer in social distance can get more innovation performance in eastern and western, but the central area negatively affects. (4) The U-I collaborations for innovation performance-enhancing advantages are not equal for all regions but are moderating by specific regional absorptive capacity dimensions. The areas with a higher level of internal human capital can get more catch-up effects. The lagging regions should increase talents to promote cross-regional cooperation for catching up. In contrast, the prosperous areas should take advantage of the talent-gathering effects to promote knowledge spillover.
1. Introduction
From academic “ivory towers” to complex economic organizations, the relationship between universities and the economy is getting closer [1]. The new knowledge production “mode 2” proposed that application-oriented knowledge production can be jointly created by heterogeneous enterprises and universities [2]. The triple helix innovation paradigm breaks the organizational and authority boundaries between industry–university–government and creates an innovative environment conducive to knowledge creation, transformation, and application [3]. The blurring of organizational boundaries and the emphasis on external resources’ availability have made U-I collaborations a major source for knowledge production and new technological innovations [4,5]. Scholars interest in proceeding on the knowledge spillovers of U-I collaborations to spur regional development [6,7,8]. Knowledge is a concept of social embedded-whether it is rooted in specific environments or constituted by these environments-implies that the boundaries between context are indispensable for understanding the flow of knowledge [9]. The regional edge as the externality is rooted in the correlation between knowledge production and the overall level of economic activities and is more significant than the barriers such as organizational structure, goals, and culture on the scale of cities or regions [10]. Context perspective showed us that U-I interactions in prosperous or lagging regions might lead to very different outcomes [11,12]. The U-I collaborations in the lower-income areas usually showed a weak demand in university knowledge by the industry [11].
The ladder shape of U-I collaborations performances in China shows an “imbalance” problem of spillover effects (Figure 1). The number of technology transfer commissions between universities and enterprises in Beijing and Jiangsu was 3360 totally in 2017, with only one case in Inner Mongolia, two cases in Ningxia. In 2018, the highest number of contracts for transforming scientific and technological achievements by U-I in the four regions (Appendix A) was eastern regions, at 51.1 billion yuan, the least is northeastern. The western part got 8.3 billion yuan, a decrease of 20.1% compared with 2017. Using external universities’ resources and matching with industrial innovations to promote innovation capabilities in regions, especially in lagging regions, has become a common concern of local governments. Understanding the inter-regional U-I collaborative knowledge flow has great significance.
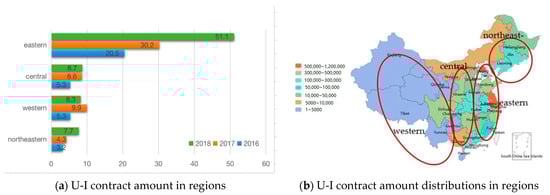
Figure 1.
The U-I contract amount and distributions for transformation of scientific and technological achievements in regions.
How to realize the “unbalanced” cross-regional U-I collaborations in China with apparent institutional arrangements and administrative obstacles to coordinated development? The inter-regional knowledge flow causes scholars to focus on U-I collaborations with a spatial proximity perspective, exploring U-I collaborative knowledge spillover’s mechanism and shaping innovation performance and regional growth from urban or regional view [13]. Space distance plays a vital role in local regional innovativeness as a continuous field of opportunities [14]. U-I collaborations’ knowledge flow should be continuously acquired, developed, decomposed, and stored during the knowledge flowing, making the flow in constant physical changes [15]. When taking space and region as the carriers, it is necessary to realize the development path of “knowledge production and agglomeration to knowledge spillover, and then inflow-region capturing the new knowledge, and finally, inflow-subjects absorbing and transferring to balance development.” We should embed regional interaction into spatial knowledge flow, shifting from “one-way spillover” to “subject-region” interactive spillover. Therefore, we devote to answer the following three questions:
Q1: Which types of proximity enhance or hamper the knowledge flow from non-local universities to local enterprises?
Q2: Whether the local region attributes can capture such knowledge flow?
Q3: How to design policy for regions to encourage firms’ local behavior to catch up with U-I collaborations’ innovative performance?
Research on proximity is an essential branch of U-I collaborations spatial studies and has provided a solid foundation for innovation study, organizational cooperation, and regional development [5]. Prior research proposed the “distance” of the relationship is a prerequisite for interaction between subjects and knowledge spillover [16,17]. This field mainly includes three directions: First, extending geographical proximity to multidimensional proximity, such as cognitive, technological, social, and institutional proximity, etc. [18,19]; second, is introducing proximity factors to the measurement model of U-I knowledge spillover effects [20,21]; the third is the impacts of diversity proximity mechanism on U-I collaborative performance in different countries [22,23,24,25,26,27,28,29]. Most works discussed the relationships of proximity on U-I collaborations at the individual and organizational levels. And a number of previous studies took the European Union, the US, and Italy etc., as samples, ignoring regional heterogeneity may lead to estimation errors. These studied showed a gap in integrating proximity on U-I’s spatial interaction processes from an inter-regional and heterogeneity context. Some empirical studies have also verified the influences of some organizational factors on proximity, like firm size [30], organizational absorptive capacity [31,32]. Moreover, they fail to incorporate the knowledge carriers’ role of inflow region’s absorptive capacity into the research framework, ignoring the availability of regional endowments to capture local proximity.
Universities as exogenous are the primary source of knowledge spillover. They are independent of regional endowments. The knowledge under the spatial proximity effect flows from non-local universities to local enterprises. The local regional participants are endogenous, absorbing and commercializing the knowledge generated [33]. The regional absorptive capacity’s role is to keep knowledge spillover efficiency and promote the absorption of knowledge [34,35]. Compared with proximity, this “factor endowment” has a more objective existence that affects the enterprises’ resources. Therefore, this article tends to take the knowledge flow of non-local universities to local regional firms as research objects and embed inflow region endowments into proximity factors of U-I knowledge spillover. We explore the influences of diversity proximity on U-I collaborations and analyze whether there is a catch-up effect of regional absorptive capacity on such a relationship to promote U-I collaborations’ coordination.
This research contributes to the existing spatial proximity research context and theoretical analysis framework. First, we introduce regional heterogeneity into the analysis framework, focusing on the U-I collaborations from non-local universities to local regions that significantly impact lagging regions’ innovation performance. Second, we integrate the “spatial proximity outflow” with “inflow regional absorptive capacity” and construct a “subject-region” interactive spillover way in a non-local context. Third, according to two central hypotheses: “later-mover advantage” and “absorptive capacity” of catch-up economy theory, we verify the catch-up role from internal (human capital as a proxy variable) and external absorptive capacity (regional technological gap as a proxy variable). This research helps each provincial government, primarily undeveloped areas enhance the introduction, absorption, and effective use of external knowledge based on their actual conditions and influences enterprises’ behavior.
The remainder of this article comprises six sections. Section 2 proposes the research hypotheses based on the theoretical background and establishes a conceptual model of our research. Section 3 presents the sample source, the measurement of various variables, and the analysis techniques. Section 4 provides the main effect of multidimensional proximity on cross-regional U-I collaborations, the moderating impact of regional absorptive capacity, and regional heterogeneity. Section 5 and Section 6 illustrates the results and provides the policy implications. Finally, Section 7 concludes this paper with limitations.
2. Theory and Hypotheses Development
A number of works first took geographical proximity as a source of U-I collaborations. They proposed that a wide range of knowledge exchanges are achieved by allowing face-to-face communication with partners in the same location, thus facilitating the interactive process [36]. However, participants who are not close can still effectively exchange knowledge. In many cases, they are based on non-geographically adjacent dimensions. Diversity proximity interacts with U-I cause the research motivations. Proximity usually includes two types: subjective perceptive proximity, such as social and technological proximity, emphasizing the individual’s emotional feelings based on objective distance. It is a sense of “distance”. The other is the actual spatial distance, like geographical proximity. This study selects three more obvious types, including geographical, technological, and social proximity, to explore the issue of cross-regional U-I collaborations.
2.1. Geographical Proximity and University–Industry Collaborations
Geographic proximity is the spatial starting point for regional innovation research. Scholars generally agree that geographical distance has an apparent negative correlation with innovation activities. It can reduce the cost of diffusion under the influence of knowledge externalization and localized labor markets, facilitates the transfer of tacit knowledge through relatively frequent face-to-face communication [36], obtains more collaborative benefits [37], and leads to a significant geographic concentration trend of the knowledge flow [38].
With the development of information and communication technology and modern transportation infrastructure, there are many interactive methods to choose from, such as email, video conferencing, and collaborative innovation network platforms. The cooperation between innovative entities is often cross-regional or even transnational [39,40]. Hewitt-Dundas [41] surveyed 906 businesses in the United Kingdom, finding that 538 (59.4%) cooperate with non-local universities. This view means that the nearest university is not a determining factor.
The popularization of telematics technology has made inter-regional collaborations unprecedentedly active. The hindering effect of geographic distance is not apparent sometimes. The “temporary geographical proximity” formed by people’s movement and frequent travel can replace the role of permanent geographical proximity to a certain extent, thus weakening the dependence of knowledge exchange between individuals on geographic spatial distance. The relatively developed regions in the eastern will overcome geographic barriers to seek cooperation due to transportation and information development. Moreover, the undeveloped areas in central and western areas will also overcome geographic obstacles and be inclined to seek better external knowledge outside the region, increasing cross-regional U-I collaborations’ opportunities. Therefore, geographical distance can increase the motivation for cooperation, thereby improving the collaborative innovation performance. The reasons mentioned above lead us to propose the following hypothesis:
Hypothesis 1 (H1).
Geographical distance is positively related to the cross-regional innovation performance of U-I collaborations.
Hypothesis 1a (H1a).
Regional economic differences will not affect geographical proximity in promoting innovation, there are no significant differences between the eastern region and the other regions.
2.2. Technological Proximity and University–Industry Collaborations
Technical proximity refers to the degree of technical similarity between two subjects. In general, the diffusion of knowledge among innovative entities with similar technologies is more efficient. It is easy to form a cooperative relationship and collaborative innovation within a region and across regions [42,43]. It helps overcome institutional differences between subjects and promote effective communication inter-organization, enabling firms to efficiently and cost-effectively acquire and absorb resources and spillover knowledge [44]. Technological distance is one of the crucial factors affecting U-I collaboration innovation activities [45]. Kim and Song [46] selected innovation survey data based on Belgian U-I collaborative characteristics and got similar conclusions.
Innovation is the integration of heterogeneous and complementary pieces of knowledge. The excessive similarity of based-knowledge between subjects will reduce the learning space for each other, which is detrimental to novel creation and brings technological path dependence and lock-in. U-I participants’ technological proximity is too high or too low, which is not conducive to cross-regional R&D cooperation, and they should be inverted U-shaped relationships [16]. As the level of technological proximity increases, cross-regional U-I has increased first and then declined. The imbalance of technical level between regions makes technological proximity also have differences in U-I collaborations’ performance. The existence of an optimal technological proximity level has the most potent effect on promoting cross-regional U-I. Hence, we argue that
Hypothesis 2 (H2).
There is an inverted U-shaped relationship between technological proximity and cross-regional U-I innovation performance.
Hypothesis 2a (H2a).
Innovative performance related to the development level in a region; therefore, the eastern part is negatively affecting innovation performance, while the central and western areas are in the stage of positively affecting performance.
2.3. Social Proximity and University–Industry Collaborations
The proximity framework can benefit from the ongoing theoretical developments in various disciplines, including sociology, management, and economics [47,48]. Social proximity is a trust-based, socially embedded relationship between subjects [18]. It refers to the distance between socially embedded relationships and position in the network structure among actors [49,50]. Technological progress has triggered changes in new forms of space, and economic activity has become fundamentally non-localized. A flowing space has replaced the traditional static local area [51]. Socially embedded relationships and shared experiences between subjects can further enhance mutual trust, and long-term sustainable cooperative relationships can promote innovation in U-I collaborations [18,52]. This kind of faith is often better than an anonymous or new relationship [53]. Trust-based social relationships are conducive to the interactive transfer of tacit knowledge, and effective interactive learning requires firm and lasting social relationships [54]. Therefore, social proximity can reduce information acquisition uncertainty and cooperation costs, especially for cross-regional U-I collaborations. Then, we formulate the following hypothesis:
Hypothesis 3 (H3).
Social proximity is positively related to the cross-regional innovation performance of U-I collaborations.
Hypothesis 3a (H3a).
The higher technological level can gain closer social relationship, then get more innovation performance. So, there are significant differences between the eastern and other regions.
2.4. The Catch-Up Effects of Regional Absorptive Capacity
There is a backward advantage hypothesis in the economic development catch-up theory. The more significant the resource endowment gap between regions, the more underdeveloped areas can use their backward advantages to narrow the productivity gap with leading sites. Kuznets [55] thought that the so-called backward advantage means that technologically backward countries can borrow new technologies from technologically leading countries to improve production efficiency. Many scholars have proved the late-mover advantage’s effectiveness as a strategy for economic development in China’s central and western regions [56,57].
Another hypothesis in catch-up economic development theory is about absorptive capacity. Abramovitz [58] thought that being backward alone could not bring about greater diffusion and catch-up unless specific preconditions could absorb advanced ideas and knowledge spillover. These prerequisites are called “social competence”, and they include all factors that promote the imitation or utilization of new technologies, such as education and infrastructure. To further explain the transformation of the external possibility of economic catch-up into internal feasibility, Cohen et al. [31] introduced the absorptive capacity. It was later used to analyze innovation efficiency at the regional or national level. Giuliani and Bell [34] defined regional knowledge absorptive capacity; that is, the ability of human capital in the region to use the regional knowledge stock to identify, understand, disseminate, and creatively apply new knowledge from within and outside the area. In specific empirical studies, it can be discussed at the national level [59] or the provincial and municipal levels [60,61] and has a driving effect on regional innovation (e.g., [35,62,63]). According to the classical production factor endowment theory, differences factor endowments in the region lead to different performances in companies’ resources that impact the firm’s behaviors. Thus, we can understand regional absorptive capacity as a broader concept. The backward advantage hypothesis can be understood as the impact of the gap in the endowment of external factors, and we can call it external regional absorptive capacity. The outer “backwardness” of resource endowment increases the motivation for cooperation through external resources to promote economic development. It is possible to find more distant partners, increase the number of technology introductions and establish cooperative relations with more entities.
The absorptive capacity hypothesis can be understood as the impact of differences in inner resource endowments, and we can name it as internal regional absorptive capacity. It increases the possibility of transforming external resources into internal power and enhances the opportunity to find better resources, achieving longer-distance and more diversified cooperation. In general, it may affect the proximity–cooperative innovation performance relationship to form catch-up effects. Hence, we propose the following hypotheses:
Hypothesis 4 (H4).
Internal regional absorptive capacity has a moderating effect that can help regions through geographical (H4a), technological (H4b), and social proximity(H4c) to catch up more innovation performance of U-I collaborations.
Hypothesis 5 (H5).
External regional absorptive capacity has a moderating effect that can help regions through geographical (H5a), technological (H5b), and social proximity(H5c) to catch up more innovation performance of U-I collaborations.
The research concept model is presented in Figure 2, according to the hypothesized relationships among the constructs.
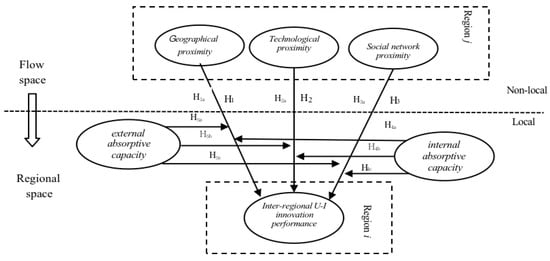
Figure 2.
Concept model of the research.
3. Methods
3.1. Dependent Variable
U-I collaborations are widely regarded to improve economic innovation by promoting the flow and utilization of technology-related knowledge and experience across sectors [19,64]. The contract number of U-I collaborations more reflects the market value of technology. The use of technical cooperation based on joint invention patents reflects more of an added value conducive to the overflow of tacit knowledge. It is more important for promoting regional economic development. Since the research purposes to better understand the performance differences between regions, this study measures the regional U-I collaborative innovation performance by the number of invention co-patents applied by the cross-regional U-I collaborations, which is recorded as UICP.
3.2. Independent Variables
3.2.1. Geographical Proximity
Geographical proximity is the reciprocal of geographic distance. Generally, geographic distance is measured by the physical distance between the university and the company. For research convenience, this study directly uses the straight-line distance between the cities where universities and companies are located to measure geographical distance. The corresponding data can be obtained directly by using the Baidu map (https://map.baidu.com/ (accessed on 19 March 2021)).
3.2.2. Technological Proximity
Technological proximity is generally measured as the cognitive distance between subjects and patent indicators [65,66,67]. When patents were used to characterize technological proximity, the accuracy depends on the number of patent samples and the division of patent dimensions. Drawing on the practices of Jaffe [68], Branstetter and Mariko [69], Benner and Waldfogel [70], we divide the 120 patent classifications of the original International Patent Classification Standard (IPC) into eight patent departments (A-H). Then, the total number of patents in U-I collaborations of each main body is calculated by counting the proportion of the three-digit IPC subcategories in the patent, and measured by using the industrial structure similarity coefficient. The calculation method of technical proximity is as follows:
Tec_prox represents the technical proximity between the two subjects, and 1–8 represent the eight patent divisions (A-H) of IPC. Further, fik and fjk represent the total number of invention patents authorized in k patents in subjects i and j within a certain period of time. The value range is 0–1. The closer the value is to 1, the higher the technical proximity of the two subjects.
3.2.3. Social Proximity
Social proximity is approximated by two measures that cover the degree to which companies have established common relationships [71]. One is whether the two subjects have cooperated before [42]. The cooperative relationship is set as a dummy variable, collaborative experience as “1”, otherwise “0” [72]. The second is the closeness of the collaborative relationship [18], usually measured by the number of existing cooperative relationships. Building trust, sharing again and more partners will increase the possibility of cooperation [9]. This study selects U-I collaborative entities with experience in collaboration as the sample. Here, we use the number of cooperative applications for invention patents in the past to measure social proximity.
3.3. Moderating Variable
This article draws on the views of Kuznets [55] and Giuliani and Bell [34], and measures the internal regional absorptive capacity from the proxy variables of human capital. We use a technology gap to measure the external regional absorptive capacity.
3.3.1. Human Capital Endowments
Most of empirical studies used the “number of people with secondary degree and higher” to measure the human capital in a region [73]. This indicator ignores innovation variables, leading to the “economic catch-up trap” [74]. Fagerberg [68] introduced R&D factors into the catch-up model [75]. As this study measures innovation performance, therefore, we also introduced R&D factors in this study. Since colleges and universities focus on basic research, and enterprises focus on applied research, we use the number of applied R&D personnel in inflow-region to measure human capital.
3.3.2. Technology Gap
This article draws on the practice of Benhabib and Spiegel [76], using the relative distance from the technology boundary to measure the technology gap, and the calculation formula is
where gapit is the technology gap, and Ai(t) is the current technology level of area i; maxAj(t) represent the technological boundaries of the country. According to Engelbrecht [77], if we assume that the ratio of material capital, human resources, and total factor productivity in the production function does not change over time, then per capita gross domestic product (GDP) can be used to measure the level of technology. Therefore, article assumes this Ai(t) that the technological boundary in China is the maximum GDP per capita in all provinces, and it is measured by GDP per capita of region i.
3.4. Control Variables
To make the estimated coefficients in the model more objective, we need to control some variables to strip out the influence of unobservant variables on the estimation results as much as possible. Generally, creative activities of enterprises in local region would affect the area’s innovation ability [78]. The more demand for innovation activities, the higher the level of innovation in the region. Therefore, this study uses the number of enterprises with R&D activities in the region to measure the demand for innovation activities and controls it, and we denote it as NTR. In the process of opening to the outside world, each innovation subject in the region can have more information exchanges and communication with the outside world, thereby improving their innovation capabilities. Hence, this study controls the level of regional openness measured by the value of imports and exports of high-tech products by region, recorded as OPEN. University innovation resources are also an important contribution to regional innovation capabilities. The amount of research on R&D projects in an area plays a particular role in promoting knowledge and creating innovative activities. For this reason, we also control the number of regional R&D projects by higher education, denoted as NRD.
3.5. Data Source and Sample
One of the main methods of U-I collaborations is a joint patent application. It embodies technology transfer between industry and universities. Therefore, to accurately find the main U-I collaborations entitles, the sample of this study is available on the China Patent Data Network (http://pss-system.cnipa.gov.cn/ (accessed on 19 March 2021)), with the search criteria set as keywords of “university”, “company”, and “city”, and set the filter criteria as invention patents. We selected the cities according to the regional creative ability report in 2019, including Beijing, Shanghai, Chongqing, Xi’an, Nanjing, Shenyang, Wuhan, Hangzhou, Guangzhou, and Harbin. Considering the lag of patent authorization, we set the period from 2013 to 2018 and got 7994 patients. Due to the cross-regional knowledge flow factors in this study, we excluded the patents that the enterprise cooperated with universities in the same province and the subjects with more than four cooperative entities. For invention patents of over two relevant issues, the data were decomposed and processed. For example, a university with two companies was identified as two cooperative patents. However, suppose cooperative entities include intra and inter the provinces. In that case, we only recognized the cooperation outside the region and counted the multiple collaborations at a time. Finally, we obtained 484 pairs of samples, 73 universities, and 427 companies covered 30 provinces (a total of 30 provinces after excluding Tibet, Taiwan, Hong Kong, and Macau). We calculated the multi-proximity based on them. The data for variables are from the China Statistical Yearbook and China Science and Technology Statistical Yearbook (see Table 1).

Table 1.
Description of the variables.
3.6. Analysis Methods
The error independence assumption in the general linear model refers to the fact that there can be no correlation between each observation’s errors in samples. Once the error independence assumption is violated, the probability of false positives will increase. This study contains contextual factors “regions”, which can be referred to as a cluster forming a nested data. Therefore, this study uses stepwise and group regression, based on the general linear model, and adds regional group regression to test the differences among regions. The inverted U-shape of technical proximity is tested by adding technological proximity and the square of technical proximity into the equation, respectively. The final model is shown in Formula (4). Control represents all control variables in Formula (3), ε is the error term, and i represents the region.
Hierarchical multiple and group regression was used to test the moderating effect and regional heterogeneity. After centralizing the data, we put the control variables and independent variables in the first and second layers. The second level will input the adjusted variable into the equation, and the third level will introduce the interactive items of independent variables and the adjusted variables. As shown in Formulas (5) and (6). Then, we use group regression to verify regional heterogeneity.
4. Data Analysis and Results
4.1. Evolution of University–Industry Collaborative Patents
Figure 3 shows U-I collaborations’ evolution during 2013–2018 by Ucinet 6.1.8. The red nodes represent universities, and the blue squares represent the inflow regions. The destiny raised from 0.172 in 2013 to 0.22 in 2018. The number of patent nodes and cooperative lines increased significantly, indicating that enterprises and various regions increasingly value U-I collaborations.
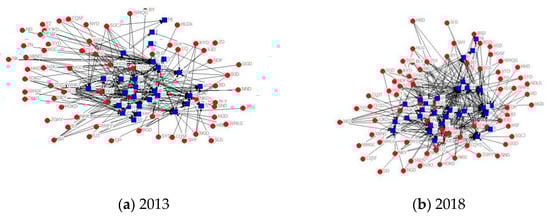
Figure 3.
The evolution of cooperative invention patents in 2013 and 2018.
Table 2 shows the number of relationship connections, the total number of relationships, and the proportion of cross-regional U-I collaborations. Both of them are increasing steadily. More and more regions have established U-I collaboration relationships. The ratio of non-local cooperation patents is gradually growing. Knowledge spillovers are diversified. Although out-of-region cooperation is rising, most of them flow into economically developed regions, especially in Jiangsu and Zhejiang provinces (see Table 3).
Table 2.
Statistics of University–Industry Collaboration (2013–2018).
Table 3.
An analysis of the degree of inflow and outflow of U-I collaboration (top 3).
4.2. Which Types of Proximity Affect U-I Collaborations?
We set the eastern region as a dummy variable, as “1”, and other areas as “0”, the model fit of other areas is not well (R2 = 0.414), indicating that there is a problem of multi-collinearity between variables. When we performed group regression, the northeastern p-value is null, so the northeast sample (n = 15) is eliminated to compare region heterogeneity. This article mainly discusses three regions in eastern, central, and western based on the test results.
We adopt a stepwise regression method to introduce geographical, technical, technological square, and social proximity into the equations to build Models 1–5 and test independent variables’ influence on dependent variables. In these models, R2 > 0.5, and the F value changed significantly; these models fit well (Table 4).
Table 4.
The results of proximity effects.
H1 proposed that geographic distance has a significant positive impact on the innovation performance of cross-regional U-I collaborations. According to the results of Models 2 in Table 4, it has a significant positive correlation with collaborative innovation performance (β = 0.004, p < 0.01), and thus H1 is confirmed. The results show that for cross-regional U-I collaborations, the enterprise’s demand-side can overcome the obstacle of geographical distance and form more cooperative innovation performance driven by demand and cooperative motivation, and convenient transportation.
H2 proposed that technological proximity has an invert U-shaped impact on the innovation performance of cross-regional U-I collaborations. According to the results of Models 3–4, after adding technical proximity, R2 did change significantly (β = −6.074, p < 0.05), then we input Tec-prox2 into the model, R2 did not change significantly (β = −7.355, p > 0.01) and H2 is not supported. This result indicates technological proximity negatively impacts innovation performance but did not form an inverted U-shaped. This result implies that there is a contradiction between unique and shared in technological proximity. The stronger the technological proximity the subjects have, the more unhelpful it will be for them to absorb knowledge beneficial for their technological improvement and product innovation from their partners. The reason maybe is cooperative participants are increasingly demanding technological heterogeneity.
H3 posits that social proximity has a significant positive impact on collective innovation performance. According to the results of Model 2, we input social proximity into the model, and both R2 and F have changed significantly. It was found that social proximity and cooperative innovation performance are significantly positively correlated (β = 0.026, p < 0.05), and H3 is supported. The result also verified that higher social proximity would increase mutual trust between subjects that can reduce a series of uncertain risks brought by innovation activities and save knowledge transactions trial and error costs in cross-regional U-I collaborations.
4.3. The Influences of Regional Heterogeneity on Proximity Effects
From the coefficients of group regression (Table 5), in terms of geographic proximity, the impact on U-I collaborations innovation performance has a positive influence in eastern and central, and a negative effect in western (β = 0.003; β = 0.001; β = −0.0001), there are no significant differences between eastern, central, and western (p > 0.05). The H1a hypothesis is supported. Technological proximity negatively affects U-I collaborations innovation performance in all regions (β = −3.009; β = −0.635; β = −0.762). There are significant differences in areas (t = −1.932; t = −4.073, p < 0.05), and the eastern part have a more significant negative effect. H2a hypothesis is established. There are pronounced differences between eastern with central and western areas on social proximity (t = −3.028; t = 6.210, p < 0.01). There is a positive influence in eastern and western regions (β = 0.012; β = 0.002) and a negative impact in central (β = −0.026). The negative effect in the central area is the most significant, and the H3a hypothesis is supported.
Table 5.
Regression coefficient difference test.
4.4. Regional Absorptive Capacity “Catch-Up” Effects
First, we centralized the data and introduced the moderating variables and the independent variables into the equation. We take the logarithm in the calculation because the standard deviation of the IHC variable is too large. Models 6–8 examine the moderating effect of internal absorptive capacity (human capital), and Models 9–11 certify the influence of external absorptive capacity (technological gap). In Table 6, the interactive terms of geographic with internal absorptive capacity have a negatively significant moderating effect on the explained variables (β = −0.004, p < 0.01). Technological and social proximity with internal absorption capacity has a positively significant adjustment relationship (β = 18.146, p < 0.01; β = 0.037, p < 0.1). The above results indicate that H4a, H4b, and H4c are all supported. The “absorptive capacity” hypothesis can shape the performance of U-I collaborations.
Table 6.
Moderating effects of two type of regional absorptive capacity.
Table 6 shows that external absorptive capacity (technological gap) has no significant adjustment effects. The hypotheses H5a, H5b, and H5c are not supported. The “Being backward advantage” hypothesis did not work on the U-I collaborative innovative performance.
4.5. The Influences of Regional Heterogeneity on the “Catch-Up” Role
Because the moderating effect of external absorptive capacity did not pass the test, this study focuses on the internal absorptive capacity (human capital) to analyze the regional heterogeneity. According to the stratified regression method, the heterogeneity of the moderating effect is shown in Table 7.
Table 7.
Moderating effects of internal human capital: Sub-regional analysis.
The R-value shows in Table 7 that the rank of the adjustment effects of human capital are western > eastern > central region. In general, the moderating role of regional human resources is most apparent in the west part. For moderating effect on geographical proximity varies significantly among regions (p < 0.01) (Table 8). Due to the increase in human capital, the eastern part has formed a concentration of talents, leading to a decrease in cross-regional cooperation (β = −0.015). In contrast, the central region has increased the possibility of cross-regional cooperation (β = 0.018). The eastern region’s moderating effects with the west and central areas on technological proximity are apparent differences (β = 10.66; β = −2.842; β = 2.209, p < 0.01)—the most evident technological dependence on the eastern region. The adjustment effect on social proximity is positive in all areas (β = 0.045; β = 0.001; β = 0.145, p < 0.01). The policy of vigorously introducing talents and attracting more R&D personnel brings the most apparent effect on central innovation performance. The result can help to build trust and cooperative relationships between subjects and then improve the innovation performance.
Table 8.
Regression coefficient difference test on moderating effects.
5. Discussion and Conclusions
The role of multi-dimensional proximity and regional absorptive capacity in regional U-I collaborations for innovation is increasingly recognized. Nevertheless, research lacks empirical engaging in the inter-regional heterogeneity context and integrating spatial proximity with regional endowments. Our study’s major contribution is finding the effects of diversity proximity on U-I collaborations and embedding inflow regional absorptive capacity into spatial proximity outflow in a non-local context. These investigations yield two central results: (1) The influences of proximity on inter-regional U-I collaborations for innovation performance-enhancing advantages are not equal for all regions. In prosperous areas (eastern), geographical proximity and technological heterogeneity play a more significant role. In the lagging regions (western and central), the social relationship closer to prosperous areas can increase innovation performance. (2) The impacts of proximity on U-I collaborative innovations were fostered by regional ability to absorb non-local knowledge through human capital. The number of R&D personnel help for getting catch-up effects in regions, mainly for lagging areas.
Specially, geographical distance is not a hamper on cross-regional U-I collaborations’ innovation performance, which indicates that companies are more willing to enhance their innovation capabilities ignoring the geographical barriers, especially in eastern with higher development level. There, like in Shearmur [14] or Hewitt-Dundas [41], the local university is not the critical factor attracting U-I collaborations. While the result is not fit for a region with a lower development level, like in western China, the geographical distance could not shape the innovation performance.
Technological proximity impacts the U-I collaborations can not form an inverted U shape unlike Wang’s [79] findings. In 2012, China introduced an innovation-driven national strategy to promote U-I collaborations vigorously. The samples selected in this study are just a year after introducing these policies from 2013 to 2018. According to Zhang [80], period from 2013 to 2018 is a development stage for industry innovation. This result reflects some extent that China’s U-I collaborations innovation has passed the peak of cooperation and began to enter the innovation-driven stage. It is one reason why technological proximity has not formed an inverted U shape but has a negative impact, and regions in the east of China have the most obvious.
Social proximity based on cooperative numbers can shape innovation performance of cross-regional U-I collaborations, which is the same as Wei and Yu [72] said: “Social proximity help bring non-local academic and industrial partners together”. The richer collective experiences are, the more conducive to the improvement of innovation performance. This effect makes the social proximity have regional differences and depends on the core eastern region; in central, proximity is a hindrance factor. This result is different from the positive effect on social proximity with Xia [81].
As for another important result is the capturing effect of the receiving area’s absorptive capacity. The findings show that higher of the number of applied R&D personnel (human capital) can help enterprises capture non-local U-I collaborative knowledge flow. The work proves the absorptive capacity hypothesis proposed by Cohen [31]; like in Lucas’ endogenous theory, human capital can be transformed with each other, forming increasing returns in production. Inner regional human capital endowments can bring catch-up effects for U-I knowledge flow [73]. For external absorptive capacity, which takes the technological gap as a proxy variable, there is no support for the backward advantages hypothesis from Lin [82]. It shows that the requirement for technology to be “endogenous” is getting higher. A more significant technological gap would make the proximity more challenging to realize, which will reduce innovation performance. External technical differences cannot help the spatial distance between enterprises and universities capture more innovation performance.
Geographical proximity to U-I collaborations in the eastern region has gradually weakened with the higher level of human capital. The concentration of talents reduces the innovation performance brought about by long-distance U-I collaborations. The accumulation of skills will also increase the sense of trust between cooperative subjects, driving cooperation frequently and improving collaborative innovation in western and central regions. There is no significant change in the different areas for the technological gap, which further shows that the backward advantage hypothesis is not valid. The reason may be similar to the viewpoint by Pavitt and Soete [74], who did not consider the innovation factors or, as endogenous theory pointed out, that technology is “endogenous,” not “homogeneity”.
6. Policy Implications
Our results provide some implications for policymakers. It is necessary to broaden the channels of knowledge flow between regions, strengthening exchanges. The area should realize the sharing of resources and technologies and provide technical support to realize regional economic integration. It is necessary to build a public service platform conducive to forming cooperative and innovative relationships and reducing the costs and risks of U-I collaborations. This study shows that social proximity can improve the innovation performance of cross-regional U-I collaborations. Therefore, building a public service platform conducive to cross-regional collaborative innovation reduces the information asymmetry between industry and universities. The development of inter-regional collaborative innovation networks can be promoted.
In lagging areas, like central and western, government departments should vigorously develop transportation network and communication technology, improving the level of geographical proximity between regions, and make it easier to communicate and share resources between inter-regional U-I. The governments can also increase the intensity of talent introduction. They consider factors such as talent structure, the construction of regional talent echelons, a talent gathering effect, and improve the level of regional absorptive capacity, such as the “Golden panda” talent plan in Sichuan.
For prosperous areas in the eastern, the region should improve the interaction of multiple organizational forms between long-distance regions, especially non-core regions, strengthen knowledge flow between areas. The areas should pay attention to U-I collaborations’ networked development for innovation, forming a “core-periphery” development path. Accelerating international cooperation and expanding cooperation boundaries are also excellent ways to promote coordinated regional development.
7. Research Limitations and Further Research
This article is subject to some limitations. A limitation is we screened the co-invent patents period over 2013–2018; the tendency could not explain several years before, leading to some tests not being supported. Another is considered that the proxy variables we employed are not enough to capture the aspects of regional absorptive capacity, such as policies, investments are not included. Then, a detailed analysis on time lags of patents should also be added into models. In addition, a more accurate method such as cluster analysis can be used to make the regional heterogeneity. Finally, we can test more heterogeneity except for regions, like industry fields, life cycles, and different U-I collaborative forms.
In the future, the triple helix structure mentions the interactions among government, enterprises, and universities. Is there a four-helix or other more dimensional forces affecting U-I collaborations, such as knowledge brokers and knowledge platforms? The influences of different roles are the mainstream that needs to be explored in the future. The tendency of “spatiality” knowledge spillovers turning to the paradigm of human and economic geography will contribute to the scientific formulation of regional innovation and balanced development policies.
Author Contributions
Conceptualization, S.Y.; methodology, S.Y.; software, S.Y.; validation, S.Y. and T.Y.; formal analysis, S.Y.; investigation, S.Y.; resources, S.Y.; data curation, S.Y.; writing—original draft preparation, S.Y.; writing—review and editing, T.Y.; visualization, T.Y.; supervision, T.Y.; project administration, S.Y.; funding acquisition, S.Y. All authors have read and agreed to the published version of the manuscript.
Funding
This research was funded by EDUCATIONAL DEPARTMENT OF LIAONING PROVINCE, grant number J2020085.
Institutional Review Board Statement
Not applicable.
Informed Consent Statement
Not applicable.
Data Availability Statement
The data presented in this study are available on request from the corresponding author.
Acknowledgments
The authors are enormously grateful to Han YiQing for her invaluable assistance with data analysis. Thanks also to Zhang ShuangShuang and QU XiaoMeng for collecting data.
Conflicts of Interest
The authors declare no conflict of interest.
Appendix A
According to the classification method of China Statistical Yearbook in 2011, the mainland can be divided into four regions: eastern, central, western, and northeastern.
Northeastern regions include Liaoning, Jilin, and Heilongjiang (GDP per capita: 52,298/yuan, 2018);
Eastern regions include Beijing, Tianjin, Hebei, Shanghai, Jiangsu, Fujian, Zhejiang, Shandong, Guangdong, and Hainan (GDP per capita: 96,378/yuan, 2018);
Central regions include Jiangxi, Anhui, Shanxi, Henan, Hubei, and Hunan (GDP per capita: 51,684/yuan, 2018);
Western regions include Inner Mongolia, Guangxi, Chongqing, Sichuan, Guizhou, Yunnan, Tibet, Shaanxi, Gansu, Qinghai, Ningxia, and Xinjiang (GDP per capita: 49,914/yuan, 2018).
The prosperous regions in this study refer the eastern provinces and the central, northeast, and western provinces belong to lagging regions.
References
- Etzkowitz, H.; Leydesdorff, L. The dynamics of innovation: From national systems and “Mode 2” to a triple helix of university–industry–government relations. Res. Policy 2000, 29, 109–123. [Google Scholar] [CrossRef]
- Baber, Z.; Gibbons, M.; Limoges, C.; Nowotny, H.; Schwartzman, S.; Scott, P.; Trow, M. The new production of knowledge: The dynamics of science and research in contemporary societies. Contemp. Sociol. A J. Rev. 1995, 24, 751. [Google Scholar] [CrossRef]
- Etzkowitz, H.; Webster, A.; Gebhardt, C.; Terra, B.R.C. The future of the university and the university of the future: Evolution of ivory tower to entrepreneurial paradigm. Res. Policy 2000, 29, 313–330. [Google Scholar] [CrossRef]
- Perkmann, M.; Walsh, K. University–industry relationships and open innovation: Towards a research agenda. Int. J. Manag. Rev. 2007, 9, 259–280. [Google Scholar] [CrossRef]
- Skute, I.; Zalewska-Kurek, K.; Hatak, I.; De Weerd-Nederhof, P.C. Mapping the field: A bibliometric analysis of the literature on university–industry collaborations. J. Technol. Transf. 2017, 44, 916–947. [Google Scholar] [CrossRef]
- Lee, K.-J. From interpersonal networks to inter-organizational alliances for university-industry collaborations in Japan: The case of the Tokyo Institute of Technology. R D Manag. 2011, 41, 190–201. [Google Scholar] [CrossRef]
- Giunta, A.; Pericoli, F.M.; Pierucci, E. University–industry collaboration in the biopharmaceuticals: The Italian case. J. Technol. Trans. 2016, 41, 818–840. [Google Scholar] [CrossRef]
- Oyelaran-Oyeyinka, B.; Adebowale, B.A. University-industry collaboration as a determinant of innovation in Nigeria. Inst. Econ. 2017, 4, 21–46. [Google Scholar]
- Wasiluk, A.; Saadatyar, F.S. Inter-organizational trust as a statement of social proximity. J. Entrep. Manag. Innov. 2020, 16, 77–100. [Google Scholar] [CrossRef]
- Ponds, R.; Van Oort, F.; Frenken, K. Innovation, spillovers and university-industry collaboration: An extended knowledge production function approach. J. Econ. Geogr. 2009, 10, 231–255. [Google Scholar] [CrossRef]
- Nsanzumuhire, S.U.; Groot, W. Context perspective on University-Industry Collaboration processes: A systematic review of literature. J. Clean. Prod. 2020, 258, 120861. [Google Scholar] [CrossRef]
- Sun, Y.; Cao, C. Intra- and inter-regional research collaboration across organizational boundaries: Evolving patterns in China. Technol. Forecast. Soc. Chang. 2015, 96, 215–231. [Google Scholar] [CrossRef]
- Slavtchev, V. Proximity and the transfer of academic knowledge: Evidence from the Spatial pattern of industry collaborations of East German professors. Reg. Stud. 2013, 47, 686–702. [Google Scholar] [CrossRef]
- Shearmur, R. Innovation, regions and proximity: From neo-regionalism to spatial analysis. Reg. Stud. 2011, 45, 1225–1243. [Google Scholar] [CrossRef]
- Azagra-Caro, J.M.; Barberá-Tomás, D.; Edwards-Schachter, M.; Tur, E.M. Dynamic interactions between university-industry knowledge transfer channels: A case study of the most highly cited academic patent. Res. Policy 2017, 46, 463–474. [Google Scholar] [CrossRef]
- Korotka, M.A. Proximity factors influencing academics’ decisions to cooperate with industrial organizations. Reg. Stud. Reg. Sci. 2015, 2, 415–423. [Google Scholar] [CrossRef][Green Version]
- De Fuentes, C.; Dutrénit, G. Geographic proximity and university–industry interaction: The case of Mexico. J. Technol. Transf. 2016, 41, 329–348. [Google Scholar] [CrossRef]
- Boschma, R. Proximity and innovation: A critical assessment. Reg. Stud. 2005, 39, 61–74. [Google Scholar] [CrossRef]
- Nooteboom, B.; Van Haverbeke, W.; Duysters, G.; Gilsing, V.; Oord, A.V.D. Optimal cognitive distance and absorptive capacity. Res. Policy 2007, 36, 1016–1034. [Google Scholar] [CrossRef]
- Jaffe, A.B.; Henderson, T.R. Geographic localization of knowledge spillovers as evidenced by patent citations. Quart. J. Econ. 1993, 108, 577–598. [Google Scholar] [CrossRef]
- Acs, Z.J.; Audretsch, D.B.; Feldman, M.P.; Link, A. Real effects of academic research: Comment. Univ. Entrep. Ecosyst. 2017, 82, 134–138. [Google Scholar] [CrossRef]
- Greunz, L. Geographically and technologically mediated knowledge spillovers between European regions. Ann. Reg. Sci. 2003, 37, 657–680. [Google Scholar] [CrossRef]
- Balconi, M.; Breschi, S.; Lissoni, F. Networks of inventors and the role of academia: An exploration of Italian patent data. Res. Policy 2004, 33, 127–145. [Google Scholar] [CrossRef]
- Aldieri, L. Technological and geographical proximity effects on knowledge spillovers: Evidence from the US patent citations. Econ. Innov. New Technol. 2011, 20, 597–607. [Google Scholar] [CrossRef]
- Marrocu, E.; Paci, R.; Usai, S. Proximity, networking and knowledge production in Europe: What lessons for innovation policy? Technol. Forecast. Soc. Chang. 2013, 80, 1484–1498. [Google Scholar] [CrossRef]
- Benos, N.; Karagiannis, S.; Karkalakos, S. Proximity and growth spillovers in European regions: The role of geographical, economic and technological linkages. J. Macroecon. 2015, 43, 124–139. [Google Scholar] [CrossRef]
- Caragliu, A.; Nijkamp, P. Space and knowledge spillovers in European regions: The impact of different forms of proximity on spatial knowledge diffusion. J. Econ. Geogr. 2015, 16, 749–774. [Google Scholar] [CrossRef]
- Arant, W.; Fornahl, D.; Grashof, N.; Hesse, K.; Söllner, C. University-industry collaborations—The key to radical innovations? Rev. Reg. Res. 2019, 39, 119–141. [Google Scholar] [CrossRef]
- Pan, X.; Pan, X.; Ai, B.; Guo, S. Structural heterogeneity and proximity mechanism of China’s inter-regional innovation cooperation network. Technol. Anal. Strat. Manag. 2020, 32, 1066–1081. [Google Scholar] [CrossRef]
- Santoro, M.D.; Chakrabarti, A.K. Firm size and technology centrality in industry–university interactions. Res. Policy 2002, 31, 1163–1180. [Google Scholar] [CrossRef]
- Cohen, W.M.; Levinthal, D.A. Absorptive capacity: A new perspective on learning and innovation. Adm. Sci. Q. 1990, 35, 128. [Google Scholar] [CrossRef]
- Tether, B.S.; Tajar, A. Beyond industry–university links: Sourcing knowledge for innovation from consultants, private research organisations and the public science-base. Res. Policy 2008, 37, 1079–1095. [Google Scholar] [CrossRef]
- Lehmann, E.E.; Menter, M. University–industry collaboration and regional wealth. J. Technol. Transf. 2015, 41, 1284–1307. [Google Scholar] [CrossRef]
- Giuliani, E.; Bell, M. The micro-determinants of meso-level learning and innovation: Evidence from a Chilean wine cluster. Res. Policy 2005, 34, 47–68. [Google Scholar] [CrossRef]
- Miguélez, E.; Moreno, R. Knowledge flows and the absorptive capacity of regions. Res. Policy 2015, 44, 833–848. [Google Scholar] [CrossRef]
- Storper, M.; Venables, A.J. Buzz: Face-to-face contact and the urban economy. J. Econ. Geogr. 2004, 4, 351–370. [Google Scholar] [CrossRef]
- Kabo, F.W.; Cotton-Nessler, N.; Hwang, Y.; Levenstein, M.C.; Owen-Smith, J. Proximity effects on the dynamics and outcomes of scientific collaborations. Res. Policy 2014, 43, 1469–1485. [Google Scholar] [CrossRef]
- Alnuaimi, T.; Opsahl, T.; George, G. Innovating in the periphery: The impact of local and foreign inventor mobility on the value of Indian patents. Res. Policy 2012, 41, 1534–1543. [Google Scholar] [CrossRef]
- McKelvey, M.; Alm, H.; Riccaboni, M. Does co-location matter for formal knowledge collaboration in the Swedish bio-technology–pharmaceutical sector? Res. Policy 2003, 32, 483–501. [Google Scholar] [CrossRef]
- Mora-Valentin, E.M.; Montoro-Sanchez, A.; Guerras-Martin, L.A. Determining factors in the success of R&D cooperative agreements between firms and research organizations. Res. Policy 2004, 33, 17–40. [Google Scholar] [CrossRef]
- Hewitt-Dundas, N. The role of proximity in university-business cooperation for innovation. J. Technol. Transf. 2011, 38, 93–115. [Google Scholar] [CrossRef]
- Xiang, X.Y.; Cai, H.; Pei, Y.L. Effect of three kinds of proximity in international patent co-application network. J. Manag. Sci. 2010, 23, 43–52. [Google Scholar]
- Scherngell, T.; Hu, Y. Collaborative knowledge production in China: Regional evidence from a gravity model approach. Reg. Stud. 2011, 45, 755–772. [Google Scholar] [CrossRef]
- Callois, J.-M. The two sides of proximity in industrial clusters: The trade-off between process and product innovation. J. Urban Econ. 2008, 63, 146–162. [Google Scholar] [CrossRef]
- Knoben, J.; Oerlemans, L.A.G. Proximity and inter-organizational collaboration: A literature review. Int. J. Manag. Rev. 2006, 8, 71–89. [Google Scholar] [CrossRef]
- Kim, C.; Song, J. Creating new technology through alliances: An empirical investigation of joint patents. Technovation 2007, 27, 461–470. [Google Scholar] [CrossRef]
- Rivera, M.T.; Soderstrom, S.B.; Uzzi, B. Dynamics of dyads in social networks: Assortative, relational, and proximity mechanisms. Annu. Rev. Sociol. 2010, 36, 91–115. [Google Scholar] [CrossRef]
- Schweitzer, F.; Fagiolo, G.; Sornette, D.; Vega-Redondo, F.; Vespignani, A.; White, D.R. Economic networks: The new challenges. Science 2009, 325, 422–425. [Google Scholar] [CrossRef] [PubMed]
- Granovetter, M. Economic action and social structure: The problem of embeddedness. Am. J. Sociol. 1985, 91, 481–510. [Google Scholar] [CrossRef]
- Cummings, J.L.; Teng, B.-S. Transferring R&D knowledge: The key factors affecting knowledge transfer success. J. Eng. Technol. Manag. 2003, 20, 39–68. [Google Scholar] [CrossRef]
- Boschma, R.; Heimeriks, G.; Balland, P.-A. Scientific knowledge dynamics and relatedness in biotech cities. Res. Policy 2014, 43, 107–114. [Google Scholar] [CrossRef]
- Petruzzelli, A.M. The impact of technological relatedness, prior ties, and geographical distance on university–industry collaborations: A joint-patent analysis. Technovation 2011, 31, 309–319. [Google Scholar] [CrossRef]
- Broekel, T. Collaboration intensity and regional innovation efficiency in Germany—A conditional efficiency approach. Ind. Innov. 2012, 19, 155–179. [Google Scholar] [CrossRef]
- Maskell, P.; Malmberg, A. Localised learning and industrial competitiveness. Camb. J. Econ. 1999, 23, 167–185. [Google Scholar] [CrossRef]
- Kuznets, S. Modern economic growth: Findings and reflections. Am. Econ. Rev. 1973, 63, 247–258. [Google Scholar]
- Guo, X.B.; Gu, M.F. The strategic thinking of Hubei’s economic development by leaps and bounds under the new normal: Based on the perspective of late-mover advantage. Hubei Soc. Sci. 2015, 8, 55–60. [Google Scholar]
- Xue, L.A. Review of late-mover advantage strategies and research on development of western in China. Econ. Trade Update 2019, 4, 102–103. [Google Scholar]
- Abramovitz, M. Catching up, forging ahead, and falling behind. J. Econ. Hist. 1986, 46, 385–406. [Google Scholar] [CrossRef]
- Dahlman, C.J.; Nelson, R. Social absorption capability, national innovation systems and economic development. In Social Capability and Long-Term Economic Growth; Palgrave Macmillan: London, UK, 1995; pp. 82–122. [Google Scholar]
- Roper, S.; Love, J.H. Innovation and regional absorptive capacity: The labour market dimension. Ann. Reg. Sci. 2006, 40, 437–447. [Google Scholar] [CrossRef]
- Kallio, A.; Harmaakorpi, V.; Pihkala, T. Absorptive capacity and social capital in regional innovation systems: The case of the Lahti region in Finland. Urban Stud. 2009, 47, 303–319. [Google Scholar] [CrossRef]
- Inzelt, A. The evolution of university–industry–government relationships during transition. Res. Policy 2004, 33, 975–995. [Google Scholar] [CrossRef]
- Smit, M.J.; Abreu, M.; De Groot, H.L.F. Micro-evidence on the determinants of innovation in the Netherlands: The relative importance of absorptive capacity and agglomeration externalities. SSRN Electron. J. 2010, 94, 249–272. [Google Scholar] [CrossRef][Green Version]
- Perkmann, M.; Neely, A.; Walsh, K. How should firms evaluate success in university-industry alliances? A performance measurement system. R D Manag. 2011, 41, 202–216. [Google Scholar] [CrossRef]
- Bercovitz, J.; Feldman, M. The mechanisms of collaboration in inventive teams: Composition, social networks, and geography. Res. Policy 2011, 40, 81–93. [Google Scholar] [CrossRef]
- Basile, R.; Capello, R.; Caragliu, A. Technological interdependence and regional growth in Europe: Proximity and synergy in knowledge spillovers. Pap. Reg. Sci. 2012, 91, 697–722. [Google Scholar] [CrossRef]
- Cassi, L.; Plunket, A. Proximity, network formation and inventive performance: In search of the proximity paradox. Ann. Reg. Sci. 2014, 53, 395–422. [Google Scholar] [CrossRef]
- Jaffe, A. Technological Opportunity and Spillovers of R&D: Evidence from Firms’ Patents, Profits and Market. Value; (No. w1815); National Bureau of Economic Research: Cambridge, MA, USA, 1986. [Google Scholar]
- Branstetter, L.G.; Mariko, S. When do research consortia work well and why? Evidence from Japanese panel data. Am. Econ. Rev. 2002, 92, 143–159. [Google Scholar] [CrossRef]
- Benner, M.; Waldfogel, J. Close to you? Bias and precision in patent-based measures of technological proximity. Res. Policy 2008, 37, 1556–1567. [Google Scholar] [CrossRef]
- Janssen, M.J.; Bogers, M.; Wanzenböck, I. Do systemic innovation intermediaries broaden horizons? A proximity per-spective on R&D partnership formation. Ind. Innov. 2020, 27, 605–629. [Google Scholar]
- Wei, H.; Yu, S.S. The effect of institutional proximity in non-local university–industry collaborations: An analysis based on Chinese patent data. Res. Policy 2013, 42, 454–464. [Google Scholar]
- Smith, N.; Thomas, E. Regional conditions and innovation in Russia: The impact of foreign direct investment and absorptive capacity. Reg. Stud. 2016, 51, 1412–1428. [Google Scholar] [CrossRef]
- Pavitt, K.; Soete, L. International differences in economic growth and the international location of innovation. Emerg. Technol. Conseq. Econ. Growth Struct. Chang. Employ. 1982, 105–133. [Google Scholar]
- Fagerberg, J. Why growth rates differ. Tech. Chang. Econ. Theory 1988, 432–457. [Google Scholar]
- Benhabib, J.; Spiegel, M.M. The role of human capital in economic development evidence from aggregate cross-country data. J. Monetary Econ. 1994, 34, 143–173. [Google Scholar] [CrossRef]
- Engelbrecht, H.J. International R&D spillovers, human capital and productivity in OECD economies: An empirical inves-tigation. Eur. Econ. Rev. 1997, 41, 1479–1488. [Google Scholar]
- Azagra-Caro, J.M.; Archontakis, F.; Gutiérrez-Gracia, A.; Fernández-De-Lucio, I. Faculty support for the objectives of university–industry relations versus degree of R&D cooperation: The importance of regional absorptive capacity. Res. Policy 2006, 35, 37–55. [Google Scholar] [CrossRef][Green Version]
- Wang, H.H.; Wang, M.Y.; Sun, Y.J. Study on the effect of Multidimensional proximity on regional industry-university cooperative innovation: Static and dynamic effects. Sci. Technol. Prog. Policy 2019, 36, 44–50. [Google Scholar]
- Zhang, K.; Qian, Q.; Zhao, Y. Evolution of Guangzhou biomedical industry innovation network structure and its proximity mechanism. Sustain. J. Rec. 2020, 12, 2456. [Google Scholar] [CrossRef]
- Xia, L.J.; Xie, F.J.; Wang, H.H. The impact of institutional proximity and technological proximity on industry–university collaborative innovation performance: An analysis of joint-patent data. Stud. Sci. Sci. 2017, 35, 782–791. [Google Scholar]
- Lin, J.Y.; Wang, X. The facilitating state and economic development: The role of the state in new structural economics. Man Econ. 2017, 4, 1–19. [Google Scholar] [CrossRef]


Publisher’s Note: MDPI stays neutral with regard to jurisdictional claims in published maps and institutional affiliations. |
© 2021 by the authors. Licensee MDPI, Basel, Switzerland. This article is an open access article distributed under the terms and conditions of the Creative Commons Attribution (CC BY) license (http://creativecommons.org/licenses/by/4.0/).