Abstract
The extraction of coalbed methane produces a significant amount of coalbed methane co-produced water (CBMW). Coalbed methane co-produced water is often characterized by high levels of pH, total dissolved solids (TDS), sodium (Na) and bicarbonate (HCO−3) and if used for irrigation without treatment, it may be detrimental to the surrounding soil, plants and environment. CBMW ideally should be disposed of by reinjection into the ground, but because of the significant cost associated, CBMW is commonly discharged onto soil or water surfaces. This study was conducted to elucidate the effect of the CBMW (with TDS value of <1500 ppm) at various blending ratios with fresh water on the yield and quality of representative forage crops [i.e., oat (Avena sativa) and alfalfa (Medicago sativa)]. Various blends of CBMW with fresh water reduced fresh and dry weight of alfalfa by 21.5–32% and 13–30%, respectively, and fresh and dry weight of oat by 0–17% and 0–14%, respectively. Irrigation with various blends of CBMW and fresh water increased soil pH and soil sodium adsorption ratio. However, forage quality parameters such as crude protein (CP), acid detergent fiber (ADF), neutral detergent fiber (NDF), total digestible nutrients (TDN) and relative feed value (RFV) of both forage crops remained unaffected.
1. Introduction
Coalbed methane is a natural gas produced in underground coal seams through a biogeophysical process and is subsequently extracted by pumping water through the seams. Pumping of water lowers the pressure in the seam to release trapped methane, this gas then moves towards the surface and is collected by a separation technique [1,2]. The resulting pumped water, called coalbed methane co-produced water (CBMW), is a major byproduct of coalbed methane extraction. This discharged water typically has high pH, contains elevated concentrations of sodium (Na), bicarbonates (HCO3) and total dissolved solids (TDS) and also has a high sodium adsorption ratio (SAR). Trace amounts of barium (Ba), boron (B), sulfate, calcium (Ca), chlorine (Cl), magnesium (Mg) and potassium (K) can also be detected in this water [2,3,4]. Nonetheless, concentrations of the constituents, as mentioned above, vary by wells and locations [2]. Water with a high level of those substances can be detrimental to the soil, plants and the environment.
Coalbed methane production is rising globally and the U.S has the largest coal reserves in the world [5]. In 2017, the U.S. produced approximately 27.8 billion m3 of coalbed methane that will likely continue in the future as the U.S. hold 3.4 trillion m3 of economically recoverable coalbed methane reserves [6,7]. In the same year, the production of CBMW was estimated to be somewhere from 77 to 428 million m3 [7,8]. The state of Wyoming has the highest water to gas discharge ratio for coalbed methane extraction compared to other wells in the U.S. and thus, produce a significant amount of CBMW [7,8]. The best method to dispose CBMW is through reinjection into the ground. However, the cost associated with this method of disposal is very high; therefore, the Environmental Protection Agency (EPA) has relaxed its guidelines for CBMW disposal [9], leading to CBMW being disposed of on soil or surface waters.
Arid zones are in dire need of continuous fresh water supply for irrigation during the production season. In the U.S., even if the arid states have enough freshwater resources, existing water laws of interstate stream agreements do not allow that state to use its water resources completely. Instead, it has to provide a certain amount of water to other nearby states. Hence, states such as Wyoming experience freshwater shortages [10,11,12]. To address freshwater shortages and to increase the use of alternative water sources, good quality CBMW could potentially be used for the irrigation of forage crops [13]. However, studies on exploring the use of CBMW for irrigation of forage crops are limited. In some of the few related studies, irrigation with a mixture of CBMW and fresh water in specific ratios was found to be as equally effective as irrigation with tap water alone [14,15]. In addition, irrigation of dill (Anethum graveolens) with different ratios of CBMW and fresh water did not affect plant height and plant weight [16]. Thus, there remains the possibility of using CBMW as a source of irrigation for forages.
The majority of farmers in Wyoming grow forages; the state produced approximately 2.5 million tons of hay (forage) in 2017, of which 63.5% was alfalfa [17]. According to a six-year report (2003–2008), a 50% decrease in the yield of alfalfa was observed on non-irrigated land compared to irrigated land [18]. Alfalfa and oat both can tolerate moderate salinity. Alfalfa can also tolerate sodicity, while oat is semi-tolerant to sodicity [19,20] and these are usually considered representative forage crops. Hence, these forage crops make good candidates for production in saline-sodic soil. If irrigation with CBMW alone or at various blend ratios with fresh water can sustain forage yield and quality without impairing soil characteristics, CBMW disposal as irrigation can be well justified. In addition, CBMW produced in the state of Wyoming is of better quality compared to the national average, with TDS value of <1500 ppm and pH value of <8.9 [2]. Therefore, we conducted a greenhouse study to explore the use of CBMW at various blend ratios with fresh water on oat and alfalfa. Fresh water in our study refers to potable water supplied by the Sheridan municipal water plant. The objective of this study was to determine the effects of CBMW irrigation treatments on yield and quality of those forage crop, while also outlining changes in soil characteristics.
2. Materials and Methods
2.1. Plant Materials and Growing Conditions
This experiment was conducted at the University of Wyoming’s Sheridan Research and Extension Center in Sheridan, Wyoming, from 3 October 2014 to 10 March 2015. Coalbed methane co-produced water used in this study was hauled each week from BeneTerra LLC in Sheridan, WY, USA. The quality of CBMW was analyzed and the results are presented in Table 1. Alfalfa and oat were grown in a greenhouse, which allowed us to control external conditions and make precise treatment applications. The temperature in the greenhouse was set to 26 °C during the day and 18 °C during the night. The relative humidity ranged from 50 to 60%. These are the optimal growth conditions for both oat and alfalfa [21,22,23]. Cultivar (cv.) Monida of oat (Avena sativa) and cv. WL363HQ of alfalfa (Medicago sativa) were used in this study. Certified seeds were obtained from the Sheridan Research and Extension Center and sowed (1.2 cm deep) in plastic containers (11.4 L volume, 25 cm deep and 28 cm diameter) on 3 October 2014 and left to germinate. Germination percentage for oat and alfalfa was 92 and 90, respectively. A Hargreave–Moskee sandy loam was used in this container study, as described in Web Soil Survey [24] Each container was filled with 10 kg of clay loam soil that was high in organic matter (Table 2). Soil was homogenized by digging 15 cm top layer of a field soil and then mixing the soil before filling in the pots. The experiment was carried out in six replications without initial fertilization. On 10 December 2014, 5 g of 20:20:20 general-purpose fertilizer (Jack’s Professional, JR Peters. Inc, Allentown, PA, USA) was applied to both crops mixed with irrigation water. An additional 5 g of fertilizer/pot application applied on 15 January 2015 for alfalfa only. Before complete germination and emergence, irrigation was carried out manually by pouring 600 mL of fresh water into each pot every three days until 13 October 2014. Complete emergence of the oat and alfalfa was observed on 13 October 2014 after which the irrigation treatment was started. The irrigation treatments contained the following mixture of CBMW and fresh water: 0% CBMW (fresh water only); 25% CBMW (25% CBMW and 75% fresh water); 50% CBMW (50% CBMW and 50% fresh water); 75% CBMW (75% CBMW and 25% fresh water); and 100% CBMW. Each pot received a 300 mL aliquot of either 0, 25, 50, 75 or 100% CBMW that was hand-applied every day with few adjustments in water usage based on sunny and cloudy days. Plants in each pot were thinned to 12 plants per container on 31 October 2014 and pots were frequently moved around the greenhouse to maintain uniformity and randomization.

Table 1.
Properties of pure coal bed methane co-produced water (CBMW) and fresh water used in greenhouse study at Sheridan, WY, USA, for irrigating oat and alfalfa.
Table 2.
pH, organic matter (OM), electrical conductivity (EC), sodium adsorption ratio (SAR), potassium, calcium, magnesium and sodium concentration of soil used for alfalfa and oat study.
2.2. Harvesting and Drying
Crops were harvested at commercial maturity; oat was harvested once on 30 November 2014 and alfalfa thrice on 7 January 2015, 5 February 2015 and on 10 March 2015. Alfalfa was harvested when 10–15% of the plants started flowering and oat was harvested at the early milk stage, as these stages are optimal harvesting stage for highest forage nutritive value [25,26]. Crops were hand harvested with clippers at 5-6 cm above the soil surface and fresh weights were recorded immediately. Both crops were then packed in paper bags and dried in an oven for 24 h at 65 °C to determine dry weight. Samples were then sent to commercial, National Forage Testing Association (NFTA), certified Laboratory (American Agricultural Laboratory, Inc, McCook, NE, USA) for analysis of forage nutritive value. All the nutritive values parameters were determined on dry matter. For alfalfa, only the final harvest samples were sent for analysis of forage nutritive value. After completion of the study, soil samples from the top 15 cm were also sent to the National Forage Testing Association (NFTA) certified Laboratory (American Agricultural Laboratory, Inc., McCook NE, http://www.olsenlab.com/ accessed on 18 March 2021) for analysis.
2.3. Statistical Analysis
The study involved five different CBMW treatments with six replications per treatment and two crop types. All plants were randomly arranged in the greenhouse. A two-factor factorial analysis of variance was performed for CBMW treatments, crop types and CBMW x crop interaction. Coalbed methane co-produced water treatments, crop types and CBMW x crop interaction were significant (p-value < 0.05) for pH, Na, SAR, total fresh weight and total dry weight. Hence, separate statistical analyses were performed by plant types using the one-way analysis of variance. Forage nutrient quality parameters only differed by plant type (p-value < 0.05), hence, all those parameters were pooled for various CBMW treatments. All the statistical analysis were conducted in JMP®, Version 14.0.0 (SAS Institute Inc., Cary, NC, USA). Post-hoc mean comparisons were performed using the Fisher’s least significant difference test at p-value < 0.05. Regression analysis was performed on data for fresh and dry weight. Models were verified by checking scatter plots of residuals. Both fresh and dry weight of alfalfa followed quadratic regression model while fresh and dry weight of oat followed simple linear model.
where Y is either the fresh weight or dry weight of oat, a is the intercept at Y axis, b is the slope of the line and X is the percentage of CBMW.
where Y is either the fresh weight or dry weight of alfalfa, a is the intercept at Y axis, b1 and b2 are the slope of the curve and X is the percentage of CBMW.
Y = a + bX (Linear model); Oat
Y = a + b1X + b2X2 (Quadratic model); Alfalfa
3. Results
3.1. Alfalfa Yield and Quality
The application of CBMW reduced fresh weight and dry weight of alfalfa, while its forage quality remained unchanged. Alfalfa was harvested three times and the combined fresh weight and dry weight for all three harvests were highest (102.2 g and 22.9 g per pot, respectively) at the 0% CBMW treatment and lowest (67.9 g and 16.5 g per pot, respectively) with the 100% CBMW treatment (Figure 1). Both fresh weight and dry weight gradually decreased with increasing levels of CBMW treatment until 50% CBMW treatment and then plateaued. Coalbed methane co-produced water treatments did not alter forage characteristics such as crude protein, acid detergent fiber, neutral detergent fiber, total digestible nutrients, net energy for maintenance, net energy for lactation, net energy gain and relative feed value (Table 3).
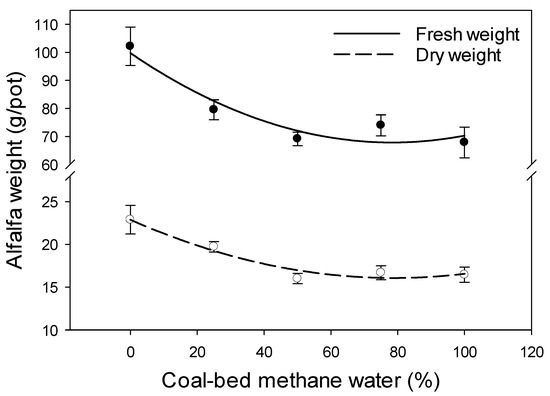
Figure 1.
Mean of total fresh weight and dry weight of alfalfa (Medicago sativa) for six replicates irrigated with various percentages of coalbed methane co-produced water (CBMW). Standard errors of each mean are drawn as capped lines extended vertically from each mean. Irrigation treatments contained the following mixture of CBMW and fresh water: 0% CBMW (fresh water only); 25% CBMW (25% CBMW and 75% fresh water); 50% CBMW (50% CBMW and 50% fresh water); 75% CBMW (75% CBMW and 25% fresh water); and 100% CBMW. Plants received CBMW treatments for 150 days. Both fresh weight (r-square = 0.54) and dry weight (r-square = 0.55) followed quadratic regression curve with p-value of <0.0001. Y = 100.3 − 0.085x + 0.0055X2 and Y = 23 − 0.181x + 0.0012X2 represents equation for fresh weigh and dry weight, respectively; where Y is total weight and x is the % of CBMW.
Table 3.
Mean value of crude protein (CP), acid detergent fiber (ADF), neutral detergent fiber (NDF), total digestible nutrients (TDN), net energy lactation (NEL), net energy maintenance (NEM), net energy gain (NEG) and relative feed value (RFV) of alfalfa (Medicago sativa) and oat (Avena sativa) for six replicates.
Increasing concentration of CBMW treatments increased soil pH. Soil pH was lowest (7.33) at 0% CBMW treatment and increased with increasing levels of CBMW treatments and was highest (pH 9.03) at the 100% CBMW treatments. Coalbed methane co-produced water application did not alter electrical conductivity (EC) or organic matter (OM) of soil with alfalfa. However, SAR and Na concentration in the soil increased drastically from 0.64 and 154.3 ppm, respectively, with 0% CBMW treatment to 12.37 and 2940 ppm, respectively with 100% CBMW treatment. The concentrations of Mg and Ca were highest (867.67 ppm and 2170 ppm, respectively) at 0% CBMW treatment, that slightly decreased with 50% CBMW and then did not change (Table 4).
Table 4.
Mean of pH, organic matter (OM), electrical conductivity (EC), sodium adsorption ratio (SAR), potassium, calcium, magnesium and sodium of soils irrigated with various percentages of coalbed methane co-produced water (CBMW) at the end of alfalfa (Medicago sativa) study.
Irrigation treatments contained the following mixture of CBMW and fresh water: 0% CBMW (fresh water only); 25% CBMW (25% CBMW and 75% fresh water); 50% CBMW (50% CBMW and 50% fresh water); 75% CBMW (75% CBMW and 25% fresh water); and 100% CBMW. Plants received CBMW treatments for 150 days. Mean separations were carried out using Fisher’s least significant difference test at p-values < 0.05. Means within each column followed by the same letters are not significantly different at given p-values of 0.05.
3.2. Oat Yield and Quality
Similar to alfalfa, CBMW treatments influenced fresh weight and dry weight of oat, but its forage quality remained unchanged. The fresh weight and dry weight were highest (99.3 g and 18.0 g, respectively) for the 25% CBMW treatment and were lowest (78.2 g and 15.4 g, respectively) for the 100% CBMW treatment (Figure 2). Both fresh yield and dry weight showed gradual decreasing trends with increasing levels of CBMW treatment. Similar to the forage quality parameters of alfalfa, there was no significant effect of CBMW treatments on forage quality parameters (Table 3).
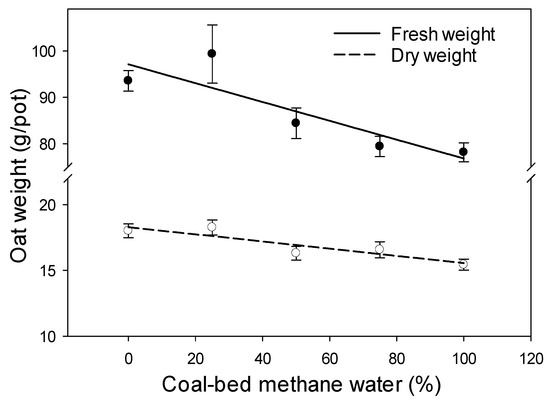
Figure 2.
Mean of total fresh weight and dry weight of oat (Avena sativa) for six replicates irrigated with various percentages of coal-bed methane co-produced water (CBMW). Standard errors of each mean are drawn as capped lines extended vertically from each mean. Irrigation treatments contained the following mixture of CBMW and fresh water: 0% CBMW (fresh water only); 25% CBMW (25% CBMW and 75% fresh water); 50% CBMW (50% CBMW and 50% fresh water); 75% CBMW (75% CBMW and 25% fresh water); and 100% CBMW. Plants received CBMW treatments for 45 days. Both fresh weight (r-square = 0.4) and dry weight (r-square = 0.37) followed linear regression curve with p-value of <0.0001. Y = 97.1 − 0.2x and Y = 18.3 − 0.027x represents equation for fresh weigh and dry weight, respectively; where Y is total weight and x is the % of CBMW.
The CBMW treatments altered soil characteristics in pots with oats. Soil pH increased from 7.53 at 0% CBMW to 8.10 at 100% CBMW treatments. Electrical conductivity was similar at the 0, 25, 50 and 75% CBMW treatments but was higher at the 100% CBMW treatment. The SAR and Na concentrations were lowest (0.62 and 152 ppm, respectively) for the 0% CBMW treatment and drastically increased (3.38 and 745 ppm, respectively) for the 100% CBMW treatment. Calcium concentration decreased with increasing levels of CBMW treatments, but the concentrations of K and Mg remained unchanged (Table 5).
Table 5.
Mean of pH, organic matter (OM), electrical conductivity (EC), sodium adsorption ratio (SAR), potassium, calcium, magnesium and sodium of soil irrigated with various percentage coalbed methane co-produced water (CBMW) at the end of oat (Avena sativa) study.
4. Discussion
Alfalfa was harvested during the 10–15% blossom stage to optimize forage yield and quality [25]. The maximum fresh and dry weights were obtained with the 0% CBMW treatment. As the level of CBMW application increased, the values of soil pH, Na concentration and SAR increased, resulting in soil that was saline for the 25, 50 and 75% CBMW treatments and saline-sodic for the 100% CBMW treatment [20]. Saline and saline-sodic conditions reduced yield of alfalfa as alfalfa best performs in a soil with pH of 6.5–7.5 [27]. Increasing salinity and sodicity can lower the yield of forage crops including alfalfa [28,29,30]. In a study performed by Cornacchione and Suarez [30], increasing soil salinity levels proportionally reduced fresh weight of alfalfa. Similarly, the 50, 75 and 100% CBMW treatments in our study also reduced alfalfa fresh yields by 27–30%. Fresh weight is highly correlated with dry weight and this was evident in our study where 50–100% of CBMW treatments reduced dry weight of alfalfa by 28–30%. For alfalfa, dry weight in this study, was 21–25% of the fresh weight, which was slightly lower than the value (26–32%) reported by Khosrowchahli et al. (2013) [31].
Oat was harvested at the start of the early milk stage to obtain desirable forage yield and quality [26]. Forage oat is tolerant to soil salinity with only slight reductions in yield at saline conditions [20,32]. In this study, soil sampling after harvest indicated that the soil was in the category of slightly saline (25, 50 and 75% CBMW) to saline (100% CBMW) conditions [33]. Fresh and dry weights of the forage crop were higher at the 0 and 25% CBMW treatments, which indicated that the oat variety used in this study was tolerant to 25% CBMW treatments; however, CBMW at 50% and above induced salinity stress and reduced fresh and dry yield of oat similar to that found in other studied on oat and alfalfa [34,35]. Chatrath et al. (2000) also found an increase in salinity for various oat varieties reduced photosynthesis rates, which in turn reduced the yield of oat varieties [36]. In another similar study, yield of oat was negatively correlated to soil salinity levels [37].
Crude protein, acid detergent fiber, total digestible nutrients, neutral detergent fiber, net energy for lactation, net energy for maintenance, net energy gain and relative feed value cumulatively represent forage nutritive value and all those forage characteristics remained unchanged across the CBMW treatments, both for oat and alfalfa. Forage nutritive value of alfalfa fell under an excellent category based on forage quality analysis and was not affected by CBMW treatments, which may be due to salt tolerant variety selection and growth in optimum environmental conditions [38,39,40]. In a similar study, nutrient quality of various forages crops were unaffected by soil salinity, sodicity and minor change in pH, but their yields were reduced [41,42,43].
For oat, the percentage of total digestible nutrients were more than 71.2% and the relative feed value was more than 140. These values were superior to other reported studies [44,45] and indicate forage of superior quality [26]. Crude protein of oat in our study was very high, which may be explained by early harvesting stages of oat, higher percentage of leaves and calculation of crude protein done for 100% dry matter. Some previous studies have also reported crude protein of oat to be in the range that we observed [46,47].
Soil characteristics under both crops changed with the application of the CBMW treatments, with more significant changes in the alfalfa experiment compared to the oat experiment. Sodium and other salts present in CBMW increased soil pH, SAR and Na concentration. A similar greenhouse study also observed changes in soil characteristics, as was the case in this study [14]. Various other research works conducted to explore the application of CBMW as an alternative source of irrigation have also observed similar trends [15,16,48]. The observed differential response in soil under different crops is most probably due to the fact that alfalfa received CBMW treatments for approximately 150 days, while oat had the treatments for 45 days. Hence, it should be noted that the application of CBMW will significantly change the soil characteristics and therefore, irrigation with CBMW may not be suitable from the perspective of soil quality. We used field soil in our study to accurately determine the consequences of CBMW irrigation in the field; however, greenhouse conditions are different from field conditions. Sodium and other salts accumulated through irrigation with CBMW in the field may leach below the root zone or disperse into the surrounding soil, lowering Na concentration and SAR as seen in a three-year field study [49]. Therefore, long-term field research is needed to identify and explore the full effect of CBMW on soil properties.
5. Conclusions
For alfalfa, both fresh and dry weight decreased with increasing levels of CBMW application and the decrease in fresh weight was between 22 and 33.5%. However, CBMW did not change the forage nutritive value of alfalfa. Thus, the application of CBMW alone or mixed with fresh water may be a suitable alternative for irrigation where fresh water sources are not available. For oat, both fresh and dry weight were very similar at 0 and 25% CBMW, after which the fresh weight started to decrease with increasing levels of CBMW treatments. However, the nutrient value of forage oat was similar in all treatments; therefore, 3:1 blend ratio of CBMW to fresh water could be used for irrigating oat without a significant reduction in yield. There is the possibility of achieving similar results by alternating irrigation with fresh water and CBMW where the dilution is not feasible, however, further research is needed to accurately verify that assumption. In addition, in this study, we grew crops that are slightly to moderately tolerant to saline and sodic conditions and results may differ if sensitive crops are grown using CBMW.
Author Contributions
Conceptualization, investigation, methodology, visualization, writing—original draft preparation and software, S.P.; validation, resources, supervision, funding acquisition, project administration, V.D.Z.; formal analysis, data curation, writing—review and editing, S.P. and V.D.Z. All authors have read and agreed to the published version of the manuscript.
Funding
This research was supported by the University of Wyoming School of Energy funds awarded to Valtcho D. Zheljazkov (Jeliazkov).
Institutional Review Board Statement
Ethical approval was not required by the lead authors institutions.
Informed Consent Statement
Informed consent was obtained from all subjects involved in the study.
Data Availability Statement
Original data is available from the authors.
Acknowledgments
The authors thank Derek Lowe of BeneTerra LLC, in Sheridan, WY, for providing access to coal-bed methane water and Dan Smith the farm manager at the University of Wyoming’s Sheridan Research and Extension Center, Sheridan. The article processing charges were paid by the Oregon State University startup funds awarded to Valtcho D. Jeliazkov (Zheljazkov).
Conflicts of Interest
The authors declare no conflict of interest.
References
- McBeth, I.H.; Reddy, K.J.; Skinner, Q.D. Coalbed methane product water chemistry in three Wyoming watersheds. J. Am. Water Resour. Assoc. 2003, 39, 575–585. [Google Scholar] [CrossRef]
- U.S. EPA. Coalbed Methane Extraction: Detailed Study Report; United States Environmental Protection Agency (US EPA): Washington, DC, USA, 2010.
- Horpestad, A. Water Quality Analysis of the Effects of CBM Produced Water on Soils, Crop Yields and Aquatic Life. Montana Department of Environmental Quality. 2001. Available online: https://deq.mt.gov/Portals/112/Energy/CoalbedMethane/Documents/Criteria-sar-EC-h.pdf (accessed on 22 June 2020).
- Kinnon, E.C.P.; Golding, S.D.; Boreham, C.J.; Baublys, K.A.; Esterle, J.S. Stable isotope and water quality analysis of coal bed methane production waters and gases from the Bowen Basin, Australia. Int. J. Coal Geol. 2010, 82, 219–231. [Google Scholar] [CrossRef]
- Al-Jubori, A.; Johnston, S.; Boyer, C.; Lambert, S.W.; Bustos, O.A.; Pashin, J.C.; Wray, A. Coalbed methane: Clean energy for the world. Oilf. Rev. 2009, 21, 4–13. [Google Scholar]
- Nuccio, V. Coal-Bed Methane: Potential and Concerns; United States Geological Survey: Reston, VA, USA, 2000.
- U.S. Energy Information Administration. Coalbed Methane Production. Available online: https://www.eia.gov/dnav/ng/ng_prod_coalbed_s1_a.htm (accessed on 22 June 2020).
- Rice, C.A.; Nuccio, V. Water Produced with Coal-Bed Methane; United States Geological Survey: Reston, VA, USA, 2000.
- U.S. EPA Office of Water. Final 2012 and Preliminary 2014 Effluent Guidelines Program Plans; United States Environmental Protection Agency (US EPA): Washington, DC, USA, 2014.
- Hansen, K.; Nicholson, C.; Paige, G. Wyoming’s Water: Resources and Management; University of Wyoming Extension: Torrington, WY, USA, 2015. [Google Scholar]
- Chaudhry, A.M.; Barbier, E.B. Water and growth in an agricultural economy. Agric. Econ. 2013, 44, 175–189. [Google Scholar] [CrossRef]
- Jacobson, J.J.; Brosz, D.J. Wyoming’s Water Resources. Cooperative Extension Service College of Agriculture Wyoming Water Resources. 1993. Available online: http://library.wrds.uwyo.edu/wrp/93-12/93-12.html (accessed on 22 June 2020).
- ALL Consulting. Consulting. Handbook on Coal Bed Methane Produced Water: Management and Beneficial Use Alternatives; ALL Consulting: Tulsa, OK, USA, 2003. [Google Scholar]
- Zheljazkov, V.D.; Cantrell, C.L.; Astatkie, T.; Schlegel, V.; Jeliazkova, E.; Lowe, D. The effect of coal-bed methane water on spearmint and peppermint. J. Environ. Qual. 2013, 42, 1815–1821. [Google Scholar] [CrossRef] [PubMed]
- Burkhardt, A. Effects of Coal Bed Methane Water on Soil Characteristics and Plant Secondary Metabolites; University of Wyoming: Laramie, WY, USA, 2014. [Google Scholar]
- Poudyal, S.; Zheljazkov, V.D.; Cantrell, C.L.; Kelleners, T. Coal-bed methane water effects on dill and its essential oils. J. Environ. Qual. 2016, 45, 728. [Google Scholar] [CrossRef] [PubMed]
- USDA-NASS. Wyoming Agriculture. National Agricultural Statistics Service. 2018. Available online: https://quickstats.nass.usda.gov/ (accessed on 22 June 2020).
- USDA-NASS. Wyoming Field Office Wyoming Agriculture Statistics: 2013. Wyoming Business Council University Wyoming U.S. Department Agricultural. 2013. Available online: https://www.nass.usda.gov/Statistics_by_State/Wyoming/Publications/Annual_Statistical_Bulletin/bulletin2013.pdf (accessed on 22 June 2020).
- El-Swaify, S.A. Soil and Water Salinity. In Plant Nutrient Management in Hawaii’s Soils, Approaches for Tropical and Subtropical Agriculture; Silva, J.A., Uchida, R., Eds.; College of Tropical Agriculture and Human Resources, University of Hawaii at Manoa: Honolulu, HI, USA, 2000; pp. 151–158. [Google Scholar]
- McCauley, A.; Jones, C. Salinity & Sodicity Management. Soil Water Management. Module. Montana State University Extension. 2005. Available online: http://landresources.montana.edu/swm/documents/Final_Proof_SW2.pdf (accessed on 22 June 2020).
- Shanahan, J.F.; Dillon, M.A. Oat Production; Colorado State University Extension: Fort Collins, CO, USA, 2003. [Google Scholar]
- Mueller, S.C. Considerations for successful alfalfa stand establishment in the central San Joaquin Valley. In Proceedings of the California Alfalfa and Forage Symposium, Reno, Visalia, CA, 12–14 December 2005; pp. 12–14. [Google Scholar]
- Rahetlah, V.B.; Randrianaivoarivony, J.M.; Razafimpamoa, L.H.; Ramalanjaona, V.L. Effects of seeding rates on forage yield and quality of oat (Avena sativa L.) vetch (Vicia sativa L.) mixtures under irrigated conditions of Madagascar. African Journal of Food, Agriculture, Nutrition and Development. 2010, Volume 10. Available online: http://hdl.handle.net/1807/55673 (accessed on 18 March 2021).
- United States Department of Agriculture. Web Soil Survey. Available online: http://websoilsurvey.nrcs.usda.gov/ (accessed on 30 May 2014).
- Gardisser, D. Harvesting Alfalfa Hay. University Arkansas Cooperative. Extension. Service. Priniting Service. 2005. Available online: https://www.uaex.edu/publications/PDF/FSA-2005.pdf (accessed on 22 June 2020).
- Barnhart, S.K. Oats for Forage. IOWA State University. Agronomy. Extension. 2011. Available online: https://crops.extension.iastate.edu/cropnews/2011/06/oats-forage (accessed on 22 June 2020).
- Redmon, L.A.; Mcfarland, M.L. Soil pH and Forage Production. Texas A&M AgriLife Research and Extension. 2013, pp. 7–9. Available online: https://agrilifecdn.tamu.edu/coastalbend/files/2016/06/Soil-pH-and-Forage-Production.pdf (accessed on 22 June 2020).
- Rasool, S.; Hameed, A.; Azooz, M.M.; Muneeb-u-Rehman; Siddiqi, T.O.; Ahmad, P. Ecophysiology and Responses of Plants under Salt Stress; Ahmad, P., Azooz, M.M., Prasad, M.N.V., Eds.; Springer: New York, NY, USA, 2013; ISBN 978-1-4614-4746-7. [Google Scholar]
- Li, R.; Shi, F.; Fukuda, K.; Yang, Y. Effects of salt and alkali stresses on germination, growth, photosynthesis and ion accumulation in alfalfa (Medicago sativa L.). Soil Sci. Plant Nutr. 2010, 56, 725–733. [Google Scholar] [CrossRef]
- Cornacchione, M.V.; Suarez, D.L. Emergence, forage production, and ion relations of alfalfa in response to saline waters. Crop Sci. 2015, 55, 444–457. [Google Scholar] [CrossRef]
- Khosrowchahli, M.; Houshang, A.; Moghbeli, H. Selection for moderate salinity stress tolerance in alfalfa (Medicago sativa L.) ecotypes. Int. J. Agric. Crop Sci. 2013, 5, 2868–2870. [Google Scholar]
- Hanson, B.R.; Grattan, S.R.; Fulton, A. Agricultural Salinity and Drainage; Program, Division of Agriculture and Natural Resources, Irrigation, University of California, Davis: Davis, CA, USA, 2006. [Google Scholar]
- Davis, J.G.; Waskom, R.M.; Bauder, T.A. Managing Sodic Soils. Colorado State University Extension Service. 2012, p. 2. Available online: https://extension.colostate.edu/topic-areas/agriculture/managing-sodic-soils-0-504/ (accessed on 22 June 2020).
- Shah, S.S.; Li, Z.; Yan, H.; Shi, L.; Zhou, B. Comparative study of the effects of salinity on growth, gas exchange, n accumulation and stable isotope signatures of forage oat (Avena sativa l.) genotypes. Plants 2020, 9, 1025. [Google Scholar] [CrossRef]
- Suyama, H.; Benes, S.E.; Robinson, P.H.; Grattan, S.R.; Grieve, C.M.; Getachew, G. Forage yield and quality under irrigation with saline-sodic drainage water: Greenhouse evaluation. Agric. Water Manag. 2007, 88, 159–172. [Google Scholar] [CrossRef]
- Chatrath, A.; Mandal, P.K.; Anuradha, M. Effect of secondary salinization on photosynthesis in fodder Oat (Avena sativa L.) genotypes. Agron. Crop Sci. 2000, 184, 13–16. [Google Scholar] [CrossRef]
- Bole, J.B.; Wells, S.A. Dryland soil salinity: Effect on the yield and yield components of 6-row Barley, 2-row Barley, wheat, and oats. Can. J. Soil Sci. 1979, 59, 11–17. [Google Scholar] [CrossRef]
- Dunham, J.R. Relative Feed Value Measures Forage Quality. Kansas State University Agricultural Experiment Station and Cooperative Extension Service. 2007. Available online: https://www.asi.k-state.edu/doc/forage/fora41.pdf (accessed on 22 June 2020).
- Lacefield, G.; Ball, D.; Hancock, D.; Andrae, J.; Smith, R. Growing Alfalfa in the South; National Alfalfa & Forage Alliance: St. Paul, MN, USA, 2009. [Google Scholar]
- W-L Research WL 363HQ: Exceptional yield potential. WL Alfalfa 2013. Available online: https://www.wlalfalfas.com/WLAlfalfas/media/PDF/Seed-Guide_2015.pdf?ext=.pdf (accessed on 22 June 2020).
- Masters, D.G.; Benes, S.E.; Norman, H.C. Biosaline agriculture for forage and livestock production. Agric. Ecosyst. Environ. 2007, 119, 234–248. [Google Scholar] [CrossRef]
- Grattan, S.R.; Grieve, C.M.; Poss, J.A.; Robinson, P.H.; Suarez, D.L.; Benes, S.E. Evaluation of salt-tolerant forages for sequential water reuse systems: III. Potential implications for ruminant mineral nutrition. Agric. Water Manag. 2004, 70, 109–120. [Google Scholar] [CrossRef]
- Robinson, P.H.; Grattan, S.R.; Getachew, G.; Grieve, C.M.; Poss, J.A.; Suarez, D.L.; Benes, S.E. Biomass accumulation and potential nutritive value of some forages irrigated with saline-sodic drainage water. Anim. Feed Sci. Technol. 2004, 111, 175–189. [Google Scholar] [CrossRef]
- Riveland, N.R.; Erickson, D.O.; French, E.W. An Evaluation of Oat Varieties for Forage. 1974. Available online: https://library.ndsu.edu/ir/bitstream/handle/10365/4431/farm_35_1_4.pdf?isAllowed=y&sequence=1 (accessed on 22 March 2021).
- Mochon, J.; Conley, S. Wisconsin Oats and Barley Performance Tests—2014. University Wisconsin. 2013. Available online: https://ipcm.wisc.edu/blog/2013/11/wisconsin-oats-and-barley-performance-tests-2014/ (accessed on 22 June 2020).
- Gardner, F.P.; Allen, R.S. Dough Stage Best for Oat Silage; Iowa State University: Ames, IA, USA, 1961. [Google Scholar]
- Contreras-Govea, F.E.; Albrecht, K.A. Forage production and nutritive value of oat in autumn and early summer. Crop. Sci. 2006, 46, 2382–2386. [Google Scholar] [CrossRef]
- Stearns, M.; Tindall, J.; Cronin, G.; Friedel, M. Effects of coal-bed methane discharge waters on the vegetation and soil ecosystem in Powder River Basin, Wyoming. Water Air Soil 2005, 168, 33–57. [Google Scholar] [CrossRef]
- Poudyal, S. Utilization of Coal Bed Methane Water (CBMW) for Irrigation of Forage, Medicinal and Bio-fuel Crops; University of Wyoming: Laramie, WY, USA, 2015; ISBN 9781339679815. [Google Scholar]


Publisher’s Note: MDPI stays neutral with regard to jurisdictional claims in published maps and institutional affiliations. |
© 2021 by the authors. Licensee MDPI, Basel, Switzerland. This article is an open access article distributed under the terms and conditions of the Creative Commons Attribution (CC BY) license (http://creativecommons.org/licenses/by/4.0/).