Article

Strategic Investment Decisions for Emerging Technology Fields in the Health Care Sector Based on M&A Analysis

1
School of Business, Sejong University, Seoul 05006, Gwangjin-gu, Korea
2
Department of IT Management, Hanshin University, Osan-si 18001, Gyeonggi-do, Korea
*
Author to whom correspondence should be addressed.
Sustainability 2021, 13(7), 3644; https://doi.org/10.3390/su13073644
Submission received: 11 January 2021 / Revised: 19 March 2021 / Accepted: 23 March 2021 / Published: 25 March 2021
(This article belongs to the Special Issue Sustainable Enterprise Excellence and Innovation)

Abstract

:
The existing approaches to identification of emerging technologies create a prominent opportunity for technology convergence and market growth potential. However, existing approaches either suffer from the time lag issue or have yet to explorethe assessment’s uncertainty and ambiguity. Based on a total of 14 years of mergers and acquisitions (M&A) activity data in the Health Care sector, the complex patterns between growth velocity and accelerating of M&A activities are analyzed with two quantitative indicators (Promising Index and Promising Index Sharpe Ratio) to identify emerging technological opportunities. The proposed integrative approach offers a mean to resolve the time lag issue, deal with market trend irregularity, and manage expectations of investors for emerging technology and industry. Specifically, this study aims to (i) provide a decision support system integrating M&A activity information for strategic investment planning and (ii) identify promising technologies in the Healthcare sector to manage the irregularities of market trend and investment outcome. This study is one of the first research that employs a prior data-based approach to delineate emerging technologies by analyzing the growth momentum properties of specific industry areas based on the M&A activity data.

1. Introduction

As the global competitive environment continues to change and become more complex, there is a growing awareness of the need to improve long-term sustainability as well as short-term performance with its own technology and information system requirements [1,2]. In particular, policymakers and managers are being increasingly required to identify emerging technologies and industries, and then to select the best research and development (R&D) target among various alternatives. If firms fail to predict and respond to changing technology trends in a fast-paced industrial environment, then they will experience uncertainty related to the technology success and suffer from an inefficient return on investment. Furthermore, they will experience difficulties in securing a sustainable competitive advantage in a highly competitive environment [3].
In general, many firms struggle to diversify and grow, owing to a lack of knowledge on diversification and an inability to effectively commercialize opportunities. Attempting to predict emerging technologies is a challenging task, because there are limited historical data on which to base such predictions [4]. Several forecasting methods have been proposed to overcome these difficulties, including judgmental approaches [5,6,7,8] and bibliometric analysis methods [9,10,11,12]. Existing methodologies effectively help to identify the most recent technological trends and discover hidden patterns in information on authors, inventors, affiliations, recent research, and patents [5]. However, these results often include a time lag issues [13,14,15,16]. Consequently, it is limited in effectively exploring emerging research and technology fields. In particular, timely analyses of emerging topics in science and technology are difficult, because bibliometric data cannot resolve a time lag between availability and analysis [17,18,19].
Of the abovementioned difficulties, this study focuses on resolving the time lag issue by proposing a new methodology that recommends emerging technologies and industries based on mergers and acquisitions (M&A) activity information. Emerging technology represents promising industries and technologies that have seen rapid growth and advancement in recent years. M&A data include dynamic linkages between industries and technologies through the relationships of participating firms. Thus, it is useful to analyze the correlations and convergences between industries, businesses, and technology fields. Past studies have shown that most M&A activities are related to emerging technology fields, and that it can be used as a framework within which to identify emerging technology and industry areas, or for exploring new market opportunities for future collaboration.
To this end, this study raises the following questions: (i) how to utilize M&A activity information to improve the overall the uncertainty and ambiguity of technology assessment? Additionally, (ii) how can technology and R&D investors identify trends of emerging technology and make strategic investment decisions? This study’s objectives include (i) providing decision support system utilizing M&A activity information for strategic investment planning, and (ii) identifying promising technologies in the Healthcare sector while managing the irregularities of market trend and investment outcome. The significance of the proposed methodology is that it is an analytic method that is based on prior M&A activity data that do not contain a time lag issue, and that it is usable for exploring new business opportunities.
The remainder of the paper is organized as follows. Section 2 presents a review of the related literature. Section 3 proposes a research framework and defines the decision models for estimating the growth momentum properties of M&A activities to identify emerging technology fields based on the historical M&A data. In Section 4, the M&A trends are elaborated based on a longitudinal analysis of sub-industries in the Health Care sector. Section 5 presents a cross-sectional analysis to determine which technology fields are most promising in specific periods. Here, emerging sub-industries in the Health Care sector are identified using the proposed decision models that are composed of two quantitative indicators, Promising Index (PI) and Promising Index Sharpe Ratio (PISR). Furthermore, the web-based prototype system, Promising Index Sharpe Ratio Evaluation System (PISRES), is presented to show the viability of the PI-PISR decision model. Section 6 concludes the paper, including a discussion on the significance and limitations of the research, and possible avenues for further research.

2. Literature Review

2.1. Emerging Technology Trend Assessment

Promising or emerging technologies “cover a wide and diffuse set of intersecting and heterogeneous contingencies” [20] (p. 16), and they have been characterized using varying attributes [21,22,23,24,25]. These include novelty (i.e., the potential for a new market), growth speed and coherence (i.e., consensus on terms and identity), impact (i.e., influence on specific domains or systems), uncertainty and ambiguity in terms of uses and outcomes, and market acceptance. Most recently, such technologies have been redefined as those exhibiting high uncertainty and a high possibility of technological growth and market impact, owing to the increasing complexity of technological applications [26].
Consequently, analyses of emerging technologies have gained popularity with both academics and practitioners, who use the results to delineate industries and technologies according to their phase of emergence: early phase of emergence; about to emerge; or no potential to emerge [11]. An analysis of promising technologies can be used to identify and assess the attractiveness of a business or technology development opportunity. It provides a systematic approach to an advanced understanding of emerging market segments and its growth pace. Furthermore, such analyses effectively leverage existing data in discovering the potential impact of a technology disruption on the market.
The judgmental approaches are the methodologies used most widely to evaluate promising technologies, which provide a qualitative evaluation. Judgmental approaches are built upon the opinions of panels who have expert knowledge in a relevant field. These methods promote in-depth analyses, and they are used to verify the validity of analysis results. However, they are also time-consuming and costly. Furthermore, it is difficult to secure reliable analysis results for these methods, because they cannot be evaluated quantitatively. A further drawback of judgmental approaches is inconsistency, which occurs when experts or panels incorporate different decision criteria to similar situations.
Bibliometric analysis-based technology forecasting is often viewed as a statistical analysis process for making decisions based on the information gathered from the existing literature or patents [5]. In the case of bibliometric methods that are based on papers or patents, there is a time lag between inception and practical use in the market, because, in general, it takes one to three years for a paper to be published or for a patent to be applied [27]. Bibliometric methods have their own drawbacks, including quality, discipline variation, database variation, and bias and discrepancies. Importantly, the abovementioned approaches are not based on actual business activities in the market, which limits their applicability.
For example, conventional methods collectively rely on the opinions of experts or panels who have knowledge in a relevant field. Such methods are useful in the context of decision-making for conducting future technology trend analyses and research budget allocations. However, they are also complicated, time-consuming, and costly. Furthermore, their technical predictions may be distorted using a small number of experts. Experts may suffer from a cognitive bias or be too narrow in their view [28,29]. In particular, assembling a panel of experts from related technical fields becomes challenging when the rate of technological change is rapid. It is also difficult to secure reliable analysis results, because the results cannot be evaluated quantitatively. In response to these drawbacks, recent judgmental approaches have begun developing as hybrid techniques by incorporating technology and market information analyses [30,31,32,33].
In summary, as shown in Table 1, the existing approaches to emerging technology identification and assessment suffer from the following limitations:
  • Subjectivity of knowledge database: experts may suffer from a cognitive bias or be too narrow in their view [28,29].
  • Timeliness of knowledge database: this is a particular problem in contemporary analyses, because they rely on data that are only available after publication [11]. Dynamic estimation approaches of investment determinants are recommended with respect to the dynamic nature of investment decisions [34].
  • Lack of operationalization of “growth rate”: existing studies apply the growth rate to generalize, but seldom to measure, the “momentum” of growth, which can affect the speed of the innovation and turnover process [35,36].
  • Exclusion of “uncertainty and ambiguity”: the uncertainty of emerging technologies is difficult to measure and, thus, is often neglected [37].
  • Absence of policymaker participation for strategic technology and R&D investment management: customer-based technology forecasts, combined with the computer-based analytic approach, have gained popularity as a demonstration of market acceptance [25].
Table 1. Overview of promising and emerging technology forecast techniques.
ReferenceResearch Objective (Relationship between X and Y)Data TypeCharacteristics of Proposed Model (or Findings)Research ContextMethodology
[38](X) Crowdfunding; (Y) Venture Capital (VC) investmentsFinancialConfirms impact of crowdfunding campaigns on a subsequent increase in VC investmentsHardware, Media, Fashion industriesNon-stationarity and Granger causality of time-series
[39](X) Government policies; (Y) R&D investmentFinancialConfirms the impact of public R&D subsidies and collaboration increases R&D investmentAgricultural biotechnology industryEconometric
[40](X) Technology convergence; (Y) Market convergence forecastM&A ActivityPredicts future market converging pattern based on technology convergenceBiotechnology industryDEMATEL, Link prediction algorithm
[41](X) IPO activity; (Y) M&A activity paradigmM&A ActivityEvaluates firm’s trade-off in being acquired based on the extent of the synergies arising from a potential M&A activityTechnology industry and Young Innovative Companies in USText-based similarity, time-series regression
[42](X) Technological characteristics of patent; (Y) Citation performance of patentPatentProposes a machine learning approach utilizing multiple patent indicators to identify an early-stage emerging technologyPharmaceutical technologyFeed-forward multilayer neural network
[37](X) research capability of research organizations; (Y) Promising research frontiersPatent, BibliometricThe results from scientific papers and patents are proper to suggest themes for research in the relatively long-term and short-term perspective, respectivelyInformation and communication technologyBibliometric analysis
[43](X) Investment strategy in big data analytics; (Y) Financial profitFinancialPredicts the impact of (i) differentiated consumer densities firms on quality competition; and (ii) big data analytics investment strategy on financial profitHealth Care servicesGame theory
[44](X) Entropy and binding force of International Patent Classification; (Y) Interaction and attraction of technological convergencePatentServices with adapted wireless communication networks have the highest binding force; and visible signaling systems are associated with technology convergenceInformation and communication technologyEntropy and gravity, social network, and association rule analyses
[45](X) Technological knowledge flow matrix; (Y) Interdisciplinary trendPatentIllustrates a visual map that shows pattern of industrial technology fusionNew and renewable energy-based railway technologyPatent network analysis
[46](X) Patent citation indicators; (Y) Overlapping technology fields and the emergence of new technological opportunitiesPatentUses different patent citation indicators to recognize trajectory changes in the industry and technology convergence trendsRFID value chainPatent citation analysis
[47](X) Investment policy; (Y) Economic growthFinancialConfirms infrastructure and building–residential investments have direct relations with the GDPConstruction industry in TurkeyGranger causality, Engle-Granger cointegration
[48](X) Academic publications; (Y) Emerging research topicBibliometricPredicts the future core articles via the betweenness centralities in the citation network of the researchRegenerative medicineTopological clustering method, visualize citation networks analysis
[49](X) Geographic proximity; (Y) R&D collaborationCo-publicationIdentifies firms collaboration strategies and their choices for the R&D sites’ locationPharmaceutical industryRegression and Zero-inflated gravity model
This study(X) M&A activity number and value; (Y) Emerging technologyFinancialIllustrates future emerging technology based on the historical M&A activity data with time-lag perspectiveHealth Care IndustryPromising Index analysis

2.2. M&A Data-Based Approach

Analyzing investment or market information is an alternative to the above two qualitative and citation or patent-based quantitative approaches. M&A activity data depicts two firms’ efforts to generate synergistic benefits through technology and market unification [40]. Vanhaverbeke et al. [50] emphasize that firms that face “increasing costs, speed, and complexity of technological developments” can no longer depend on their internal capabilities to achieve innovation. Thus, firms must acquire external sources of technological knowledge, in addition to their internal R&D innovation activities [51]. M&A activities also posit an alternative means of developing complementary technologies and innovative capabilities, thus accelerating the global market expansion [52]. Consequently, firms began to strategically participate in M&A activities to create a new business value, develop technological capabilities, and achieve global expansion [40,51]. In addition, M&A activities foster “intra- and inter-industry innovation and cooperation, making it suitable objective of investigation for convergence research” [40].
M&A data have long been regarded as a useful source of knowledge on technology sourcing strategies [53], Initial Public Offerings (IPOs) trends [41], and market convergence [40]. In addition to the growing application of M&A activity data, studies have highlighted several advantages and useful features of the data structure to trend assessments, as listed in Table 2.
These properties make M&A data an appropriate candidate for the goal of developing a sustainable, financially objective, and as far as possible, dynamically up-to-date trend assessment of promising technologies. The current trend assessment approaches that depend on financial market information are limited by the high price and confidentiality of data. Thus, few studies have conducted business or technology opportunity analyses that focus on investment or market information. Therefore, a new methodology that identifies promising and emerging industries and technologies is proposed using M&A data, and it analyzes the results.

3. Methods

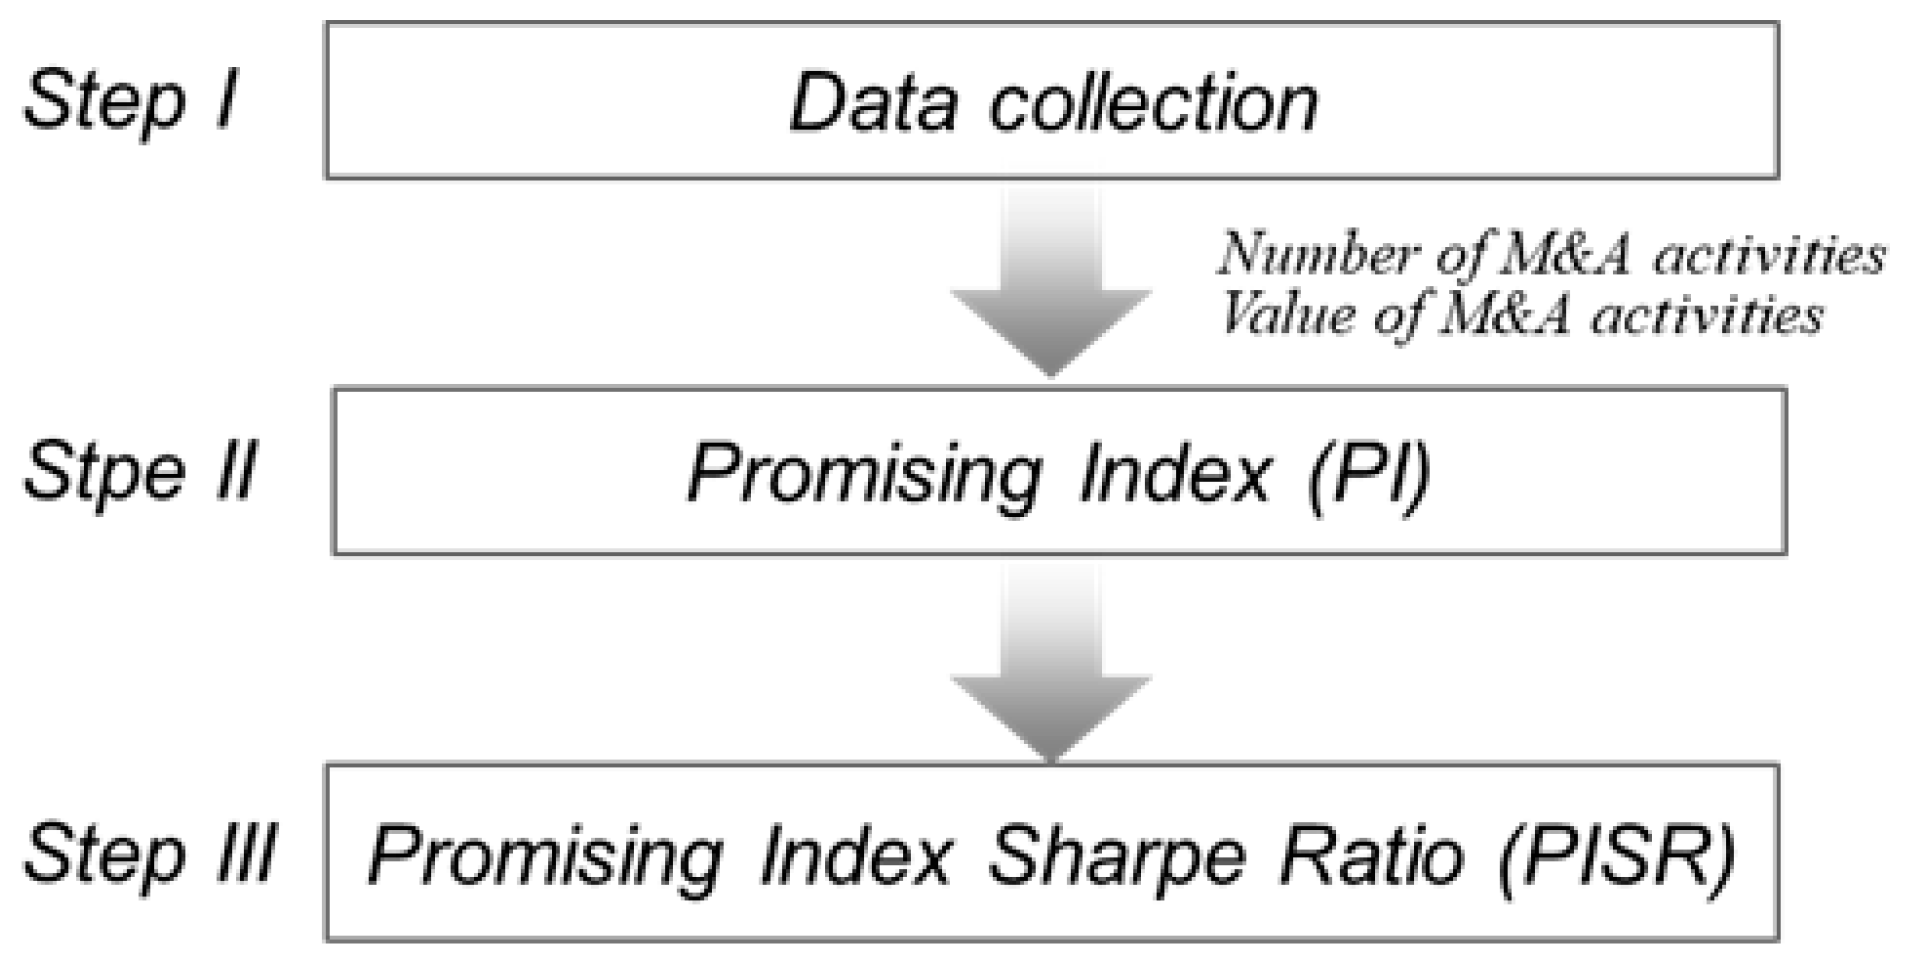
3.1. Research Framework

Diverse methods on forecasting emerging technologies have been previously developed, as suggested in Section 2. In particular, bibliometric analysis methods have proliferated, demonstrating their effectiveness in providing a holistic picture of technology trends and convergence. However, rather than using bibliometric as the foundation, this study employs prior M&A activity data to identify emerging technologies. M&A data can be used to measure the number and value of M&A activities by the industry and technology area, enabling a clear identification of emerging technology fields. Figure 1 depicts the overall research framework.
The proposed approach is composed of three steps. In the first step, this study collects and pre-processes the M&A data. In the second step, the growth momentum properties of M&A activities are identified, based on the number and value of activities, to identify emerging technology fields in the Health Care sector. Subsequently, the PI is estimated as the weighted sum of the standardized M&A activity growth momentum properties scores by the Health Care sub-industry (HCSI). Finally, the PISR is analyzed to measure the expected return on investment, when considering the variability of the market trends based on the proposed PI. Each step is described in further detail below.

3.2. Data Collection

The S&P Capital IQ database is a popular source of M&A data, which provides financial information to various financial institutions, as well as detailed information and analyses of all M&A activities at the most granular level. The S&P Capital IQ’s industry segment is based on the GICS, an industry taxonomy that was developed in 1999 by the MSCI and S&P for use by the global financial community.
The Health Care sector was the highest (6.6%), except for Real Estate and Utilities, according to the analysis of the Compound Annual Growth Rate (CAGR) based on the number of M&A activities over the last 14 years (2005 through 2018) presented in Figure 2. Therefore, the Health Care sector is selected as the analysis target of this study. Resultantly, this study extracted all M&A activity data for the Health Care sector for the period 2005 to 2018, yielding 40,137 M&A activities.

3.3. Promising Index

Emerging technology fields in the Health Care sector are identified by analyzing the growth momentum properties of M&A activities. First, the variables and decision models that are required for the analysis are adopted from Choi and Chang [59], as defined in Table 3.
The decision models used to measure the M&A status are as follows:
v i t ( n u m b e r ) = s i t ( n u m b e r ) s i t Δ t ( n u m b e r ) Δ t = T = t Δ t + 1 t N u m i T *
v i t ( v a l u e ) = s i t ( v a l u e ) s i t Δ t ( v a l u e ) Δ t = T = t Δ t + 1 t V a l i T ^
a i t ( n u m b e r ) = Δ v i t ( n u m b e r ) Δ t = v i t ( n u m b e r ) v i t Δ t ( n u m b e r ) Δ t
a i t ( v a l u e ) = Δ v i t ( v a l u e ) Δ t = v i t ( v a l u e ) v i t Δ t ( v a l u e ) Δ t
P I i t = ω v n v i t , n o r m ( n u m b e r ) + ω a n a i t , n o r m ( n u m b e r ) + ω v v v i t , n o r m ( v a l u e ) + ω a v a i t , n o r m ( v a l u e )
v i t ( n u m b e r ) refers to the growth velocity of period t based on the number of M&A transactions. As with the general concept of velocity, the growth velocity can be obtained by dividing the difference between the cumulative number of M&A activities until period t and the cumulative number of M&A activities until period t − Δt by the time difference between the two periods, Δt.
v i t ( v a l u e ) refers to the growth velocity of period t based on the value of M&A activities. This is obtained by dividing the difference between the cumulative M&A transaction value up to period t and the cumulative M&A transaction value up to period t − Δt, by the time difference between the two periods, Δt.
On the other hand, a i t ( n u m b e r ) denotes the growth acceleration based on the number of M&A activities for the period t. In general, positive growth acceleration in a certain period means that the growth momentum is higher than the previous period. As with the general concept of acceleration, the growth acceleration can be obtained by dividing the difference between the growth velocity of the number of M&A transactions of period t and the growth velocity of the number of M&A transactions of period t − Δt, by the time difference between the two periods, Δt.
a i t ( v a l u e ) denotes the growth acceleration of the ith period based on the value of M&A transactions. It can be obtained by dividing the difference between the growth velocity of period t and growth velocity of period t − Δt by the time difference between the two periods, Δt.

3.4. Promising Index Sharpe Ratio

This study proposes an integration of a Promising Index Sharpe Ratio (PISR) that can be easily computed as a quick performance measure for each investment (decision) policy. The primary goal of investors or investment policymakers is to construct and manage a portfolio that optimizes the return and the variability [60]. The Sharpe Ratio (SR), which was introduced in 1966 as a risk-adjusted measure of an investment’s performance, depicts the quality of a portfolio [61]. It measures the performance of an investment decision based on a reward-to-variability ratio, in which the excess return of a portfolio above the risk-free rate is divided by its standard deviation [62]. Based on the SR, a policymaker can use the quantitative information to evaluate and compare investment options ex ante or ex post [63]. For example, one can rank investments by assigning a higher rank to an investment with a higher SR. Moreover, SR can be used to compare investments on a risk-adjusted basis. In summary, a high SR implies a high risk-adjusted return, and a low SR implies a low risk-adjusted return, depicting a risky portfolio or investment strategy.
Despite its high usability as a performance evaluation tool for an investment based on the return and risk, the SR has yet to be applied in the sciences or to technology management. Aligned with a recent research stream of measuring investment performance by integrating risk management [64,65], this study operationalizes the uncertainty and ambiguity of the analysis of promising technologies by including the variability of the PI forecast. The SR, which was adopted from finance management, can be used to measure the quality of an investment portfolio based on the variability of the expected return. When policymakers need to decide between two investment strategies with the same arithmetic average, they can select the strategy that results in low variability, or a low SR. In other words, an investment strategy with high SR is regarded as a risky strategic approach.
The SR is integrated for its utility, combining two goals (maximizing return and minimizing risk) in a single measure, called PISR herein. The PISR measures the expected return of an investment, using the proposed PI to consider the variability in market trends. The PISR is obtained by subtracting the average PI value of the overall industry from the PI value of a HCSI i, and then dividing the result by the standard deviation of a HCSI i:
Promising   Index   Sharp   Ratio ( i )   =   P I i ¯ P I A V G σ i
Treating P I ¯ i as the average return of investment in HCSI i for time t, P I A V G is the average return of an investment in the overall Health Care industry, treated as the benchmark forecasted return. Subsequently, P I ¯ i P I A V G is the expected value of the excess of the forecasted return over the industry average return, and σ i is the standard deviation of the forecasted return of an investment in HCSI i.

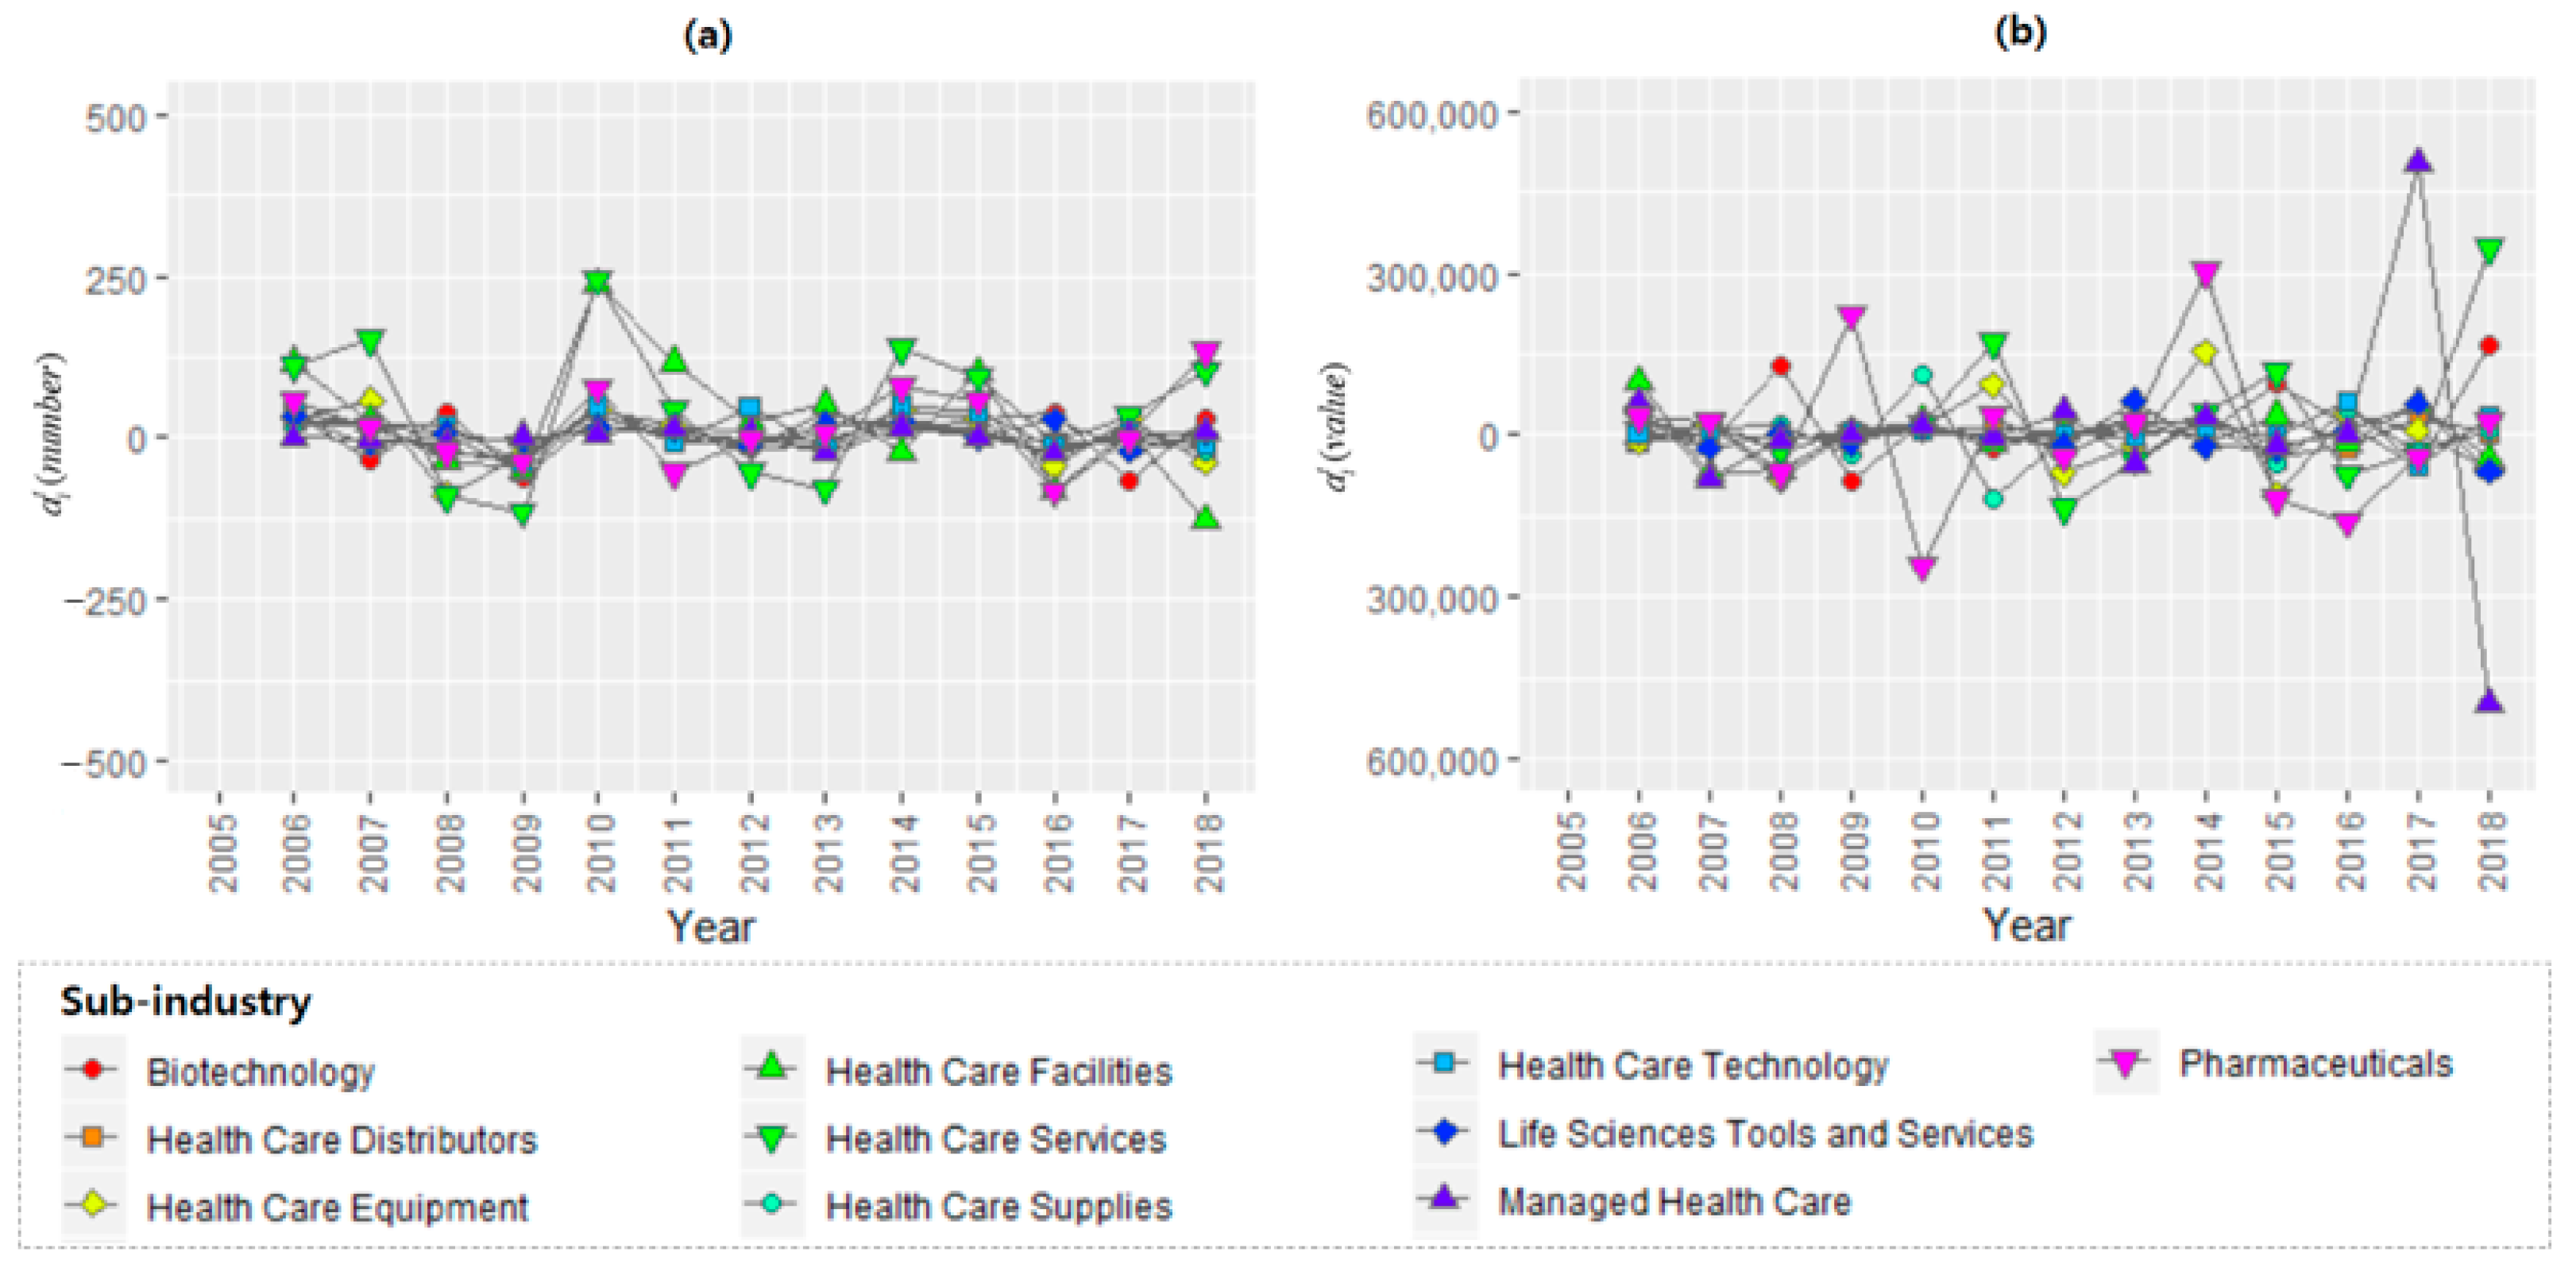
4. Longitudinal Analysis of M&A Trends in the Health Care Sector

Table 4 presents the results of the linear regression analysis of the time-series data based on the M&A activities by Health Care sub-industry (HCSI). For the number of M&A activities, the regression coefficients are positive and statistically significant for HCSI, including “Biotechnology”, “Health Care Facilities”, “Health Care Services”, “Health Care Technology”, “Life Sciences Tools & Services”, and “Pharmaceuticals”. The M&A activities number increased for HCSIs during the study period. For example, sub-industries with large regression coefficients include “Health Care Technology”, “Life Sciences Tools & Services”, and “Health Care Facilities”, which means that their growth momentum is expected to be greater than that of other sub-industries. For the M&A activities value, “Biotechnology”, “Health Care Distributors”, and “Health Care Services” showed large regression coefficients, indicating a high growth momentum relative to that of other HCSI, based on the M&A activities value.
Figure 3a shows the M&A activities velocity by year for the period 2005–2018. The M&A activities velocity for specific HCSI each year actually corresponds to the number of the M&A activities of the period, since the target period is measured on an annual basis.
The velocity of M&A deals has been increasing across most of the HCSIs, although there are also some differences between sub-industries. Particularly, “Health Care Facilities” and “Health Care Services” account for a high proportion of the M&A activities. In contrast to its continuous and steeply increasing patterns, “Managed Health Care” and “Health Care Supplies” account for relatively few activities, and they do not show noticeable differences.
Figure 3b illustrates the results of the velocity of the M&A activity value (i.e., M&A activity transaction amount). Similar to the velocity of the M&A activities number, the velocity of the M&A activities value for specific HCSI each year corresponds to the M&A activities value of the period. In contrast to the overall trend of the M&A activities number, the velocities of the M&A activity values of most HCSIs show drastic changes throughout the investigated period. “Pharmaceuticals” and “Health Care Services” exhibit particularly dynamic fluctuations between periods as compared with those of other sub-industries; in contrast, others show less fluctuation, such as “Managed Health Care” and “Health Care Distributors”.
Figure 4a illustrates the results of the acceleration of M&A activities number. Notably, M&A acceleration temporarily decreased around the global financial period (2008–2009). However, it then recovered to its previous level or higher. “Health Care Facilities” and “Health Care Services” show patterns with dynamic changes in terms of acceleration between 2007 and 2009. This indicates that the corresponding HCSIs have sufficient growth momentum after the global financial crisis period, and that the trend can potentially experience continuous positive growth in the future.
Figure 4b illustrates the results for the acceleration of M&A activities value. The M&A acceleration decreased temporarily during 2007–2009 for most HCSI with notable time differences by HCSI (Table 5). Like the change patterns of acceleration based on the M&A activities number, in most HCSI, the decreased pattern recovered their M&A acceleration to the previous level or higher after then. On the other hand, the “Biotechnology”, “Health Care Services”, “Managed Health Care”, and “Pharmaceuticals” presents sharp up and down change patterns of acceleration over the entire period.

5. Main Results

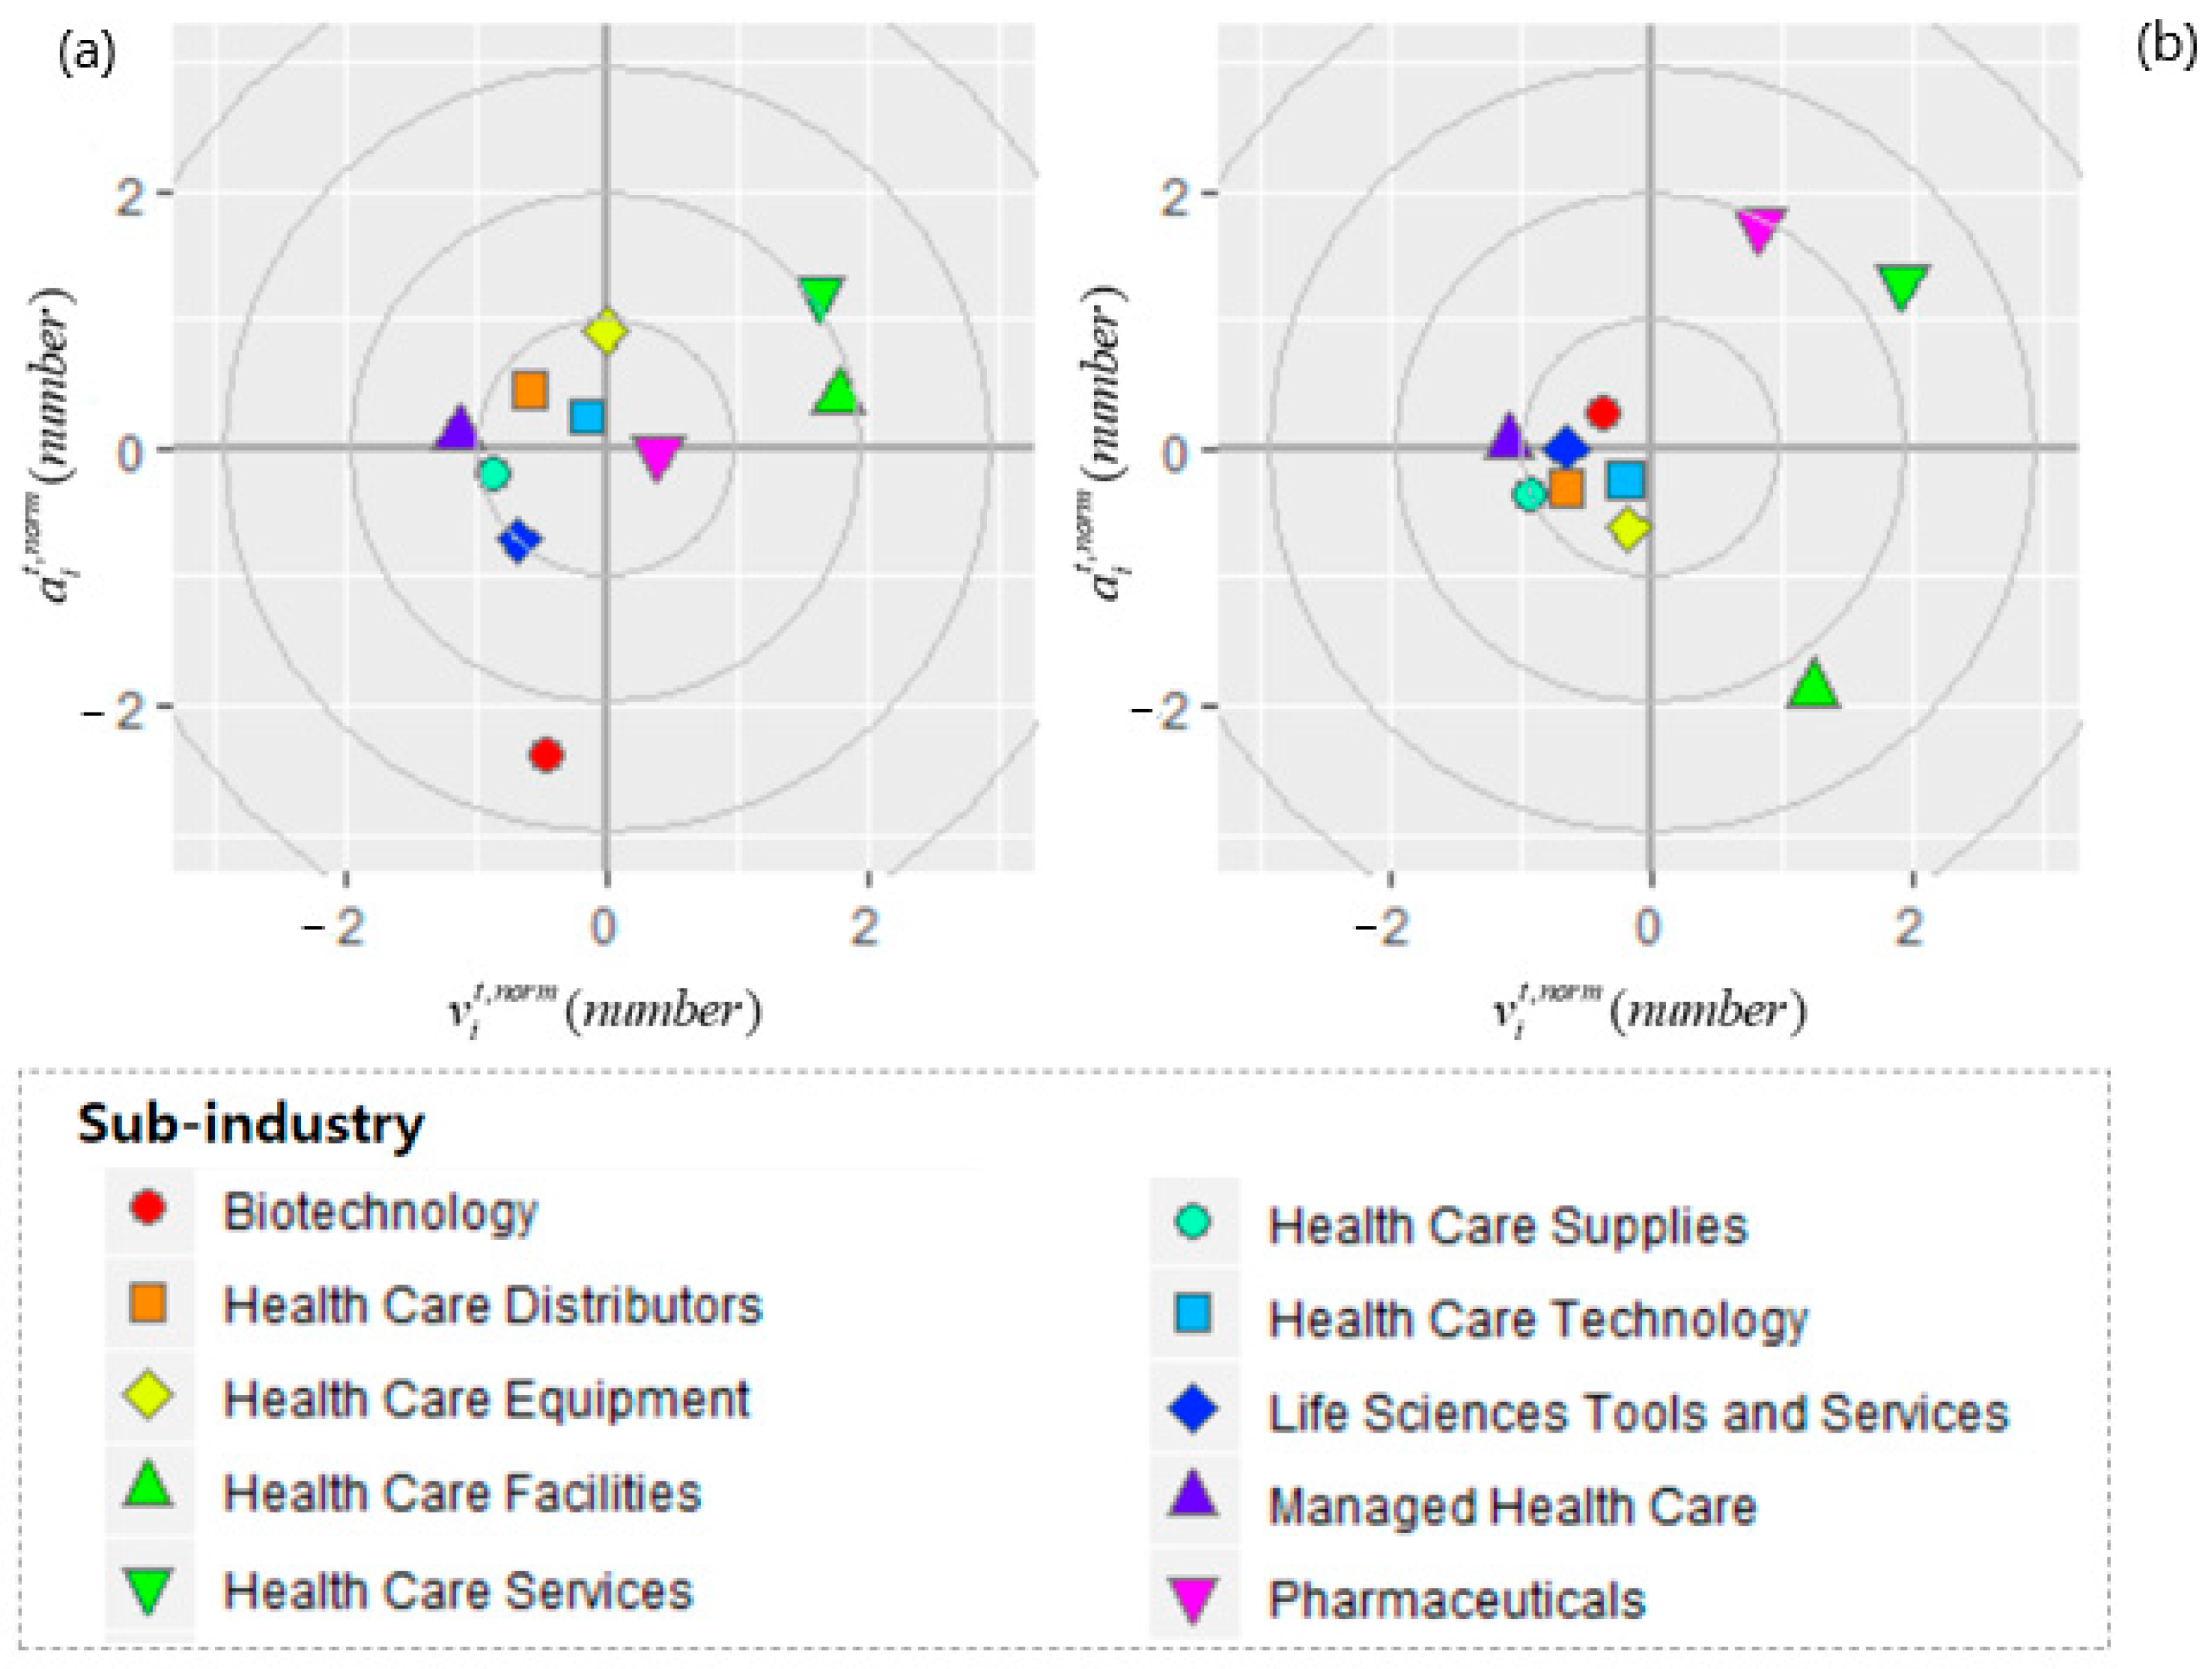
5.1. Overall Emerging Trend Assessment in the Health Care Sector

A cross-sectional analysis is performed to determine which technology fields are particularly emerging for recent two periods, 2017 and 2018. Figure 5 presents the results of an analysis of the growth momentum properties of the M&A activities number during 2017 and 2018 for all Health Care sub-industries, HCSI i (i = 1,…, 10). The x-axis represents the velocity of M&A activities, which means that it shows how many M&As are conducted in a specific period relative to those of other HCSI, thus indicating the current degree of M&A activity. More specifically, the x-axis represents the normalized velocity of M&A activities of each period. In general, normalization implies the creation of moving and expanded versions of the statistic. The purpose is to compare the normalized values of different datasets through these normalized values, so that we can eliminate the effect of a certain total effect, as in an ideal time series. In our dataset, the scale of the number of M&A activities and the transaction value of M&A are very different. Thus, these datasets are rescaled using min-max normalization. The normalized velocity of each sub-industry has the value of the range between 0 and 1 through min-max normalization.
On the other hand, the y-axis represents the normalized acceleration, based on the M&A activities number, for all sub-industries in the Health Care sector. This y-axis shows the growth rate of the number of M&A activities relative to that of the previous period, which is the growth momentum of M&A deals for the corresponding period.
In the first quadrant, the velocity of the M&A activities number is higher than the average velocity across HCSI, and the acceleration of the M&A activities number is also greater than average. Therefore, these are viewed as emerging technology fields. In the second quadrant, the velocity of the M&A activities of the corresponding HCSI is below the average velocity, but the M&A acceleration is above the average acceleration, indicating a certain level of growth momentum. In the fourth quadrant, the M&A activity velocity is above the average; thus, M&A activities are currently being conducted, but the long-term growth momentum is uncertainbecause the acceleration of M&A activities is below the average. For HCSI in the second and fourth quadrants, further analysis is necessary to determine the prospects of each HCSI. Finally, in the third quadrant, the growth momentum properties of M&A activities are below the average, respectively. Thus, HCSI in this area has little or no growth momentum.
The HSCI position on the graph (i.e., the distance from the focal point of the quadrant) indicates how emerging the technology is taking both growth momentum properties into account.
The sub-industries located in the first (right-upper) quadrant are “Health Care Equipment”, “Health Care Distributors”, and “Health Care Technology”, when analyzed by normalization based on the growth momentum properties of the number of M&A activities for the year 2017, as shown in Figure 5a. Subsequently, in Figure 5b, the sub-industries that are located in the first quadrant for the fifth period are “Pharmaceuticals”, “Biotechnology”, “Health Care Services”, and “Life Sciences Tools and Services” when analyzed by normalized growth momentum properties based on the number of M&A activities for the year 2018.
The HCSI included in the first quadrant can be viewed as relatively more promising than other HCSI for each period, because M&A activities are currently in active and their growth momentum is positive. In particular, both the velocity and acceleration of “Pharmaceuticals” and “Biotechnology” increased substantially in the year 2018, as compared to the previous year, 2017. This means that M&A activities became more active, and the growth momentum has increased during the two periods. In contrast, in the case of “Health Care Equipment” and “Health Care Distributors”, the velocity and acceleration of the two sub-industries decreased noticeably when compared with 2017. This implies that M&A activities became less active, and the growth momentum became less active during the two periods. On the other hand, for “Life Sciences Tools and Services”, the acceleration was negative in the year 2017, but turned positive in the year 2018. This means that the growth momentum of “Life Sciences Tools and Services” demonstrates the potential growth of M&A activities during the two periods.
Figure 6 depicts the results of the analysis of the growth momentum based on M&A activity value during the last two years in the Health Care sector. The x-axis represents growth velocity that is based on the M&A activity transaction value in the year 2017 and 2018 respectively. Specifically, the normalized distribution of the M&A activity velocity is presented through min-max normalization of the velocity of the M&A transaction value. The y-axis represents normalized acceleration, which is based on the value of M&A activities during the two periods. The normalized distribution of the velocity and acceleration of M&A activities by each sub-industry is presented. Likewise, the normalized velocity and acceleration of each sub-industry have the value between the range between 0 and 1.
“Managed Health Care” and “Life Sciences Tools and Services” are located in the first quadrant in the year 2017 and the position of these two sub-industries moves to the third quadrant in 2018, as shown in Figure 6a,b. The velocity and acceleration of “Health Care Services” and “Biotechnology” both increased substantially in the year 2018, as compared to the previous year 2017. This indicates that M&A activities of these two sub-industries became very active and the growth momentum has also increased substantially during the two periods when measured by the value of M&A activities.
On the other hand, the position of the two industries, “Pharmaceuticals” and “Health Care Supplies”, hardly changes between the two periods. This means that these two sub-industries’ activity and growth momentum, based on the value of M&A activities, remained almost the same.

5.2. Integrative Emerging Trend Assessment and Benchmarking Approaches

When evaluating an emerging trend by applying the same weights of four variables in the PI model (5), “Health Care Distributors”, “Health Care Equipment”, and “Health Care Technology” appeared to be the most emerging technology market in the Health Care sector with average PI values of 0.499, 0.477, and 0.468, respectively, for the past 14 years as shown in Table 6. Meanwhile, “Pharmaceuticals” and “Health Care Services” depicted noticeably low PI values with 0.377 and 0.369 during the same period, respectively, demonstrating its relatively low technology and industry growth potential.
Policymakers can estimate the possible return on an investment based on historical data by integrating the average PI and the PI variability into the Sharpe ratio (PISR).
To examine the viability of the proposed methodology, this study constructed a web-based prototype system, referred as ‘PISRES (Promising Index Sharpe Ratio Evaluation System)’. PISRES is designed to provide flexible evaluation service for investment decision. The main functions of PISRES are as follows:
  • Evaluation period adjustment function: the decision maker defines a target period for calculating Promising Index (PI) and the PISR rank, which evaluates based on the average and standard deviation of PI.
  • Weight adjustment function: it provides a function to adjust the weight of the weight variables, including wvn, wvv, wan, and wav. The sum of each weight equals 1.
Using PISRES, an investment decision maker can adjust (1) the evaluation period and (2) the weight of each variable to view and monitor the final status of the PISR. Figure 7, below, presents the user interface of PISRES and a simulation results of the PI and PISR for a specific target period, 2005 to 2018.
This study proposes a more refined application of PISR to incorporate the short- and long-term investment preferences of policymakers. The PI enables the inclusion of policymakers’ return preferences (or firm investment position) with weights wvn, wvv, wan, and wav, such that wvn, wvv, wan, wav ≥ 0, and the summation of all weights is equal to one. Depending on the policymaker’s return preferences, the ranges of the weights can be computed, as shown in Table 7. When the firm prefers an immediate return on an investment, it will likely focus on the speed of an M&A trend, rather than its acceleration. Similarly, when a fdecides to play a long-term strategy in the Health Care sector, it may place a higher weight on the acceleration of an M&A trend rather than its speed. Consequently, the investment rankings of the Health Care sub-industries are prioritized, as shown in Table 8.
“Health Care Distributors” is the most emerging sub-industry for all three strategies, with a PISR (i = 10) ranging between 0.274 and 0.294, according to Table 8. However, the sequential ranking orders are visibly different, depending on the firm or policymaker’s strategy. For example, while “Health Care Equipment” is ranked second and third for both short-long- and short-term strategies, respectively, “Health Care Technology” and “Biotechnology” are recommended for a long-term strategy. This means that, when seeking for immediate investment reward, “Health Care Equipment” is recommended; however, for firms that are looking to outperform competitors in the long run, “Health Care Technology” and “Biotechnology” are preferred. In summary, to identify an appropriate investment order for Health Care sub-industries, policymakers must first carefully assign weights to the PI elements, which are based on the anticipated reward time, compute the PISR, accounting for the PI variability, and then identify a PISR benchmark as the industry average PISR.

6. Discussion

6.1. Integrating M&A Information to Resolve the Time Lag Issue in Emerging Technology Foresight

This study utilizes M&A activity data, and it further integrates the variability of M&A momentum to support investment decisions in emerging technology. Despite the benefit of M&A activity information for its ability in immediately identifying the technology and market growth potential, limited decision support systems incorporate it as a determining value. Furthermore, this M&A information can provide ample information for new market opportunity based on the market dynamic activities among the buying and acquiring firms from various industries.
This study demonstrated that most of the sub-industries in the Health Care sector depicted increasing M&A activity activities for the last consecutive thirteen years. Particularly, by delineating sub-industries with large coefficients that are derived from the regression analysis, business analysts and policymakers can primarily identify and monitor relatively differing and emerging technologies. Consequently, as a prior investigation approach for technology convergence and innovation research, M&A activity information represents the imminent technology value and the potential of market and global expansion.

6.2. Dealing with Market Trend Irregularity

A lack of knowledge in trend characteristics significantly contributes to the forecast error of technology emergence [66]. Prior to evaluating trends of technology, Burmaoglu et al. [66] emphasized the importance of trend classification based on the two types of technological emergence: (i) radical or dominant emergence that occurs without a background creating an unexpected trend and (ii) incremental emergence, which can be traced and forecasted. Existing patent trend analysis and Bibliometric analysis often do not include or consider the market irregularity and trend characteristics of technology emergent.
The impact of global financial crisis was clearly observed in the dynamic changes of M&A activity trend of the Health Care sector in 2008 and 2009. With the exception of few sub-industries, most of the industries showed a dramatic decrease in the M&A activity momentum and recovered to its previous level or higher only after the year 2009. For example, “Health Care Services” showed the most dramatic change in terms of acceleration between 2007 and 2009, implying its potential for sufficient growth momentum after the global financial crisis period. On the other hand, “Managed Health Care” showed relatively less dramatic changes implying that the services industry is relatively unaffected by the unexpected trend. Nevertheless, it is important to exclude the effects of exogenous variables, such as the financial crisis or the COVID-19 pandemic as much as possible through methodologies, such as event studies [67,68,69], to minimize market irregularity. Thus, the proposed approach should be deeply rooted as a prerequisite step in the technology trend analysis.

6.3. Managing Expectations of Investors for Emerging Technology and Industry

Technology and R&D investors have struggled with managing the differences between the expectation and actual performance of the investment decision. To resolve vulnerabilities that arise from experts’ bias, time-lag issues, and environmental disruptions, the proposed PI-PISR model utilizes M&A activity data alone to demonstrate the growth of technology and industry areas. This study adapted the Sharpe ratio approach as an exploratory validation approach to identify emerging technology and industry through the PISR model. As a complementary approach to the PI model, the PISR approach is incorporated to assist policymakers in estimating the possible return on investment. By measuring the expected return of an investment and its variability of the market trend based on historic M&A activity data, the PISR can be incorporated with primary intention in dealing with the abovementioned two types of trends, unexpected trend and incremental trend. This approach also provides a dynamic and flexible decision support system that can be revised in accordance with the investor’s interested time period or the level of investigations.
Resultantly, this study identified promising technologies and sub-industries in the Health Care sector from various strategic investment perspectives, and it enabled richer communication structure to enable productivity [70]. Based on the fourteen years of M&A activity information, “Health Care Distributors” appeared to be the most prominent sub-industry for technology investment by the PI and PISR model. Most importantly, the decision makers are able to take the forecasting variability (i.e., PISR) in addition to the absolute standard (i.e., PI), and determine strategic investment priority decisions that are based on the investment position (i.e., short-long, short, or long). This approach advances existing literature that lacked consideration of the time lag issue. Because the proposed PI-PISR approach takes comprehensive information on market dynamics via systematic methodologies, its results can be effectively utilized to make a decision on technology investment planning under complex market competition. Specifically, by adopting the proposed approach, decision makers are able to objectively predict and evaluate the degree of emergence of industries in advance by analyzing historical data. This information is also beneficial for R&D policymakers who need to identify industry growth trends and decide which industry needs priority investment.
Furthermore, this study showed the viability of the PI-PISR approach by implementing the web-based prototype system, which enables high flexibility for the investment policymakers to specify their investment preferences on M&A activities.

7. Conclusions and Limitations

Despite a plethora of studies that recommend approaches to new technological opportunities discovery, the management of time lag, market trend irregularity, and investors’ expectations have been unresolved. This study demonstrated: (i) how to utilize M&A information for identifying emerging technology through the proposed PI-PISR based investment decision support model; and (ii) how technology and R&D investors can make strategic investment when considering market trend. By integrating M&A activity information, the recommended PI-based investment decision support model goes beyond the conventional approach to emerging technology discovery. Moreover, it effectively proposes a dynamic model that considers both market trend and investment strategy based on the most real-time input data and M&A activity information.
This study also has several limitations. A more robust methodology should be proposed to rule out the effects of exogenous variables, such as the global financial crisis. Additionally, a validation process should be added through comparative analysis with other methods or real industry status on whether the PI and PISR model’s analysis results are valid. Furthermore, an extended validation is needed in other sectors, besides Health Care, to ensure theananysis results’ accuracy. In particular, this study’s limitation is that the PISR ranking can be influenced by the analysis period and the weights of the velocity and acceleration determined by the policymaker or the stakeholders. Finally, further analyses on the correlations between specific technology fields or firms involved in M&A activities may greatly contribute to advancing the technology forecast literature.

Author Contributions

Conceptualization, J.C., Y.S.C., and N.S.; methodology, J.C., and Y.S.C.; software, J.C., Y.S.C.; validation, J.C., Y.S.C., and N.S.; formal analysis, Y.S.C. and N.S.; investigation, Y.S.C. and N.S.; resources, J.C. and N.S.; data curation, J.C.; writing—original draft preparation, J.C., Y.S.C., and N.S.; writing—review and editing, N.S.; visualization, J.C., Y.S.C., and N.S.; supervision, J.C.; project administration, J.C.; funding acquisition, J.C. and Y.S.C. All authors have read and agreed to the published version of the manuscript.

Funding

This research was supported by the Ministry of Education of the Korea and the National Research Foundation of Korea (NRF-2019S1A5A2A03049194).

Institutional Review Board Statement

Not applicable.

Informed Consent Statement

Not applicable.

Data Availability Statement

Data sharing not applicable.

Conflicts of Interest

The authors declare no conflict of interest.

References

  1. Ghosh, J. Big data analytics: A field of opportunities for information systems and technology researchers. J. Glob. Inf. Technol. Manag. 2016, 19, 217–222. [Google Scholar] [CrossRef]
  2. Vinaja, R. Data Analytics Applications in Latin America and Emerging Economies. J. Glob. Inf. Technol. Manag. 2020, 23, 79–81. [Google Scholar] [CrossRef]
  3. Gammeltoft, P.; Hobdari, B. Emerging market multinationals, international knowledge flows and innovation. Int. J. Technol. Manag. 2017, 74, 1–22. [Google Scholar] [CrossRef]
  4. Daim, T.U.; Rueda, G.; Martin, H.; Gerdsri, P. Forecasting emerging technologies: Use of bibliometrics and patent analysis. Technol. Forecast. Soc. Chang. 2006, 73, 981–1012. [Google Scholar] [CrossRef]
  5. Cho, Y.; Daim, T. Technology Forecasting Methods. In Green Energy and Technology; Springer: London, UK, 2013; Volume 60, pp. 67–112. ISBN 9781447150961. [Google Scholar]
  6. Kavanagh, S.; Williams, D. Making the Best Use of Judgmental Forecasting. In Government Finance Review; Government Finance Officers Association: Chicago, IL, USA, 2014; pp. 8–16. [Google Scholar]
  7. Mitchell, V.-W. Using Delphi to forecast in new technology industries. Mark. Intell. Plan. 1992, 10, 4–9. [Google Scholar] [CrossRef]
  8. Stewart, T.R. The Delphi technique and judgmental forecasting. Clim. Chang. 1987, 11, 97–113. [Google Scholar] [CrossRef]
  9. An, J.; Kim, K.; Mortara, L.; Lee, S. Deriving technology intelligence from patents: Preposition-based semantic analysis. J. Informetr. 2018, 12, 217–236. [Google Scholar] [CrossRef]
  10. Rodriguez, A.; Tosyali, A.; Kim, B.; Choi, J.; Lee, J.M.; Coh, B.Y.; Jeong, M.K. Patent Clustering and Outlier Ranking Methodologies for Attributed Patent Citation Networks for Technology Opportunity Discovery. IEEE Trans. Eng. Manag. 2016, 63, 426–437. [Google Scholar] [CrossRef]
  11. Rotolo, D.; Hicks, D.; Martin, B.R. What is an emerging technology? Res. Policy 2015, 44, 1827–1843. [Google Scholar] [CrossRef] [Green Version]
  12. Yoon, B.; Magee, C.L. Exploring technology opportunities by visualizing patent information based on generative topographic mapping and link prediction. Technol. Forecast. Soc. Chang. 2018, 132, 105–117. [Google Scholar] [CrossRef]
  13. Jena, K.L. A bibliometric analysis of the journal “Indian Journal of Fibre and Textile Research, 1996–2004”. Ann. Libr. Inf. Stud. 2006, 53, 22–30. [Google Scholar]
  14. Kalyane, V.L.; Sen, B.K. Bibliometric study of the Journal of Oilseeds Research. Ann. Libr. Sci. Doc. 1995, 42, 121–141. [Google Scholar]
  15. Li, X.; Zhou, Y.; Xue, L.; Huang, L. Integrating bibliometrics and roadmapping methods: A case of dye-sensitized solar cell technology-based industry in China. Technol. Forecast. Soc. Chang. 2015, 97, 205–222. [Google Scholar] [CrossRef]
  16. Lindman, Å.; Söderholm, P. Wind energy and green economy in Europe: Measuring policy-induced innovation using patent data. Appl. Energy 2016, 179, 1351–1359. [Google Scholar] [CrossRef]
  17. Mund, C.; Neuhäusler, P. Towards an early-stage identification of emerging topics in science-The usability of bibliometric characteristics. J. Informetr. 2015, 9, 1018–1033. [Google Scholar] [CrossRef]
  18. Glänzel, W.; Schoepflin, U. A bibliometric study of reference literature in the sciences and social sciences. Inf. Process. Manag. 1999, 35, 31–44. [Google Scholar] [CrossRef]
  19. Rinia, E.J.; Van Leeuwen, T.N.; Bruins, E.E.W.; Van Vuren, H.G.; Van Raan, A.F.J. Citation delay in interdisciplinary knowledge exchange. Scientometrics 2001, 51, 293–309. [Google Scholar] [CrossRef]
  20. Rooney, D. A contextualising, socio-technical definition of technology: Learning from ancient Greece and Foucault. Prometheus 1997, 15, 399–407. [Google Scholar] [CrossRef]
  21. Day, G.S.; Schoemaker, P.J.H. Avoiding the pitfalls of emerging technologies. Calif. Manag. Rev. 2000, 42, 8–33. [Google Scholar] [CrossRef]
  22. Porter, A.L.; Roessner, J.D.; Jin, X.; Newman, N.C. Measuring national ‘emerging technology’ capabilities. Sci. Public Policy 2002, 29, 189–200. [Google Scholar] [CrossRef]
  23. Cozzens, S.; Gatchair, S.; Kang, J.; Kim, K.S.; Lee, H.J.; Ordóñez, G.; Porter, A. Emerging technologies: Quantitative identification and measurement. Technol. Anal. Strateg. Manag. 2010, 22, 361–376. [Google Scholar] [CrossRef]
  24. Small, H.; Boyack, K.W.; Klavans, R. Identifying emerging topics in science and technology. Res. Policy 2014, 43, 1450–1467. [Google Scholar] [CrossRef]
  25. Noh, H.; Song, Y.K.; Lee, S. Identifying emerging core technologies for the future: Case study of patents published by leading telecommunication organizations. Telecomm. Policy 2016, 40, 956–970. [Google Scholar] [CrossRef]
  26. Song, K.; Kim, K.; Lee, S. Identifying promising technologies using patents: A retrospective feature analysis and a prospective needs analysis on outlier patents. Technol. Forecast. Soc. Chang. 2018, 128, 118–132. [Google Scholar] [CrossRef]
  27. Daim, T.; Monalisa, M.; Dash, P.; Brown, N. Time lag assessment between research funding and output in emerging technologies. Foresight 2007, 9, 33–44. [Google Scholar] [CrossRef]
  28. Coenen, R. The use of technological forecasts in government planning. Res. Policy 1972, 1, 156–172. [Google Scholar] [CrossRef]
  29. Goodwin, P.; Wright, G. The limits of forecasting methods in anticipating rare events. Technol. Forecast. Soc. Chang. 2010, 77, 355–368. [Google Scholar] [CrossRef] [Green Version]
  30. Bañuls, V.A.; Salmeron, J.L. Foresighting key areas in the Information Technology industry. Technovation 2008, 28, 103–111. [Google Scholar] [CrossRef]
  31. Bengisu, M.; Nekhili, R. Forecasting emerging technologies with the aid of science and technology databases. Technol. Forecast. Soc. Chang. 2006, 73, 835–844. [Google Scholar] [CrossRef]
  32. Lee, S.; Kang, S.; Park, E.; Park, Y. Applying technology road-maps in project selection and planning. Int. J. Qual. Reliab. Manag. 2008, 25, 39–51. [Google Scholar] [CrossRef]
  33. Zhang, Y.; Guo, Y.; Wang, X.; Zhu, D.; Porter, A.L. A hybrid visualisation model for technology roadmapping: Bibliometrics, qualitative methodology and empirical study. Technol. Anal. Strateg. Manag. 2013, 25, 707–724. [Google Scholar] [CrossRef]
  34. Serrasqueiro, Z. Investment determinants: High-investment versus low-investment portuguese SMEs. Investig. Anal. J. 2017, 46, 1–16. [Google Scholar] [CrossRef]
  35. de Mingo-López, D.V.; Matallín-Sáez, J.C. Institutional investment management: An investor’s perspective on the relation between turnover and performance. Investig. Anal. J. 2018, 47, 81–94. [Google Scholar] [CrossRef]
  36. Campagnolo, G.M.; Nguyen, H.T.; Williams, R. The temporal dynamics of technology promises in government and industry partnerships for digital innovation: The case of the Copyright Hub. Technol. Anal. Strateg. Manag. 2019, 31, 972–985. [Google Scholar] [CrossRef]
  37. Park, I.; Yoon, B. Identifying promising research frontiers of pattern recognition through bibliometric analysis. Sustainability 2018, 10, 4055. [Google Scholar] [CrossRef] [Green Version]
  38. Kaminski, J.; Hopp, C.; Tykvová, T. New technology assessment in entrepreneurial financing–Does crowdfunding predict venture capital investments? Technol. Forecast. Soc. Chang. 2019, 139, 287–302. [Google Scholar] [CrossRef]
  39. Deng, H.; Hu, R.; Pray, C.; Jin, Y. Impact of government policies on private R&D investment in agricultural biotechnology: Evidence from chemical and pesticide firms in China. Technol. Forecast. Soc. Chang. 2019, 147, 208–215. [Google Scholar] [CrossRef]
  40. Aaldering, L.J.; Leker, J.; Song, C.H. Uncovering the dynamics of market convergence through M&A. Technol. Forecast. Soc. Chang. 2019, 138, 95–114. [Google Scholar] [CrossRef]
  41. Signori, A.; Vismara, S. M&A synergies and trends in IPOs. Technol. Forecast. Soc. Chang. 2018, 127, 141–153. [Google Scholar] [CrossRef]
  42. Lee, C.; Kwon, O.; Kim, M.; Kwon, D. Early identification of emerging technologies: A machine learning approach using multiple patent indicators. Technol. Forecast. Soc. Chang. 2018, 127, 291–303. [Google Scholar] [CrossRef]
  43. Wu, J.; Li, H.; Cheng, S.; Lin, Z. The promising future of healthcare services: When big data analytics meets wearable technology. Inf. Manag. 2016, 53, 1020–1033. [Google Scholar] [CrossRef]
  44. Han, E.J.; Sohn, S.Y. Technological convergence in standards for information and communication technologies. Technol. Forecast. Soc. Chang. 2016, 106, 1–10. [Google Scholar] [CrossRef]
  45. Ko, N.; Yoon, J.; Seo, W. Analyzing interdisciplinarity of technology fusion using knowledge flows of patents. Expert Syst. Appl. 2014, 41, 1955–1963. [Google Scholar] [CrossRef]
  46. Karvonen, M.; Kässi, T. Patent citations as a tool for analysing the early stages of convergence. Technol. Forecast. Soc. Chang. 2013, 80, 1094–1107. [Google Scholar] [CrossRef]
  47. Ozkan, F.; Ozkan, O.; Gunduz, M. Causal relationship between construction investment policy and economic growth in Turkey. Technol. Forecast. Soc. Chang. 2012, 79, 362–370. [Google Scholar] [CrossRef]
  48. Shibata, N.; Kajikawa, Y.; Takeda, Y.; Sakata, I.; Matsushima, K. Detecting emerging research fronts in regenerative medicine by the citation network analysis of scientific publications. Technol. Forecast. Soc. Chang. 2011, 78, 274–282. [Google Scholar] [CrossRef]
  49. Bignami, F.; Mattsson, P.; Hoekman, J. The importance of geographical distance to different types of R&D collaboration in the pharmaceutical industry. Ind. Innov. 2020, 27, 513–537. [Google Scholar] [CrossRef] [Green Version]
  50. Vanhaverbeke, W.; Duysters, G.; Noorderhaven, N. External technology sourcing through alliances or acquisitions: An analysis of the application-specific integrated circuits industry. Organ. Sci. 2002, 13, 714–733. [Google Scholar] [CrossRef] [Green Version]
  51. Cassiman, B.; Veugelers, R. In Search of Complementarity in Innovation Strategy: Internal R&D and External Knowledge Acquisition. Manag. Sci. 2006, 52, 68–82. [Google Scholar] [CrossRef] [Green Version]
  52. Cefis, E.; Marsili, O. Crossing the innovation threshold through mergers and acquisitions. Res. Policy 2015, 44, 698–710. [Google Scholar] [CrossRef]
  53. Cefis, E. The impact of M&A on technology sourcing strategies. Econ. Innov. New Technol. 2010, 19, 27–51. [Google Scholar] [CrossRef] [Green Version]
  54. Trichterborn, A.; Zu Knyphausen-Aufseß, D.; Schweizer, L. How to improve acquisition performance: The role of a dedicated M&A function, M&A learning process, and M&A capability. Strateg. Manag. J. 2016, 37, 763–773. [Google Scholar] [CrossRef]
  55. MSCI. The Global Industry Classification Standard. Available online: https://www.msci.com/gics (accessed on 1 December 2020).
  56. Hattangadi, V. Explained: The Difference between Sector and Industry. Available online: https://www.financialexpress.com/opinion/explained-the-difference-between-sector-and-industry/1349168/ (accessed on 1 December 2020).
  57. Etherington, D. Apple Acquired 24 Companies In The Last 18 Months. Available online: https://techcrunch.com/2014/04/23/apple-acquired-24-companies-in-the-last-18-months/ (accessed on 1 December 2020).
  58. Kim, N.; Lee, H.; Kim, W.; Lee, H.; Suh, J.H. Dynamic patterns of industry convergence: Evidence from a large amount of unstructured data. Res. Policy 2015, 44, 1734–1748. [Google Scholar] [CrossRef]
  59. Choi, J.; Chang, Y.S. Development of a new methodology to identity promising technology areas using M&A information. Sustainability 2020, 12, 5606. [Google Scholar] [CrossRef]
  60. Chandrinos, S.K.; Sakkas, G.; Lagaros, N.D. AIRMS: A risk management tool using machine learning. Expert Syst. Appl. 2018, 105, 34–48. [Google Scholar] [CrossRef]
  61. Sharpe, W.F. The Sharpe Ratio. J. Portf. Manag. 2009, 21, 49–58. [Google Scholar] [CrossRef]
  62. Bacon, C. How sharp is the Sharpe ratio? Risk-adjusted Performance Measures. Available online: www.statpro.com (accessed on 6 December 2020).
  63. Dowd, K. Adjusting for risk: An improved Sharpe ratio. Int. Rev. Econ. Financ. 2000, 9, 209–222. [Google Scholar] [CrossRef]
  64. Gilbert, E.; Meiklejohn, L. A comparative analysis of risk measures: A portfolio optimisation approach. Invest. Anal. J. 2019, 48, 223–239. [Google Scholar] [CrossRef]
  65. Tajdini, S.; Mehrara, M.; Tehrani, R. Double-sided balanced conditional Sharpe ratio. Cogent Econ. Financ. 2019, 7, 1–17. [Google Scholar] [CrossRef]
  66. Burmaoglu, S.; Sartenaer, O.; Porter, A. Conceptual definition of technology emergence: A long journey from philosophy of science to science policy. Technol. Soc. 2019, 59, 101126. [Google Scholar] [CrossRef]
  67. Im, K.S.; Dow, K.E.; Grover, V. Research Report: A Reexamination of IT Investment and the Market Value of the Firm-An Event Study Methodology. Inf. Syst. Res. 2001, 12, 103–117. [Google Scholar] [CrossRef]
  68. Borusyak, K.; Jaravel, X. Revisiting Event Study Designs. SSRN Electron. J. 2018. [Google Scholar] [CrossRef] [Green Version]
  69. Schmidheiny, K.; Siegloch, S. On Event Study Designs and Distributed-Lag Models: Equivalence, Generalization and Practical Implications. CESifo Work. Pap. 2019. [Google Scholar]
  70. Mishra, P.C.; Kishore, S.; Shivani, S. The Role of Information Technology for Knowledge Management: An Empirical Study of the Indian Coal Mining Industry. J. Glob. Inf. Technol. Manag. 2018, 21, 208–225. [Google Scholar] [CrossRef]
Figure 1. Proposed Promising Index (PI)-based investment decision support model framework.
Sustainability 13 03644 g001
Figure 2. Number of M&A activities by year for all industry.
Sustainability 13 03644 g002
Figure 3. Estimated velocity of the (a) number and (b) values of M&A activities by year.
Sustainability 13 03644 g003
Figure 4. Accelerating momentum of M&A activities based on the (a) number and (b) value of activities.
Sustainability 13 03644 g004
Figure 5. Normalized M&A activity velocity and acceleration (number of M&A by sub-industry activities) in year (a) 2017 and (b) 2018.
Sustainability 13 03644 g005
Figure 6. Normalized M&A activity velocity and acceleration (value of M&A activities) in year (a) 2017 and (b) 2018.
Sustainability 13 03644 g006
Figure 7. PISRES (Promising Index Sharpe Ratio Evaluation System) and simulation results of the PI and Promising Index Sharpe Ratio (PISR).
Sustainability 13 03644 g007
Table 2. Overview of characteristics of mergers and acquisitions (M&A) data.
Characteristics of M&A DataExample
Information reliability
  • M&A activities are required by law to be accurate, even at the most granular level. The data reflect actual activities of shares or assets [40].
  • M&A process and its outcome (i.e., acquiring the assets and liabilities of the merged firm) are elaborated in financial terminologies which are evaluated objectively by the financial market [54].
Standardized structure
  • M&A activity information uses standardized categories that can be replicated in other studies, consequently minimizing errors and biases in the category structures and analyses.
  • Morgan Stanley Capital International (MSCI) and Standard & Poor’s (S&P) developed an industry segmentation called the Global Industry Classification Standard (GICS), which consists of 11 sectors, 24 industry groups, 69 industries, and 158 sub-industries [55].
  • The GICS has become a standard reference for assigning public firms to an appropriate sub-industry, industry, industry group, and sector, based on the firm’s principal business activity; and GICS provides general financial market indices and sector information, which differs from the industry classification in that it provides a few general segments in the economy, within which many firms can be categorized [56].
Aggregated data
  • Aggregated M&A data may be beneficial to observe the cumulative M&A activities at the industry or sector level, because frequent alliance activity may indicate the presence of innovation activities and/or promising technology trends [51].
  • Aggregated data enables quantitative indication of the persistence in innovation based on the cumulative nature of the innovation process [52].
  • The speed of product development or innovative activities can be identified (i.e., Apple acquiring 24 firms during the past 18 months) [57].
Timeliness information
  • Up-to-date M&A information can effectively resolve the existing time lag issue [58].
  • Bibliometric and/or patent-based analytic approaches often struggle with bottlenecks in accelerating commercialization and publication process [59].
  • The timely nature of M&A data can provide competitive edge when effectively utilized in the trend assessment process [34].
Table 3. Notation descriptions.
NotationDescriptions
i Index of Health Care sub-industry (HCSI) (i = 1, …, 10)
t Index of period (t = 1, …, n)
N u m i t Number of M&A activities for HCSI i during a period of time t
N u m i t * Number of M&A activities excluding activities with unavailable financial data for HCSI i during a period of time t
V a l i t * Total value of M&A activities excluding activities with unavailable financial data for HCSI i during a period of time t
V a l i t ¯ V a l i t * N u m i t * , average value of M&A activities for HCSI i during a period of time t
V a l i t ^ V a l i t ¯ × N u m i t , estimated value of M&A activities for HCSI i during a period of time t
s i t ( n u m b e r ) Cumulative M&A activities number for HCSI i during a period of time t
s i t ( v a l u e ) Cumulative M&A activities value for HCSI i during a period of time t
v i t ( n u m b e r ) Velocity of M&A activities number for HCSI i during a period of time t
v i t ( v a l u e ) Velocity of M&A activities value for HCSI i during a period of time t
a i t ( n u m b e r ) Acceleration of M&A activities number for HCSI i during a period of time t
a i t ( v a l u e ) Acceleration of M&A activities value for HCSI i during a period of time t
v i t , n o r m ( n u m b e r ) Normalized values from 0 to 1 for v i t ( n u m b e r )
v i t , n o r m ( v a l u e ) Normalized values from 0 to 1 for v i t ( v a l u e )
a i t , n o r m ( n u m b e r ) Normalized values from 0 to 1 for a i t ( n u m b e r )
a i t , n o r m ( v a l u e ) Normalized values from 0 to 1 for a i t ( v a l u e )
ω v n Weight of the velocity of M&A activities number
ω a n Weight of the acceleration of M&A activities number
ω v v Weight of the velocity of M&A activities value
ω a v Weight of the acceleration of M&A activities value
Table 4. Regression analysis of the number and the values of M&A activities.
HCSI (i)Number of M&A ActivitiesValue of M&A Activities
Standardized Coefficient (β)p-ValueR2Standardized Coefficient (β)p-ValueR2
1. Biotechnology6.4040.0047 ***0.4995136930.0022 ***0.4995
2. Health Care Distributors1.780‒0.1720.149724150.0482 **0.1497
3. Health Care Equipment2.1910.3120.084734090.30950.0847
4. Health Care Facilities36.1600.0001 ***0.728722920.40600.7287
5. Health Care Services35.5691.77e−5 ***0.7963173370.0137 **0.7963
6. Health Care Supplies1.0660.3330.0780‒9.0370.9970.0780
7. Health Care Technology15.0991.46e−7 ***0.907645510.0018 ***0.9076
8. Life Sciences Tools & Services7.85933.26e−7 ***0.894522990.1470.8945
9. Managed Health Care0.24840.7070.0122110630.2310.0122
10. Pharmaceuticals10.7300.0043 ***0.507014050.84450.5070
** p < 0.05, *** p < 0.01.
Table 5. Accelerating momentum of M&A activities based on the value of activities.
i = 1i = 2i = 3i = 4i = 5i = 6i = 7i = 8i = 9i = 10
20050000000000
2006826−14,212−12,70298,932832115,845349138,07359,93633,833
2007−21,985233217,702−72,09821,13512,22093−23,066−81,75925,195
2008127,116−777−82,527−62,625−29,56719,391−44343914−11,354−70,358
2009−85,951−2572670451614926−35,1914345−14,4841421221,645
201024,882955512,08325,23419,815111,790632518,33415,092−242,581
2011−27,78515,39394,404−15,336170,489−115,949−1998−2479−190736,348
201285268007−70,9594484−135,401−2464105−17,99442,708−38,048
20138642−4326−20,48831,148−46,12826,342−129162,579−52,76822,668
2014337238,136153,213−12,37140,64223,84516,768−21,37732,991301,966
201597,083−43,684−111,67435,554115,717−54,980−1373−27,425−18,420−118,118
201616,465−21,93838,956−13,620−72,57444,79662,63380381737−159,665
2017−56,22028,449952057,151−30,385−31,644−55,82157,743502,499−38,442
2018164,8175770−62,298−42,670345,514485033,615−66,559−498,29625,092
Table 6. Ranking of Health Care sub-industries based on Promising Index.
Sub-Industry (i) P I ¯ i σ i P I ¯ i   Rank
1. Biotechnology0.4560.2435
2. Health Care Distributors0.4990.1951
3. Health Care Equipment0.4770.2162
4. Health Care Facilities0.4500.1947
5. Health Care Services0.3690.21810
6. Health Care Supplies0.4540.2056
7. Health Care Technology0.4680.1833
8. Life Sciences Tools & Services0.4610.1964
9. Managed Health Care0.4060.1718
10. Pharmaceuticals0.3770.1899
Table 7. Policymaker’s return preferences and its assigned weights.
Figurewvnwvvwanwav
Strategic decision IShort-Long strategy0.250.250.250.25
Strategic decision IIShort strategy0.40.040.10.1
Strategic decision IIILong strategy0.10.10.40.4
Table 8. Rank of Benchmarked Promising Index Sharpe Ratio of Health Care sub-industry (HCSI).
HCSI (i)PISR MeasuresPISR Rank
Short-LongShortLongShort-LongShortLong
1. Biotechnology0.060−0.0340.141673
2. Health Care Distributors0.2940.2740.287111
3. Health Care Equipment0.1640.2040.111235
4. Health Care Facilities0.0420.254−0.190728
5. Health Care Services−0.335−0.208−0.4459810
6. Health Care Supplies0.0600.139−0.019547
7. Health Care Technology0.1450.0590.238362
8. Life Sciences Tools & Services0.0980.0970.084456
9. Managed Health Care−0.207−0.5120.1158104
10. Pharmaceuticals−0.344−0.365−0.2931099
Publisher’s Note: MDPI stays neutral with regard to jurisdictional claims in published maps and institutional affiliations.

