3.4. Analytical Model for the Compressive Strength Prediction of PPF Mortar under Different Loading Speeds
There are several available mathematical models that can be used to predict the compressive strength development of cementitious materials with age, as concluded in
Table 6.
The prediction models presented in
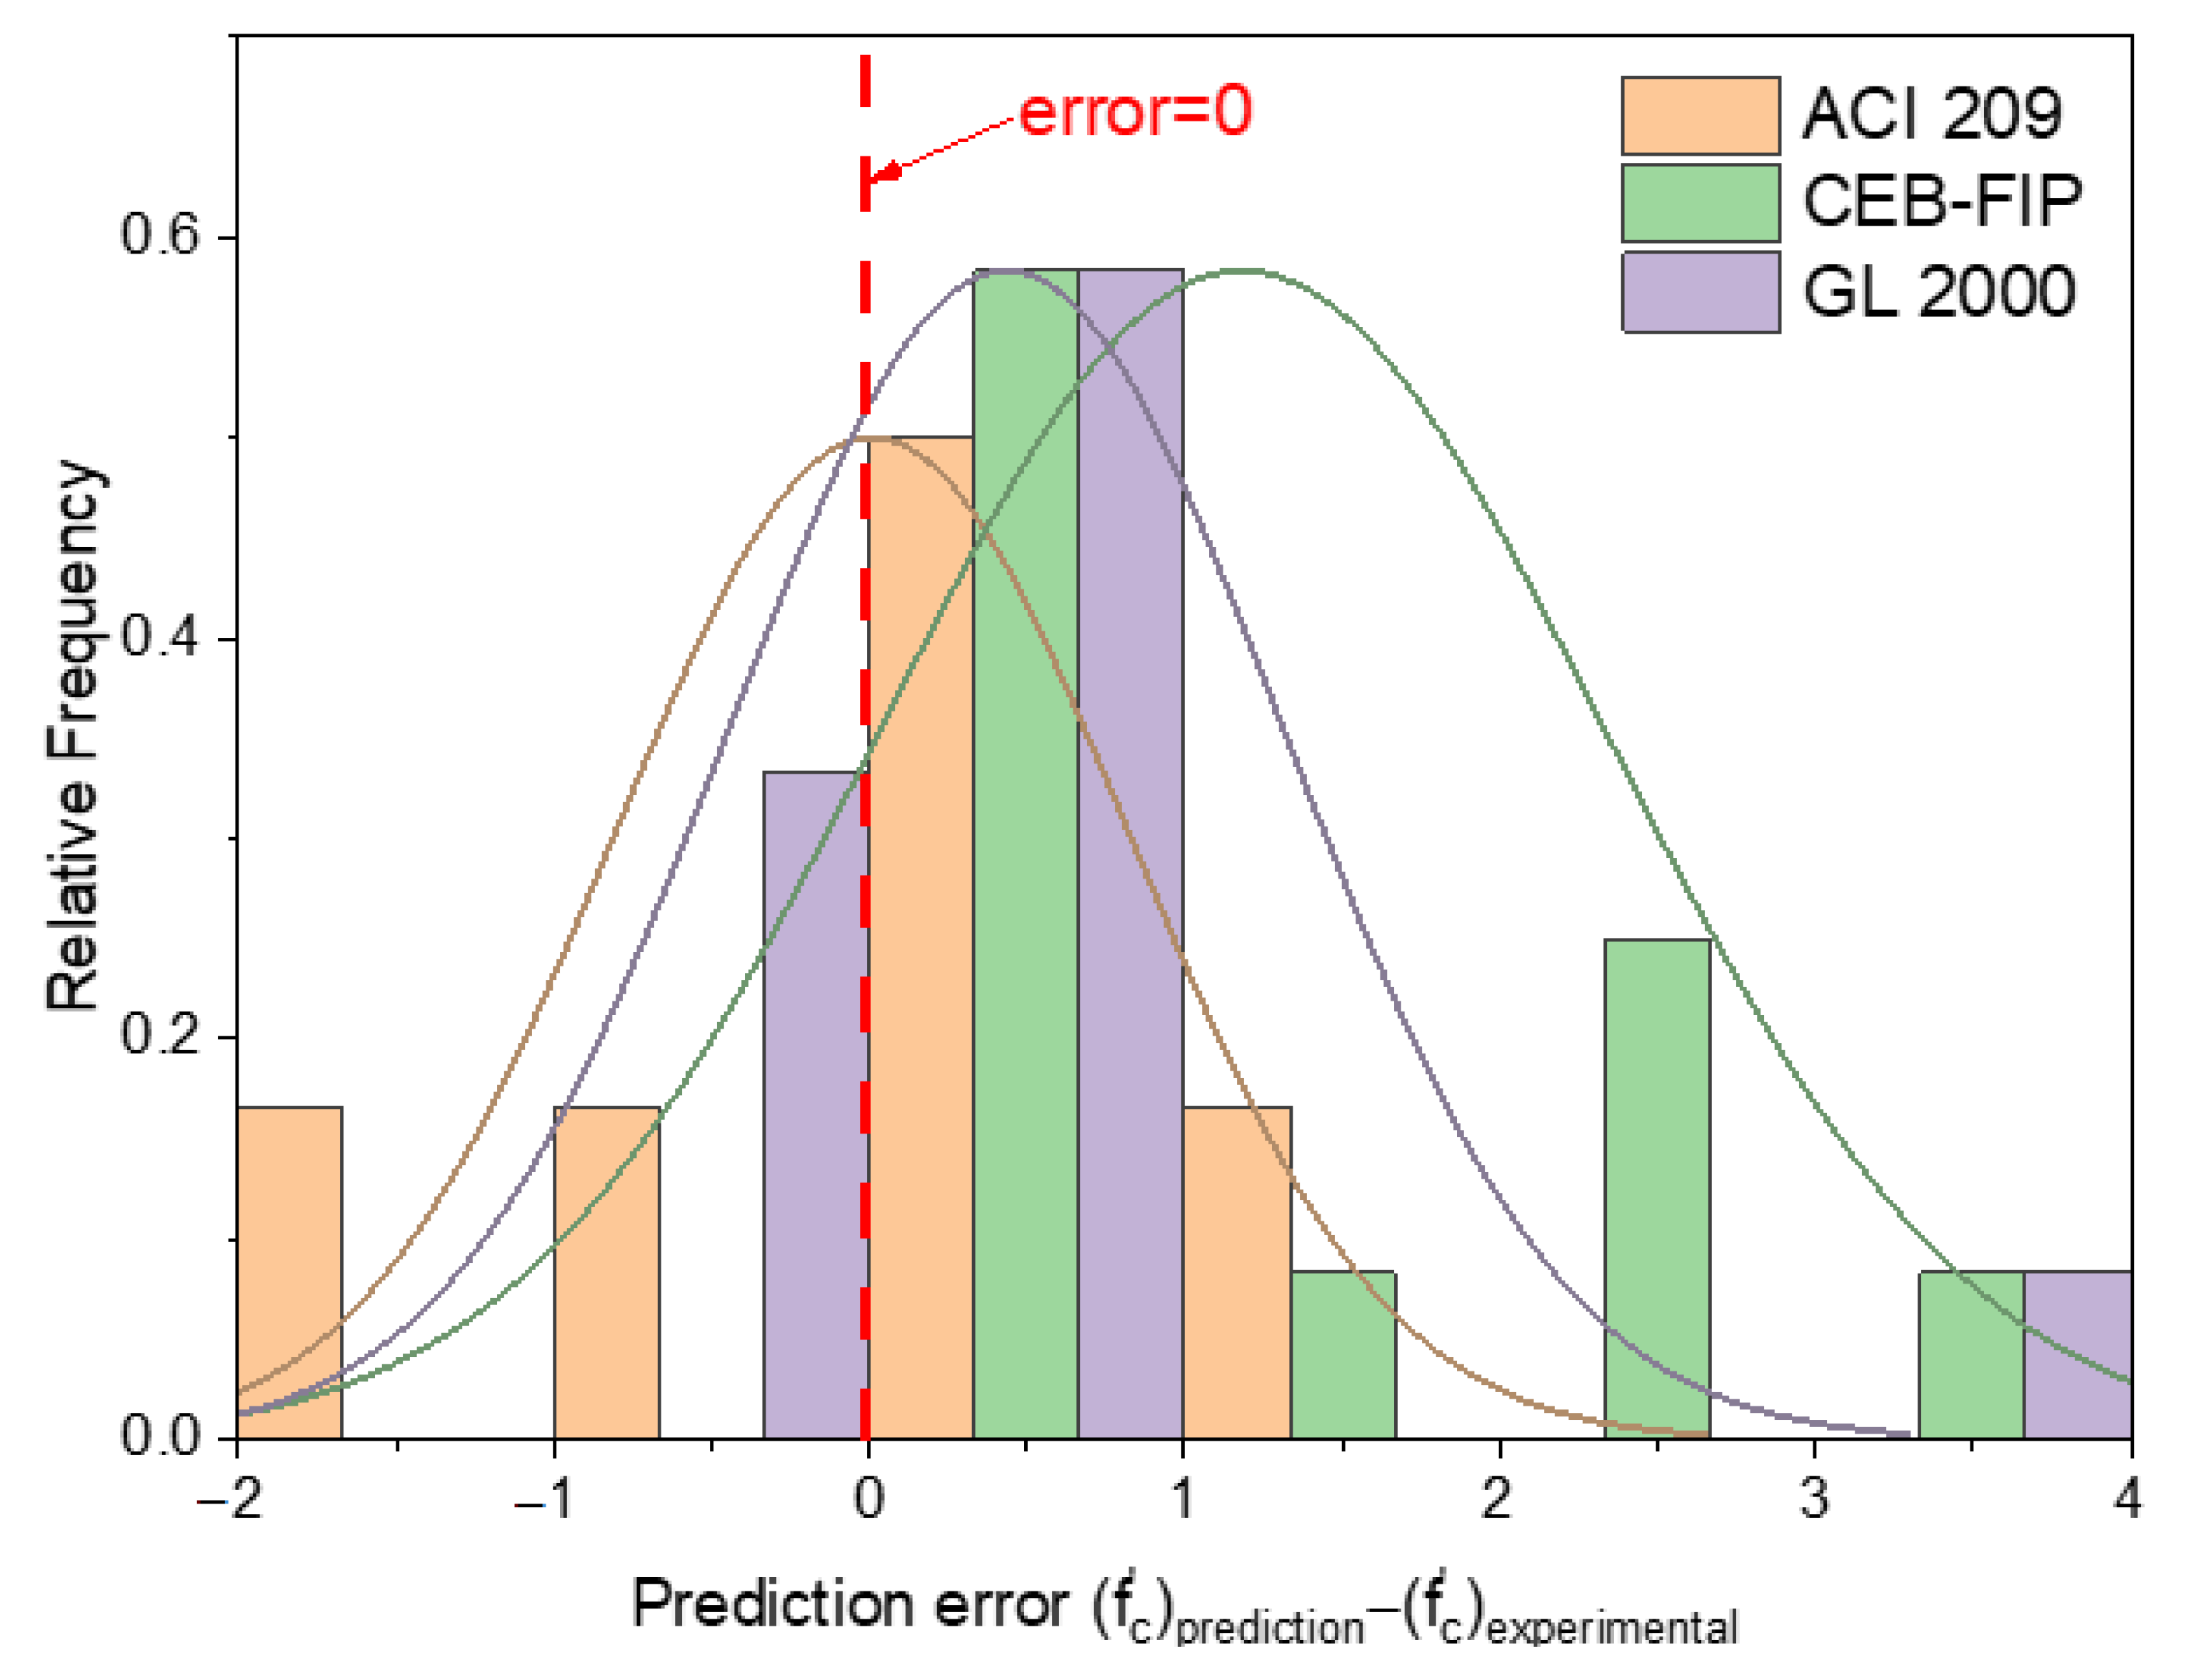
Table 6 are based on the plain cementitious materials without the addition of PPF. The error between the prediction models and the compressive strength test results of plain cement mortar under a 0.3 kN/s loading speed in this work is shown in
Figure 6.
It can be seen from
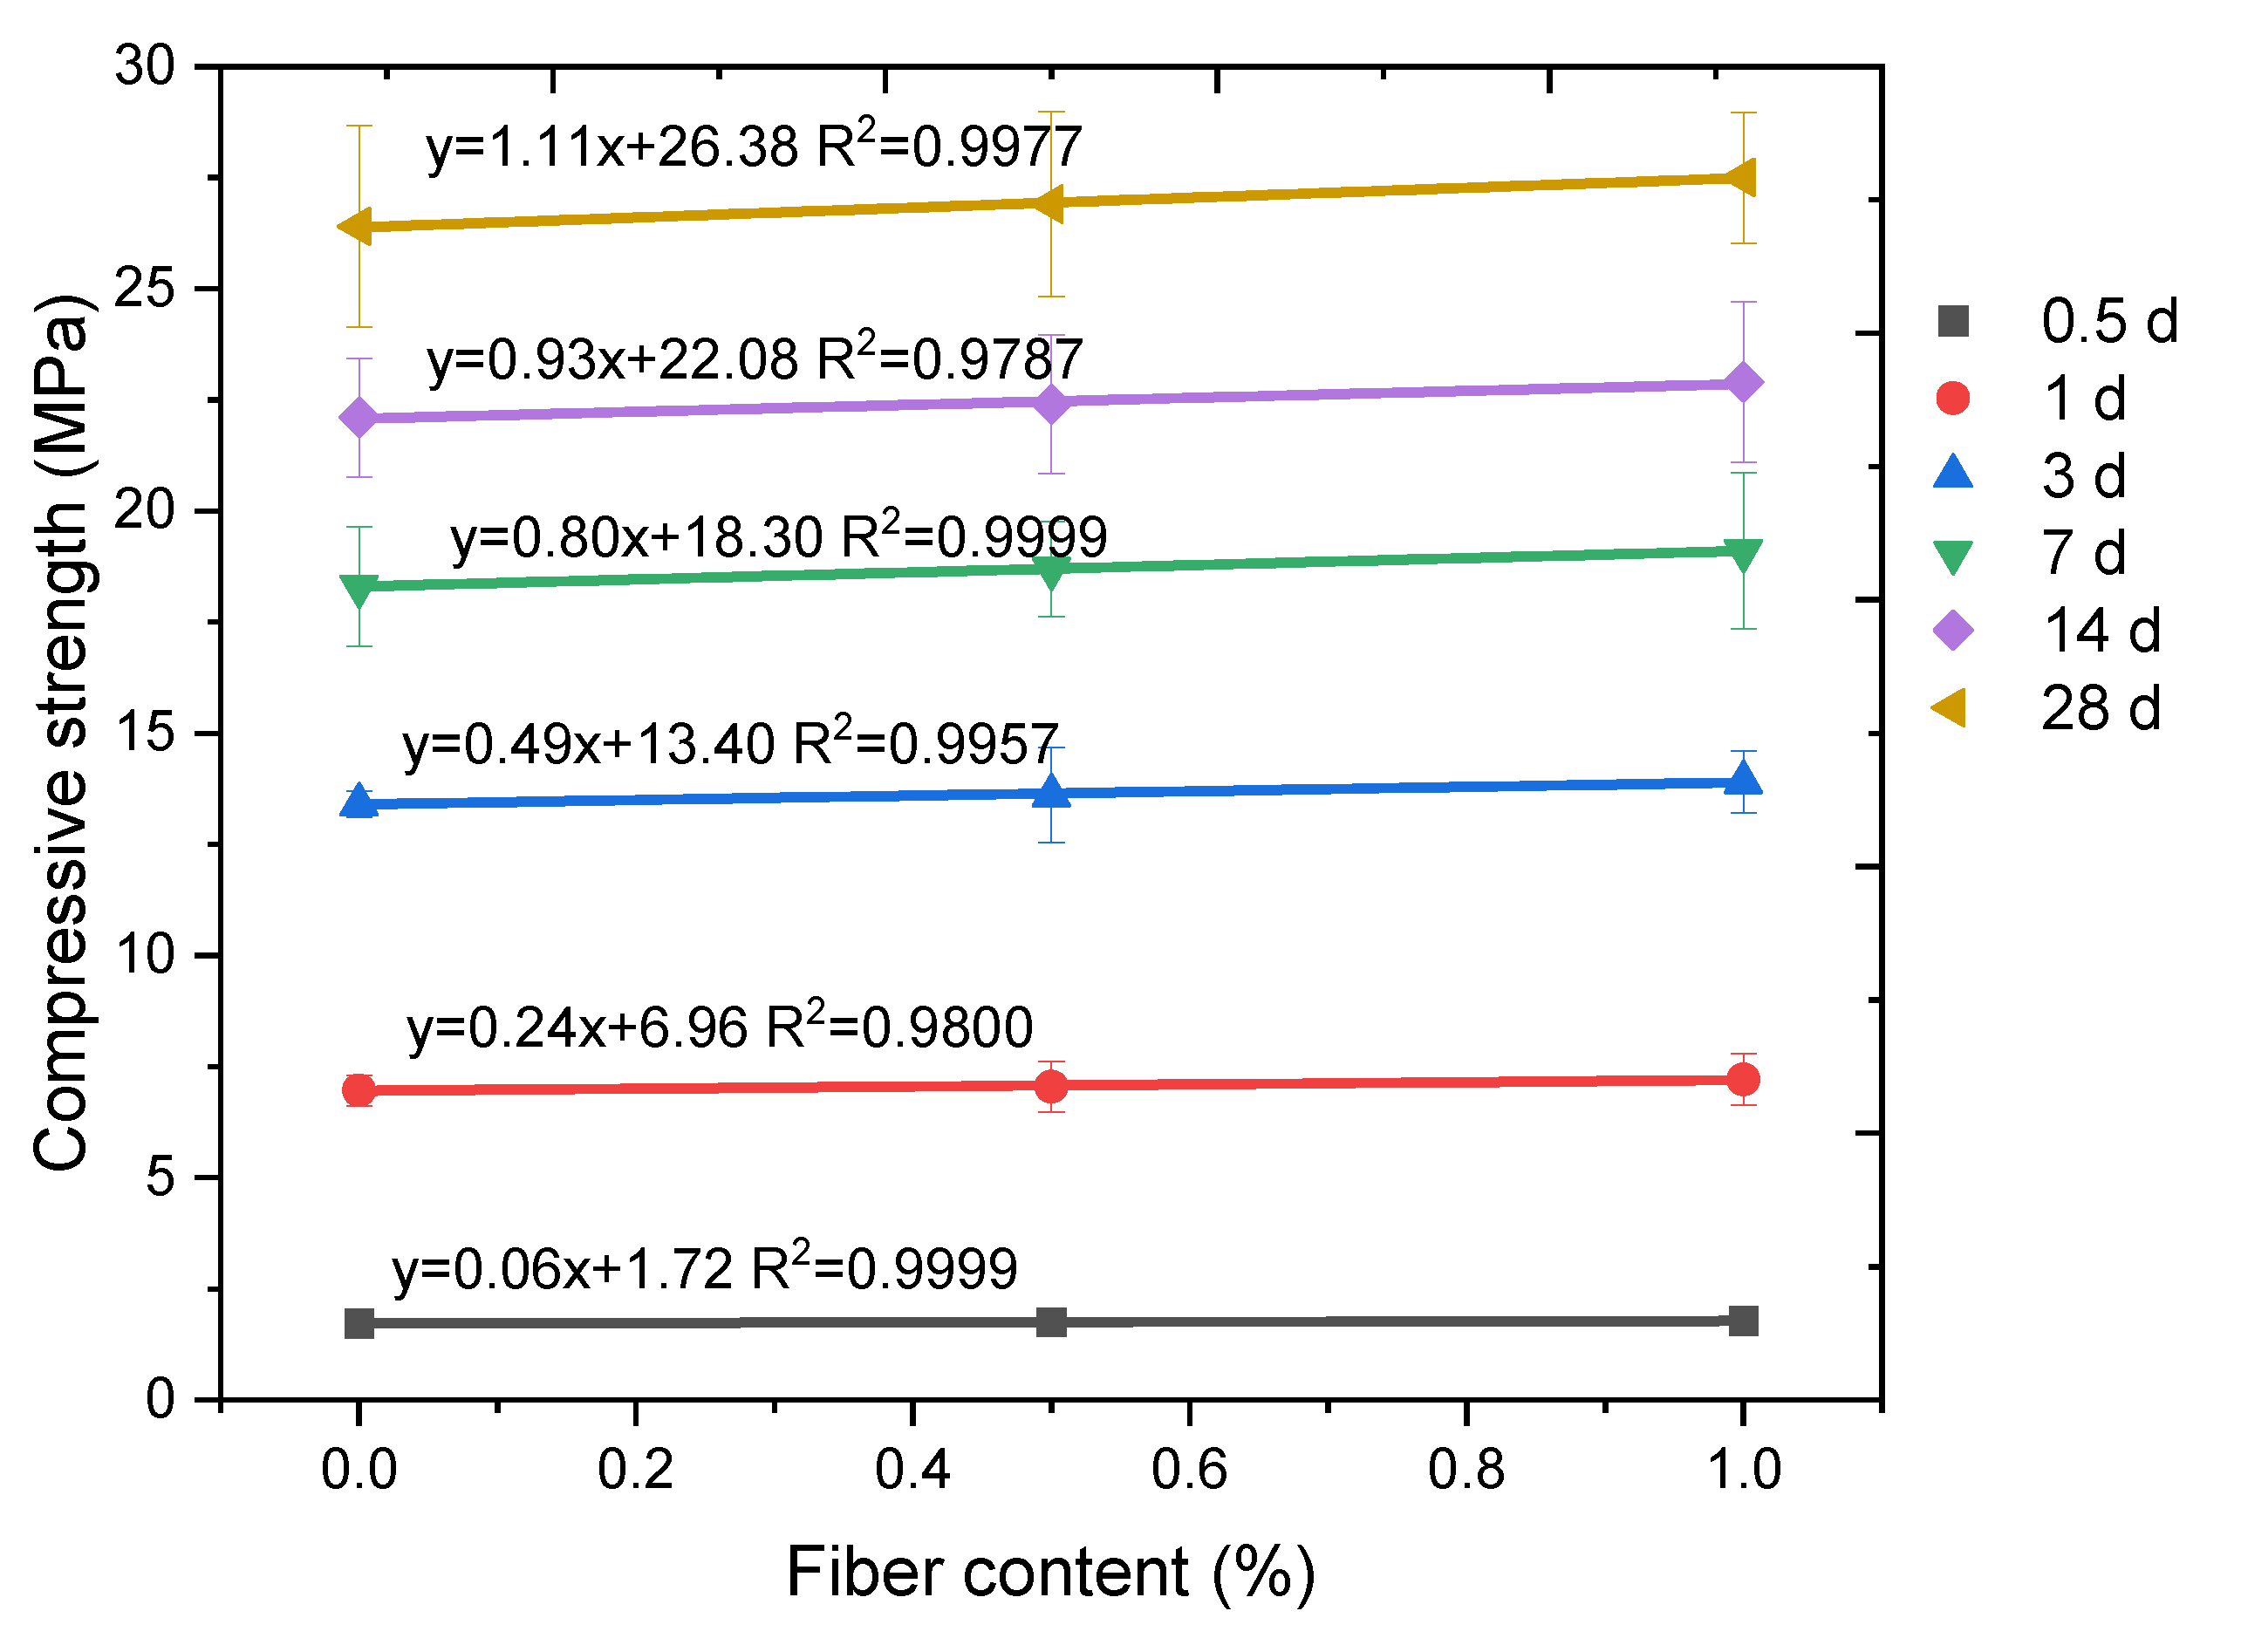
Figure 6 that the ACI 209 model provided the best prediction results for plain cement mortar compressive strength. Thus, in this work, the proposed prediction model for PPF mortar under different loading speeds was based on the ACI 209 model. A series of very good linear relationships between the fiber content and compressive strength under a 0.3 kN/s loading speed can be observed in
Figure 7, with all fitting parameters (R
2) being higher than 0.97. For the linear relationship between the fiber content and compressive strength, the basic relationship can be summarized as:
where
(fc)%PPF denotes the compressive strength of different contents of PPF fiber,
x denotes the PPF fiber content,
k1 denotes the fitting parameter in terms of the fiber content’s influence on compressive strength, and
(fc)0%PPF denotes the compressive strength of plain cement mortar.
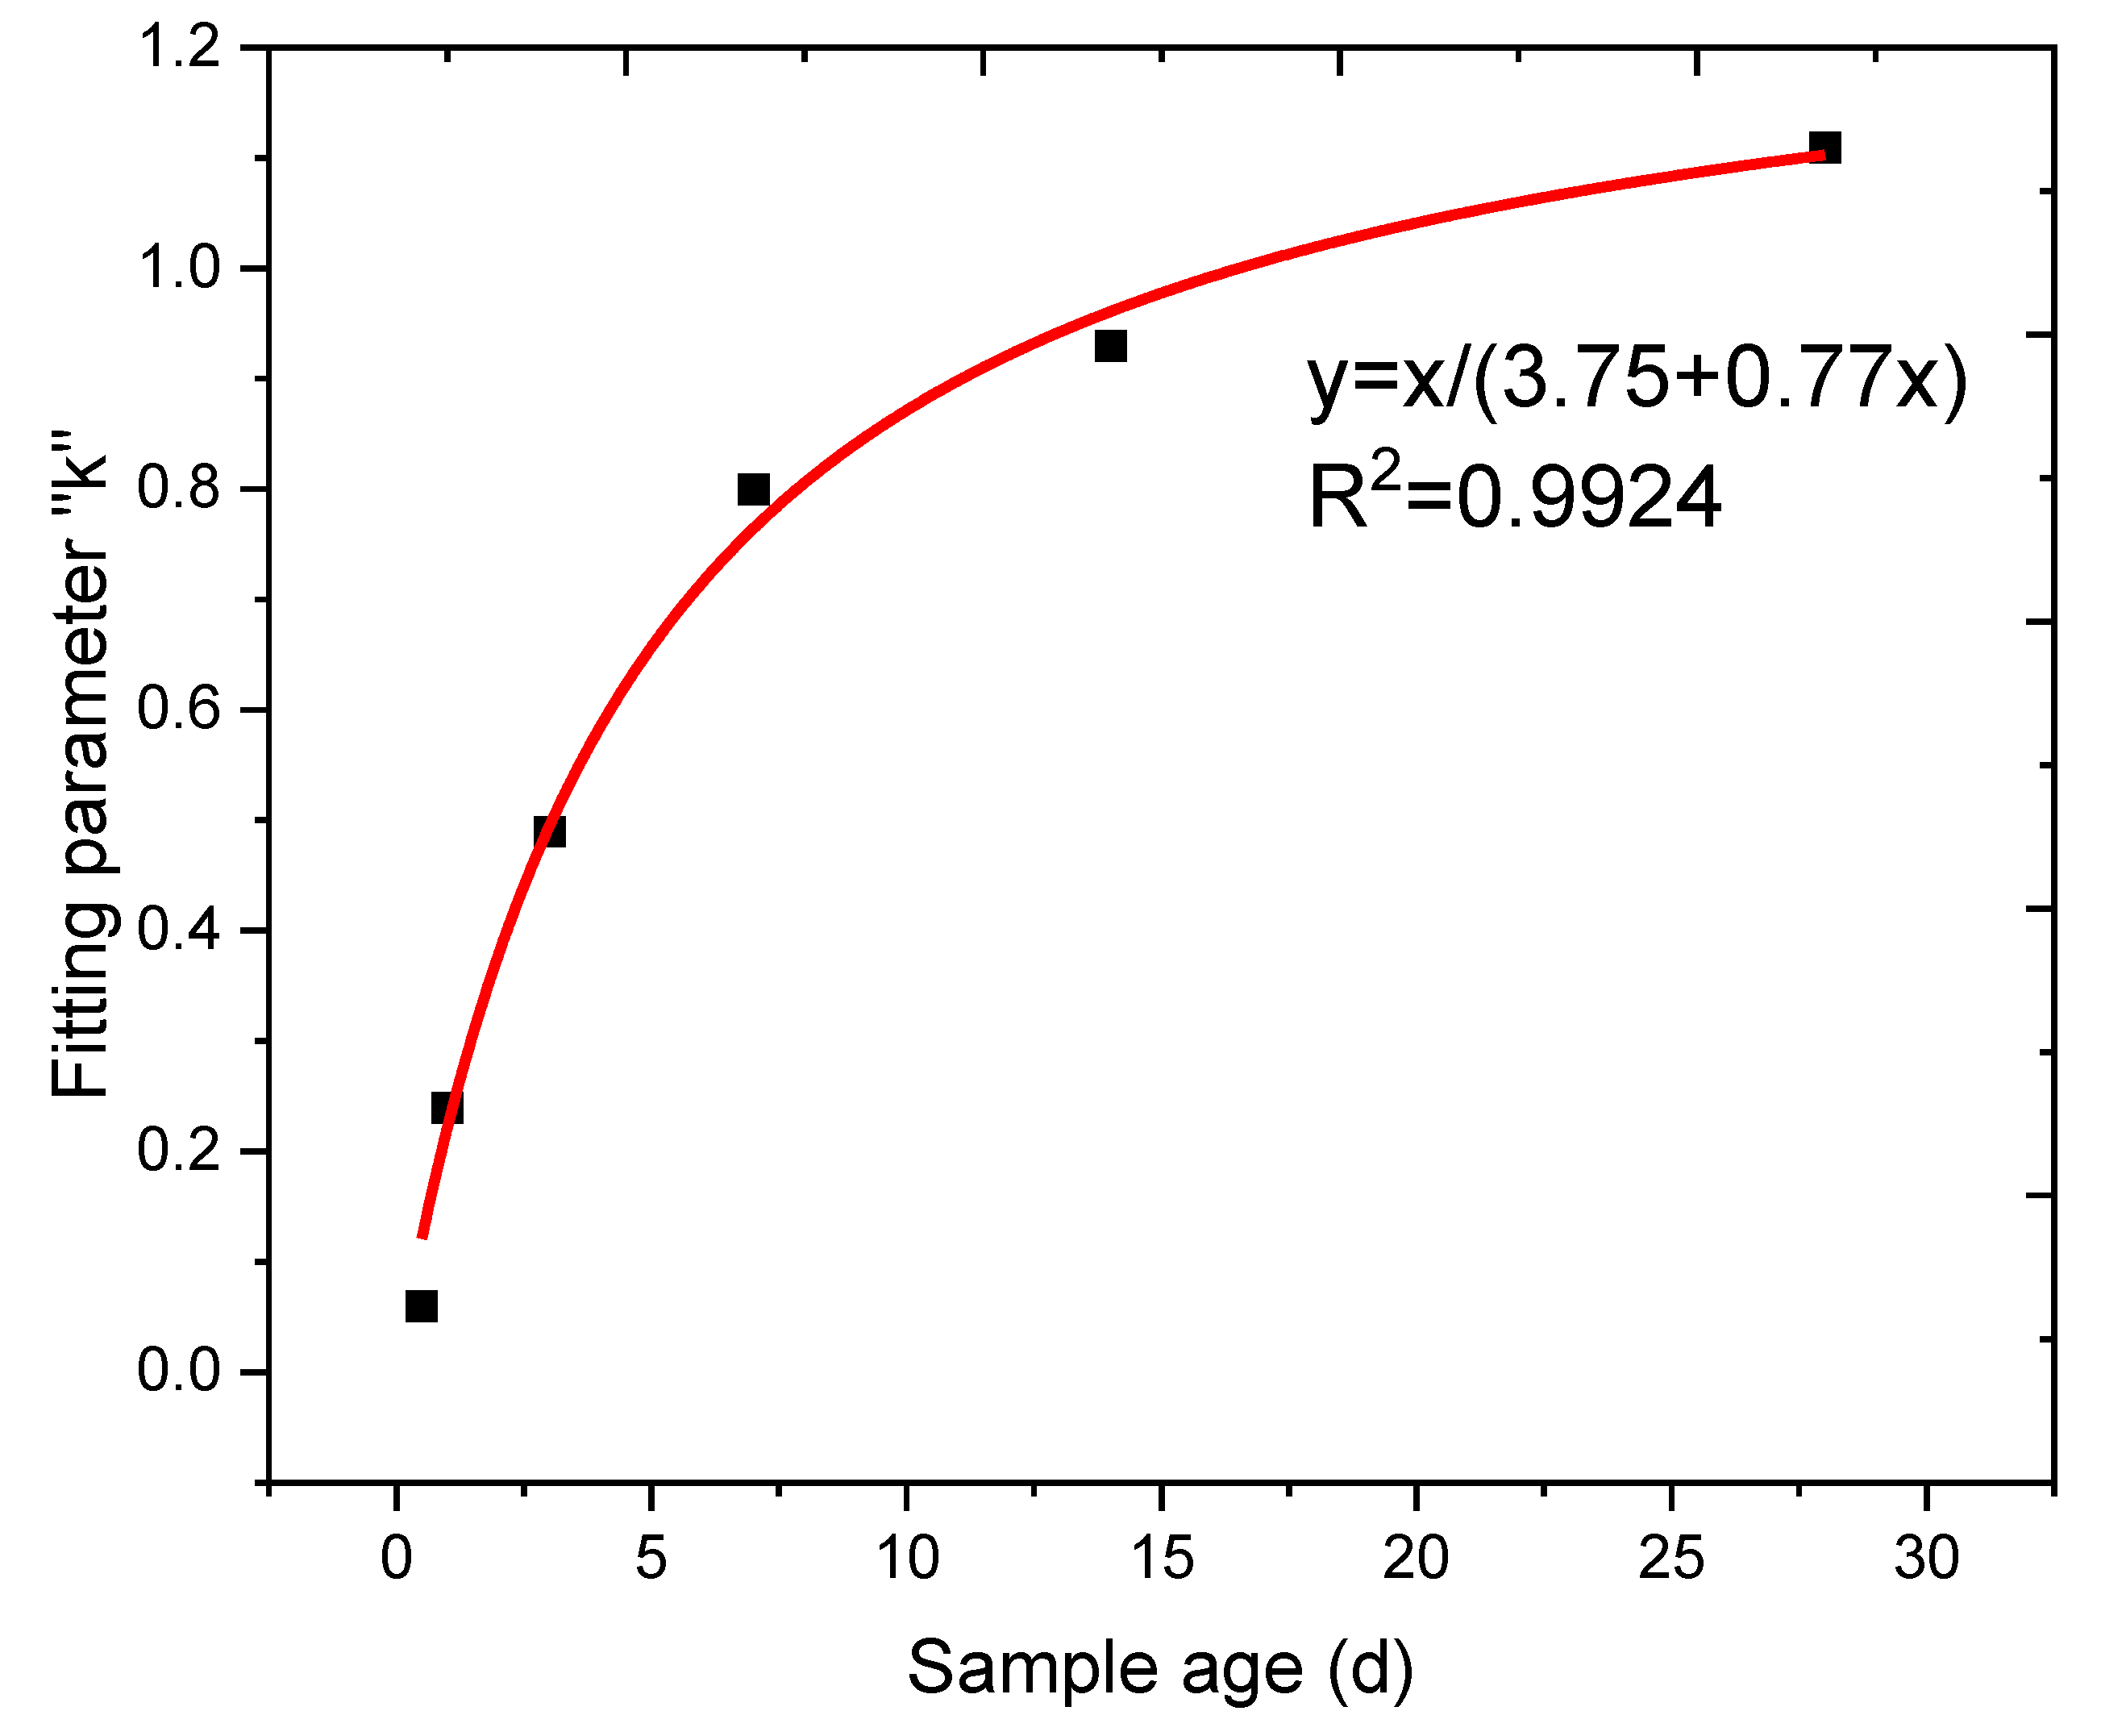
In this work, the compressive strength of plain cement mortar under different ages was predicted using the ACI 209 model. The relationship between the fiber content’s fitting parameter
k and the sample age is presented in
Figure 8. Thus, the time-dependent model for the PPF cement mortar compressive strength prediction model can be expressed as:
where
(fc)t,%PPF denotes the compressive strength (MPa) of cement mortar at age
t (days) with
x (%) content of PPF fiber,
(fc)28,%PPF denotes the compressive strength (MPa) of cement mortar at age 28 (days) with 0 (%) content of PPF fiber.
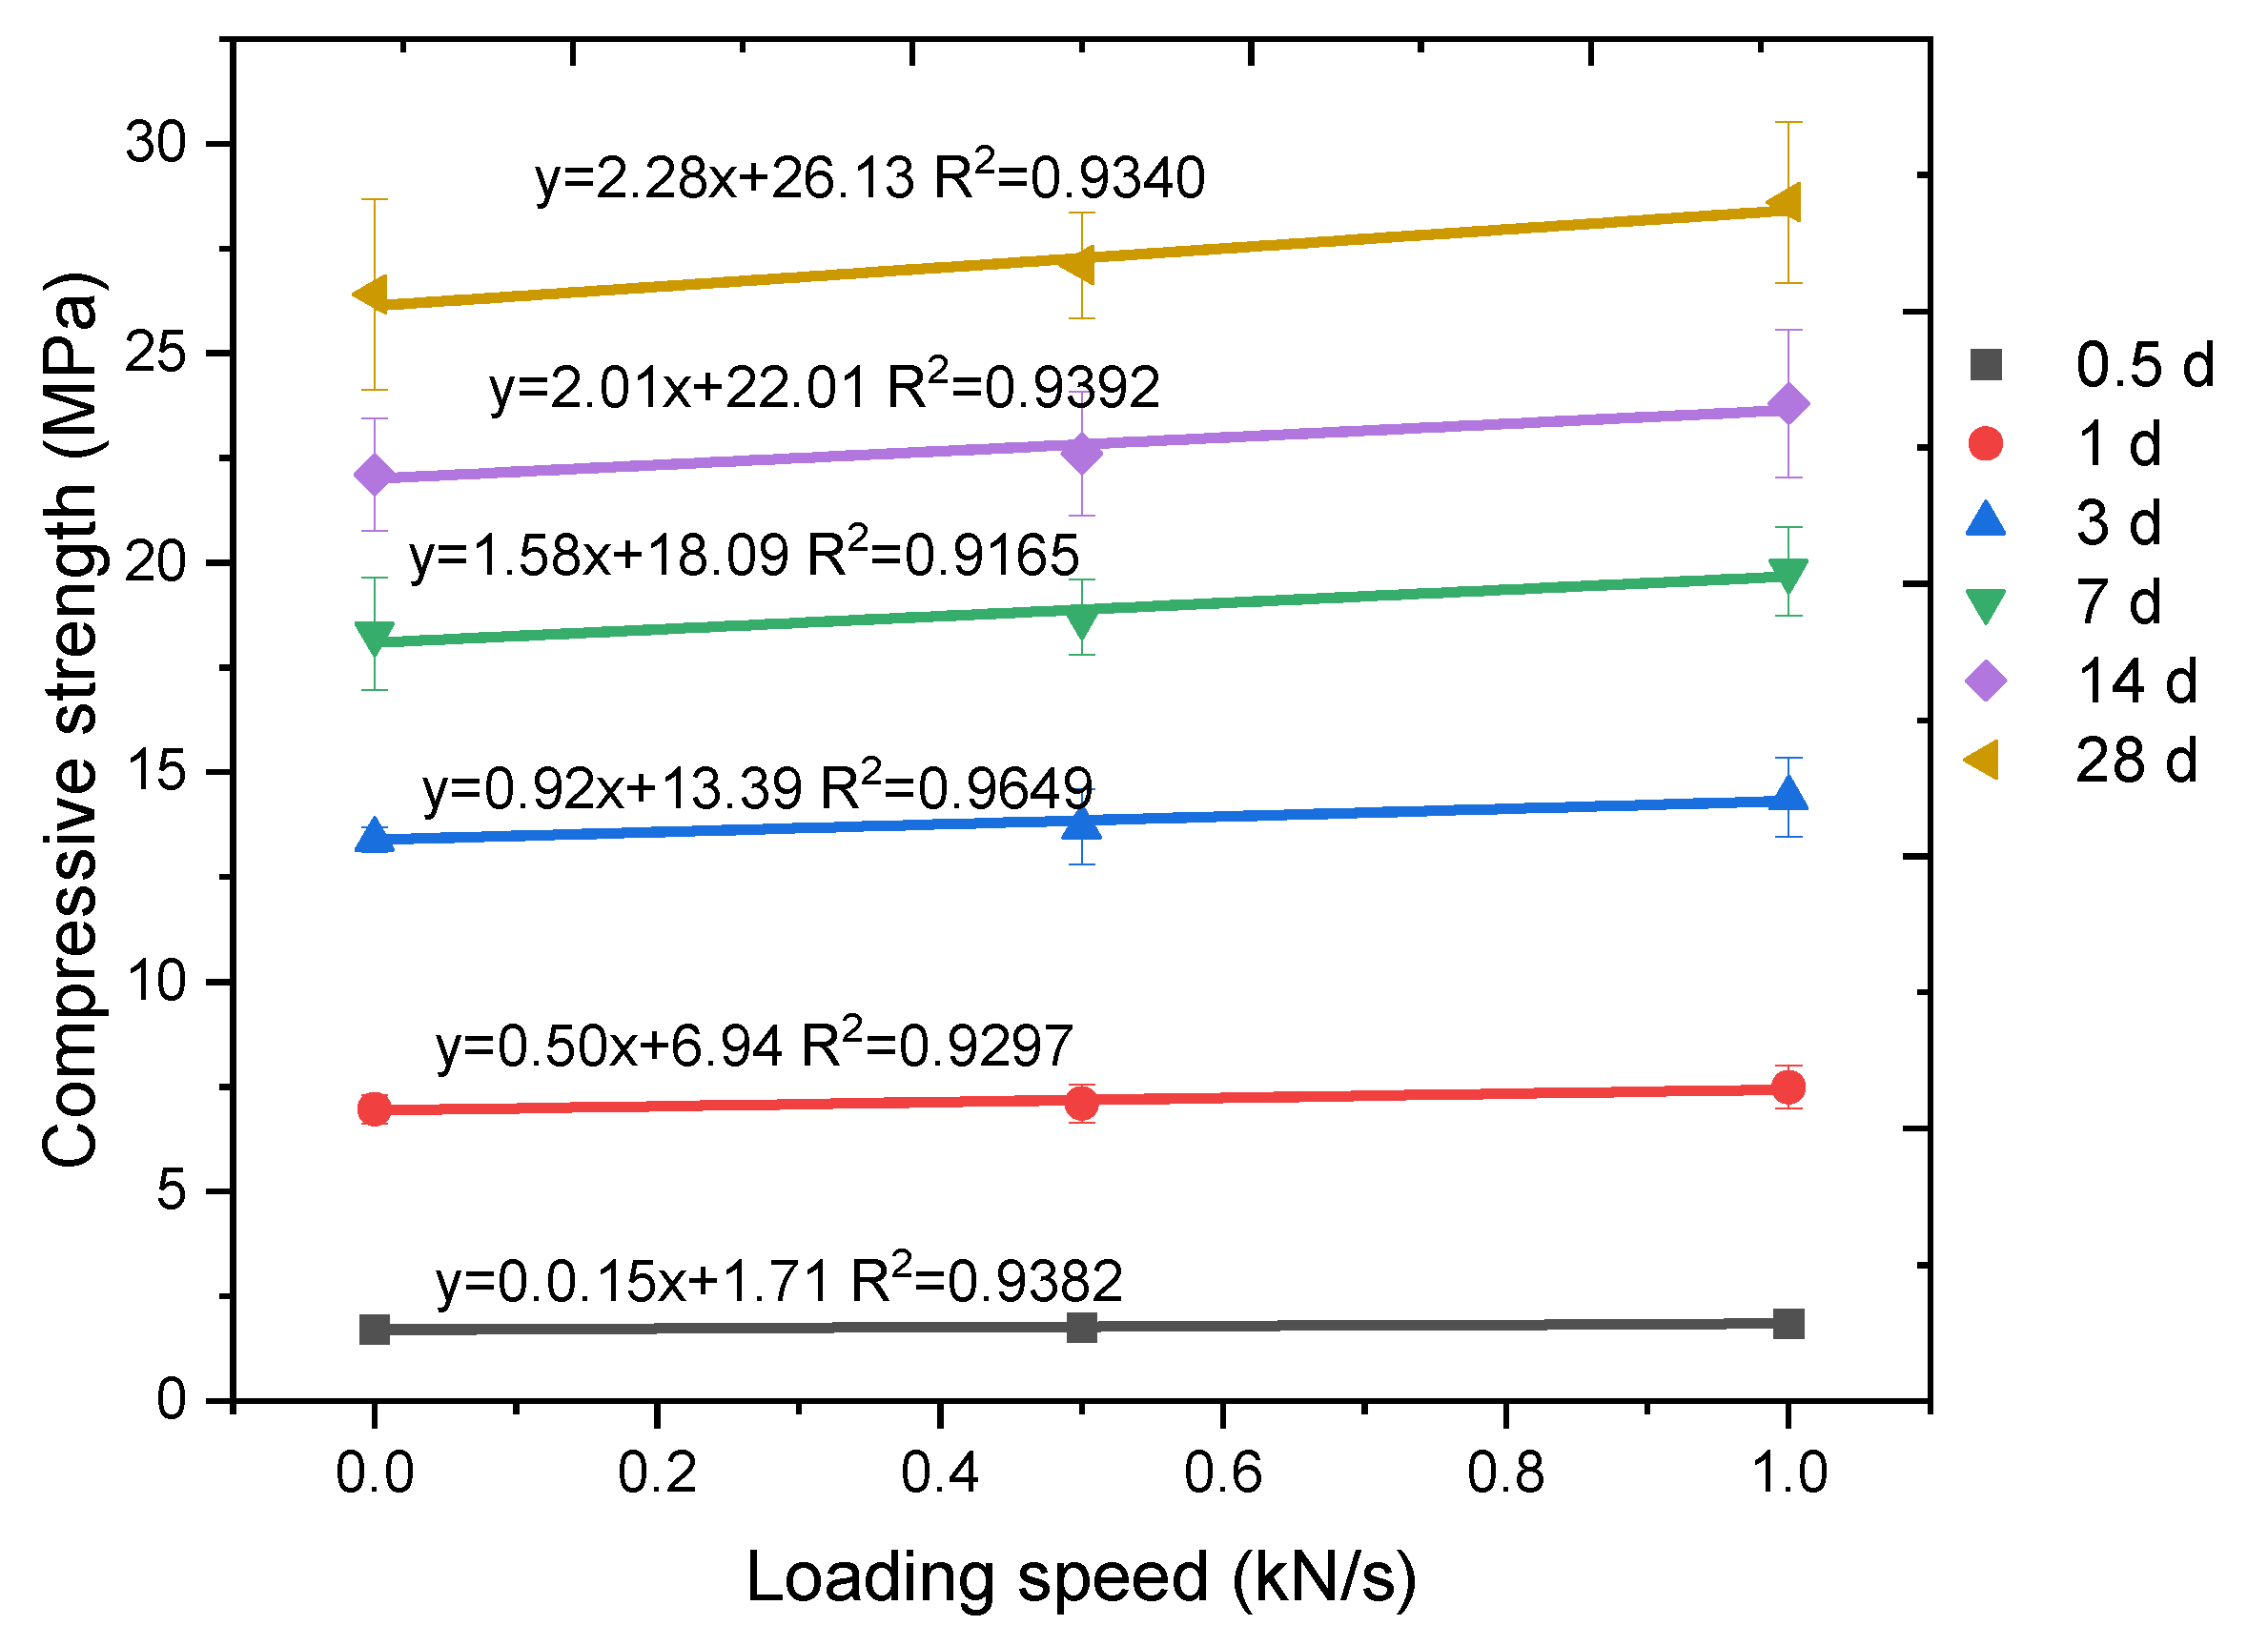
The relationship between the loading speed and compressive strength of plain cement mortar is summarized in
Figure 9. A series of linear relationships could be obtained, with all linear fitting parameters (R
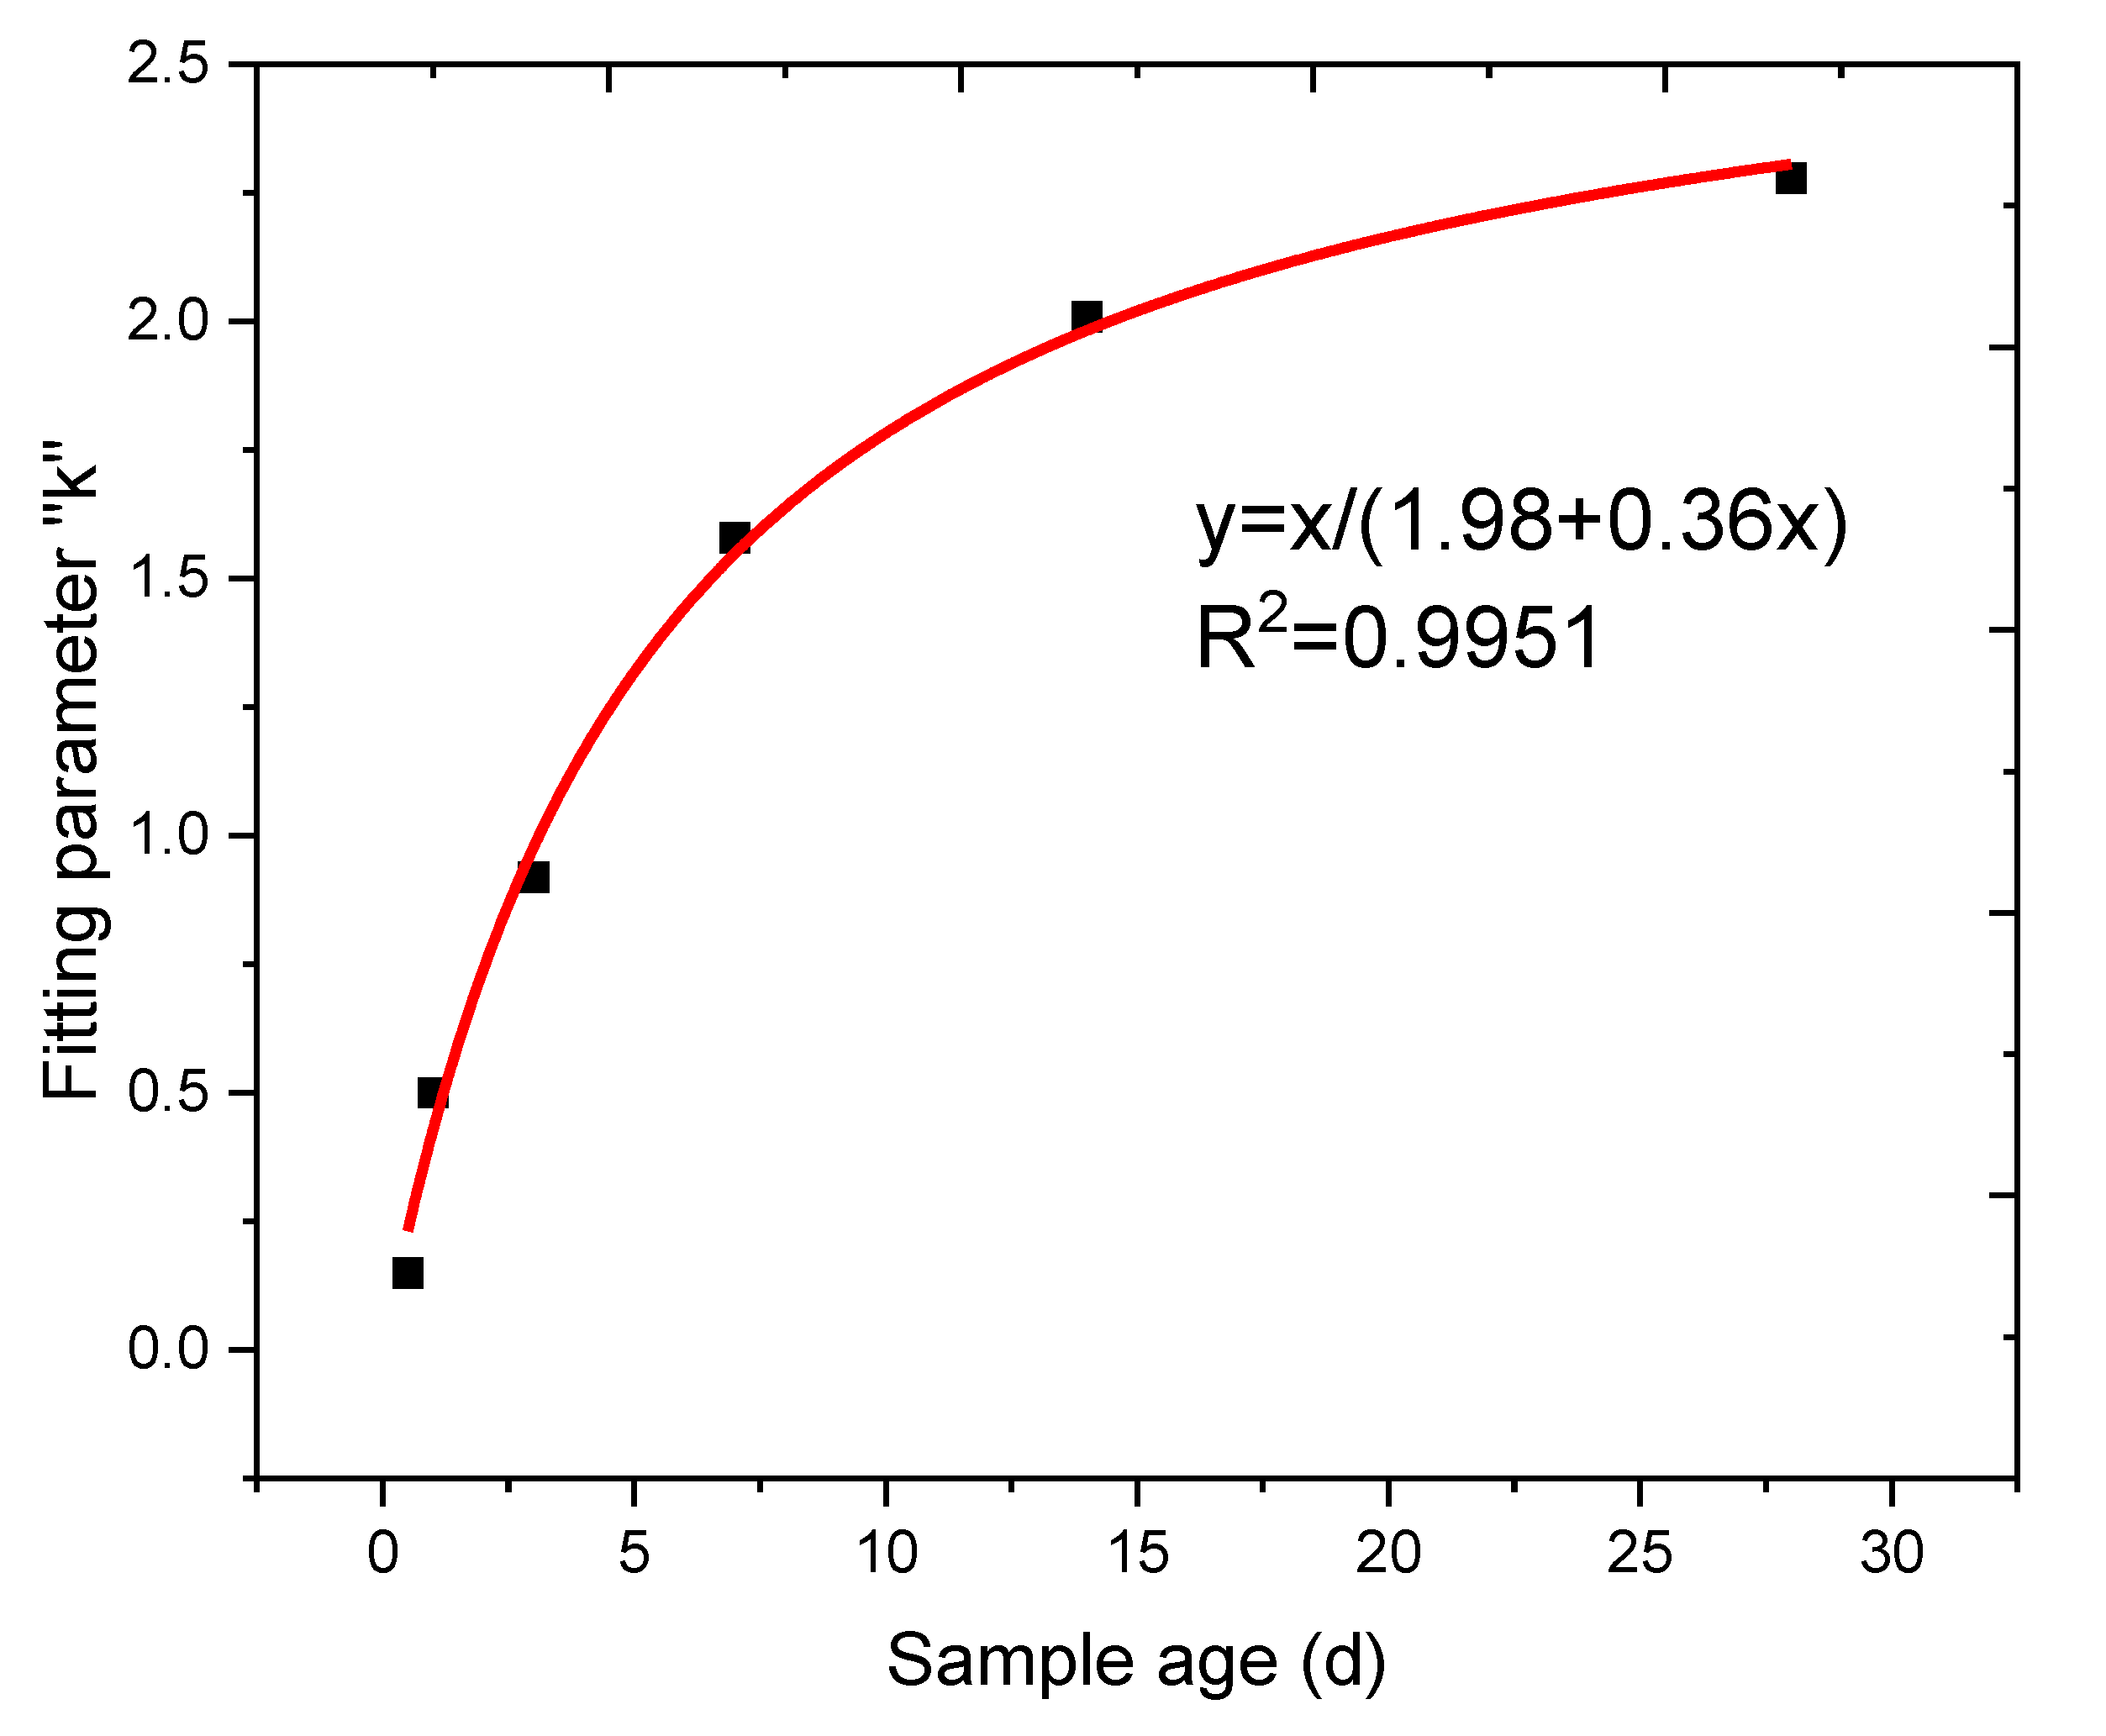
2) being higher than 0.91. Similar to the influence of fiber content, the time-dependent relationship of loading speed in terms of the compressive strength’s linear fitting parameter “
k2” and sample age are presented in
Figure 10.
Thus, the time-dependent model for PPF cement mortar compressive strength prediction model under different loading speeds can be expressed as:
where
(fc)t,%PPF,kN/s denotes the compressive strength (MPa) of cement mortar at age
t (days) with
x (%) content of PPF fiber and a test loading speed of
y (kN/s),
(fc)28,%PPF,0.3kN/s denotes the compressive strength (MPa) of cement mortar at age 28 (days) with 0 (%) content of PPF fiber under a test loading speed of 0.3 (kN/s).
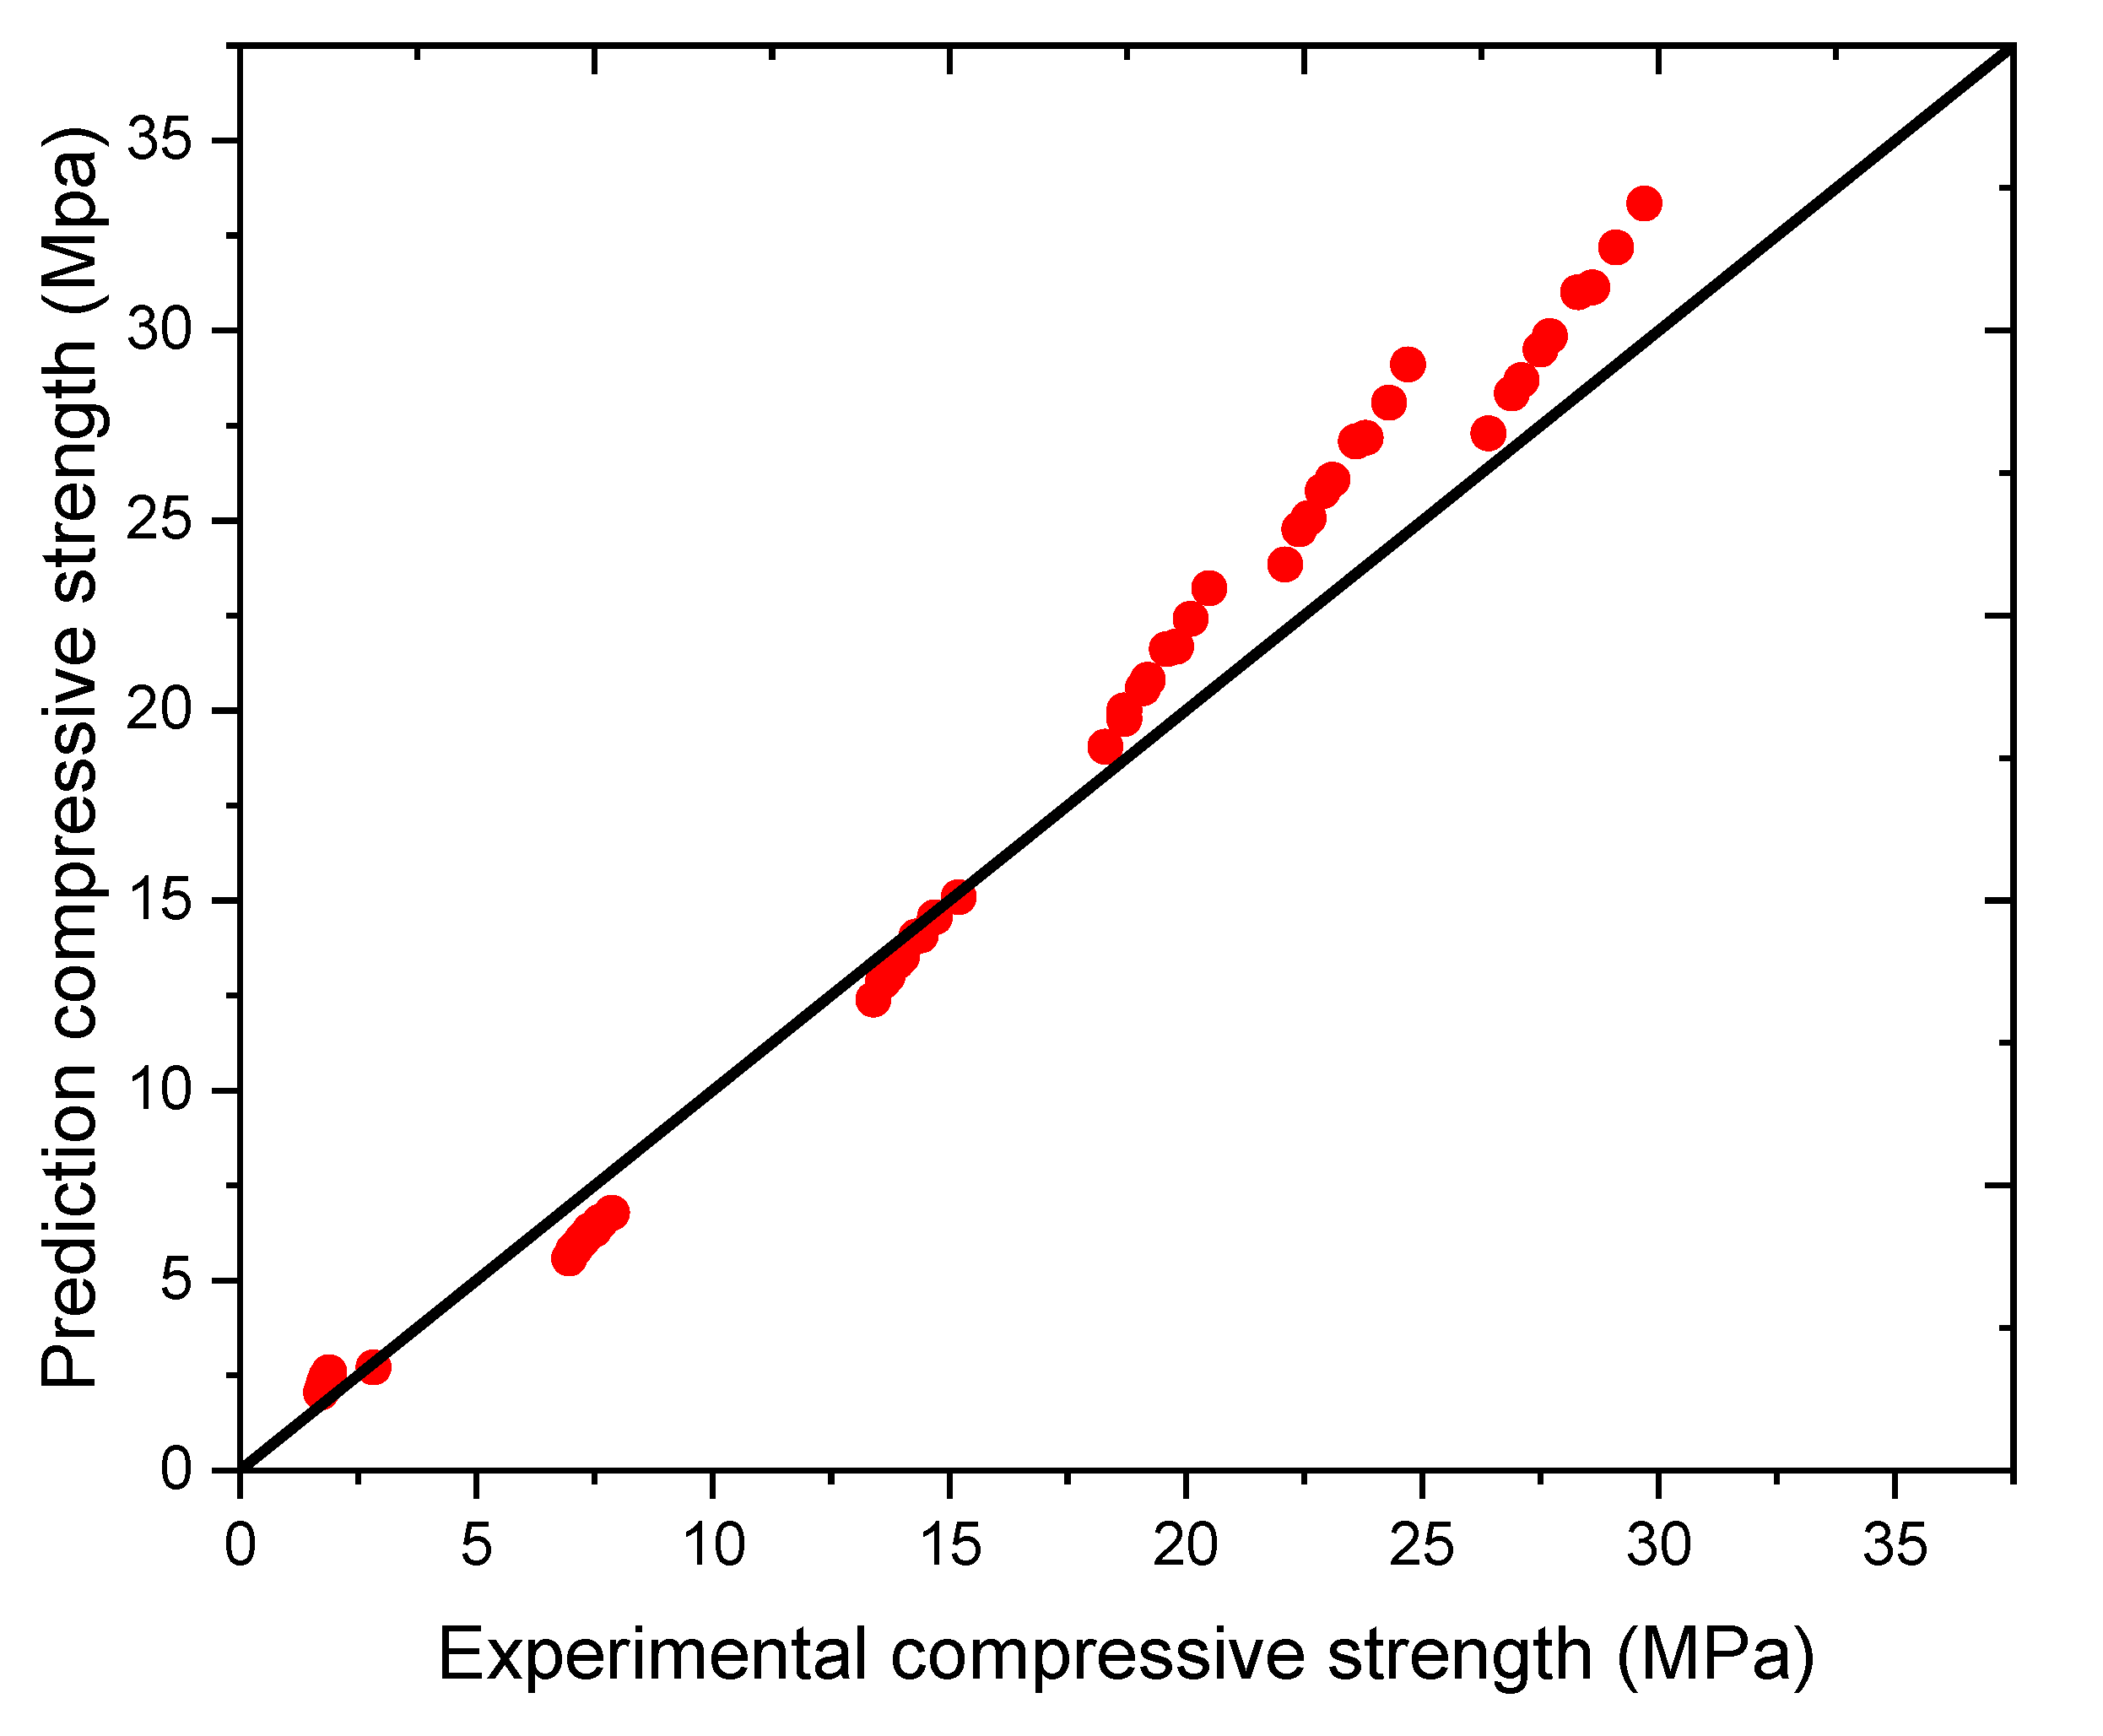
The predicted compressive strength in terms of experimental compressive strength is summarized in
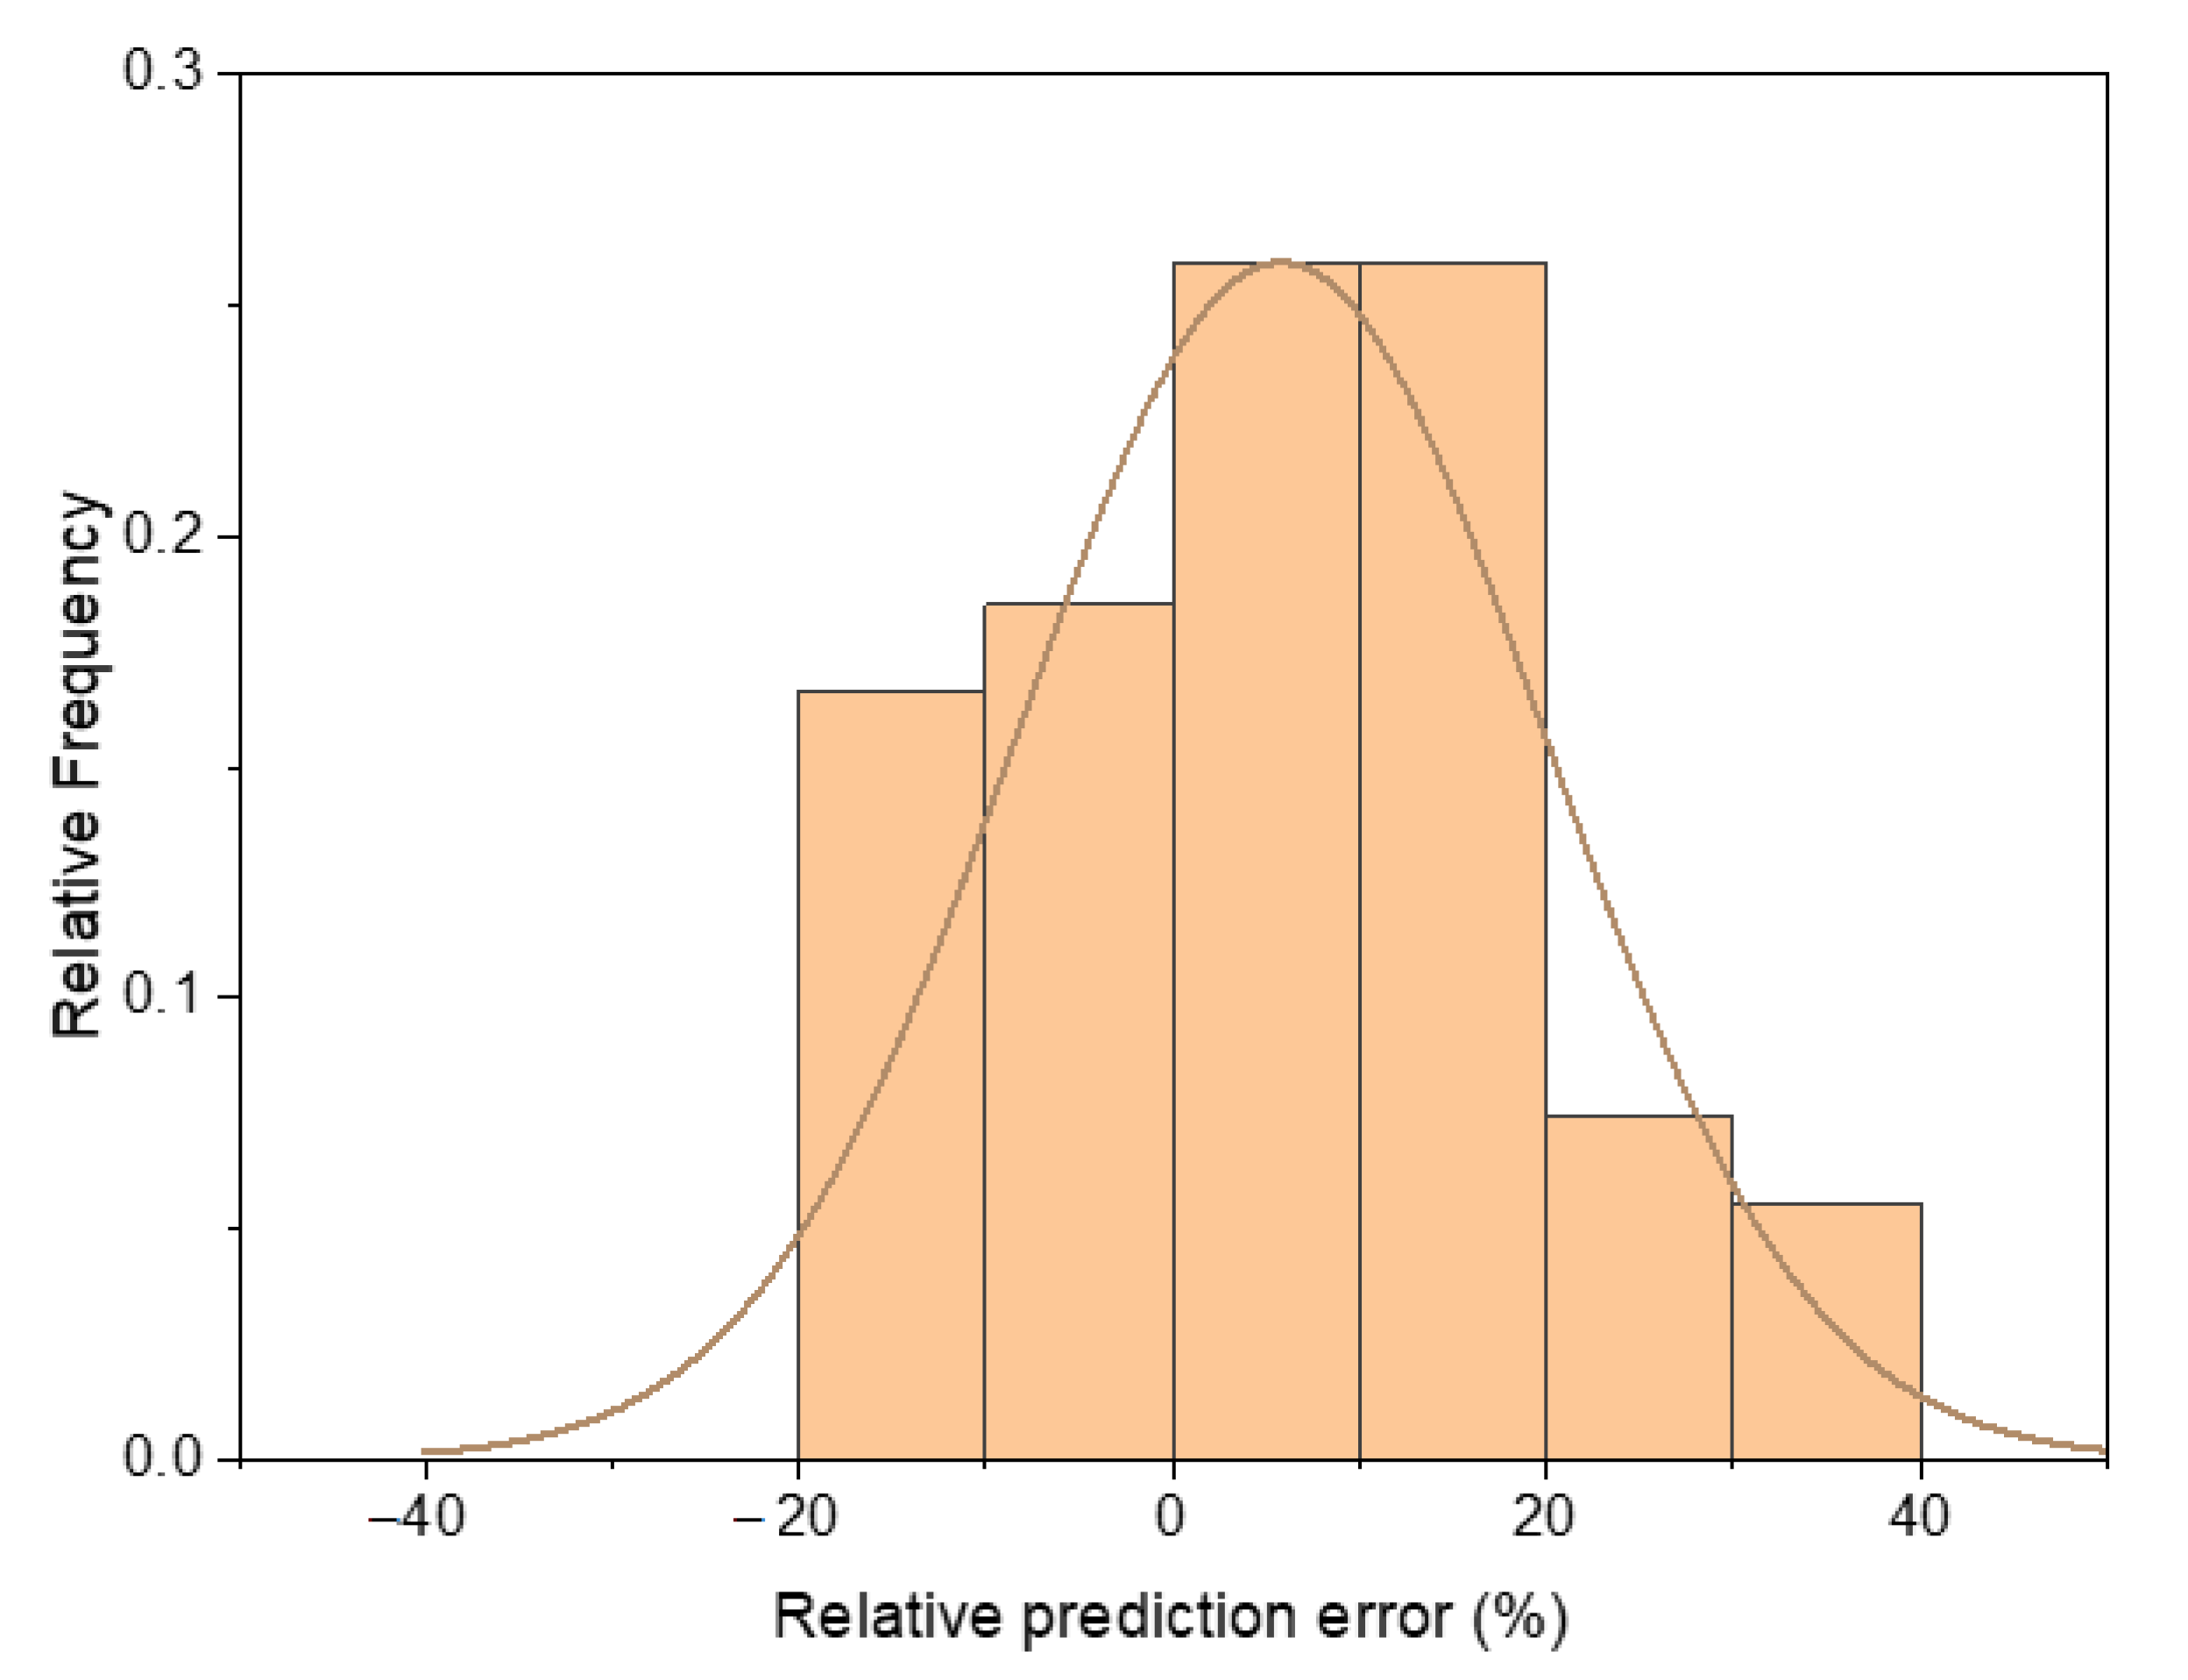
Figure 11, and the prediction errors are shown in
Figure 12. It can be seen that the predicted compressive strength for all of the mixtures was close to the experimental data, which indicates that Equation (3) can be used to predict the compressive strength of PPF cement mortar under different loading speeds for various sample ages. A total of 44.4% of the predicted data showed less than 10% error compared with the experimental data; this value improved to 70.4% when the error acceptance increased to 15%. Only 13.0% of the predicted data showed an error higher than 20%.
3.5. Analytical Model for Flexural Strength Prediction of PPF Mortar under Different Loading Speeds
Non-linear relationships between the cement mortar’s flexural strength and its independent variables (i.e., sample age, fiber content, and loading speed) can be performed by the Vipulanandan correlation model [
41,
42] as follows:
where
Y stands for the flexural strength of cement mortar;
A,
B, and
C represent the model parameters;
X denotes the independent variables (i.e., sample age, fiber content, and loading speed).
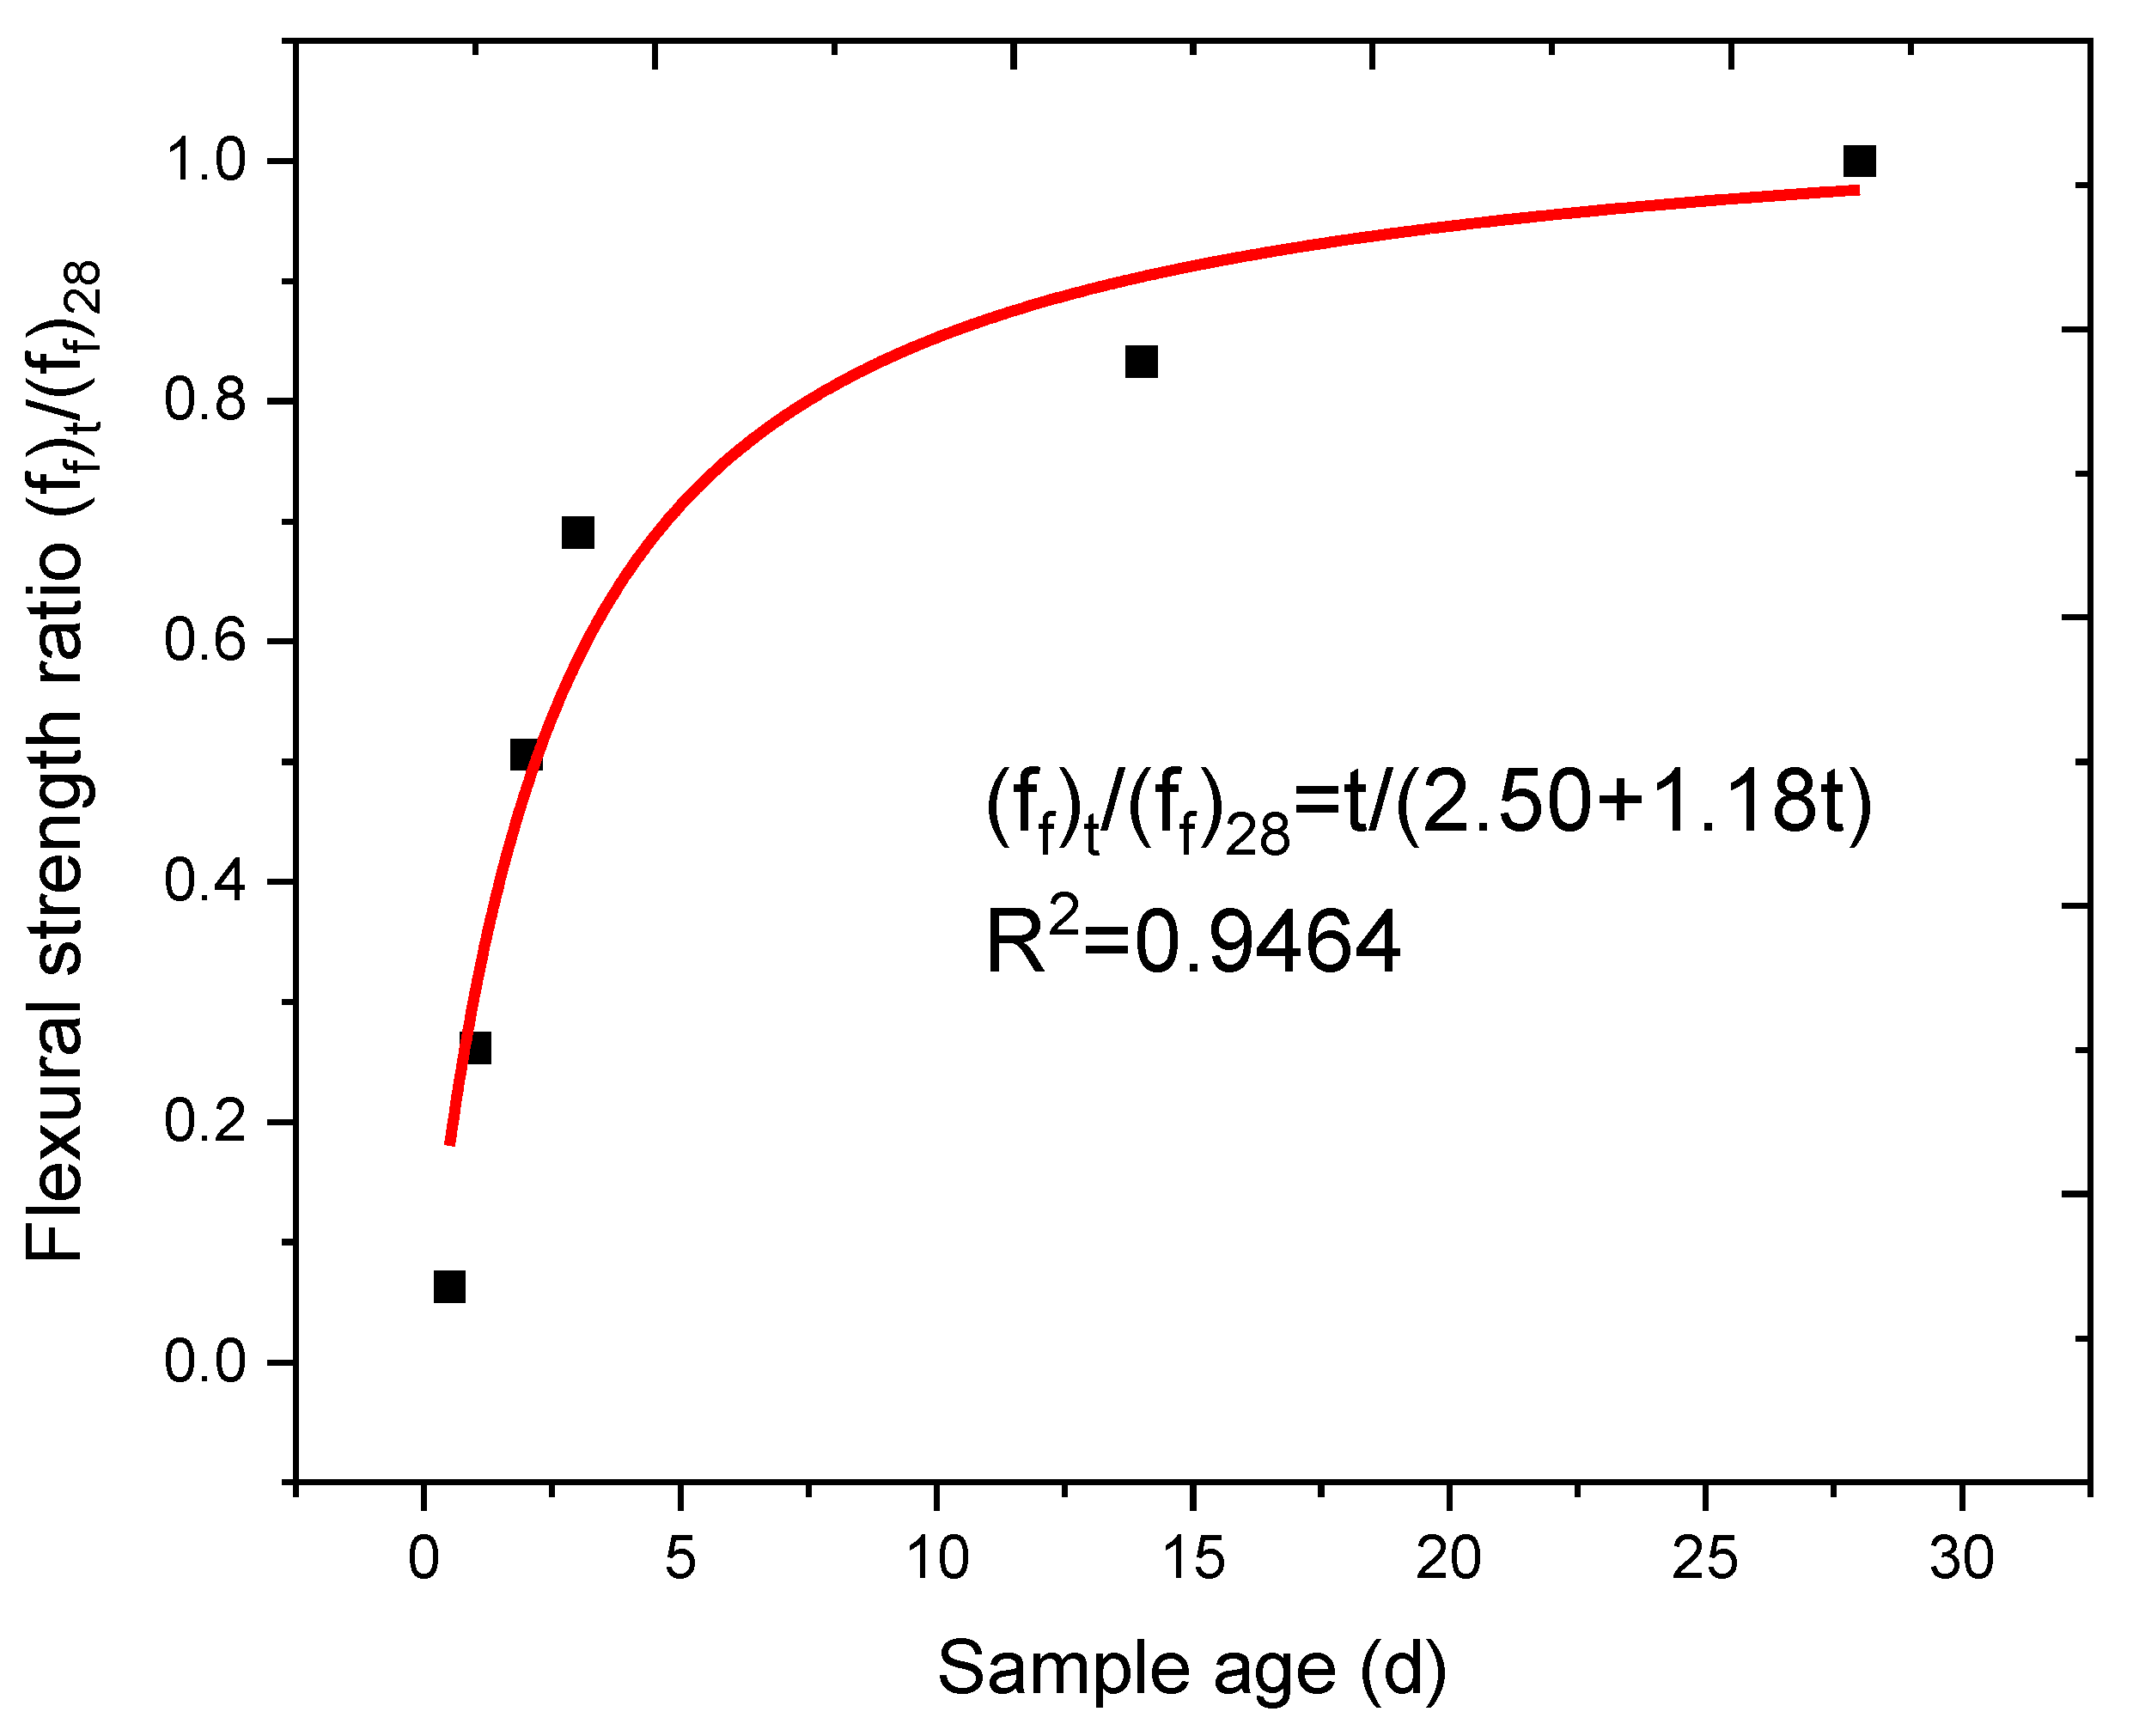
In this work, for plain cement mortar without PPF admixture and under a 0.3 kN/s loading speed, the flexural strength in terms of sample age can be written as:
where
(ff)t stands for the flexural strength of plain mortar under 0.3 kN/s at different ages, and
(ff)28 represents the flexural strength of plain mortar under 0.3 kN/s at 28 days of age.
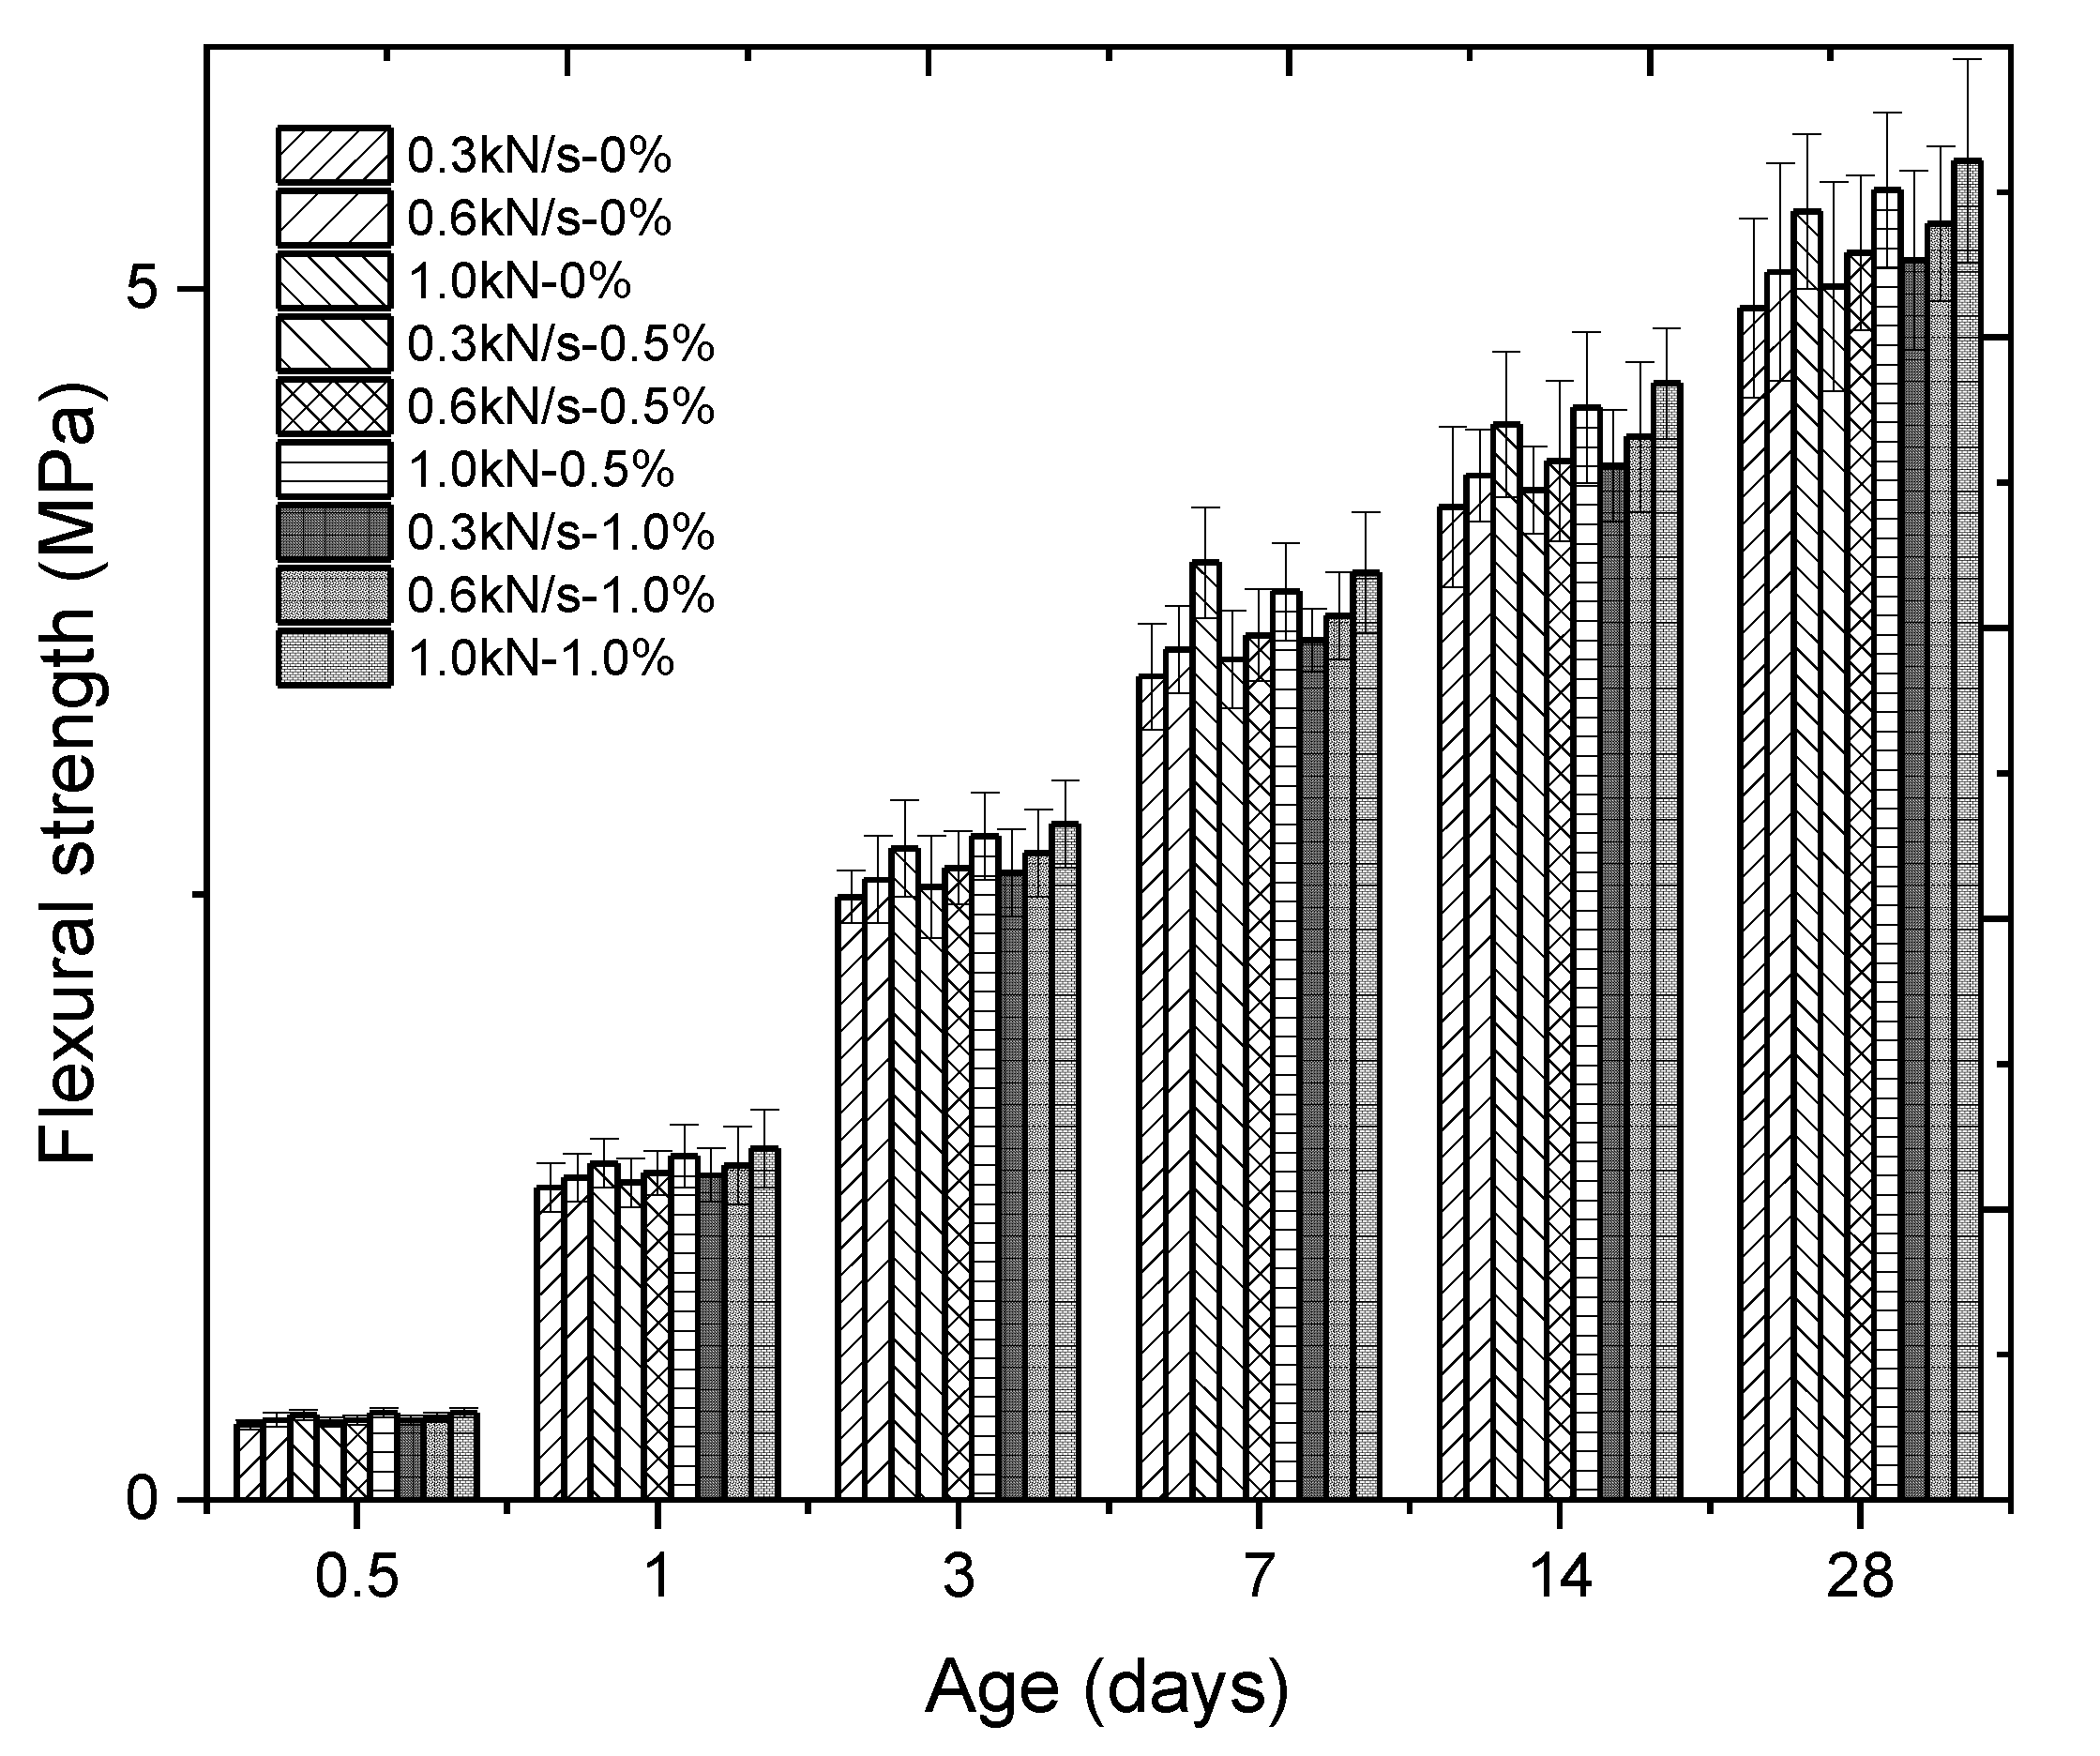
The fitting results between the sample age and flexural strength of plain mortar are shown in
Figure 13. The fitting parameter (R
2) was as high as 0.9464.
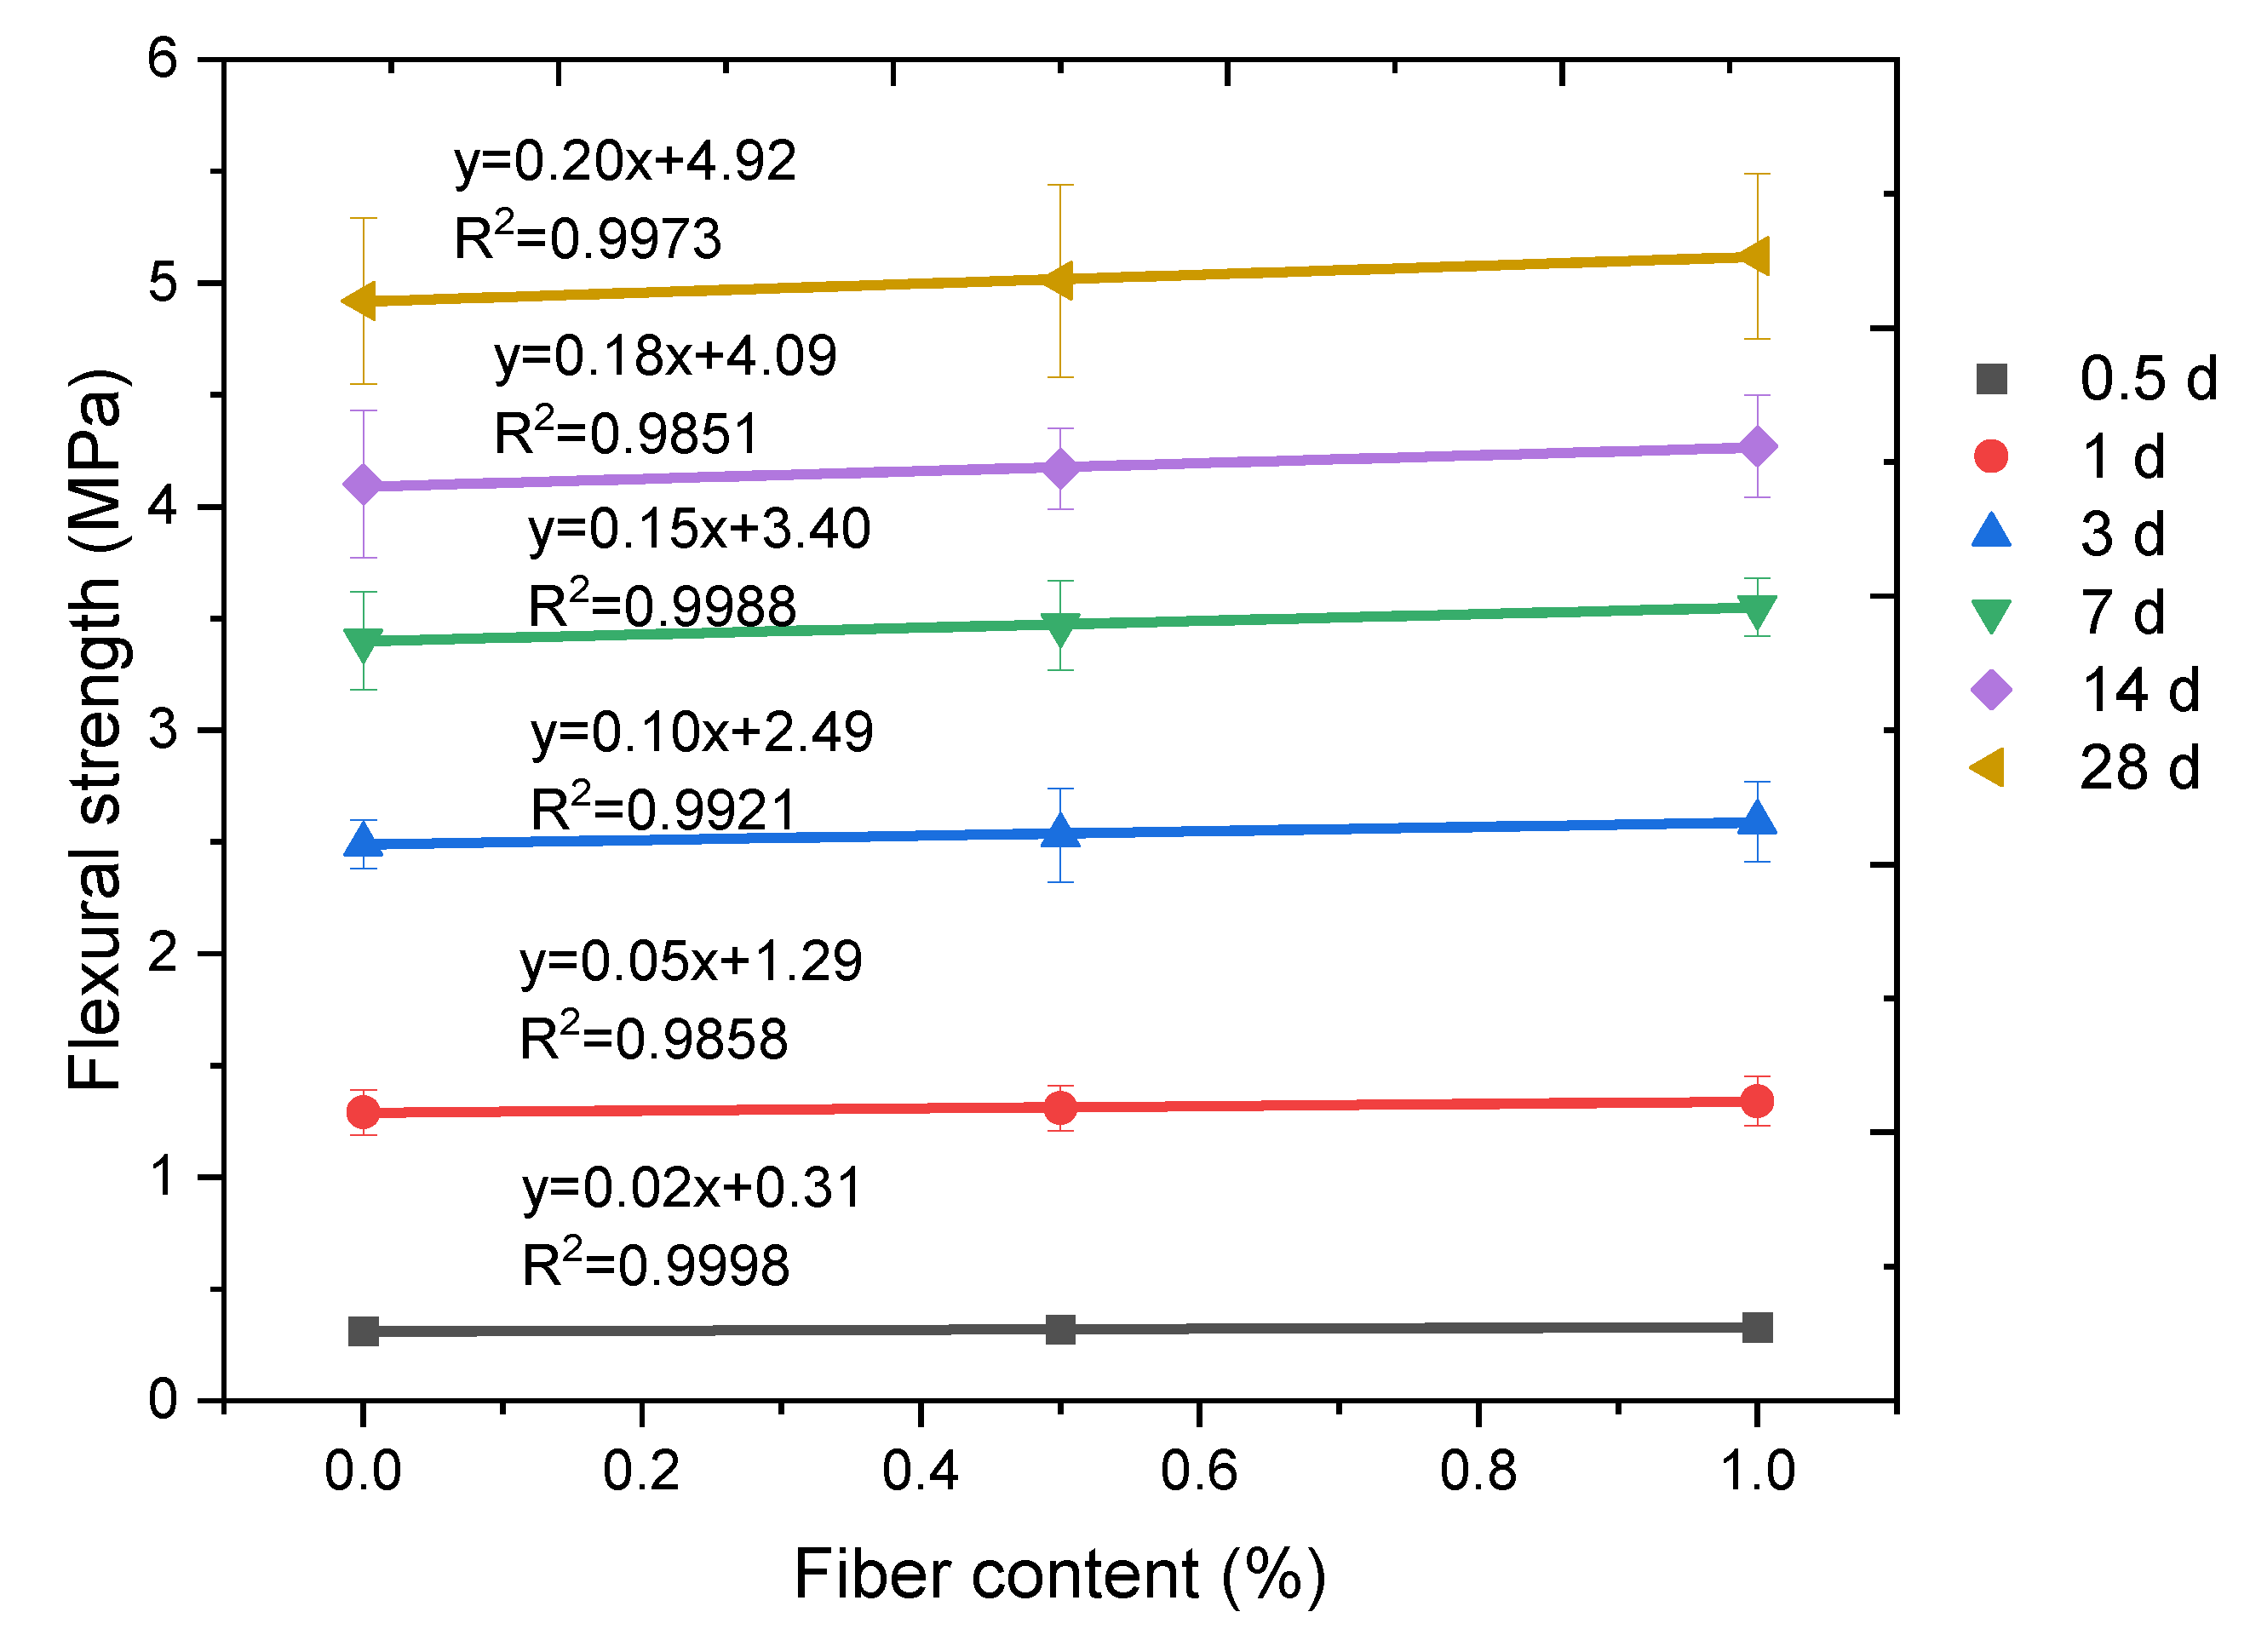
A series of linear relationships between the fiber content and flexural strength under a 0.3 kN/s loading speed can be observed in
Figure 14, with all fitting parameters (R
2) being higher than 0.98. For the linear relationship between the fiber content and compressive strength, the basic relationship can be summarized as:
where
(ff)%PPF denotes the flexural strength of different contents of PPF fiber,
x denotes the PPF fiber content,
k3 denotes the fitting parameter in terms of the PPF content’s influence on flexural strength, and
(ff)0%PPF denotes the flexural strength of plain cement mortar.
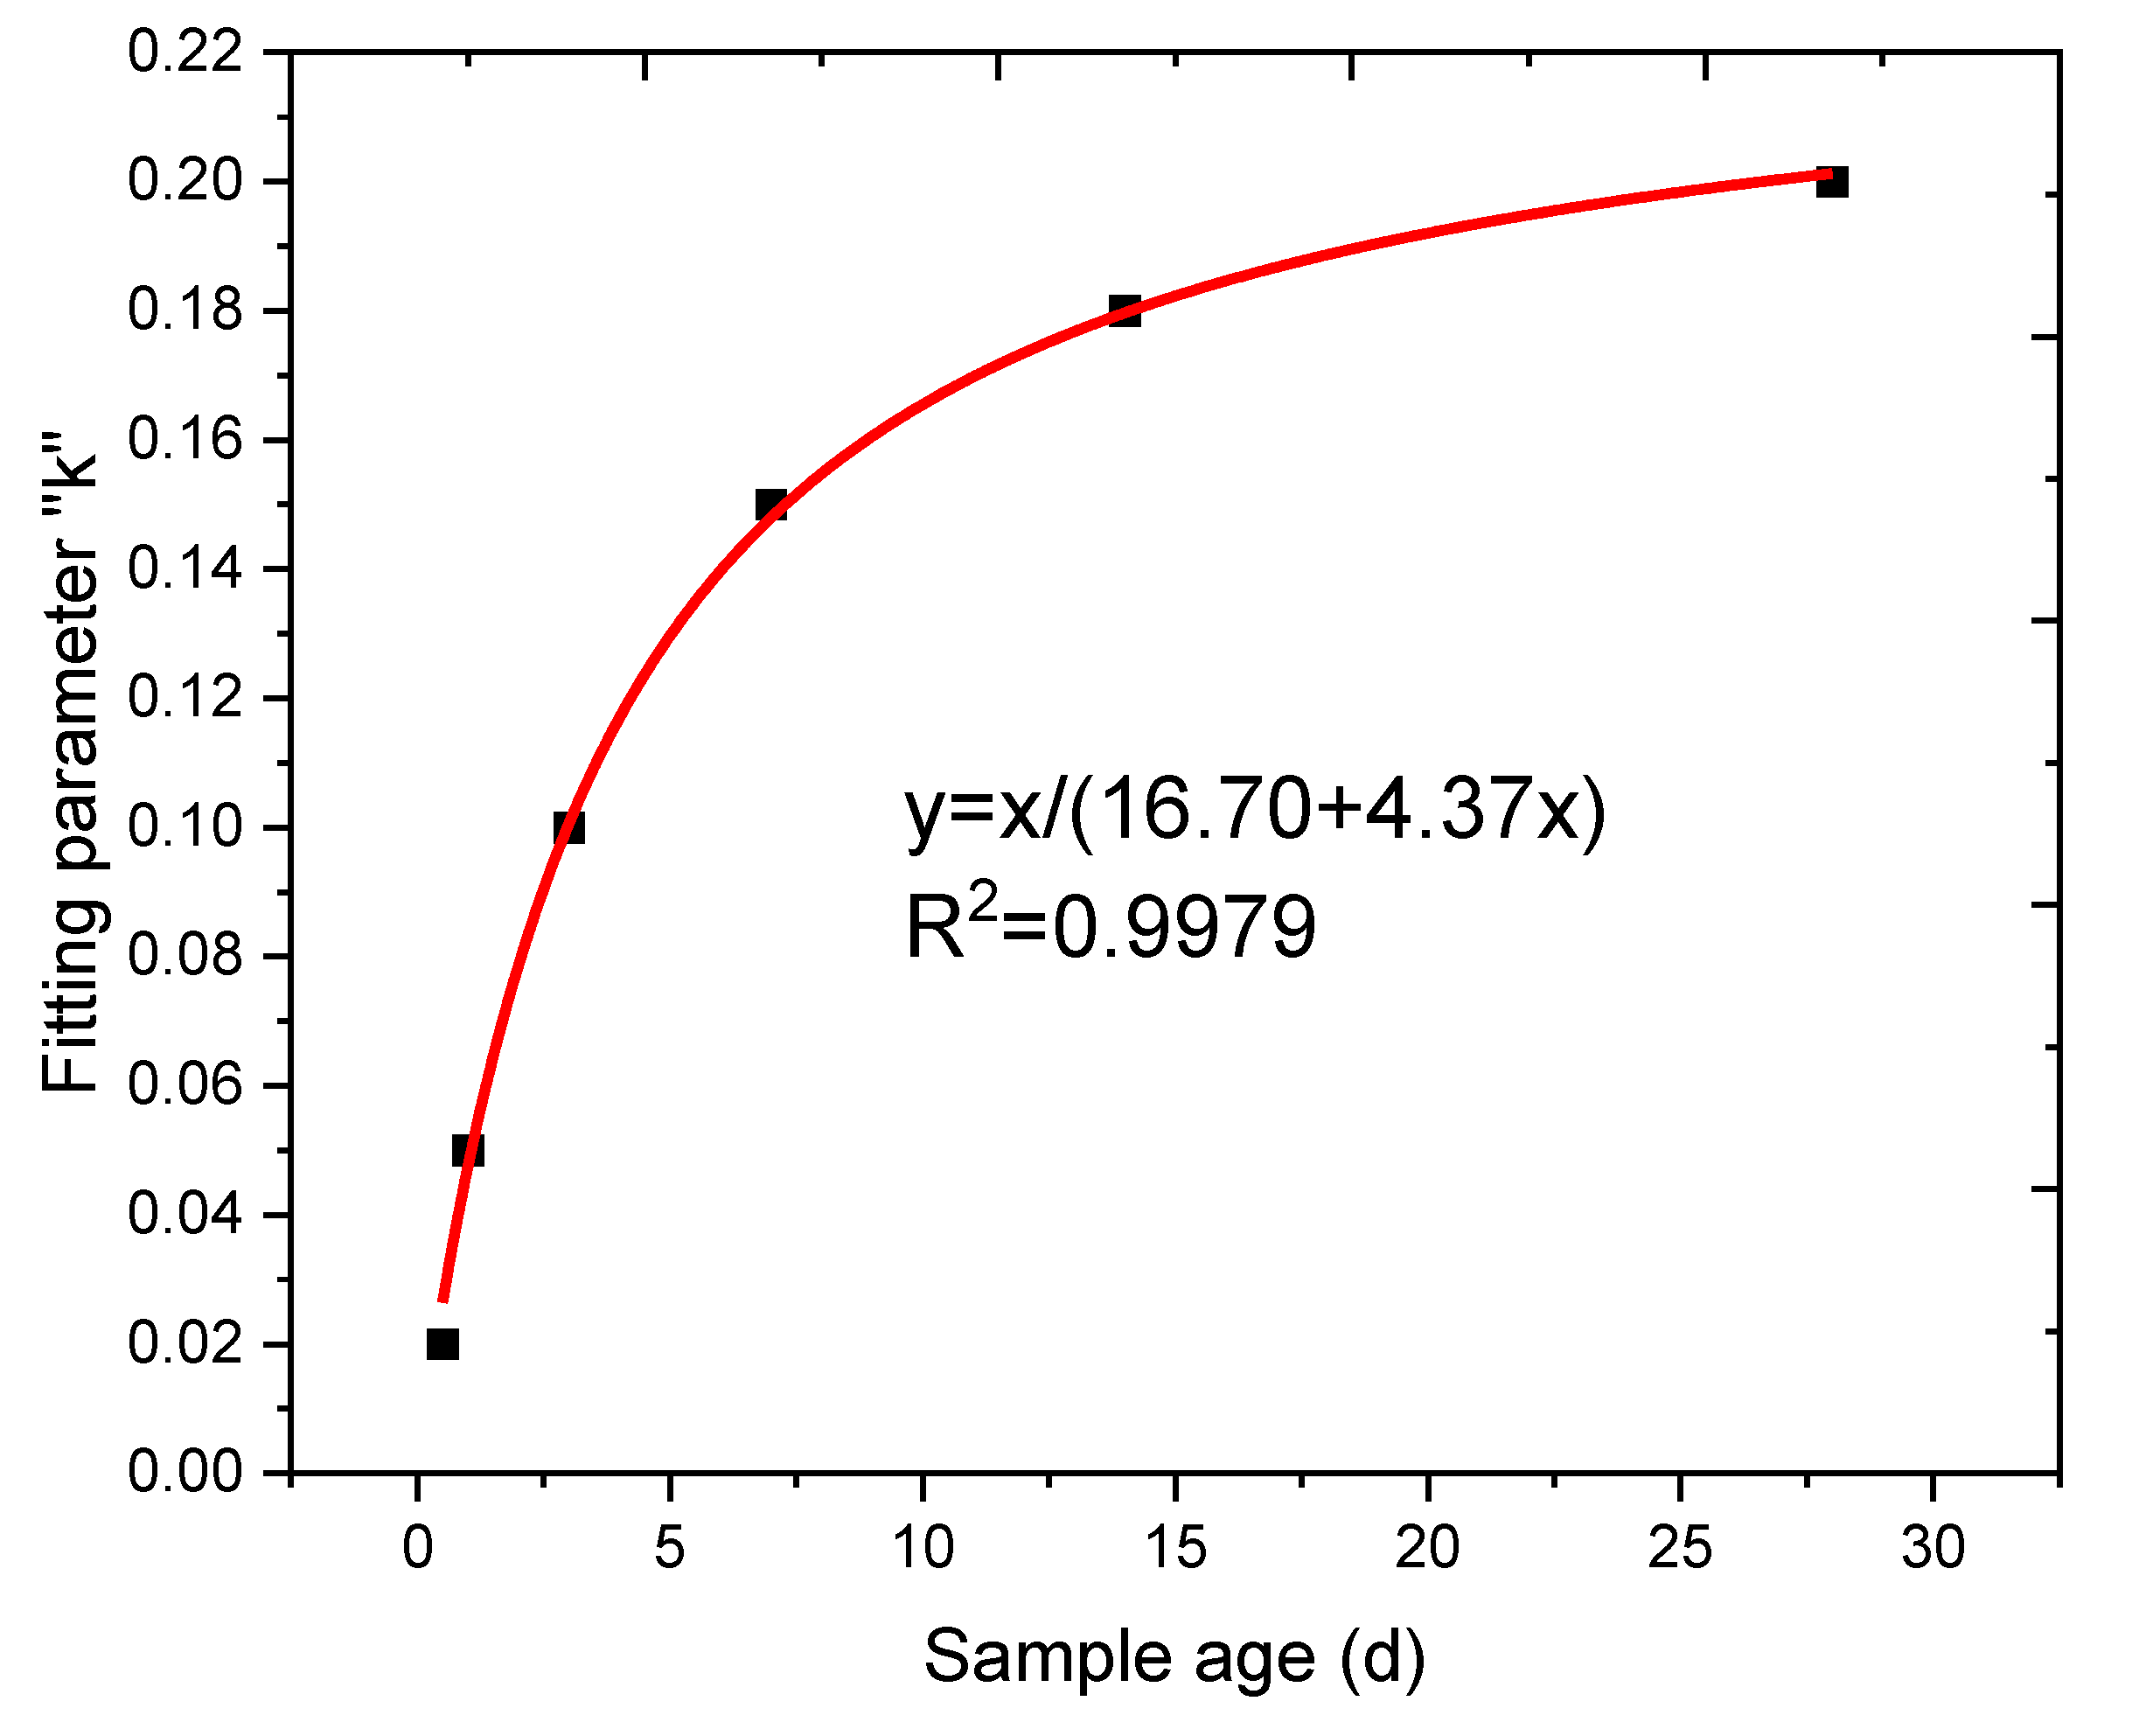
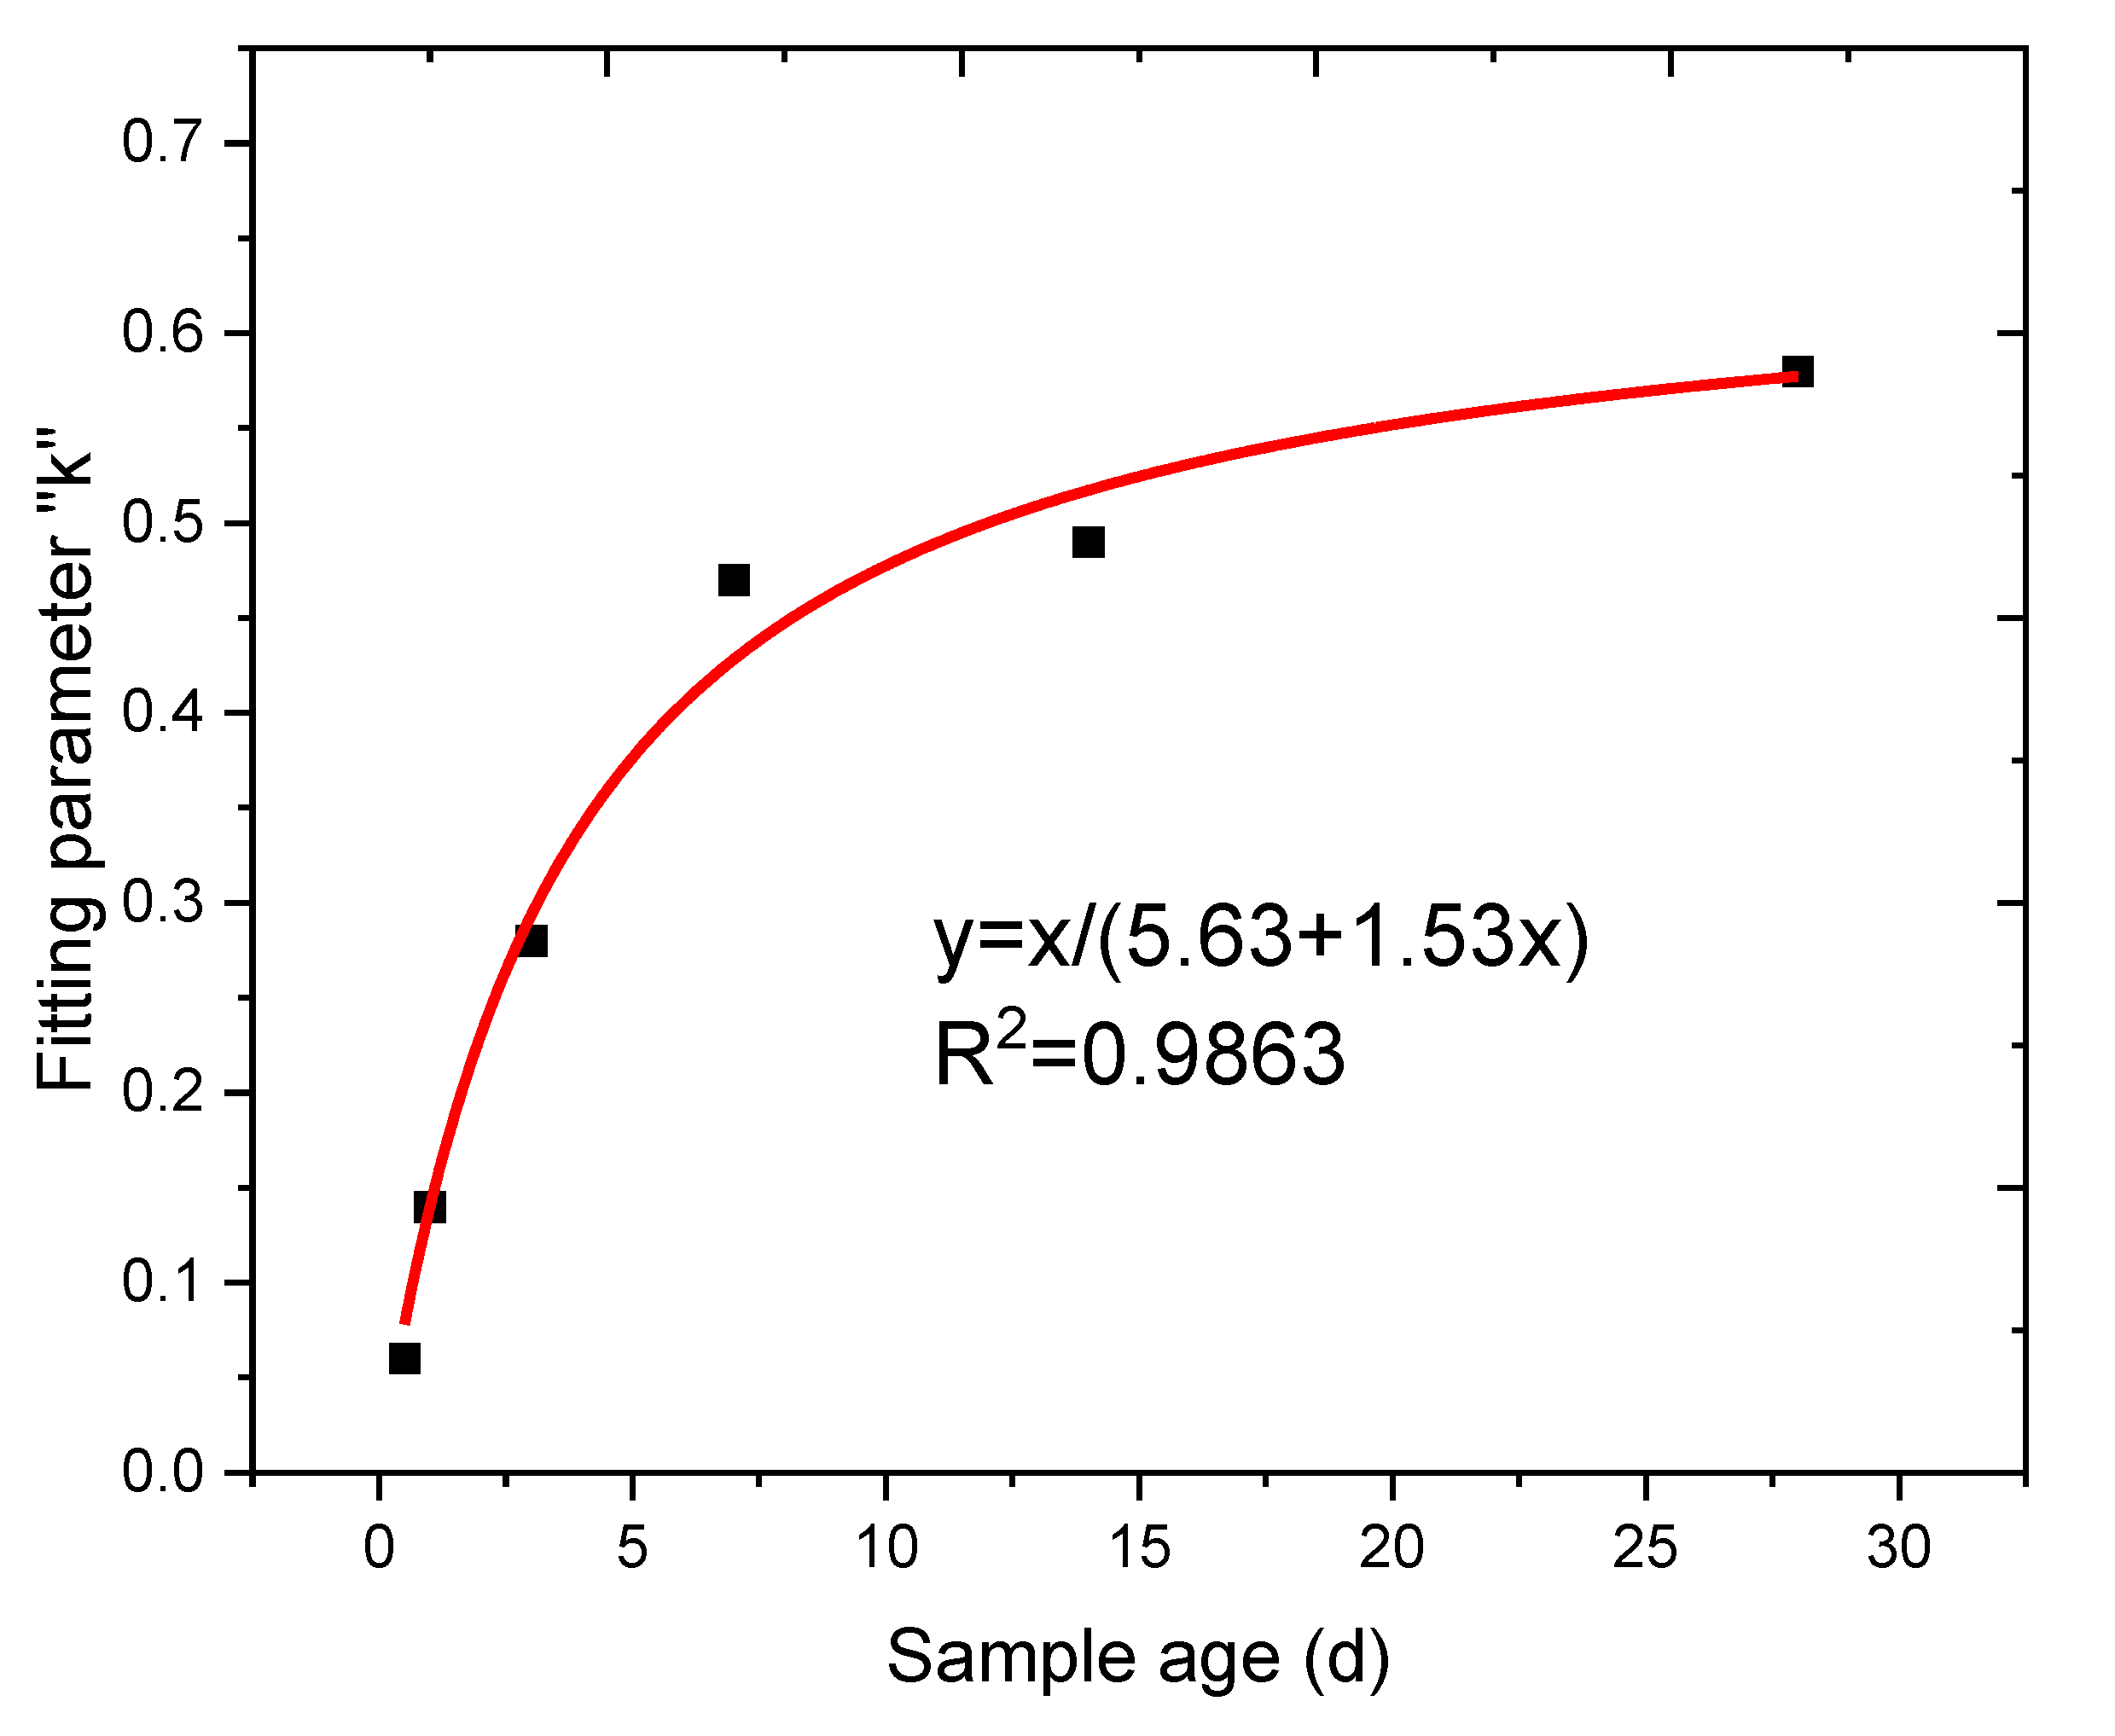
In this work, the flexural strength of plain cement mortar of different ages can be described by the fitting relationship in
Figure 13. The relationship between the fiber content’s fitting parameter k
3 and sample age is presented in
Figure 15. Thus, the time-dependent model for the PPF cement mortar compressive strength prediction model can be expressed as:
where
(ff)t,%PPF denotes the flexural strength (MPa) of cement mortar at age
t (days) with
x (%) content of PPF fiber, and
(ff)28,%PPF denotes the flexural strength (MPa) of cement mortar at age 28 (day) with 0 (%) content of PPF fiber.
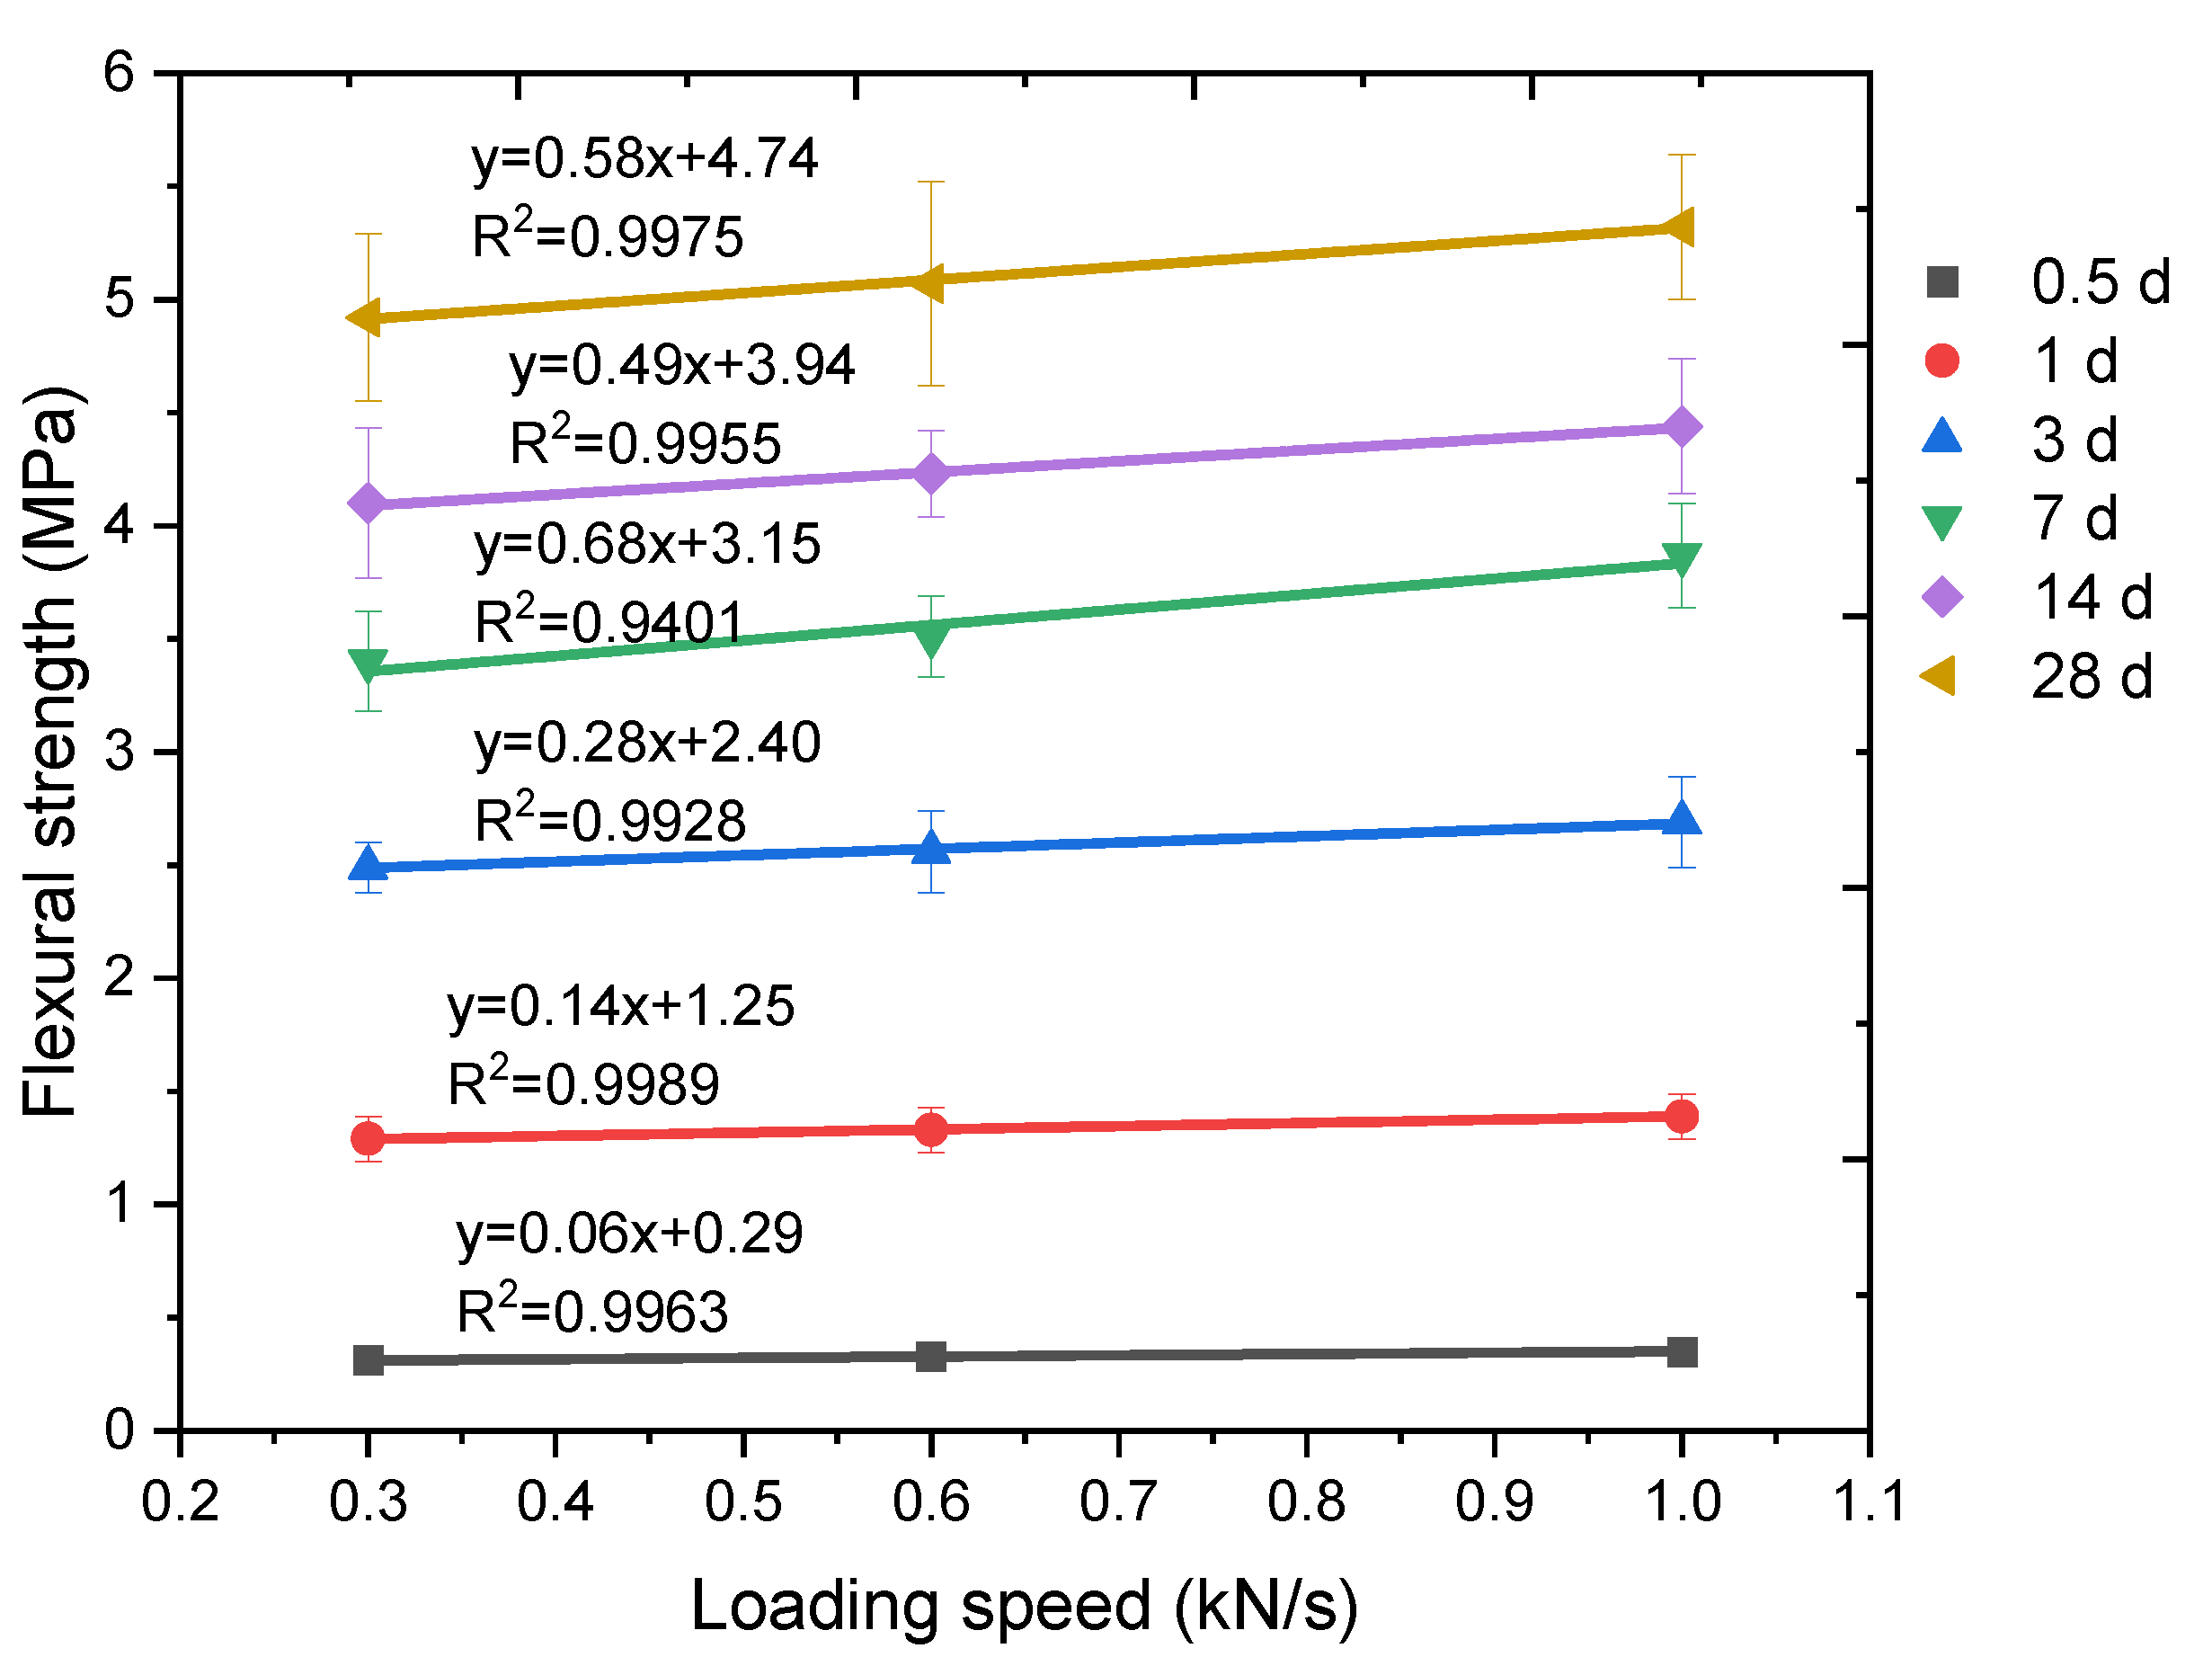
The relationship between the loading speed and flexural strength of plain cement mortar is summarized in
Figure 16, in which a series of linear relationships were obtained, with all linear fitting parameters (R
2) being higher than 0.94. Similar to the influence of fiber content, the time-dependent relationship of the loading speed’s linear fitting parameter “
k4” and sample age is presented in
Figure 17.
Thus, the time-dependent model for the PPF cement mortar compressive strength prediction model under different loading speeds can be expressed as:
where
(ff)t,%PPF,kN/s denotes the flexural strength (MPa) of cement mortar at age
t (days) with
x (%) content of PPF fiber and a test loading speed of
y (kN/s), and
(fc)28,%PPF,0.3kN/s denotes the flexural strength (MPa) of cement mortar at age 28 (days) with 0 (%) content of PPF fiber under a test loading speed of 0.3 (kN/s).
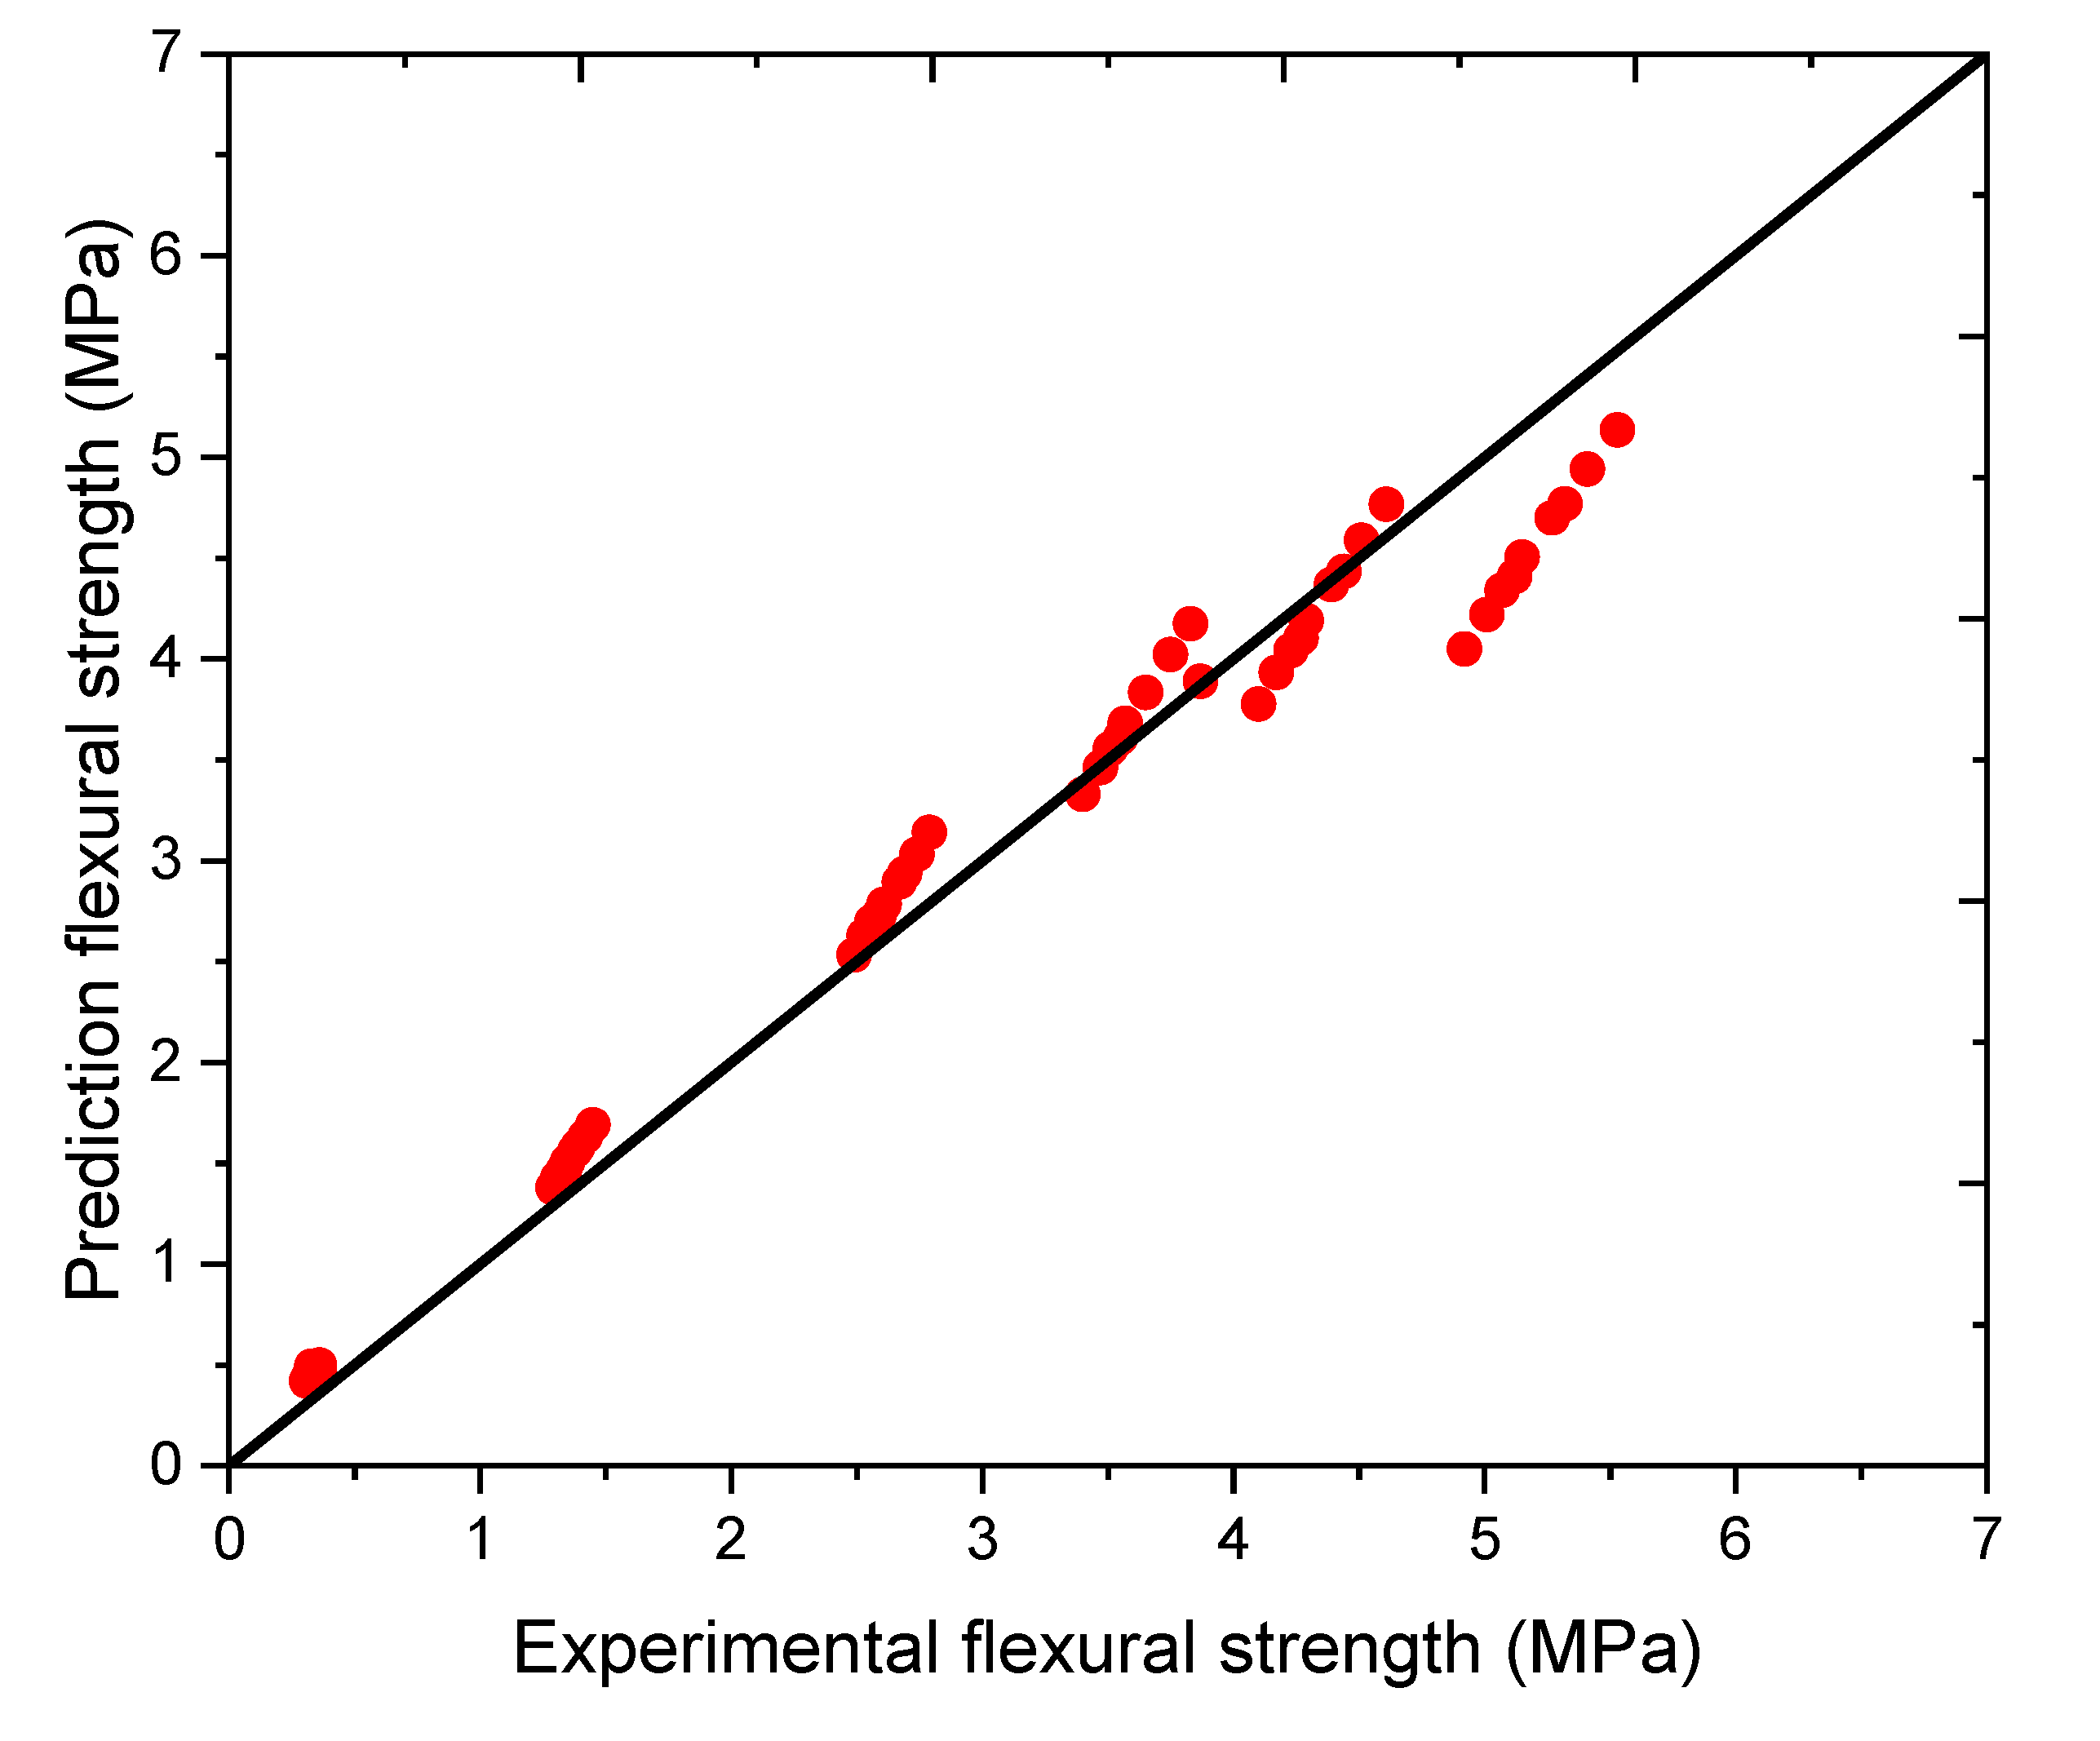
The predicted flexural strength in terms of experimental compressive strength is summarized in
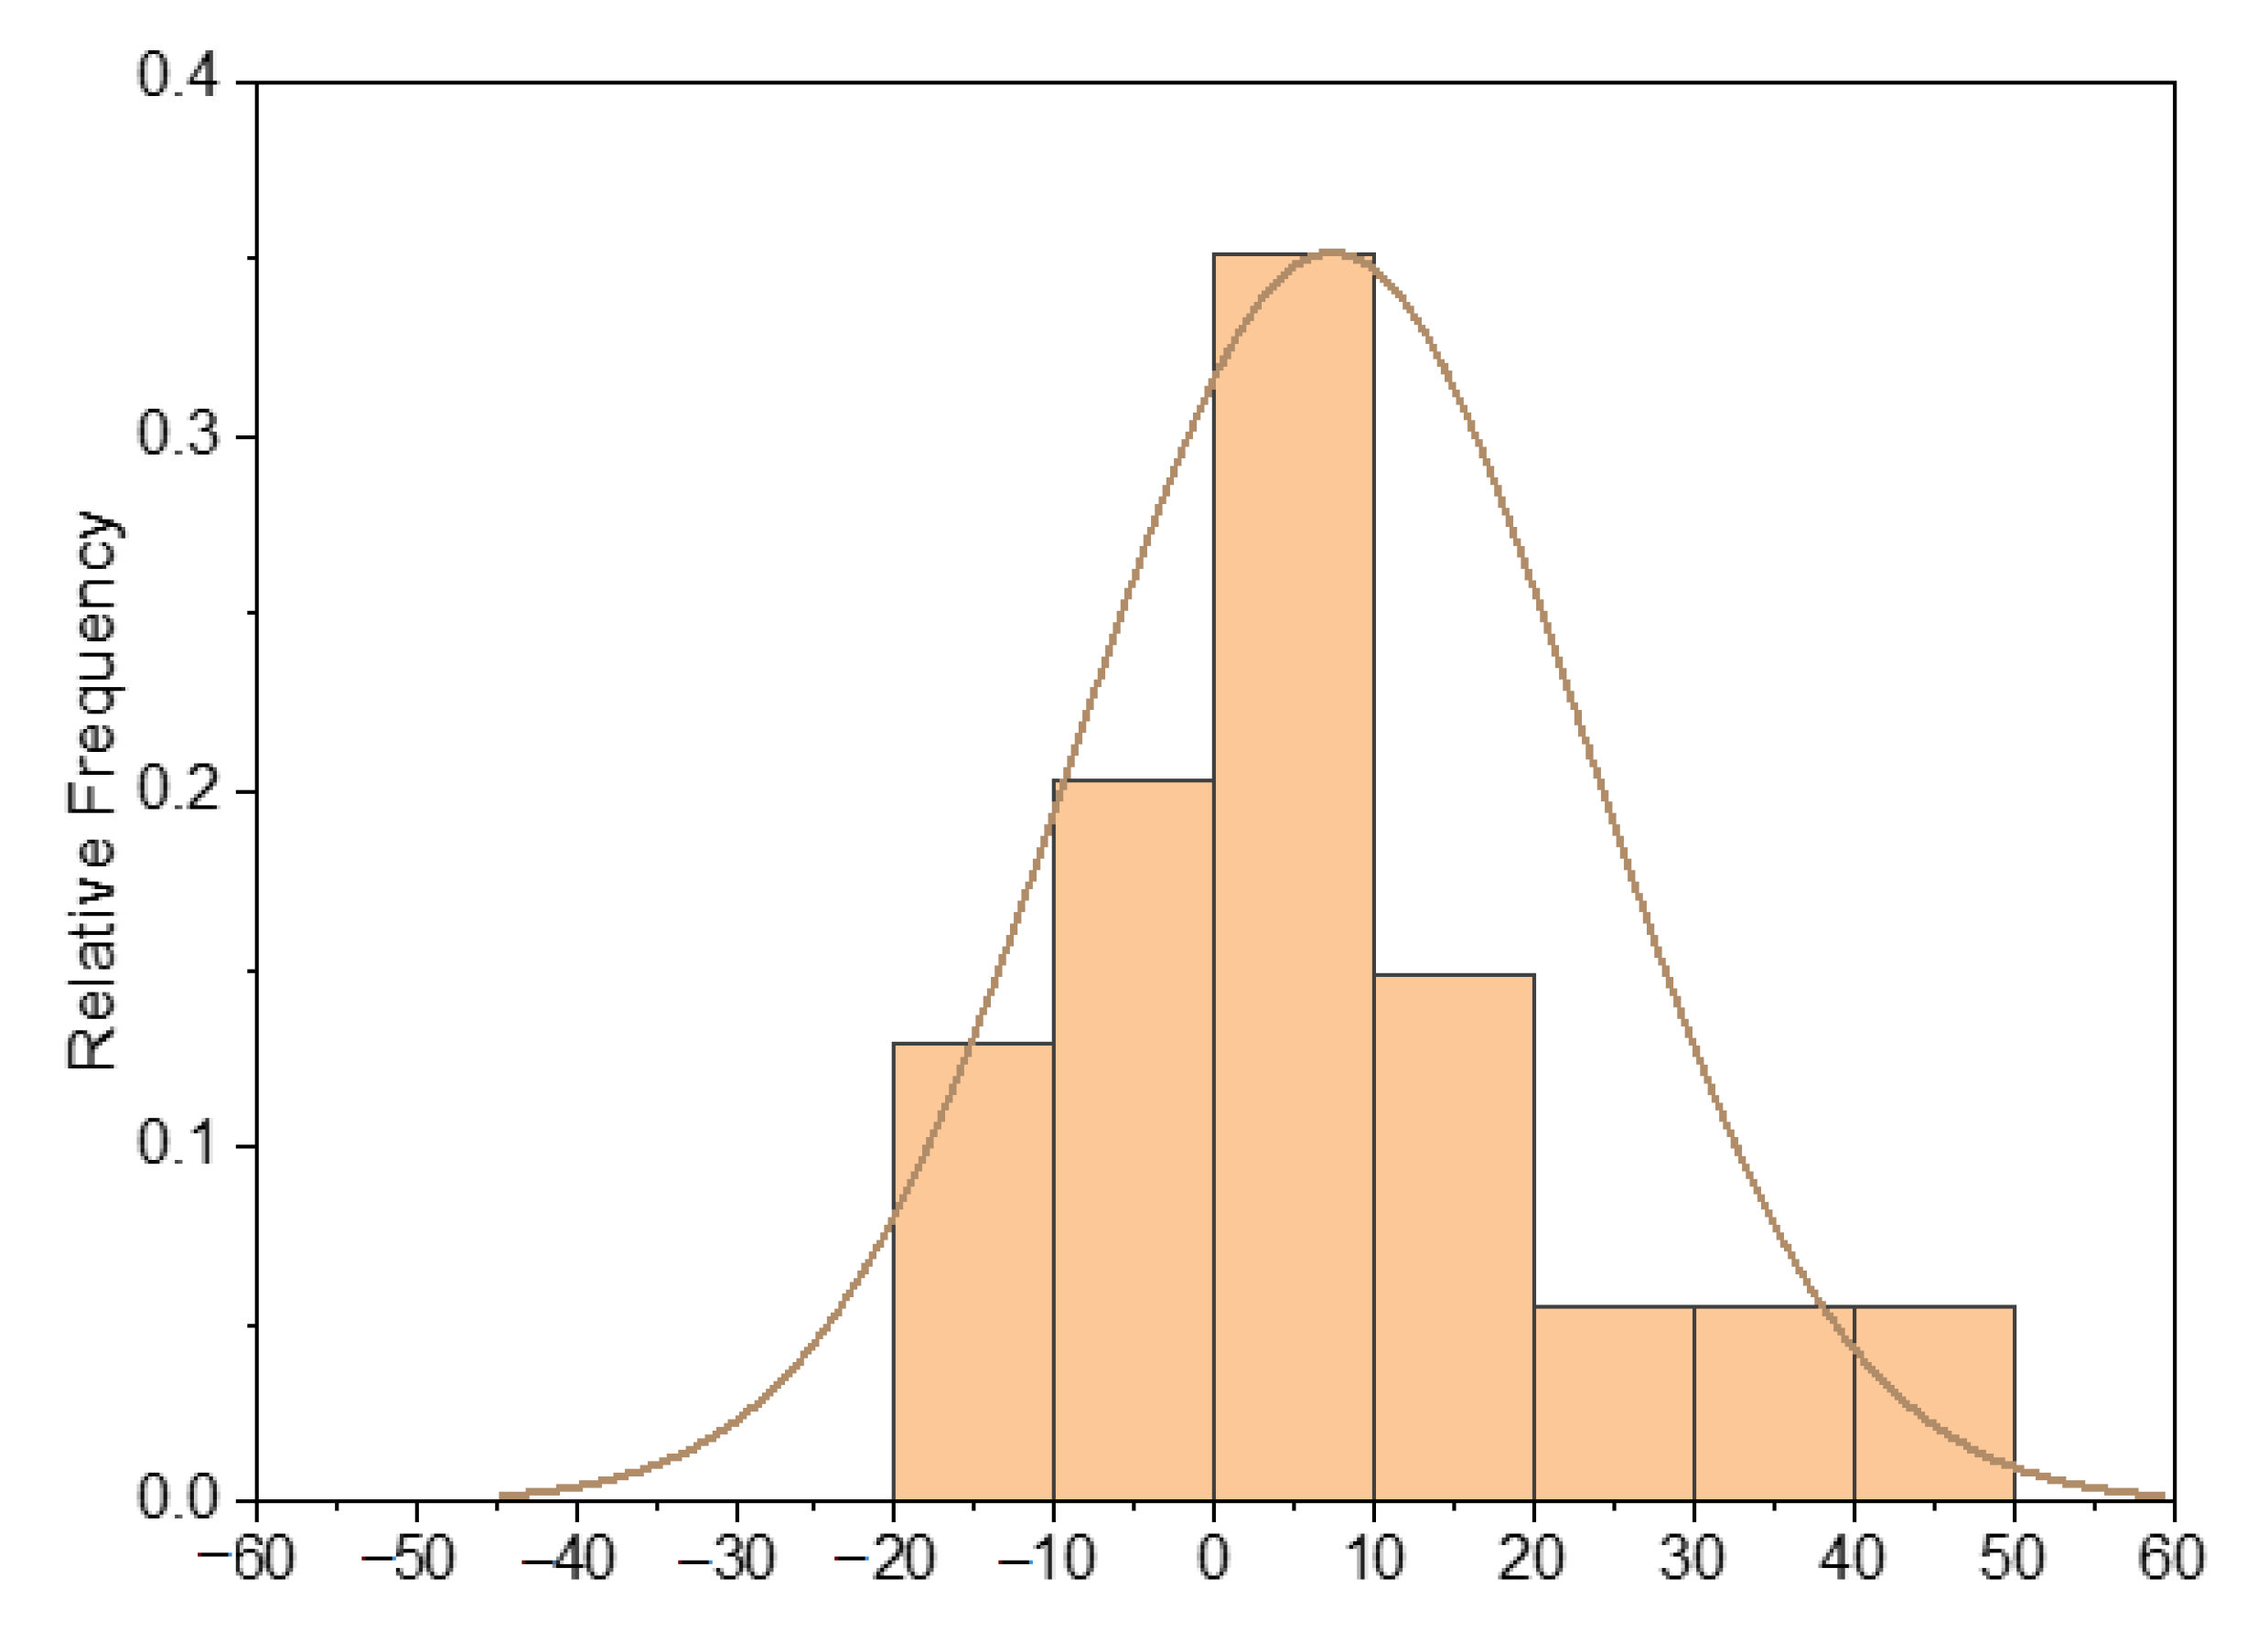
Figure 18, and the prediction errors are shown in
Figure 19. It can be seen that the predicted flexural strength for all mixtures was close to the experimental data, which indicates that Equation (8) can be used to predict the flexural strength of PPF cement mortar under different loading speeds and various sample ages. Of the prediction results, 55.6% showed less than 10% error compared with the experimental data, 75.9% had a relative error less than 15%, and 16.7% had a relative error higher than 20%.


