Article

Modeling and Prediction of Land Use Land Cover Change Dynamics Based on Land Change Modeler (LCM) in Nashe Watershed, Upper Blue Nile Basin, Ethiopia

by
Megersa Kebede Leta
1,2,*,
Tamene Adugna Demissie
2 and
Jens Tränckner
1
1
Faculty of Agriculture and Environmental Sciences, University of Rostock, 18051 Rostock, Germany
2
Faculty of Civil and Environmental Engineering, Jimma Institute of Technology, Jimma University, Jimma 378, Ethiopia
*
Author to whom correspondence should be addressed.
Sustainability 2021, 13(7), 3740; https://doi.org/10.3390/su13073740
Submission received: 25 February 2021 / Revised: 15 March 2021 / Accepted: 22 March 2021 / Published: 27 March 2021
(This article belongs to the Special Issue Sustainable Land Use Policy)

Abstract

:
Change of land use land cover (LULC) has been known globally as an essential driver of environmental change. Assessment of LULC change is the most precise method to comprehend the past land use, types of changes to be estimated, the forces and developments behind the changes. The aim of the study was to assess the temporal and spatial LULC dynamics of the past and to predict the future using Landsat images and LCM (Land Change Modeler) by considering the drivers of LULC dynamics. The research was conducted in Nashe watershed (Ethiopia) which is the main tributary of the Upper Blue Nile basin. The total watershed area is 94,578 ha. The Landsat imagery from 2019, 2005, and 1990 was used for evaluating and predicting the spatiotemporal distributions of LULC changes. The future LULC image prediction has been generated depending on the historical trends of LULC changes for the years 2035 and 2050. LCM integrated in TerrSet Geospatial Monitoring and Modeling System assimilated with MLP and CA-Markov chain have been used for monitoring, assessment of change, and future projections. Markov chain was used to generate transition probability matrices between LULC classes and cellular automata were used to predict the LULC map. Validation of the predicted LULC map of 2019 was conducted successfully with the actual LULC map. The validation accuracy was determined using the Kappa statistics and agreement/disagreement marks. The results of the historical LULC depicted that forest land, grass land, and range land are the most affected types of land use. The agricultural land in 1990 was 41,587.21 ha which increased to 57,868.95 ha in 2019 with an average growth rate of 39.15%. The forest land, range land, and grass land declined annually with rates of 48.38%, 19.58%, and 26.23%, respectively. The predicted LULC map shows that the forest cover will further degrade from 16.94% in 2019 to 8.07% in 2050, while agricultural land would be expanded to 69,021.20 ha and 69,264.44 ha in 2035 and 2050 from 57,868.95 ha in 2019. The findings of this investigation indicate an expected rapid change in LULC for the coming years. Converting the forest area, range land, and grass land into other land uses, especially to agricultural land, is the main LULC change in the future. Measures should be implemented to achieve rational use of agricultural land and the forest conversion needs to be well managed.

1. Introduction

Land use land cover (LULC) change occurs under a variety of pressure and it is the result of changes or modifications in the intensity of an existing LULC type to determine the location and nature of the land use change. The changes of LULC have been perceived as worldwide environmental change drivers in the watershed that are very sensitive to LULC dynamics [1]. A dynamic LULC offers an inclusive sympathetic of the interactions and relations that are crucial for sustainable land resource management [2]. At global and local levels, the changes of LULC are driven by anthropogenic and natural processes at different spatiotemporal levels. The LULC changes are dynamic, non-linear human–nature interactions that are significant land surface conversions and involve complex processes. The LULC change trajectory worldwide for the past 300 years has been categorized by gains in agriculture and losses in forests [3,4]. According to the authors of [5], LULC changes are associated with the change of forest land to agricultural expansion, urbanization, and deforestation.
The LULC changes were broadly assessed in various areas of the world, for instance, Europe and USA [6], South America [7], Asia, and Africa [8], Ethiopia [9,10]. In Africa, the expansion of agricultural land influenced by rapid population growth has been recognized as a primary driver of LUC. Many developed countries including Europe and the United states practiced massive deforestation because of agricultural expansion and industrialization until the early 19th century [11]. Urbanization dynamics and urban growth are usually linked to demographic factors mostly in developing countries [12]. In Africa, the expansion of agriculture influenced by population growth has been recognized as a primary driver of land use land cover change (LULCC). The landscape has been intensely changed due to socio-economic and political changes that occurred in the first half of the 19th century in Europe [11]. The decrease in agricultural land at the expenditure of increased urban areas and water bodies in Europe is another strong trend [13].
The dynamics of LULC intensities and rates are changing because they are highly associated with the overexploitation of natural resources. The natural variability issues like climate change, soil conditions, and terrain characteristics have also accounted for land use changes [14]. Therefore, the integration of natural and human factors in LULC dynamics have become a significant issue throughout the world in efficient land use. The assessment of LULC change and the drivers that have direct consequences on the natural environment and human societies are the focus of the current scientific examination of scientists [15]. In order to develop sustainable strategies and to have informed planning decisions, understanding the drivers and dynamics of LULC change is crucial. The LULC change driving forces can be direct or indirect for change over time and space; this was incorporated to provide an estimate of future scenarios [16].
The drivers’ assessment and predicting their future LULC status in the watershed is expected to have an essential contribution for land use planning management and sustainable water resources. The use of historical satellite imageries are used to effectively monitor and analyze LULC change [17]. Future LULC change analysis and prediction are often complicated for the stochastic change of nature and the dynamic of natural and socioeconomic variables. The prediction of forthcoming LULC dynamics in areas where the economic condition depends upon agriculture has a profound impact. The LULC model developed in this study predicts a future LULC state based on a business-as-usual scenario. Therefore, understanding the earlier and current LULC changes and simulating for the future is vital for the management of land and water resources of the basin [18,19].
Models of land change are useful tools for environmental and other types of research concerning LULC change [20]. The magnitude and location are the two important issues of LULC that have been considered in the modeling. LULC change assessment models are either dynamic or static, non-spatial or spatial, deductive or inductive, pattern-based or agent-based [21,22]. Modeling the LULC process is to properly calibrate and validate the model for predicting future changes [23]. The LCM embedded in the TerrSet model has been utilized to inspect the historical and to predict the future changes of LULC of the watershed. LCM primarily uses the MLPNN-CA-MC approach. The model is strong due to its dynamic projection proficiency, suitable calibration, and capability to simulate several types of land cover [24,25]. LCM evaluates changes of the land use of two different periods, determines the changes, visualizes changes, and presents the results with various maps and graphs.
The model predicts future LULC images based upon MLPNN (Multi-Layer Perceptron neural networks) and CA-Markov Chain (CA-MC) [26]. The “transition potential” of pixel to change into another class determination is through MLP drivers of change [27]. The MC model is stochastic, which requires pairs of LULC images to derive the transition potential into the future predictions based on the amount of historical change [28,29]. The blend of CA-MC can simulate the spatiotemporal dynamics of LULC change. The model predicts transitions of a cell from one LULC to another depending on “physical and socio-economic” data [30,31]. The model validation process is the accuracy assessment of prediction and contrast made between the predicted and observed land cover maps. Therefore, to assess the change drivers of the past and to simulate for the future, the validated data have been used.
Remote sensing data particularly Landsat images provide suitable possibility for LULC change monitoring, particularly for developing countries where geospatial technologies are not well developed [32]. In Africa, around 40% of the population were living in urban centers as of 2014. By 2050 the urban residents’ percentage has been projected to reach 56% [33]. In Europe, between 1990 and 2006 the population grew up by 146% [34] as per the study was conducted in 24 European countries. Currently in Europe around 73% of the population lives in urban areas and it is estimated to be over 80% by 2050 [33]. The availability of resources as well as their dynamics and management varies considerably from area to area, especially in Ethiopia. Ethiopia is highly vulnerable to environmental changes induced by natural and anthropogenic activities. LULC change is a fundamental problem in the country [35].
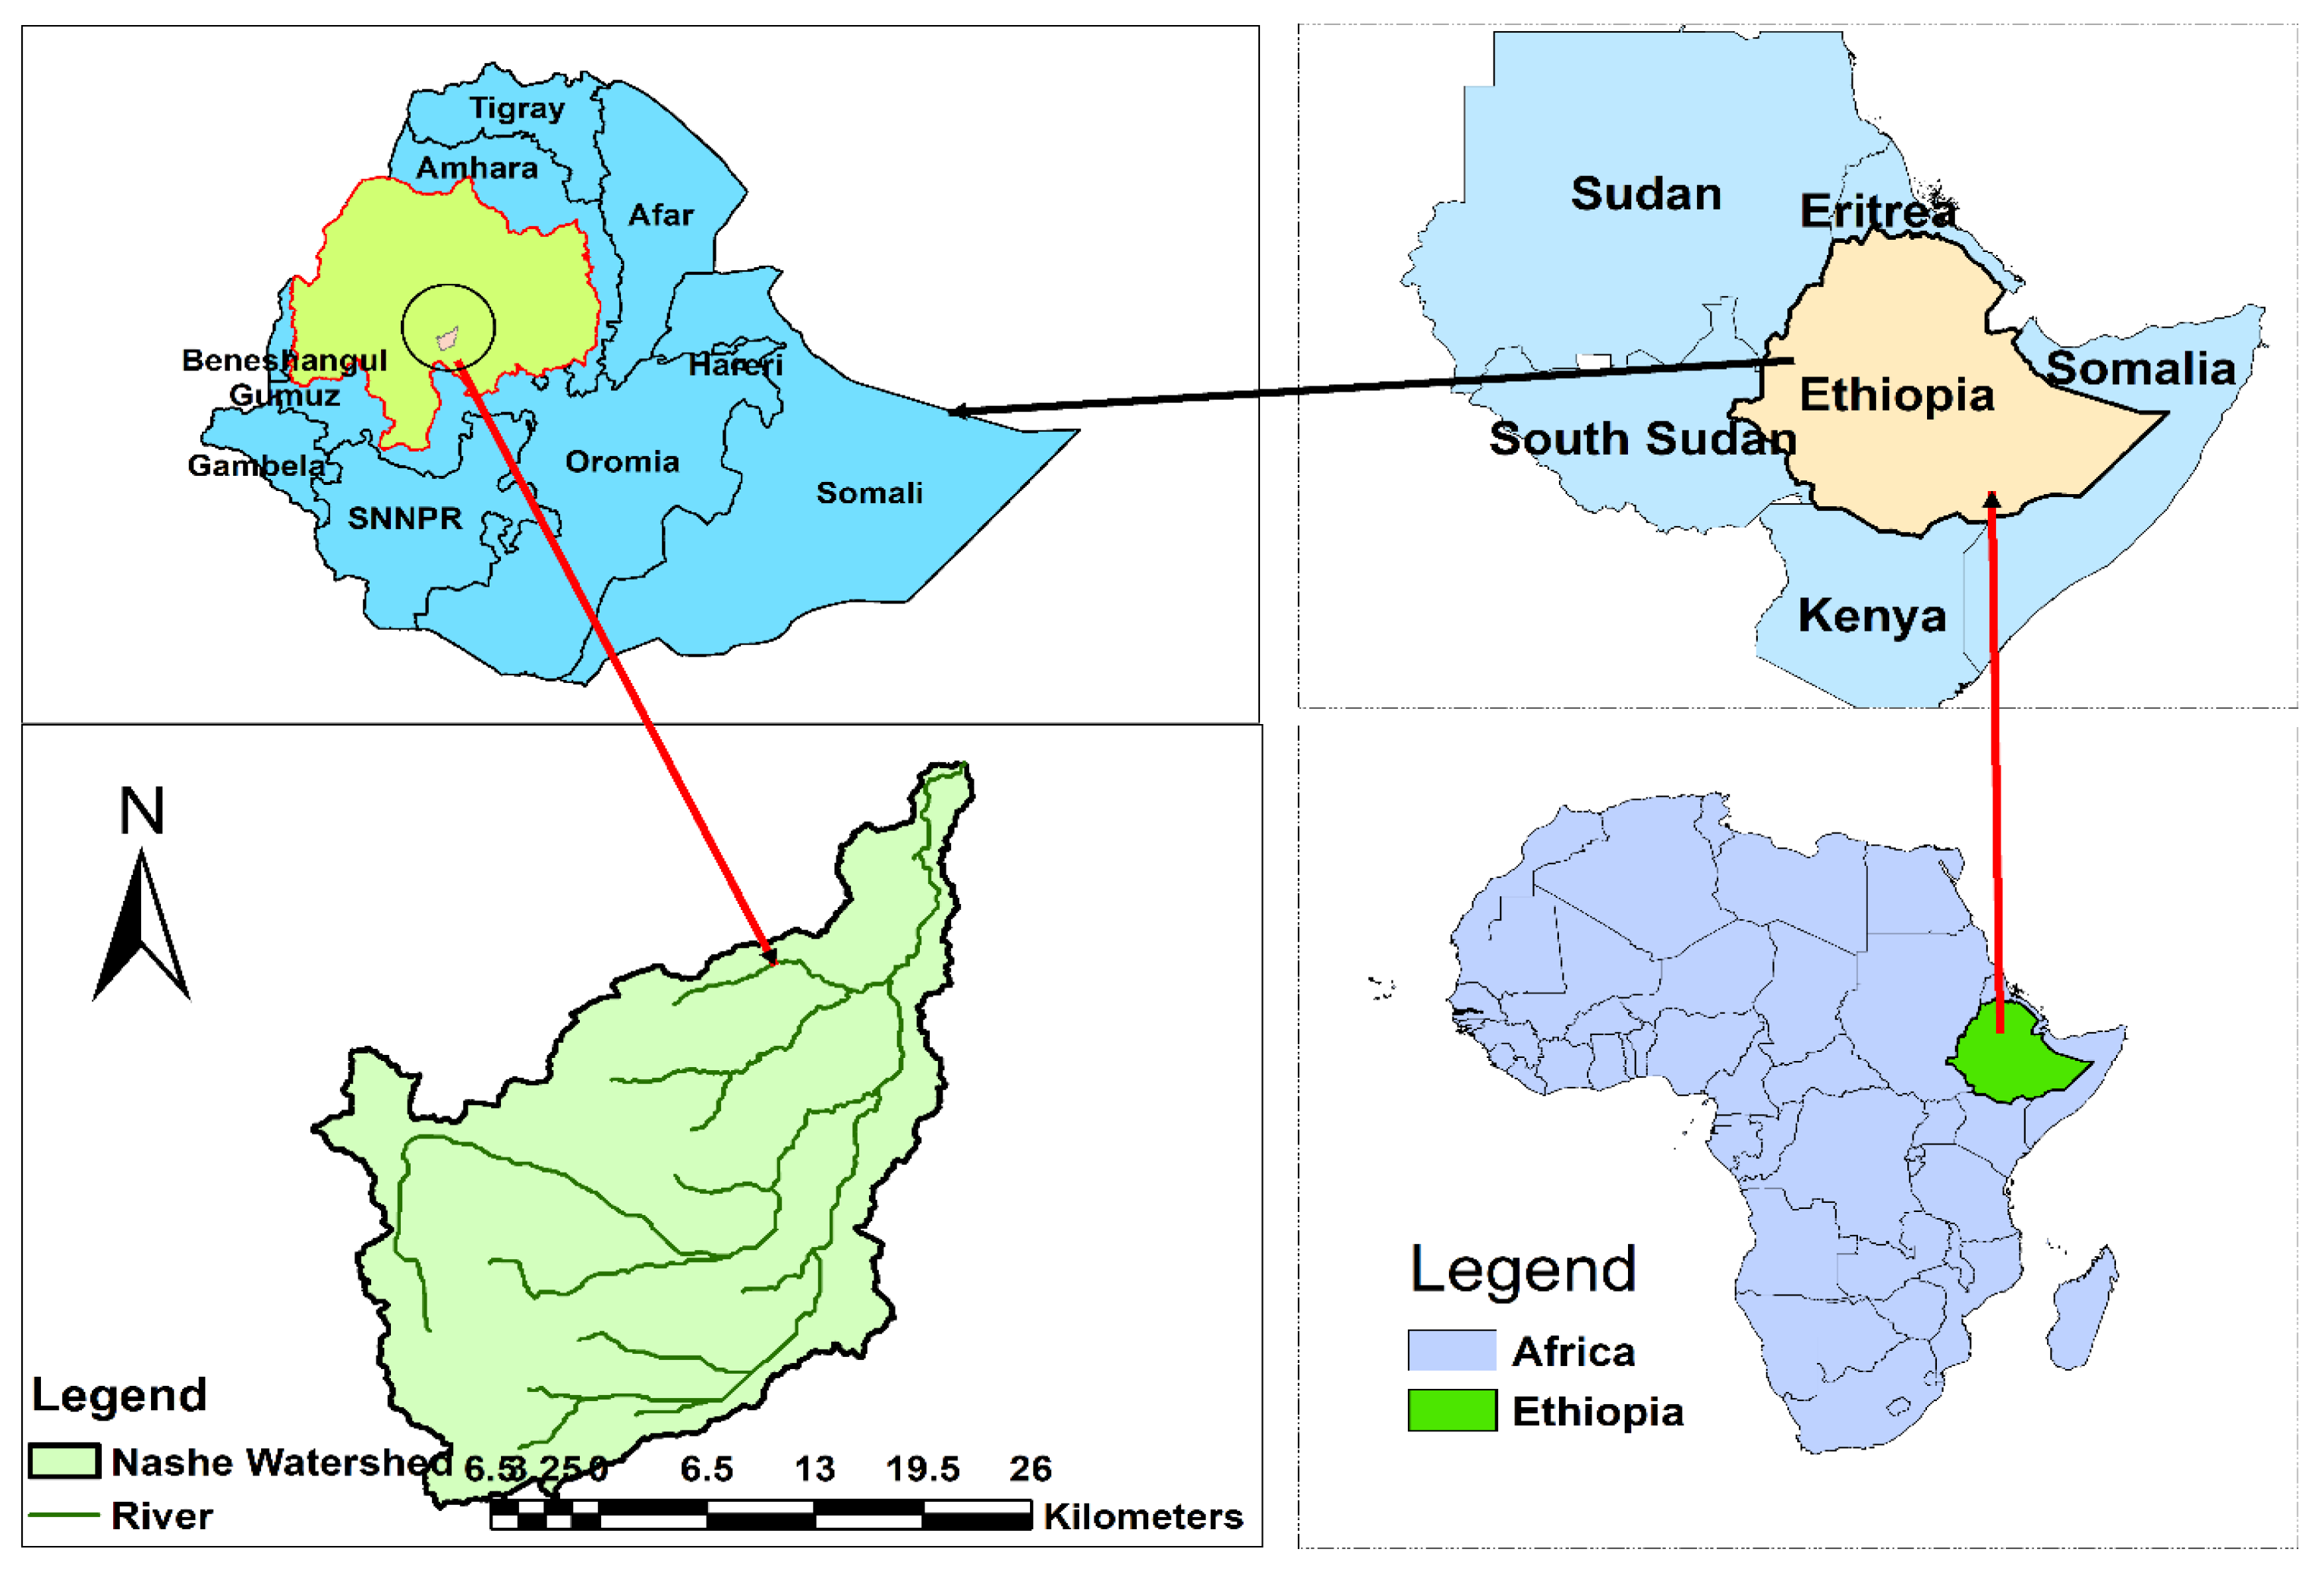
Due to changes of LULC, Ethiopia experienced serious environmental problems including soil erosion, land degradation, loss of soil fertility, and deforestation [36]. The “Upper Blue Nile Basin (UBNB)” is the most varied and a highly important river basin in Ethiopia [37,38]. Nashe watershed is the tributary of the Basin that faced LULC change driven by population growth, urbanization, agricultural land expansion, deforestation, overgrazing, expansion of industrial activities, and political dynamics. The analysis of LULC change in Nashe watershed, its drivers, and prediction of future land use change are vital for understanding the dynamics of human environment interactions and environmental management interventions. Therefore, it is very important to assess and predict the LULC changes based on the historical data using Landsat images and Land Change Modeler. The following research questions were addressed: (i) what was the trend of LULC change within the study area in the past (1990–2019) and which LULC classes were mostly affected? (ii) What growth and change patterns can be expected in the future? (iii) What are the major driving factors of LULC change in the watershed?
The above research questions are so significant and addressed in this study of watershed since a dramatic socio-economic change with expected enormous effect on the land use is undergoing and this will influence various hydrological processes. Thus, especially in the UBNB, those changes need to be predicted in time for environmental management in this area in an effective and sustainable manner. The study findings are utilized to provide empirical evidence on patterns and rates and identify major driving forces of LULC dynamics at watershed level, and improve policies in land use within the framework of sustainable land use planning in relation to future changes or development.

2. Materials and Methods

2.1. Study Area

The Upper Blue Nile Basin (UBNB) is the main stream of the Nile basin and is located within the western and central part of Ethiopia between latitudes 7°45′ and 12°45′ N and longitudes 34°05′ to 39°45′ E. The UBNB consists of the major part of Ethiopia and covers an area of 157,000 km2. The basin is located within the region of Oromia, Amhara and Benishangul-Gumuz of Ethiopia. The basin has three main seasons: a main rainy season which occurs between June and September, a dry season from October to January, and a short rainy season between February and May. The basin mean yearly rainfall ranges within 800–2000 mm and increases with altitude. The Nashe watershed is the major tributary from the left bank within the UBNB of Ethiopia which is situated at about 300 km from Addis Ababa. The sub-basin lies in between 9°35′ and 9°52′ N latitudes and 37°00′ and 37°20′ E longitudes (Figure 1).
The watershed area varies in elevation from 1600 m in the lower plateau under the escarpment to the hills and ridges of the highland climbing to over 2500 m. The annual average rainfall of the Nashe watershed ranges from 1200 mm to 1600 mm (depending on data from five weather stations); June, July, August, and September are the main rainy season of the catchment. The observed average temperature of the catchment is 22 °C. The watershed area is categorized by intensive irrigable lands at the downstream, large water potential sites at the upstream, and also with high head of hydropower potential. Agriculture is the leading financial activity in the watershed and the main source of livelihood for the local population.

2.2. Data Types and Sources

The important spatial data required for the study were Digital Elevation Model, Landsat Images, and field data. The three Landsat images used were downloaded from the USGS (http://glovis.usgs.gov/, accessed on 2 January 2017) (Table 1) and DEM was obtained from the Ethiopian Ministry of Water, Irrigation and Energy (MoWIE). The collected 30 m spatial resolution of DEM was used to delineate the watershed, to develop elevation, and to generate the slope of the watershed. The analysis was performed using the TM Landsat-5 from 1990, ETM+ Landsat-7 from 2005, and OLI_TIRS Landsat-8 from 2019. The images were acquired in January, which corresponds to the dry season in Ethiopia when a clear sky period occurs to obtain images with Zero clouds and avoid extreme differences in the land cover reflectance dataset. The global positioning system (GPS) measurements were taken during fieldwork to verify and confirm the information gathered through remote sensing at each ground control points (GCP). The LULC types were noted and for reference purposes, photographs were also taken.
The coordinates of each location selected were marked with GPS, and these points were verified in Google Earth. During field survey and data collection, socioeconomic survey methods such as interviews with key informants, discussions with focus groups, and participatory field observation were conducted. The socio-economic data collected were utilized to get information on historical land use change, socio-economic status, and the driving factors that change the land use in the watershed. The key informants were chosen purposely from various social groups including elders, community leaders, and local natural resource experts.

2.3. Land Use and Land Cover Change Assessment

2.3.1. Image Classification

The classification of images is to categorize automatically all pixels from the Landsat images into LULC classes to extract useful thematic information [39]. For image classification, the data of ground truth were gathered on the field and satellite image verification. After pre-processing the satellite images, the supervised classification was implemented using “maximum likelihood classification (MLC)” technique to produce image classification. The MLC method is the widely used algorithm for supervised satellite image classification [40]. The method has a strong theoretical foundation and the ability to accommodate varying data, LULC types, and satellite systems [28]. The approach of supervised classification is adopted as it preserves the basic land cover characteristics through statistical classification techniques [41]. In classifying the 1990, 2005, and 2019 images, reference data were gathered from images of Google Earth and through interviews from concerning body of the corresponding time periods. In this study, six separable LULC are considered (Table 2).
To accomplish classification of image in multi-temporal approach and for mapping purposes, the ERDAS Imagine 2015 and ArcGIS 10.3 software were used, respectively. For each LULC, as many as possible training samples were selected throughout the entire image, based on the composite images, as well as Google Earth images. For classification, verification, and validation of the classified images, the training data were used.

2.3.2. Accuracy Assessment

Accuracy assessment tells us to what extent the ground truth is represented on the equivalent classified image. Since land use maps derived from image classification usually contain some errors, the accuracy of classification results obtained must be assessed. Assessing the classification accuracy provides the degree of confidence in the results and the subsequent change detection [40]. For accuracy assessment, the classified map was compared with ground truth data. For 1990 and 2005, the reference points were collected from Google Earth, original Landsat images, interviews, group discussion, previous reports, and maps. For the 2019 image, Google Earth, field observation, original Landsat images, interviews, and group discussions of random reference points in different LULC types were recorded from the field survey conducted by using GPS.
The common and most effective method used to measure the accuracy of the classified image from remotely sensed imagery is an error/confusion matrix [42]. The confusion matrix provides overall accuracy, user accuracy, producer accuracy, and kappa statistics. Kappa coefficient was determined by using Equation (1) [43]. According to the authors of [21], a kappa coefficient value below 0.4 shows poor agreement, a value between 0.4 and 0.8 depicts a moderate agreement, and a value greater than 0.8 shows a strong agreement.
K = N i = 1 r X i i i = 1 r ( X i + ) ( X + i ) N 2 i = 1 r ( X i + ) ( X + i )
K = ( T o t a l s u m   o f   c o r r e c t ) s u m   o f   a l l   t h e   ( r o w   t o t a l c o l u m n   t o t a l ) T o t a l   s q u a r e d s u m   o f   a l l   t h e   ( r o w   t o t a l c o l u m n   t o t a l )
where r—rows number in the matrix, Xii—number of observations in row i and column i (the diagonal elements), X + i and Xi+—the marginal totals of row i and column I, respectively, and N—observations number.

2.3.3. Land Use Land Cover Change Drivers

Driving factors influence LULC changes. LULC changes are driven by natural and human activities [10]. The regionally differing main drivers have great impact on many environmental aspects [44]. Provided that drivers of past changes are sustained, they can be expected to be influential forces in the future. LULC change simulation studies have used topographic and distance driver variables [45,46]. Elevation, slope, distance from roads, distance from streams, distance from urban area, and evidence likelihood rasters were considered as the potential driver variables. Distance from roads, distance from streams, and distance from urban area were set as dynamic variables to express the varying distance as they change over time.
The evidence likelihood is an empirical probability of change in the LULC categories between an earlier and a later map [47]. It is used to transform categorical variables, such as change from one land cover class to another into numerical values. The significance of driver variables was tested using Cramer’s V and P values which measure strength of the correlation between two variable classes. Cramer’s V value is a coarse statistic measure of the association strength or dependency between variables, and it ranges from 0.0 to 1.0 in value. Generally, variables with a total Cramer’s V value greater than 0.15 are considered useful and those with a score over 0.4 are considered good [48,49]. The Cramer’s V does not assure a strong performance of the variables, since it cannot represent the scientific prerequisites and the multifaceted nature of the relationships. It simply helps to determine whether or not to include the particular variable as a driving factor of LULC change [50].

2.4. LULC Change Prediction and Validation

2.4.1. LULC Prediction

The LCM (Land Change Modeler) embedded in the TerrSet Geospatial Monitoring and Modeling System (TGMMS) software was used for prediction of future LULC for a specified year based on the classified historical satellite images. The LCM determines how the factors influence future LULC change, how much land cover change took place between earlier and later LULC, and then calculates a relative amount of transitions [51]. It was widely tested and used to predict change for the analysis and modeling of impacts on biodiversity using multiple land cover categories [46]. The module provides changes of the LULC assessment as losses and gains to each LULC category. LCM produces two simulated maps, i.e., soft projection and hard projection. In hard predictions, a simulated map is developed for the prediction year, in which each pixel is allocated to a specific land use category [52]. Whereas, the soft prediction is a projected map created to show the vulnerability in which each pixel is allocated a value from 0 to 1. The smaller value indicates less vulnerability to change and the high value shows high susceptibility to change [52]. Similarly, the model is used for analyzing, predicting, and validating the predicted LULC change [53].
The trend variations of LULC changes for the years 1990, 2005, and 2019 were analyzed to predict future years of the watershed. The future land use scenarios were based on recent trends, historical land use information, and anticipated future changes. The LCM uses the “change analysis” tab, the “transition potentials” tab, and the “change prediction” tab. The change rates were determined through the “change analysis” tab, along with the “transition potential” maps to simulate the future scenario. The LCM module allows three different approaches to produce maps of transition potential based on the individual sub-models and associated explanatory variables: multi-layer perceptron (MLP) neural network, logistic regression, and a similarity-weighted instance-based machine learning tool (SimWeight) [47]. The MLP estimates accurately the land that would be estimated to change from the image of later date to the specified simulation date based on the projection. From the approaches, the performance of MLP is stronger when modeling the relationship between non-linear land change and the explanatory variables. It is more flexible and dynamic compared to the others when multiple transition types are modeled [47].
The TerrSet model uses CA-MC which is a stochastic modeling process to simulate the future changing over time from past changes [54]. It predicts the spatial structure of various LULC categories and scenarios based on the TPM [31,55]. To predict LULC change, the Markov matrix model depends on the Bayes equation (Equation (2)) that evaluates the change by comparing the initial (T1) and the second land cover (T2) [47].
S(t+1) = Pij ∗ S(t)
P i j =   [ P 11         P 12         P 1 n P 21         P 22       P 2 n                       P n 1         P n 2       P n n ]
where 0 ≤ Pij < 1 and j = 1 n P i j = 1, (i, j = 1, 2, …, n). The cellular automata model can be expressed by the following equation:
S(t,t+1) = f[S(t),N]
where S(t) and S(t+1) are the system status at times t and t + 1, respectively, N—cellular field, t and t + 1 are the different times, f—transformation rule of cellular states in local space, S—the set of limited and discrete cellular states, Pij—the transition probability matrix in a state.
The CA-Markov considers constraints and factors to prepare a single map of suitability [28,51,56]. The model prepares the probability transition matrix and transition probability areas. The probability transitional matrix contains the changing probability of an individual LULC class to other classes. The transitional area matrix contains the pixel number that is expected to change from each LULC class over the specified time frame [48].

2.4.2. Model Validation

Validation is simply a procedure to assess the quality of the predicted LULC map against a reference map [57]. The images of Landsat for 1990 and 2005 were utilized to simulate the 2019 LULC image. The comparison of simulated LULC image with the actual map was developed. The LULC of the 1990 and 2005 years were provided to calibrate LCM, and the model was validated by simulating the recent LULC map of 2019. The validation process in LCM involves a cross-tabulation in a three-way comparison between the later land cover map (2005), the predicted land cover map (2019), and the actual map (2019). The module validation in the LCM model was used to assess statistically the quality of the predicted 2019 LULC image against the 2019 reference image [57].
The map shows areas where the model correctly predicted called “hits”, areas where the model predicted change but it actually did not occur called “false alarms”, and occasions where the model was unable to predict it, but areas are changed in reality, called “misses”. After the model prediction capacity was verified between the 1990 and 2005 time periods for 2019, the simulation process was repeated to project the 2035 and 2050 map using 2005 and 2019 classified maps. The other method is the kappa coefficient calculation between the predicted map and actual land use map [58]. However, the original kappa coefficient does not distinguish between the quantification and location error, delimiting its expressiveness. This can be resolved by calculating cause dependent K-indices, Kno (kappa for no information), Klocation (kappa for location), Kstandard (kappa for standard), and KlocationStrata (kappa for stratum-level location) [58].
The overall agreement of the projected and reference map indicates the Kappa for no information (Kno). The location kappa (Klocation) is used to compute the spatial accuracy in the overall landscape, because of the correct assignment values in each category between the simulated and reference map [59]. The ratio of inaccurately allocations by chance to the correct assignments is kappa for standard (Kstandard) [53]. The kappa for stratum level location (KlocationStrata) is a quantification of the spatial accuracy within pre-identified strata, and it indicates how well the grid cells are situated within the strata [47]. The blend of Kstandard, Kno, Klocation, and Klocation strata scores is considered for a comprehensive evaluation of the overall accuracy both in terms of location and quantity. Additionally, the statistics considered are AgreementQuantity, AgreementChance, AgreementGridCell, DisagreementGridCell, and DisagreementQuantity to know exactly how strong the agreement is between the simulated map and the base map (Table 3).
The DisagreementQuantity and DisagreementGridCell constituents are crucial to understand the simulated model [57]. This sort of validation method gives the idea about the level of agreement or disagreement between projected and actual LULC maps [49]. The two most important differences between the two categorical maps are in terms of quantity (changes or persistence) and allocation. Disagreement by quantity is the variation between two images because of an imperfect combination in the overall proportions of LULC categories. The allocation disagreement is the distinction between two images caused by an imperfect combination among the spatial allocations of all land cover map categories [53].

2.5. Analysis of Land Use Land Cover Change

The change of LULC assessment was computed using the LCM model. Different LULC categories of quantitative assessment, net change of LULC categories, and the contributors to the net change experienced by each LULC class are the three sections of results identified in the LCM. Change analysis was performed by using the classified maps (1990, 2005, and 2019) and the predicted LULC (2035 and 2050) to demonstrate the pattern of changes [58]. The LULC dynamics in each study period were assessed using the numerical values extracted from the classified images. To acquire the change pattern, the images classified from consecutive periods were cross-tabulated and compared to each other. The probability matrix was done between 1990 and 2005, 2005 and 2019, 2019 and 2035, 2035, and 2050 using LCM. The change percentage [35] and the rate of change were determined [41] for LULC categories by using Equations (5) and (6), respectively, to determine the amount of the changes experienced between the periods of the different LULC categories.
Percent   of   change   =   A y A x A x 100
Rate   of   change   ( ha / year )   =   A y A x T
where Ax is the area of LULC (ha) of an earlier land cover image, Ay is the area of LULC (ha) of a later land cover image, T is the time interval between Ax and Ay in years.

3. Results and Discussions

3.1. Accuracy Assessment of the Classified Images

The assessment of accuracy was performed for LULC change analysis by generating confusion/error matrix in each LULC category of 1990, 2005, and 2019 classified maps. The overall accuracy, kappa statistics, producer’s and user’s accuracy have been used for assessment. The kappa statistics and overall accuracy of classified images shows 91.43%, 87.59%, 85.71% and 0.93, 0.90, and 0.88 for the years 2019, 2005, and 1990, respectively (Table 4). The more recent LULC map accuracy results were higher and these may be related to a higher spatial resolution of satellite images.
The accuracy assessment of LULC is required in any study using remote sensing Landsat data for the historical LULC. According to the authors of [61], LULC map accuracy is quantified by creating an error matrix or a confusion matrix, which compares the classified map with a reference classification map. The results of the study is consistent with some other studies conducted by the authors of [41] in Dera District, of [36] in Borena Woreda, of [10] in Blue Nile basin, of [9] in Gumera, of [62] in Portugal, of [11] in Poland, Slovakia, and Czechia, and of [63] in India. The accuracy of this study shows that the result is within the range of accuracies, in which Land Change Modeler and Landsat images were used [55,63].

3.2. LULC Change Analysis

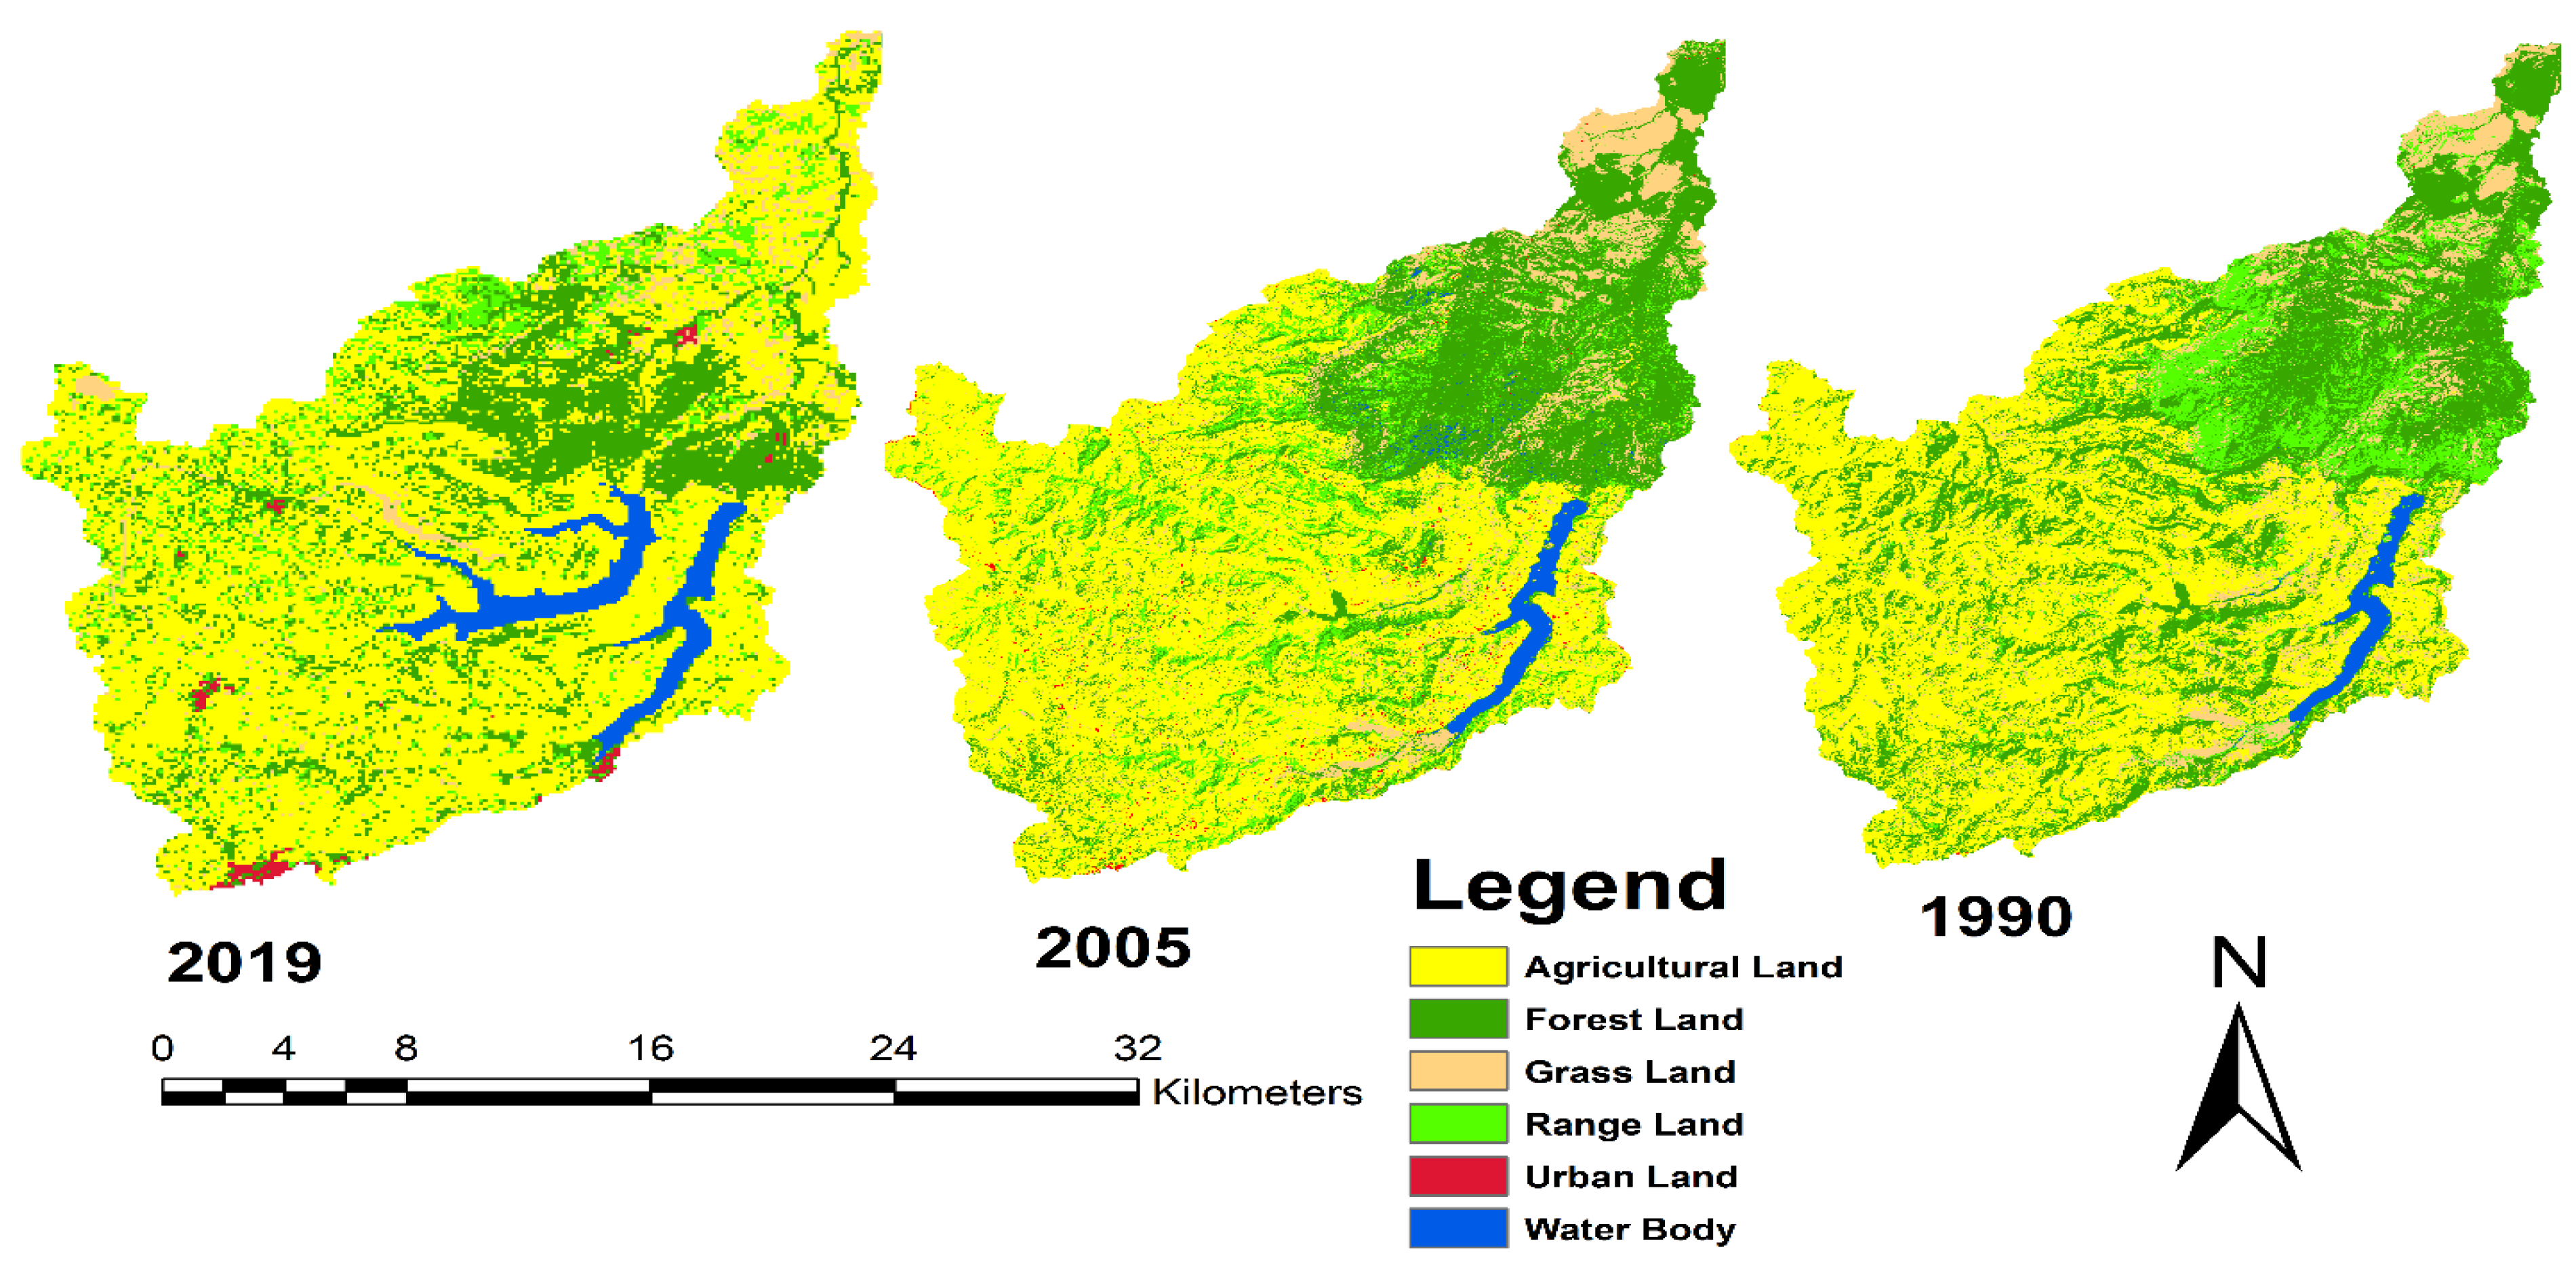
The change of the LULC analysis was through evaluation of gains, net change, and losses experienced by different categories using change analysis in LCM. The evaluation of spatial and temporal changes between various classes during the period 1990, 2005, and 2019 was analyzed (Figure 2 and Table 5). The “from–to” transformations are summarized as loss, gain, and net change of LULC in Figure 3 and Figure 4. The gain of LULC for each class was determined from the result of persistence and the total column value, whereas the loss is from total row and the persistence.
The agricultural land is the dominant LULC type of the watershed which covered 43.97% of the study area in 1990, 50.39% in 2005, and 61.19% in 2019 (Table 5). The changes in LULC have influenced forest distribution in the study area. The forest land area, which is also the largest part of land use class, has significantly decreased. Similarly, according to the least prevalent types of land use, the urban areas and water body increased from 1990 to 2019. The significant increase of agricultural land, water body, urban land, and the sharp decline of forest land in the watershed were the major transformations observed. Although forest land, range land, and grass land experienced reduction in coverage throughout the study periods, the greatest reduction rate was observed in forest land. To mitigate the rapid rates of LULC conversions at watershed, the application of integrated watershed management strategies, managing the rapid population growth, afforestation of degraded or deforested areas, and reducing the dependency of locals on forest products is critically important. The findings of the study are consistent with other studies conducted in Ethiopia by the authors of [64] in Birr and Upper Didesa watersheds of the Blue Nile basin, and as outlined in [41] for Dera district of northwestern Ethiopia, where the agricultural land increased significantly and the forest land was shrinking.

3.3. Driver Variables of LULC Change

The driver variables influencing changes are based on spatial analysis and added to the model either as static or dynamic components [47]. The LULC prediction in the watershed was based on change in a driver’s impact. In this study, both topography and proximity factors were selected to analyze the LULC change. Before the drivers are added to the model, the selected driver variables were tested for their explanatory value using Cramer’s V and P values (Table 6). The Cramer’s V value does not give decisive proof that a particular variable explains the change in land use. It is rather a more intuitive tool that can be utilized to understand the significance that a particular variable has in influencing change.
Evidence likelihood is used for the determination of the relative frequency of pixels of different LULC types within the areas of change. It is recommended in cases where there are low Cramer’s V values. The obtained result for evidence likelihood is considered as good. In this study, it is a quantitative measure of the frequency of change between agricultural land and all other land classes (also called disturbance).
From Table 6, it was observed that the variable such as elevation, distance from urban areas, distance from stream, distance from road are considered as useful variables of transitions. Variables such as slope have low Cramer’s V values, and it shows that the effect of slope on LULC change in the study area is not critical. The variables with good Cramer’s V value show that they are the most explanatory variables for LULC change. All driver variables were used to model the transitions in this study. The elevation and slope are recognized as the imperative topographic factors affecting LULC change. Topography has effects on the spread and extent of urban distribution, forest and range land conversion to agricultural land. The authors of [65] found that deforestation decreases with the increase of the slope gradient. The other driver variables such as distance from stream, distance from urban areas, and distance from roads also play an important role in land use change, as each provides convenience to residents to access resources.

3.4. Transition Probability Matrix (TPM)

Transition potential modeling is assessing the likelihood of LULC change from one class to another depending on the suitability transition of area and the presence of driving forces [66]. The TPM records the probability of each land use class to change into the other class. The LULC changes of the future predictions are utilized through the probability of the transition matrix [67]. The transition probability matrices produced by the model between LULC types during the periods 1990–2005 and 2005–2019 were depicted in Table 7. The spatiotemporal LULC change assessment between the earlier and later land cover maps were cross-tabulated. The cross-tabulation is used to determine the amounts of change and conversions between different land cover maps. In the table of cross-tabulation shown in Table 7, the bolded frequencies along the transition probability matrix of the diagonal confirm the probability of LULC class remaining unchanged (persistence) from the earlier to the later land cover map. Whereas, the off-diagonal frequencies express the possibility of a given LULC experiences changes from one to another. The change analysis is depends on the changes in LULC between time 1 and time 2 [28].
The agricultural land which is the highest class has 39,662.13 ha with the probability of remaining as agricultural land in 1990–2005. The conversion of forest land, range land, and grass land was the major contributing land use for the agricultural land. The minimum loss of LULC category was observed from water body to grass land and urban land. Although in urban land there was minimum or no conversion to range land and water body. In 2005–2019 the highest class loss was the change of forest land to agricultural land by 12,051.96 ha.
In 2005–2019, especially since 2012, a dam on Nashe River was built for irrigation and hydropower purposes. The water body has increased. The displacement of communities occurred from their land during the expansion of hydropower projects and the displacement caused land scarcity. The lowland areas of the watershed was covered with forests, range lands, and grass lands before 1990 even before 2005. Currently, however, a great decline of forest cover is occurring because of urbanization and agricultural land expansion. In recent times, the expansion of urban areas has been continuously increasing at the highest rate.
The findings of the study show that urban area increase was consistent with other research findings in Africa [8] and Ethiopia [9,10]. The studies in some parts of Europe, for example, [13] in Slovakia, [62] in Portugal, and [11] in Poland, Slovakia, and Czechia, reported an increase in urban areas at the expense of agricultural land. Similarly, a study in China reported that the urban built-up land expansion from conversion of cultivated land [68]. The authors of [12] revealed that effective urban planning is needed to address the multiple challenges and competing interests of urban environments for the rapid increase in urban built-up area with scarce land and water resources on the urban edge.

3.5. Validation of the Model

The agreement of the two categorical maps was measured by using Validation Module. In order to assess the accuracy, validation of the model is necessary. Validation is significant as it allows to determine the quality of the predicted land cover map with actual map. A comparison was made between the actual and simulated LULC map of 2019 so as to validate the predicted map. The less effective simulated LULC class is water body as the projected map was from the maps before construction of the dam and the actual LULC map is from after the construction. The validation results between the simulated and actual LULC test summary of the model are presented in Table 8.
The achieved k-indices are compiled in Table 9. The model is regarded to be validated if the Kstandard (overall kappa) score exceeds 70% [22]. The values of k-index greater than 80% show good agreement between the projected and actual LULC map that exceeds the minimum acceptable standard [47]. Here, all indices are greater than 80%, showing a good overall agreement and projection ability of the model.
The values of AgreementChance, AgreementQuantity, AgreementGridCell, Disagreement Grid Cell, and Disagreement Quantity in Table 10 provide statistical agreement information between the simulated map and the reference map. Namely, DisagreementGridCell and DisagreementQuantity constituents are crucial to recognize the model simulated outputs [57].
The disagreement between the two maps is generally low and this is mainly due to quantity errors (0.0513) rather than allocation errors (0.0269). The agreement measures show overall good agreement between the actual and simulated map (92.81%). The result shows that in the study area the model has higher ability to predict the LULC changes in location than in quantity. This indicates the good capacity of the model in simulating future LULC states and an accurate specification of location.
According to the authors of [55], the model was validated by comparing the map of observed LULC of 2019 with the predicted LULC map of 2019 using the statistics of kappa index. For accuracy assessment measurement in a number of studies, kappa coefficient is still considered as a vital tool [61]. The LULC change model performance is different for different study areas because of varied environmental features and situations of the individual study area [62,63].

3.6. Future LULC Prediction

The LULC change of the future has been predicted for the years 2035 and 2050. The future probable percentages of changes in LULC for the periods of 2019–2035 and 2035–2050 were analyzed by transition probabilities matrix. The quantity of change and the spatial distribution are the two aspects of LULC prediction in LCM that are provided by Markov chain and MLP neural network, respectively [69]. The simulated future LULC images of the watershed obtained from the LCM are shown in Figure 5. Similarly, the area coverage, percentage, and rate of change are provided in Table 11. Generally, the LULC change increase or decrease was provided in Figure 6.
Significant change was observed from the change analysis result in LULC change between 1990 and 2050. Agricultural land will be the predominant LULC type. It was seen from the result as the area of agricultural land increment from 61.19% in 2019 to 72.98% in 2035 and 73.24% in 2050. This was mainly caused by converting forest, range, and some parts of grass land. Agricultural land increased significantly from 1990 to 2035 and then slowly from 2035 to 2050 (Figure 7 and Table 11). Similarly, a continuous increment was also observed in urban areas and water bodies from the 2019 to 2050 periods. The development of infrastructure, industry, and housing have taken place and are expected to take place around the watershed, therefore, the urban land will increase. The urban coverage around watershed totaled 1.15% in 2019, which is predicted to reach 2.00% and 3.82% by 2035 and 2050, respectively. The graphical demonstration of the area covered by six LULC classes for past years (1990, 2005, and 2019) and for the prediction years (2035 and 2050) are shown in Figure 8.
The forest land and range land show a decreasing trend from 2019 to 2035. Unfortunately, the grass land, range land, and agricultural land will slightly increase from 2035 to 2050. This might be due to the limited area of land for different purposes. The major contributing factors to LULC change were the expansion of hydropower and irrigation projects, mostly at the downstream, for expansion of a sugar factory. The scarcity of jobs and urban expansions in the catchment amplified the socio-economic activities for LULC changes. In the watershed, the downstream and partly at the upstream areas, which were previously covered by forests and range lands, have been converted to agricultural land and commercial crop farms.
Forest reduction also occurred as a result of using charcoal and firewood as the energy source for most of the people living around the watershed, who depend on fuel wood. Additionally, most of the evacuated population during the construction of Nashe and Amerti projects were involved in converting the forest land to agriculture and settlement. Illegal and unplanned settlements by the local people to expand agriculture and settlement also contributed to destruction of forest land, range land, and grass land. Thus, the forest conversion needs to be controlled and well-managed, and a reasonable land use plan should be developed in an organized way. The expansion of one LULC type occurs at the detriment of other LULC classes [70]. Currently, the government has given more emphasis to the plantation trees program. Hence, in the country, many of the areas that were deforested might become covered by plants again. In the future prediction of LULC scenarios, the change of the area in the transition matrix was determined (Table 12).
The study shows that agricultural land experienced the largest increase from the historical analysis to the projections. The conversion of other land uses to agricultural land might be mainly associated with the land demand for crop production to satisfy the food demand of the increasing human population, deforestation for household energy consumption, construction of materials, and loss of land productivity. This may cause serious environmental impacts unless proper environmental management strategies are planned and implemented. As per the analysis in the entire watershed, the urban area was increased. This increase was assumed to be closely associated with the rise of infrastructure to accommodate the increasing population. To minimize land degradation, it is necessary to apply management measures such as soil and water conservation technologies, family planning, and promotion of agricultural land use intensification in the study watershed. The future land use and land cover change plan for the study area should be made in advance and needs to be incorporated at policy level.
A Multilayer Perceptron neural network and CA-Markov modeling in LCM-based analysis was combined with GIS, and remote sensing technologies was used to perform the analysis of the LULC change. The performance of the MLPNN-CA-MC in LCM for the LULC pattern was not assessed previously over this study watershed as far as the authors are aware. Additionally, analyses regarding the dynamics of LULC changes and their drivers are not conducted in the study area. Therefore, in this study, the LULC dynamics of the historical and future LULC were assessed using Landsat images and LCM by using the drivers of LULC dynamics. Consequently, this study will also help to assess the performance of the MLPNN-CA MC approach over the watershed area. The future LULC is somewhat known in some parts of Ethiopia but not in the study area. The LCM embedded in the TGMMS model was successfully used by different researchers in other areas and it confirmed that LCM, based on MLPNN-CA-MC, is a capable model for the assessment and prediction of LULC change, urban growth, and the validation of results [9,21,57,63,71,72].
Generally, the patterns of LULC change in the past almost three decades shows forest land decreased at an average rate of 48.38%. The results showed that the agricultural land gained the most area compared to the other LULC types. However, at the expense of forest LULC categories, agricultural land is expanding at an average rate of 39.15% (1990–2019). From the temporal patterns of the changes between 1990 and 2019, forest land decreased at a higher rate. The other affected LULC types were range land and grass land. The urban land and water body LULC classes gained trends in the study.
Simulation analysis was conducted for the years of 2035 and 2050 based on historical LULC change data from 1990–2005, 2005–2019, and 1990–2019, which were used as a baseline. Similar to the historical analysis of LULC change, the predicted results of forest, grass, and range land classes were registered net loss in the area from 1990 to 2035. Whereas, the range land and grass land smoothly gained from 2035–2050. The predicted results of the year 2035 and 2050 show an increase in agriculture, water body and urban land. Therefore, future land use activities ought to be based on proper land use development and land regulation to reduce the enduring adverse impact of LULC changes. Ref. [12] confirmed that effective urban planning is needed to address the multiple challenges and competing interests of urban environments for rapid increase in urban built up area on scarce land.
Ref. [72] indicated that agricultural land expansion, both for commercial and crop production is the main driver of LULC change. The rate of crop land expansion is increasing whereas forests, grass land, shrub land and other lands are decreasing in the world. This study finding is in agreement with results from previous studies that confirm the major driver of LULC change [9,10,21,57,62,63,72]. Ref. [73] reported that weak law enforcement and growth of population are fundamental drivers of deforestation. The other driving force for agricultural land expansion is probably government policy [72]. On the other hand, the major underlying driving forces are Demographic, Economic, Technological, Institution, policy and biophysical factors were identified by the key informant and FGDs of the study. Agricultural expansion, firewood extraction, settlement expansion, land tenure policy and infrastructure development were the top LULC change drivers.

4. Conclusions

The present study was carried out to understand the changes in the historical and predicted land use land cover patterns from the year 1990 to 2050. The integrated approach including remote sensing, GIS, and a MLPNN-based CA-MC model was used to understand the spatiotemporal dynamics of LULC and prediction of future LULC change in Nashe watershed, Ethiopia. The conclusions drawn from the research findings were the following.
The multitemporal satellite imagery data are used for informed decision-making in LULC change, providing the potential information required for monitoring and evaluating of LULC changes. The precision of the data from the remotely sensed imagery classified based on the maximum likelihood classification method with high resolution image of Landsat was checked through an error matrix and it yielded an acceptable result that was further processed for analysis.
To validate the model, the projected 2019 LULC map was compared with 2019 actual LULC map. After successful model validation, the LULC map for the years 2035 and 2050 were simulated by considering the business-as-usual scenario. In this procedure, we used 1990–2005 and 2005–2019 LULC data as a baseline and current scenario for comparison. Its validation showed a strong correlation between the simulated LULC map and satellite-derived map, which proved the simulation model’s reliability.
The rapid and massive changes of LULC in the watershed may have serious environmental impacts. The analysis of LULC change shows that forest cover has been decreasing, as well as the high increasing rate of urban area and agricultural land. The predicted LULC situation show that this cover would continue in the future. This will increase vulnerability of the watershed to landslides, soil loss, gully erosion, worsened air pollution, and impact the hydrology of the studied watershed in particular and the Blue Nile Basin in general.
Therefore, suitable and timely management measures must be taken by policy decision makers to enable sustainable development and to protect the watershed in order to reduce the severity of the changes.
Settlement expansion, agricultural expansion, firewood extraction, land tenure policy, and infrastructure development were the top LULC change drivers. Moreover, to ensure a better environmental condition, this kind of study revealed a significant prospective to contribute towards the sustainable environmental planning and management system of an area at the local and global levels.
Finally, it can be concluded that the projected conditions may be reversed, which is very important to reduce the enduring adverse impact of LULC changes on the watershed hydrological components through the announced nationwide tree planting, implementing the strategy of climate resilient green economy and formulating the local- and regional-scale policies required for sustainable development. Future studies incorporating the assessment of land use and land cover change impacts on the hydrological parameters of the watershed would be helpful for better management of the watershed.

Author Contributions

Development of the work methodology, M.K.L., T.A.D. and J.T.; preparation and analysis of data, M.K.L.; model setup, M.K.L.; simulation, M.K.L.; validation, M.K.L., T.A.D. and J.T.; original manuscript writing, M.K.L.; review and editing, M.K.L. and J.T.; supervision the study work, reviewing and editing of the manuscript, J.T. and T.A.D. All authors have read and agreed to the published version of the manuscript.

Funding

This research was part of the DAAD-EECBP Home Grown PhD Scholarship Program under (EECBP Homegrown PhD Program-2019).

Institutional Review Board Statement

Not applicable.

Informed Consent Statement

Not applicable.

Data Availability Statement

The data used in this study can be available from the authors on reasonable request.

Acknowledgments

Megersa Kebede Leta thanks the German Academic Exchange Service (DAAD) for providing a scholarship during the study.

Conflicts of Interest

The authors declare no conflict of interest.

References

  1. FAO. Watershed Management in Action: Lessons Learned from FAO Field Projects; Food & Agriculture Organization: Rome, Italy, 2017; pp. 5–6. [Google Scholar]
  2. Mmbaga, N.E.; Munishi, L.K.; Treydte, A.C. How dynamics and drivers of land use/land cover change impact elephant conservation and agricultural livelihood development in Rombo, Tanzania. J. Land Use Sci. 2017, 12, 168–181. [Google Scholar] [CrossRef]
  3. Pérez-Vega, A.; Mas, J.F.; Ligmann-Zielinska, A. Comparing two approaches to land use/cover change modeling and their implications for the assessment of biodiversity loss in a deciduous tropical forest. Environ. Model Softw. 2012, 29, 11–23. [Google Scholar] [CrossRef]
  4. Kolb, M.; Mas, J.F.; Galicia, L. Evaluating drivers of land-use change and transition potential models in a complex landscape in Southern Mexico. Int. J. Geogr. Inf. Sci. 2013, 27, 1804–1827. [Google Scholar] [CrossRef]
  5. FAO. Climate Change and Food Security: Risks and Responses; Food & Agriculture Organization: Rome, Italy, 2015. [Google Scholar]
  6. Manakos, I.; Braun, M. Land Use and Land Cover Mapping in Europe; Springer: Berlin/Heidelberg, Germany, 2014. [Google Scholar]
  7. Lee, J.E.; Lintner, B.R.; Boyce, C.K.; Lawrence, P.J. Land use change exacerbates tropical South American drought by sea surface temperature variability Land use change exacerbates tropical South American drought by sea surface temperature variability. Geophys. Res. Lett. 2011, 38, 19. [Google Scholar] [CrossRef]
  8. Gibbs, H.K.; Ruesch, A.S.; Achard, F.; Clayton, M.K.; Holmgren, P.; Ramankutty, N.; Foley, J.A. Tropical forests were the primary sources of new agricultural land in the 1980s and 1990s. Proc. Natl. Acad. Sci. USA 2010, 107, 1–6. [Google Scholar] [CrossRef] [PubMed] [Green Version]
  9. Wubie, M.A.; Assen, M.; Nicolau, M.D. Patterns, causes and consequences of land use / cover dynamics in the Gumara watershed of lake Tana basin, Northwestern Ethiopia. Environ. Syst. Res. 2016, 5, 1–12. [Google Scholar] [CrossRef] [Green Version]
  10. Gashaw, T.; Tulu, T.; Argaw, M.; Worqlul, A.W. Evaluation and prediction of land use/land cover changes in the Andassa watershed, Blue Nile Basin, Ethiopia. Environ. Syst. Res. 2017, 6, 1–15. [Google Scholar] [CrossRef]
  11. Wnek, A.; Kudas, D.; Stych, P. National level land-use changes in functional urban areas in Poland, Slovakia, and Czechia. Land 2021, 10, 39. [Google Scholar] [CrossRef]
  12. Riad, P.; Graefe, S.; Hussein, H.; Buerkert, A. Landscape and urban planning landscape transformation processes in two large and two small cities in Egypt and Jordan over the last five decades using remote sensing data. Landsc. Urban Plan. 2020, 197, 103766. [Google Scholar] [CrossRef]
  13. Tarasovičová, Z.; Saksa, M.; Blažík, T.; Falťan, V. Changes in agricultural land use in the context of ongoing transformational processes in Slovakia. Agriculture (Pol’nohospodárstvo) 2013, 59, 49–64. [Google Scholar] [CrossRef]
  14. Serra, P.; Pons, X.; Saurí, D. Land-cover and land-use change in a Mediterranean landscape: A spatial analysis of driving forces integrating biophysical and human factors. Appl. Geogr. 2008, 28, 189–209. [Google Scholar] [CrossRef]
  15. Tiwari, A.; Suresh, M.; Rai, A.K. Ecological planning for sustainable development with a green technology : GIS. Int. J. Adv. Res. Comput. Eng. Technol. 2014, 3, 636–641. [Google Scholar]
  16. Behera, M.D.; Borate, S.N.; Panda, S.N.; Behera, P.R.; Roy, P.S. Modelling and analyzing the watershed dynamics using Cellular Automata (CA)-Markov model—A geo-information based approach. J. Earth Syst. Sci. 2012, 121, 1011–1024. [Google Scholar] [CrossRef] [Green Version]
  17. Yirsaw, E.; Wu, W.; Shi, X.; Temesgen, H.; Bekele, B. Land use/land cover change modeling and the prediction of subsequent changes in ecosystem service values in a coastal area of China, the Su-Xi-Chang region. Sustainability 2017, 9, 1204. [Google Scholar] [CrossRef] [Green Version]
  18. Sohl, T.L.; Sleeter, B.M. Land-use and land-cover scenarios and spatial modeling at the regional scale. US Geol. Surv. 2012, 2012–3091, 4. [Google Scholar] [CrossRef]
  19. Wang, S.; Zhang, Z.; Wang, X. Land use change and prediction in the Baimahe Basin using GIS and CA-Markov model. IOP Conf. Ser. Earth Environ. Sci. 2014, 17, 13–18. [Google Scholar] [CrossRef] [Green Version]
  20. Paegelow, M.; Camacho Olmedo, M.T.; Mas, J.F.; Houet, T.; Pontius, R.G. Land change modelling: Moving beyond projections. Int. J. Geogr. Inf. Sci. 2013, 27, 1691–1695. [Google Scholar] [CrossRef] [Green Version]
  21. Mishra, V.N.; Rai, P.K. A remote sensing aided multi-layer perceptron-Markov chain analysis for land use and land cover change prediction in Patna district (Bihar), India. Arab. J. Geosci. 2016, 9, 1–18. [Google Scholar] [CrossRef]
  22. Zadbagher, E.; Becek, K.; Berberoglu, S. Modeling land use/land cover change using remote sensing and geographic information systems: Case study of the Seyhan Basin, Turkey. Environ. Monit. Assess. 2018, 190, 1–15. [Google Scholar] [CrossRef]
  23. Noszczyk, T. A review of approaches to land use changes modeling. Hum. Ecol. Risk Assess. 2018, 25, 1377–1405. [Google Scholar] [CrossRef]
  24. Memarian, H.; Kumar Balasundram, S.; Bin Talib, J.; Teh Boon Sung, C.; Mohd Sood, A.; Abbaspour, K. Validation of CA-Markov for simulation of land use and cover change in the Langat Basin, Malaysia. J. Geogr. Inf. Syst. 2012, 4, 542–554. [Google Scholar] [CrossRef] [Green Version]
  25. Regmi, R.R.; Saha, S.K.; Balla, M.K. Geospatial analysis of land use land cover change predictive modeling at Phewa Lake watershed of Nepal. Int. J. Curr. Eng. Technol. 2014, 4, 2617–2627. [Google Scholar]
  26. Wu, Q.; Li, H.-Q.; Wang, R.-S.; Paulussen, J.; He, Y.; Wang, M.; Wang, B.-H.; Wang, Z. Monitoring and predicting land use change in Beijing using remote sensing and GIS. Landsc. Urban Plan. 2006, 78, 322–333. [Google Scholar] [CrossRef]
  27. Mas, J.F.; Kolb, M.; Paegelow, M.; Camacho Olmedo, M.T.; Houet, T. Inductive pattern-based land use/cover change models: A comparison of four software packages. Environ. Model Softw. 2014, 51, 94–111. [Google Scholar] [CrossRef] [Green Version]
  28. Eastman, J.R. IDRISI Selva Tutorial; 17th Version; IDRISI Production: Worcester, MA, USA, 2012; pp. 30–45, 51–63. [Google Scholar]
  29. Shooshtari, S.J.; Gholamalifard, M. Scenario-based land cover change modeling and its implications for landscape pattern analysis in the Neka Watershed, Iran. Remote Sens. Appl. Soc. Environ. 2015, 1, 1–19. [Google Scholar] [CrossRef]
  30. Tong, S.T.Y.; Sun, Y.; Yang, Y.J. Generating a future land-use change scenario : A case study of the Little Miami River Watershed, Ohio. J. Environ. Inform. 2012, 19, 108–119. [Google Scholar]
  31. Li, S.H.; Jin, B.X.; Wei, X.Y.; Jiang, Y.Y.; Wang, J.L. Using CA-Markov model to model the spatiotemporal change of land use/cover in fuxian lake for decision support. ISPRS Ann. Photogramm. Remote Sens. Spat. Inf. Sci. 2015, 2, 163–168. [Google Scholar] [CrossRef] [Green Version]
  32. Adepoju, M.O.; Millington, A.C.; Tansey, K.T. Land use/land cover change detection in metropolitan Lagos (Nigeria): 1984–2002. In Prospecting for Geospatial Information Integration, Proceedings of the ASPRS Annual Conference, Reno, NV, USA, 1–5 May 2006; ASPRS: Bethesda, MD, USA, 2006. [Google Scholar]
  33. United Nations. World Urbanization Prospects: The 2014 Revision, United Nations Department of Economic and Social Affairs/Population Division; United Nations: New York, NY, USA, 2014; Available online: http://esa.un.org/unpd/wup/Highlights/WUP2014-Highlights.pdf (accessed on 2 January 2015).
  34. Triantakonstantis, D.; Stathakis, D. Examining urban sprawl in Europe using spatial metrics. Geocarto Int. 2015, 30, 1–21. [Google Scholar] [CrossRef]
  35. Ebrahim, E.H.; Mohamed, A. Land use/cover dynamics and its drivers in Gelda catchment, Lake Tana watershed, Ethiopia. Environ. Syst. Res. 2017, 6, 1–13. [Google Scholar]
  36. Abate, S. Journal of Sustainable Development in Africa. J. Sustain. Dev. Africa. 2011, 13, 87–107. [Google Scholar]
  37. Yalew, S.G.; Mul, M.L.; van Griensven, A.; Teferi, E.; Priess, J.; Schweitzer, C.; van Der Zaag, P. Land-use change modelling in the upper blue nile basin. Environments 2016, 3, 21. [Google Scholar] [CrossRef] [Green Version]
  38. Haregeweyn, N.; Tsunekawa, A.; Poesen, J.; Tsubo, M.; Meshesha, D.T.; Fenta, A.A.; Nyssen, J.; Adgo, E. Comprehensive assessment of soil erosion risk for better land use planning in river basins: Case study of the Upper Blue Nile River. Sci. Total Environ. 2017, 574, 95–108. [Google Scholar] [CrossRef] [Green Version]
  39. Al-sharif, A.A.A.; Pradhan, B. Monitoring and predicting land use change in Tripoli Metropolitan City using an integrated Markov chain and cellular automata models in GIS. Arab. J. Geosci. 2014, 7, 4291–4301. [Google Scholar] [CrossRef]
  40. Samal, D.R.; Gedam, S.S. Optimal ground control points for geometric correction using genetic algorithm with global accuracy. Eur. J. Remote Sens. 2015, 48, 85–99. [Google Scholar] [CrossRef]
  41. Temesgen, G.; Amare, B.; Abraham, M. Evaluations of land use/land cover changes and land degradation in Dera District, Ethiopia: GIS and Remote Sensing Based Analysis. Int. J. Sci. Res. Environ. Sci. 2014, 2, 199–208. [Google Scholar]
  42. Lucia, M.-B.; Lyons, M.B.; Phinn, S.R.; Roelfsema, C.M. Trends in remote sensing accuracy assessment approaches in the context of natural resources. Remote Sens. 2019, 11, 1–16. [Google Scholar]
  43. Jenness, J.; Wynne, J.J. Cohen’s Kappa and Classification Table Metrics 2.0: An ArcView 3. x Extension for Accuracy Assessment of Spatially EXPLICIT Models. 2005. Available online: http://www.treesearch.fs.fed.us/pubs/25707 (accessed on 2 January 2015).
  44. Megersa, K.L.; Tamene, A.D.; Sifan, A.K. Impacts of land use land cover change on sediment yield and stream flow. Int. J. Sci. Technol. 2017, 6, 763–781. [Google Scholar]
  45. Khoi, D.D. Spatial Modeling of Deforestation and Land Suitability Assessment in the Tam Dao National Park Region, Vietnam Spatial Modeling of Deforestation and Land Suitability Assessment in the Tam Dao National Park Region, Vietnam. Ph.D. Thesis, University of Tsukuba, Tsukuba, Japan, January 2011. [Google Scholar]
  46. Mas, J.F.; Pérez-Vega, A.; Clarke, K.C. Assessing simulated land use/cover maps using similarity and fragmentation indices. Ecol. Complex. 2012, 11, 38–45. [Google Scholar] [CrossRef]
  47. Eastman, J.R. TerrSet Geospatial Monitoring and Modeling System—Manual. Available online: www.clarklabs.org (accessed on 2 January 2016).
  48. Eastman, J.R. IDRISI Terrset Manual; IDRISI Production: Worcester, MA, USA, 2016. [Google Scholar]
  49. Islam, K.; Rahman, M.F.; Jashimuddin, M. Modeling land use change using cellular automata and artificial neural network: The case of Chunati wildlife sanctuary, Bangladesh. Ecol. Indic. 2018, 88, 439–453. [Google Scholar] [CrossRef]
  50. Hasan, S.; Shi, W.; Zhu, X.; Abbas, S.; Khan, H.U.A. Future simulation of land use changes in rapidly urbanizing South China based on land change modeler and remote sensing data. Sustainability 2020, 12, 4350. [Google Scholar] [CrossRef]
  51. Clark, L. Clark Labs. Available online: http://www.clarklabs.org (accessed on 2 January 2015).
  52. Ayele, G.; Hayicho, H.; Alemu, M. Land use land cover change detection and deforestation modeling: In Delomena district of Bale Zone, Ethiopia. J. Environ. Prot. 2019, 10, 532–561. [Google Scholar] [CrossRef] [Green Version]
  53. Kim, I.; Jeong, G.; Park, S.; Tenhunen, J. Predicted land use change in the Soyang River Basin, South Korea. In Proceedings of the TERRECO Science Conference, Garmisch-Partenkirchen, Germany, 2–7 October 2011; pp. 17–24. [Google Scholar]
  54. Fathizad, H.; Rostami, N.; Faramarzi, M. Detection and prediction of land cover changes using Markov chain model in semi-arid rangeland in western Iran. Environ. Monit. Assess. 2015, 187, 1–12. [Google Scholar] [CrossRef]
  55. Wang, S.Q.; Zheng, X.Q.; Zang, X.B. Accuracy assessments of land use change simulation based on Markov-cellular automata model. Procedia Environ. Sci. 2012, 13, 1238–1245. [Google Scholar] [CrossRef] [Green Version]
  56. Singh, S.K.; Mustak, S.; Srivastava, P.K.; Szabó, S.; Islam, T. Predicting spatial and decadal LULC changes through cellular automata Markov chain models using earth observation datasets and geo-information. Environ. Process. 2015, 2, 61–78. [Google Scholar] [CrossRef] [Green Version]
  57. Wang, W.; Zhang, C.; Allen, J.M.; Li, W.; Boyer, M.A.; Segerson, K.; Silander, J.A. Analysis and prediction of land use changes related to invasive species and major driving forces in the state of Connecticut. Land 2016, 5, 25. [Google Scholar] [CrossRef] [Green Version]
  58. Mosammam, H.M.; Nia, J.T.; Khani, H.; Teymouri, A.; Kazemi, M. Monitoring land use change and measuring urban sprawl based on its spatial forms: The case of Qom city. Egypt J. Remote Sens. Sp. Sci. 2016, 20, 103–116. [Google Scholar] [CrossRef] [Green Version]
  59. Nadoushan, M.A.; Soffianian, A.; Alebrahim, A. Predicting urban expansion in arak metropolitan area using two land change models. World Appl. Sci. J. 2012, 18, 1124–1132. [Google Scholar]
  60. Viera, A.J.; Garrett, J.M. Understanding interobserver agreement: The kappa statistic. Fam. Med. 2005, 37, 360–363. [Google Scholar]
  61. Sitthi, A.; Nagai, M.; Dailey, M.; Ninsawat, S. Exploring land use and land cover of geotagged social-sensing images using Naive Bayes Classifier. Sustainability 2016, 8, 921. [Google Scholar] [CrossRef] [Green Version]
  62. Araya, Y.H.; Cabral, P. Analysis and modeling of urban land cover change in Setúbal and Sesimbra, Portugal. Remote Sens. 2010, 2, 1549–1563. [Google Scholar] [CrossRef] [Green Version]
  63. Rimal, B.; Keshtkar, H.; Haack, B. Land use/land cover dynamics and modeling of urban land expansion by the land use/land cover dynamics and modeling of urban land expansion by the integration of cellular automata and Markov chain. Int. J. Geo Inf. 2018, 7, 154. [Google Scholar] [CrossRef] [Green Version]
  64. Solomon, G.G.; Bewket, W.; Gärdenäs, A.I.; Bishop, K. Forest cover change over four decades in the Blue Nile Basin, Ethiopia: Comparison of three watersheds. Reg. Environ. Chang. 2014, 14, 253–266. [Google Scholar]
  65. Khoi, D.D.; Murayama, Y. Forecasting areas vulnerable to forest conversion in the tam Dao National Park region, Vietnam. Remote Sens. 2010, 2, 1249–1272. [Google Scholar] [CrossRef] [Green Version]
  66. Maguire, D.J.; Batty, M.; Goodchild, M.F. GIS, Spatial Analysis, and Modeling, 1st ed.; ESRI Press: Redlands, CA, USA, 2005. [Google Scholar]
  67. Pontius, G.R.; Malanson, J. Comparison of the structure and accuracy of two land change models. Int. J. Geogr. Inf. Sci. 2005, 19, 243–265. [Google Scholar] [CrossRef]
  68. Han, H.; Yang, C.; Song, J. Scenario simulation and the prediction of land use and land cover change in Beijing, China. Sustainability 2015, 7, 4260–4279. [Google Scholar] [CrossRef] [Green Version]
  69. Hepinstall, J.A.; Alberti, M.; Marzluff, J.M. Predicting land cover change and avian community responses in rapidly urbanizing environments. Landsc. Ecol. 2008, 23, 1257–1276. [Google Scholar] [CrossRef]
  70. Cheruto, M.; Kauti, M.; Kisangau, P.; Kariuki, P. Assessment of land use and land cover change using GIS and remote sensing. J. Remote Sens. GIS 2016, 5, 1–6. Available online: https://www.omicsonline.org/open-access/assessment-of-land-use-and-land-cover-change-using-gis-and-remotesensing-techniques-a-case-study-of-makueni-county-kenya-2469-4134-1000175.pdf (accessed on 2 January 2017). [CrossRef]
  71. Kosal, C.; Tunnicliffe, J.; Asaad, S.; Ota, T. Land use change detection and prediction in upper Siem Reap River, Cambodia. Hydrology 2019, 6, 64. [Google Scholar]
  72. Lennert, J.; Farkas, J.Z.; Kovács, A.D.; Molnár, A.; Módos, R.; Baka, D.; Kovács, Z. Measuring and predicting long-term land cover changes in the functional urban area of Budapest. Sustainability 2020, 12, 3331. [Google Scholar] [CrossRef] [Green Version]
  73. Oromia Forest and Wildlife Enterprise (OFWE), Farm Africa and SOS Sahel Ethiopia. Bale Mountains Eco-Region Reduction of Emission from Deforestation and Forest Degradation (REDD+) Project-Ethiopia. Available online: https://s3.amazonaws.com/CCBA/Projects/Bale_Mountains_Eco-region_Reductions_of_Emissions_from_Deforestation_and_Forest_Degradation_Project/Bale+Mtns+REDD%2B+VCS%2BCCB+Project+Description+version+3.0.pdf (accessed on 2 January 2015).
Figure 1. Map of the study area.
Sustainability 13 03740 g001
Figure 2. The LULC of the Nashe watershed in 1990, 2005, and 2019.
Sustainability 13 03740 g002
Figure 3. Gain and loss area of the land use land cover class in 1990–2005 and 2005–2019.
Sustainability 13 03740 g003
Figure 4. Net change and net persistence area of LULC class of the study periods.
Sustainability 13 03740 g004
Figure 5. The predicted 2035 and 2050 LULC of the watershed.
Sustainability 13 03740 g005
Figure 6. Land use land cover change in 1990–2050.
Sustainability 13 03740 g006
Figure 7. The gain, loss, and net change of the projected LULC area (2019, 2035, and 2050).
Sustainability 13 03740 g007
Figure 8. Historical and predicted land use land cover change area coverage.
Sustainability 13 03740 g008
Table 1. Details of Landsat images data used for the analysis of land use and land cover (LULC) in the study area.
Satellite SensorPath/RowAcquisition DateUser BandsSpatial ResolutionYear
Landsat 5 TM169/053January 19901–5, 730 m1990
170/053
Landsat 7 ETM+169/053January 20051–5, 7, and 830 m, 15 m2005
170/053
Landsat 8 OIL169/053January 20191–7, 9, and 830 m, 15 m2019
170/053
Table 2. Major land use land cover types used and their descriptions.
LULC TypesDescription
Agricultural LandIncludes areas used for perennial and annual crops, irrigated areas, scattered rural settlements, commercial farms (sesame cultivations and sugarcane plantations).
Forest Land Areas covered with dense trees (deciduous forests, evergreen forests, mixed forests).
Range LandIncludes areas covered with small trees, less dense forests, bushes, and shrubs. These areas are less dense than forests.
Grass LandAreas covered by grasses are usually used for grazing and those remain for some months in a year.
Urban AreaAreas of commercial areas, urban and rural settlements, industrial areas.
Water BodyAreas covered by rivers, streams, and reservoirs
Table 3. Possible ranges of map comparison and level of agreement of kappa values [60].
No.ValuesStrength of Agreement
1<0Poor
20.01–0.40Slight
30.41–0.60Moderate
40.61–0.80Substantial
50.81–1.00Almost Perfect
Table 4. Accuracy assessment of classified LULC maps for 1990, 2005, and 2019.
LULC TypesAgricultural LandForest LandRange LandGrass LandUrban LandWater BodyUA (%)
1990Agricultural Land860350190.53
Forest Land078601091.76
Range Land146730089.33
Grass Land430565280.00
Urban Land044250083.33
Water Body000405192.73
PA (%)94.5187.6483.7580.0089.2994.44
K = 85.71%; OA = 0.88
LULC TypesAgricultural LandForest LandRange LandGrass LandUrban LandWater BodyUA (%)
2005Agricultural Land892441089.00
Forest Land081432090.00
Range Land347201090.00
Grass Land501541483.08
Urban Land010252094.55
Water Body100204794.00
PA (%)90.8292.0588.8983.0891.2392.16
K = 87.59%; OA = 0.90
LULC typesAgricultural LandForest LandRange LandGrass LandUrban LandWater BodyUA (%)
2019Agricultural Land1000131095.24
Forest Land284400093.33
Range Land146320090.00
Grass Land214570187.69
Urban Land001257095.00
Water Body000204896.00
PA (%)95.2494.3886.3086.3698.2897.96
K = 91.43%; OA = 0.93
UA: User’s Accuracy, PA: Producer’s Accuracy, K: Kappa Statistics, OA: Overall Accuracy.
Table 5. The area coverage of LULC, percent, and rate of changes in the Nashe watershed between 1990, 2005, and 2019.
LULC TypesAreaChange
1990200520191990–20052005–20191990–2019
Ha%Ha%Ha%Ha%Rate of Change (ha/Year)Ha%Rate of Change (ha/Year)Ha%Rate of Change (ha/Year)
Agricultural Land41,587.244.047,658.550.457,869.061.26071.314.6404.810,210.521.4680.716,281.739.2561.4
Forest Land31,033.932.826,579.328.116,019.116.9−4454.6−14.4−297.0−10,560.2−39.7−704.0−15,014.8−48.4−517.8
Grass Land9443.410.07964.78.46966.07.4−1478.8−15.7−98.6−998.6−12.5−66.6−2477.4−26.2−85.4
Range Land10,637.811.39835.510.48555.09.1−802.4−7.5−53.5−1280.5−13.0−85.4−2082.9−19.6−71.8
Urban Land471.10.5882.60.91084.01.2411.587.327.4201.422.813.4612.9130.121.1
Water Body1404.61.51657.61.84085.04.3253.018.016.92427.4146.4161.82680.4190.892.4
Total94,57810094,57810094,578100
The percentage and rate of change were calculated using Equations (5) and (6), respectively.
Table 6. Cramer’s V and p-value for each of the explanatory variables.
Driver VariablesCramer’s Vp-Value
Elevation0.29670.0000
Slope0.00940.0000
Distance_from_Urban 0.15470.0000
Distance_from_stream 0.21580.0000
Distance_from_road0.13910.0000
Evidence Likelihood0.44720.0000
Table 7. Transition area matrix (ha) of LULC between 1990–2005 and 2005–2019.
LULC Types2005
Agricultural LandForest LandGrass LandRange LandUrban LandWater BodyTotal
1990Agricultural Land39,662.13302.16179.911121.71321.250.0641,587.21
Forest Land5214.8218,856.81292.806429.9859.35180.1231,033.88
Grass Land2001.18617.606419.75372.3332.420.129443.40
Range Land778.376783.151072.001911.170.7492.3910,637.83
Urban Land1.980.130.180.00468.790.01471.10
Water Body0.0119.440.000.280.001384.911404.64
Total47,658.4926,579.307964.659835.47882.551657.6094,578.05
LULC Types2019
Agricultural LandForest LandGrass LandRange LandUrban LandWater BodyTotal
2005Agricultural Land35,763.834299.681181.794196.23349.901867.0647,658.48
Forest Land12,051.9610,869.351360.031708.26167.12422.5726,579.30
Grass Land4673.21913.15802.001317.9420.25238.117964.65
Range Land5021.163101.81212.671314.3651.83133.649835.47
Urban Land337.8214.099.2815.25494.7511.37882.55
Water Body20.97221.040.262.920.131412.281657.60
Total57,868.9516,019.136966.018554.951083.984085.0394,578.05
Table 8. LULC change prediction validation based on the actual and projected 2019 LULC.
LULC CategoryProjectedActual
Area (Ha)Area (%)Area (Ha)Area (%)
Agricultural Land54,161.9057.2757,868.9561.19
Forest Land20,384.7521.5516,019.1316.94
Range Land9388.679.936966.017.37
Grass Land8288.788.768554.959.05
Urban Land608.900.641083.981.15
Water Body1745.061.854085.034.32
Total94,578.05100.0094,578.05100.00
Table 9. The k-index values of the simulated LULC map of 2019.
Index.Value
Kno0.9026
Klocation0.9213
KlocationStrata0.8836
Kstandard0.8743
Table 10. The validation result analysis (agreement/disagreement component values).
Agreement/DisagreementValueValue (%)
Agreement Chance0.162916.29
Agreement Quantity0.333533.35
Agreement GridCell0.425442.54
Disagreement GridCell0.02692.69
Disagreement Quantity0.05135.13
Table 11. The area coverage of LULC, percent, and rate of changes in the Nashe watershed between 2019, 2035, and 2050.
LULC TypesAreaChange
2019203520502019–20352035–20502019–2050
Ha%Ha%Ha%Ha%Ha%Ha%
Agricultural Land57,869.061.269,021.273.069,264.473.211,152.319.3243.20.411,395.520.0
Forest Land16,019.116.911,759.012.47636.18.1−4260.1−26.6−4123.0−35.1−8383.1−52.3
Grass Land6966.07.42336.82.52392.72.5−4629.2−66.555.92.4−4573.4−65.7
Range Land8555.09.14929.35.26749.87.1−3625.7−42.41820.536.9−1805.2−21.1
Urban Land1084.01.21893.52.03612.93.8809.674.71719.390.82528.9233.3
Water Body4085.04.34638.24.94922.35.2553.213.5284.16.1837.320.5
Total94,57810094,57810094,578100
Table 12. Transition area matrix (ha) of LULC between 2019–2035 and 2035–2050.
LULC Types2035
Agricultural LandForest LandGrass LandRange LandUrban LandWater BodyTotal
2019Agricultural Land44,533.176988.3977.183731.99385.732152.5057,868.95
Forest Land11,991.322864.52508.76337.33122.17195.0316,019.13
Grass Land1897.14650.993593.18648.9526.04149.716966.01
Range Land3745.424286.3060.93371.3713.3077.648554.95
Urban Land319.9727.642.3121.40702.6310.041083.98
Water Body86.07166.480.250.110.003832.134085.03
Total69,021.2011,759.002336.804929.301893.534638.2194,578.05
LULC Types2050
Agricultural LandForest LandGrass LandRange LandUrban LandWater BodyTotal
2035Agricultural Land60,912.114365.9327.74515.433200.000.0069,021.20
Forest Land8798.272959.710.001.030.000.0011,759.00
Grass Land0.571.072335.160.000.000.002336.80
Range Land245.57309.400.003774.330.00600.004929.30
Urban Land1200.000.000.000.00693.530.001893.53
Water Body0.000.000.000.000.004638.214638.21
Total69,264.447636.052392.656749.773612.854922.2994,578.05
Publisher’s Note: MDPI stays neutral with regard to jurisdictional claims in published maps and institutional affiliations.

