
Nitrogen Migration during Pyrolysis of Raw and Acid Leached Maize Straw

 , , and
Abstract
:1. Introduction
2. Materials and Methods
2.1. Materials and Pretreatment Process
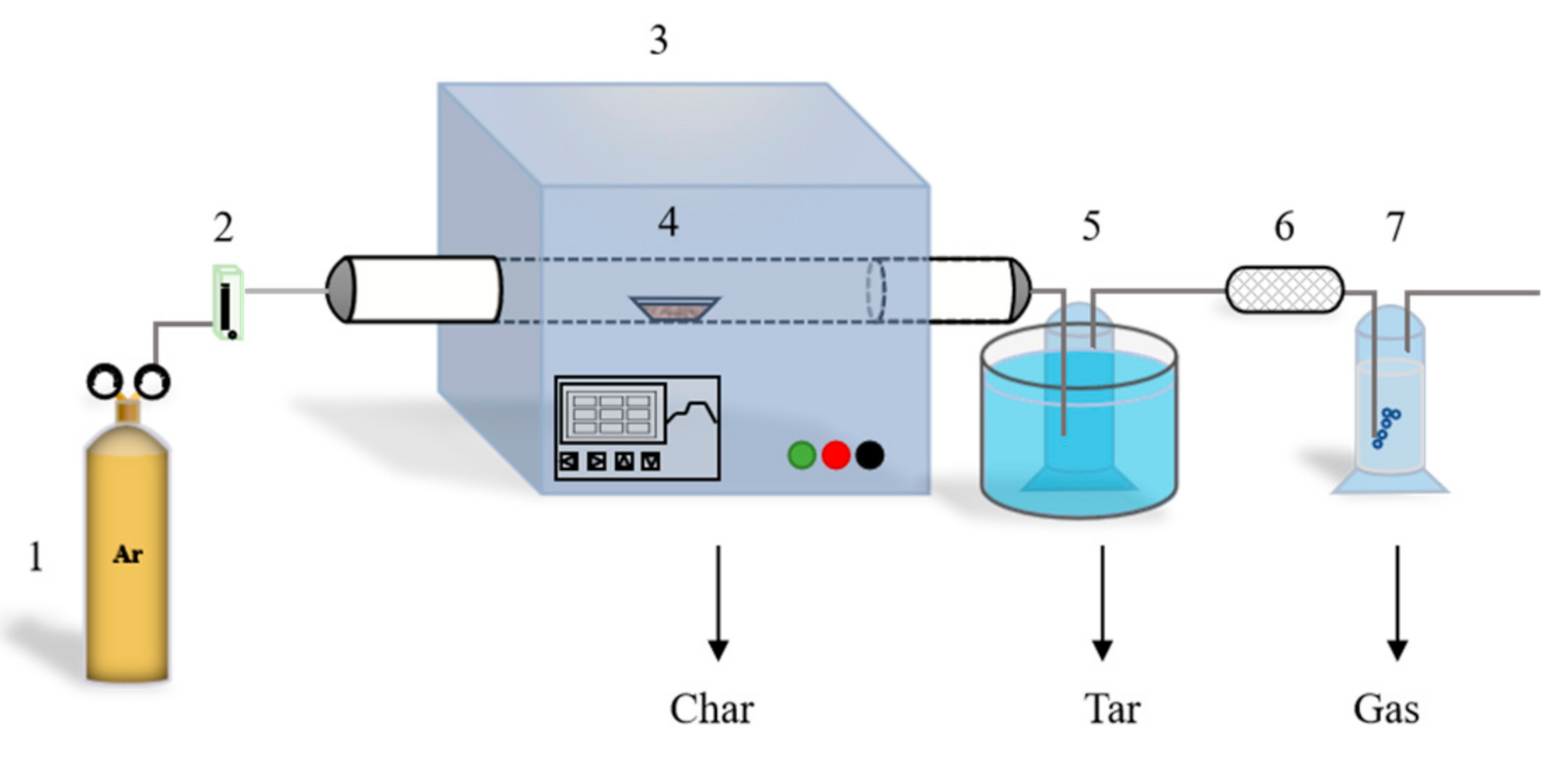
2.2. Pyrolysis System and Experimental Procedure
2.3. TG Analysis
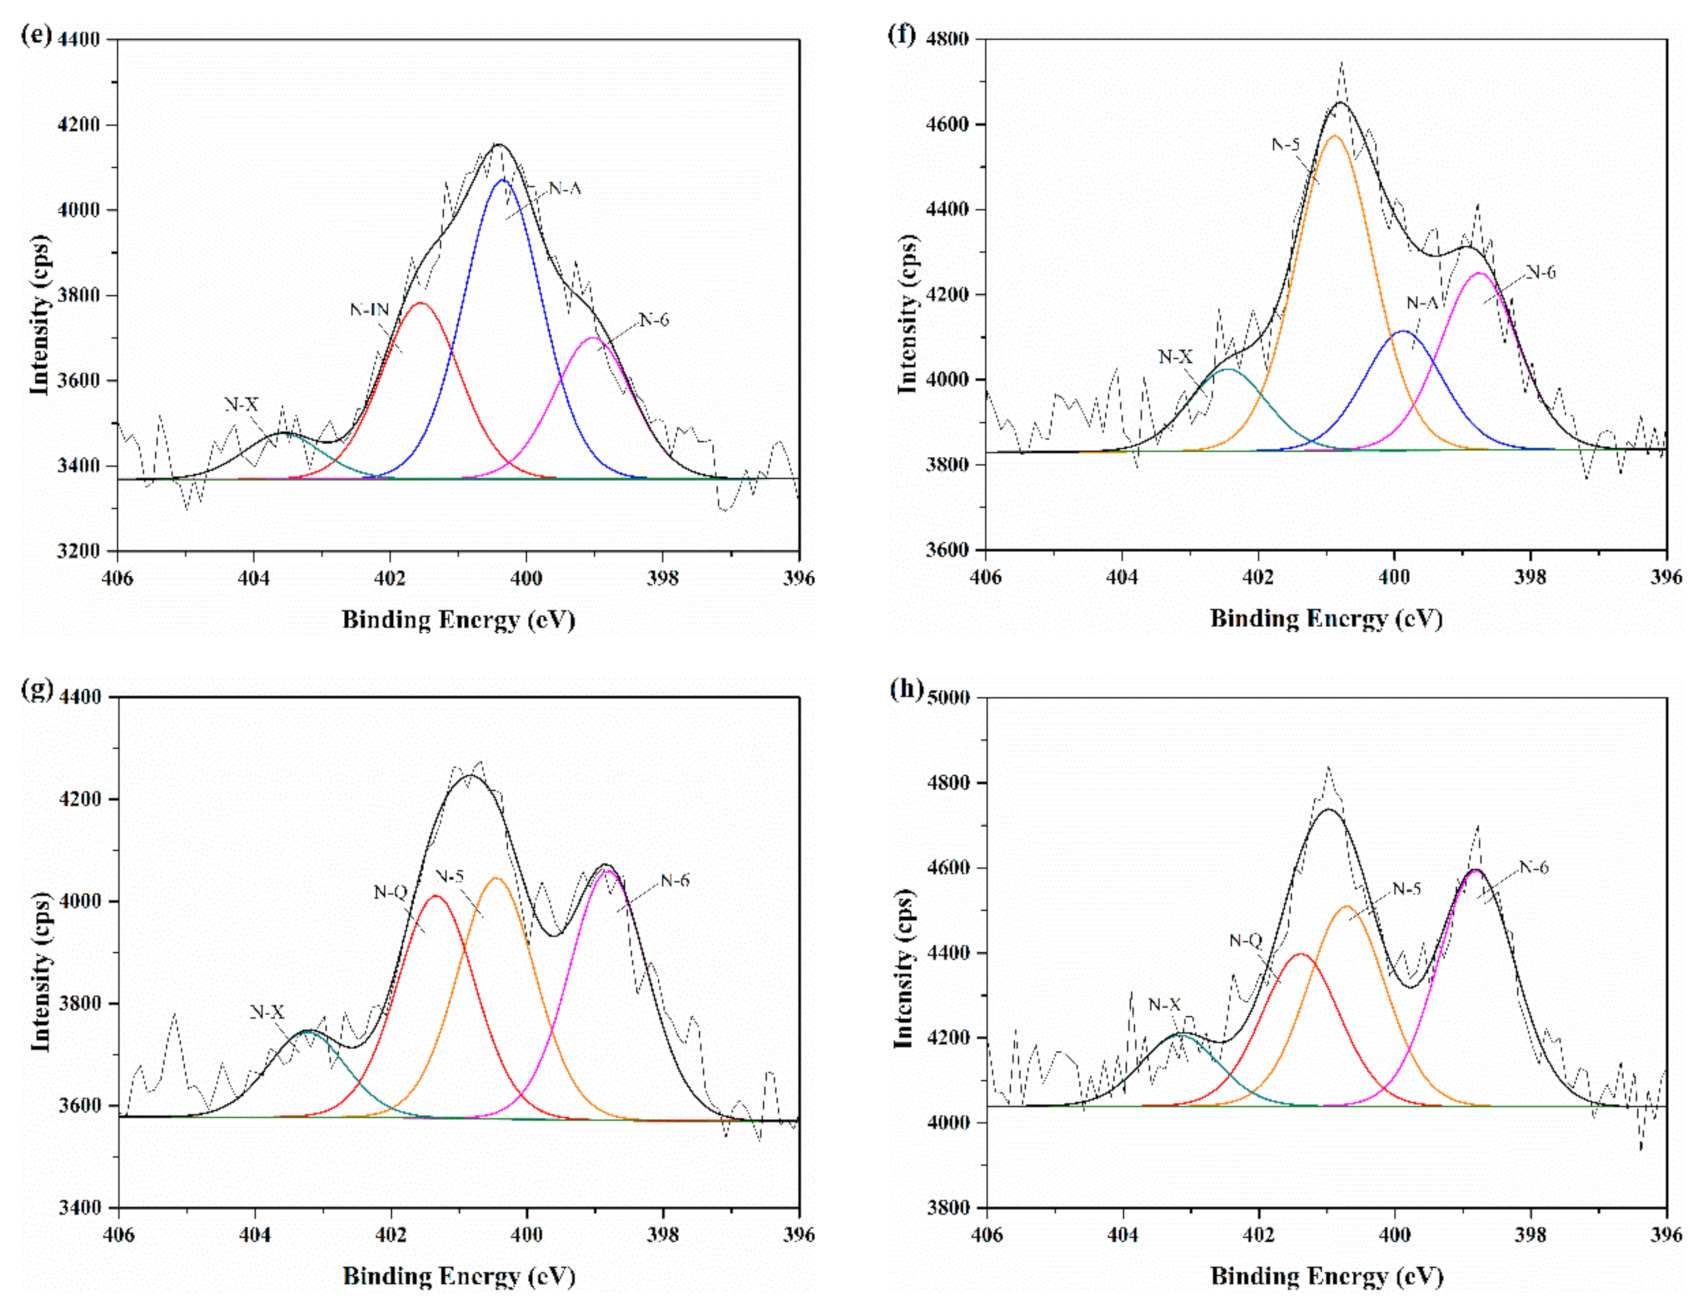
2.4. XPS Analysis
2.5. Scanning Electron Microscopy (SEM)
2.6. Calculations
3. Results and Discussion
3.1. Characteristics of Raw/Acid Leached Maize Straw
3.2. Distribution of Pyrolysis Products
3.3. Distribution of Gaseous NOx Precursors
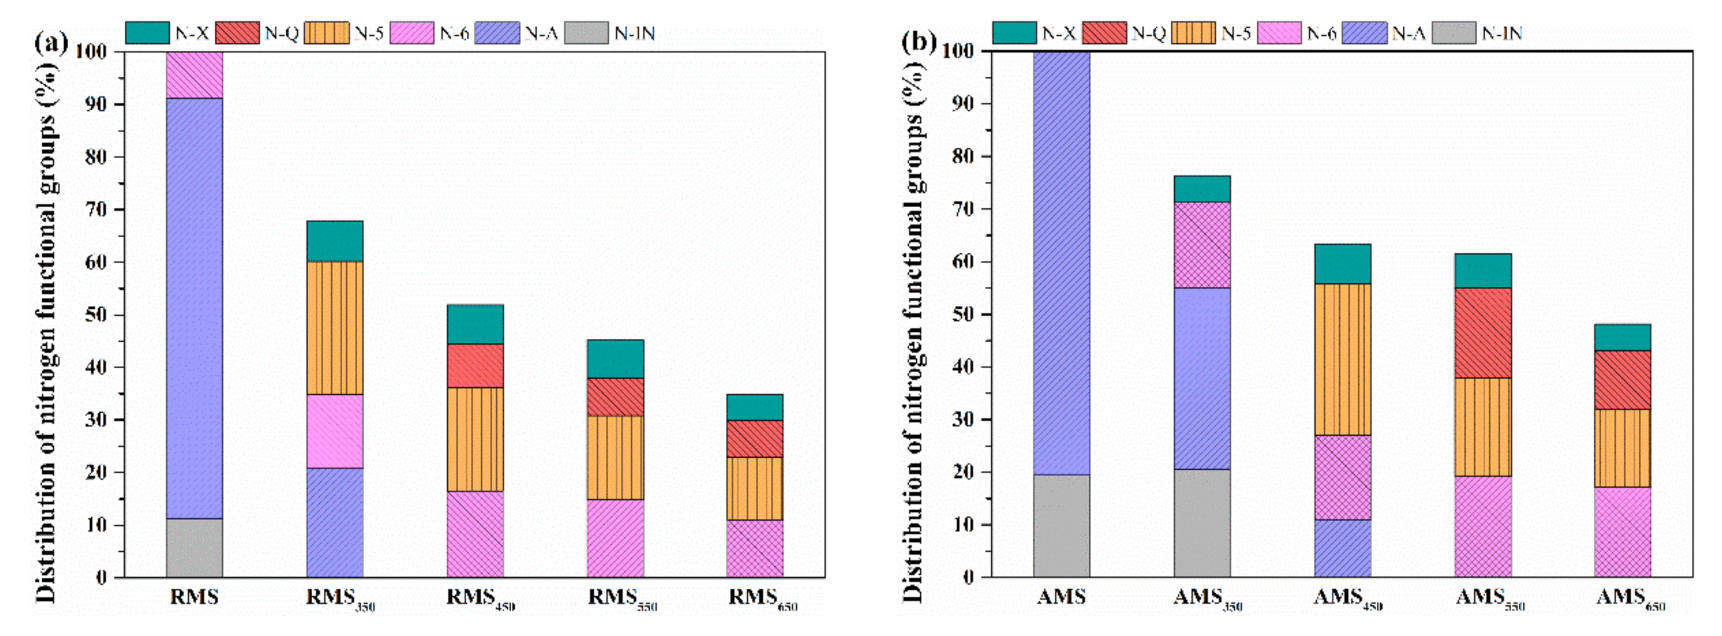
3.4. Nitrogen Migration in Char-N during Biomass Pyrolysis
3.5. Nitrogen Distribution in Pyrolysis Products of Raw and Acid-Leached Maize Straw
4. Conclusions
Author Contributions
Funding
Institutional Review Board Statement
Informed Consent Statement
Data Availability Statement
Acknowledgments
Conflicts of Interest
References
- Zhou, Y.; Zhang, Z.; Zhang, Y.; Wang, Y.; Yu, Y.; Ji, F.; Ahmad, R.; Dong, R. A comprehensive review on densified solid biofuel industry in China. Renew. Sustain. Energy Rev. 2016, 54, 1412–1428. [Google Scholar] [CrossRef]
- Houshfar, E.; Skreiberg, Ø.; Todorović, D.; Skreiberg, A.; Løvås, T.; Jovović, A.; Sørum, L. NOx emission reduction by staged combustion in grate combustion of biomass fuels and fuel mixtures. Fuel 2012, 98, 29–40. [Google Scholar] [CrossRef]
- EPA. Nitrogen Oxides (NOx), Why and How They Are Controlled. 1999. Available online: https://www3.epa.gov/ttncatc1/dir1/fnoxdoc.pdf (accessed on 26 March 2021).
- He, F.; Li, Y.; Dou, S.; Yi, W. Design and Experiments on Residential Heating Furnace with Biomass Smoldering. Nongye Jixie Xuebao/Trans. Chin. Soc. Agric. Mach. 2006, 37, 75–78. [Google Scholar]
- Susastriawan, A.A.P.; Badrawada, I.G.G.; Budi, D.P. An effect of primary air draft and flow rate on thermal perfor-mance and CO/CO2 emission of the domestic stove fed with the briquette of coconut shell. Biomass Convers. Biorefin. 2020, 10, 1099–1104. [Google Scholar] [CrossRef]
- Ren, Q.; Zhao, C. NOx and N2O precursors (NH3 and HCN) from biomass pyrolysis: Interaction between amino acid and mineral matter. Appl. Energy 2013, 112, 170–174. [Google Scholar] [CrossRef]
- Shah, I.A.; Gou, X.; Zhang, Q.; Wu, J.; Wang, E.; Liu, Y. Experimental study on NOx emission characteristics of oxy-biomass combustion. J. Clean. Prod. 2018, 199, 400–410. [Google Scholar] [CrossRef]
- Tian, F.; Li, B.; Chen, Y.; Li, C. Formation of NOx precursors during the pyrolysis of coal and biomass. Part V. Pyrolysis of a sewage sludge. Fuel 2002, 81, 2203–2208. [Google Scholar] [CrossRef]
- Ren, Q. NOx and N2O precursors from biomass pyrolysis. J. Anal. Calorim. 2014, 115, 881–885. [Google Scholar] [CrossRef]
- Wang, Y.; Dong, B.; Fan, Y.; Hu, Y.; Zhai, X.; Deng, C.; Xu, Y.; Shen, D.; Dai, X. Nitrogen transformation during pyrolysis of oilfield sludge with high polymer content. Chemosphere 2019, 219, 383–389. [Google Scholar] [CrossRef] [PubMed]
- Zaker, A.; Chen, Z.; Wang, X.; Zhang, Q. Microwave-assisted pyrolysis of sewage sludge: A review. Fuel Process. Technol. 2019, 187, 84–104. [Google Scholar] [CrossRef]
- Tian, Y.; Zhang, J.; Zuo, W.; Chen, L.; Cui, Y.; Tan, T. Nitrogen conversion in relation to NH3 and HCN during microwave pyrolysis of sewage sludge. Environ. Sci. Technol. 2013, 47, 3498–3505. [Google Scholar] [CrossRef]
- Becidan, M.; Skreiberg, Ø.; Hustad, J.E. NOx and N2O precursors (NH3 and HCN) in pyrolysis of biomass residues. Energy Fuel 2007, 21, 1173–1180. [Google Scholar] [CrossRef]
- Hansson, K.; Samuelsson, J.; Tullin, C.; Åmand, L. Formation of HNCO, HCN, and NH3 from the pyrolysis of bark and nitrogen-containing model compounds. Combust. Flame 2004, 137, 265–277. [Google Scholar] [CrossRef] [Green Version]
- Cheng, L.; Ma, F.; Ranwala, D. Nitrogen storage and its interaction with carbohydrates of young apple trees in response to nitrogen supply. Tree Physiol. 2004, 24, 91–98. [Google Scholar] [CrossRef] [Green Version]
- Ren, Q.; Zhao, C. Evolution of fuel-N in gas phase during biomass pyrolysis. Renew. Sustain. Energy Rev. 2015, 50, 408–418. [Google Scholar] [CrossRef]
- Sher, F.; Pans, M.A.; Afilaka, D.T.; Sun, C.; Liu, H. Experimental investigation of woody and non-woody biomass combustion in a bubbling fluidised bed combustor focusing on gaseous emissions and temperature profiles. Energy 2017, 141, 2069–2080. [Google Scholar] [CrossRef]
- Cheng, S.; Qiao, Y.; Huang, J.; Wang, W.; Wang, Z.; Yu, Y.; Xu, M. Effects of Ca and Na acetates on nitrogen transformation during sewage sludge pyrolysis. Proc. Combust. Inst. 2019, 37, 2715–2722. [Google Scholar] [CrossRef]
- Ren, Q.; Zhao, C.; Wu, X.; Liang, C.; Chen, X.; Shen, J.; Tang, G.; Wang, Z. Effect of mineral matter on the formation of NOx precursors during biomass pyrolysis. J. Anal. Appl. Pyrol. 2009, 85, 447–453. [Google Scholar] [CrossRef]
- Dong, Q.; Zhang, S.; Zhang, L.; Ding, K.; Xiong, Y. Effects of four types of dilute acid washing on moso bamboo pyrolysis using Py–GC/MS. Bioresour. Technol. 2015, 185, 62–69. [Google Scholar] [CrossRef]
- Long, J.; Song, H.; Jun, X.; Sheng, S.; Lun-shi, S.; Kai, X.; Yao, Y. Release characteristics of alkali and alkaline earth metallic species during biomass pyrolysis and steam gasification process. Bioresour. Technol. 2012, 116, 278–284. [Google Scholar] [CrossRef]
- Wigley, T.; Yip, A.C.K.; Pang, S. Pretreating biomass via demineralisation and torrefaction to improve the quality of crude pyrolysis oil. Energy 2016, 109, 481–494. [Google Scholar] [CrossRef]
- Zareihassangheshlaghi, A.; Beidaghy Dizaji, H.; Zeng, T.; Huth, P.; Ruf, T.; Denecke, R.; Enke, D. Behavior of metal impurities on surface and bulk of biogenic silica from rice husk combustion and the impact on ash-melting tendency. ACS Sustain. Chem. Eng. 2020, 8, 10369–10379. [Google Scholar] [CrossRef]
- Oudenhoven, S.R.G.; Westerhof, R.J.M.; Kersten, S.R.A. Fast pyrolysis of organic acid leached wood, straw, hay and bagasse: Improved oil and sugar yields. J. Anal. Appl. Pyrol. 2015, 116, 253–262. [Google Scholar] [CrossRef]
- AQSIQ. Proximate Analysis of Solid Biofuels, GB/T 28731-2012; General Administration of Quality Supervision, Inspection and Quarantine of the People’s Republic of China: Beijing, China, 2012. [Google Scholar]
- Zhao, N.; Li, B.; Chen, D.; Bahargul, T.; Wang, R.; Zhou, Y.; Annegarn, H.J.; Pemberton-Pigott, C.; Dong, R.; Ju, X. The effect of coal size on PM2.5 and PM-bound polycyclic aromatic hydrocarbon (PAH) emissions from a domestic natural cross-draft stove. J. Energy Inst. 2019, 93, 542–551. [Google Scholar] [CrossRef]
- Li, Q.; Zhao, Y.; Chen, H.; Hou, P.; Cheng, X. Effect of cornstalk ash on the microstructure of cement-based material under sulfate attack. IOP conference series. Earth Environ. Sci. 2019, 358, 52010. [Google Scholar]
- Guo, J.; Cui, X.; Sun, H.; Zhao, Q.; Wen, X.; Pang, C.; Dong, R. Effect of glucose and cellulase addition on wet-storage of excessively wilted maize stover and biogas production. Bioresour. Technol. 2018, 259, 198–206. [Google Scholar] [CrossRef]
- Zhan, H.; Yin, X.; Huang, Y.; Yuan, H.; Wu, C. NOx precursors evolving during rapid pyrolysis of lignocellulosic industrial biomass wastes. Fuel 2017, 207, 438–448. [Google Scholar] [CrossRef]
- Nefedov, V.I.; Salyn, Y.V.; Leonhardt, G.; Scheibe, R. A comparison of different spectrometers and charge corrections used in X-ray photoelectron spectroscopy. J. Electron. Spectrosc. 1977, 10, 121–124. [Google Scholar] [CrossRef]
- Nesbitt, H.W.; Bancroft, G.M.; Tse, J.S.; Gao, X.; Skinner, W.; Zakaznova-Herzog, V.P. High-resolution valence-band XPS spectra of the nonconductors quartz and olivine. Phys. Rev. B. 2005, 72, 205113. [Google Scholar]
- Sawyer, R.; Nesbitt, H.W.; Secco, R.A. High resolution X-ray Photoelectron Spectroscopy (XPS) study of K2O–SiO2 glasses: Evidence for three types of O and at least two types of Si. J. Non Cryst. Solids 2012, 358, 290–302. [Google Scholar] [CrossRef]
- Stoch, J.; Ladecka, M. An XPS study of the KCl surface oxidation in oxygen glow discharge. Appl. Surf. Sci. 1988, 31, 426–436. [Google Scholar] [CrossRef]
- Gao, P.; Guo, D.; Liang, C.; Liu, G.; Yang, S. Nitrogen conversion during the rapid pyrolysis of raw/torrefied wheat straw. Fuel 2020, 259, 116227. [Google Scholar] [CrossRef]
- Wei, L.; Wen, L.; Yang, T.; Zhang, N. Nitrogen transformation during sewage sludge pyrolysis. Energy Fuel 2015, 29, 5088–5094. [Google Scholar] [CrossRef]
- Zhan, H.; Zhuang, X.; Song, Y.; Yin, X.; Wu, C. Insights into the evolution of fuel-N to NOx precursors during pyrolysis of N-rich nonlignocellulosic biomass. Appl. Energy 2018, 219, 20–33. [Google Scholar] [CrossRef]
- MOEP. Water Quality-Determination of Cyanide Volumetric and Spectrophotometry, HJ 484-2009; Ministry of Environmental Protection of the People’s Republic of China: Beijing, China, 2009.
- MOEP. Water Quality-Determination of Ammonia Nitrogen-Nessler’s Reagent Spectrophotometry, HJ 535-2009; Ministry of Environmental Protection of the People’s Republic of China: Beijing, China, 2009.
- Deng, S.; Wang, X.; Tan, H.; Mikulčić, H.; Yang, F.; Li, Z.; Duić, N. Thermogravimetric study on the co-combustion characteristics of oily sludge with plant biomass. Thermochim. Acta 2016, 633, 69–76. [Google Scholar] [CrossRef]
- Huang, J.; Liu, J.; Chen, J.; Xie, W.; Kuo, J.; Lu, X.; Chang, K.; Wen, S.; Sun, G.; Cai, H.; et al. Combustion behaviors of spent mushroom substrate using TG-MS and TG-FTIR: Thermal conversion, kinetic, thermodynamic and emission analyses. Bioresour. Technol. 2018, 266, 389–397. [Google Scholar] [CrossRef] [PubMed]
- Wang, T.; Peng, L.; Ai, Y.; Zhang, R.; Lu, Q. Pyrolytic behaviors of decocting residues of Rhodiola rosea. J. Anal. Appl. Pyrol. 2018, 129, 61–65. [Google Scholar] [CrossRef]
- Eom, I.; Kim, K.; Kim, J.; Lee, S.; Yeo, H.; Choi, I.; Choi, J. Characterization of primary thermal degradation features of lignocellulosic biomass after removal of inorganic metals by diverse solvents. Bioresour. Technol. 2011, 102, 3437–3444. [Google Scholar] [CrossRef]
- Zhang, S.; Zhang, H.; Su, Y.; Xu, D.; Zhu, S.; Liu, X. Effects of torrefaction and organic-acid leaching pretreatment on the pyrolysis behavior of rice husk. Energy 2018, 149, 804–813. [Google Scholar] [CrossRef]
- Meng, A.; Zhou, H.; Qin, L.; Zhang, Y.; Li, Q. Quantitative and kinetic TG-FTIR investigation on three kinds of biomass pyrolysis. J. Anal. Appl. Pyrol. 2013, 104, 28–37. [Google Scholar] [CrossRef]
- Yang, C.; Lu, X.; Lin, W.; Yang, X.; Yao, J. TG-FTIR Study on Corn Straw Pyrolysis-influence of Minerals. Chem. Res. Chin. Univ. 2006, 22, 524–532. [Google Scholar] [CrossRef]
- Yuan, S.; Tan, Z.; Huang, Q. Migration and transformation mechanism of nitrogen in the biomass-biochar-plant transport process. Renew. Sustain. Energy Rev. 2018, 85, 1–13. [Google Scholar] [CrossRef]
- Ma, D.; Zhang, G.; Areeprasert, C.; Li, C.; Shen, Y.; Yoshikawa, K.; Xu, G. Characterization of NO emission in combustion of hydrothermally treated antibiotic mycelial residue. Chem. Eng. J. 2016, 284, 708–715. [Google Scholar] [CrossRef] [Green Version]
- Yuan, S.; Zhou, Z.; Li, J.; Wang, F. Nitrogen conversion during rapid pyrolysis of coal and petroleum coke in a high-frequency furnace. Appl. Energy 2012, 92, 854–859. [Google Scholar] [CrossRef]
- Zhan, H.; Zhuang, X.; Song, Y.; Huang, Y.; Liu, H.; Yin, X.; Wu, C. Evolution of nitrogen functionalities in relation to NO precursors during low-temperature pyrolysis of biowastes. Fuel 2018, 218, 325–334. [Google Scholar] [CrossRef]
- Wang, T.; Dong, X.; Jin, Z.; Su, W.; Ye, X.; Dong, C.; Lu, Q. Pyrolytic characteristics of sweet potato vine. Bioresour. Technol. 2015, 192, 799–801. [Google Scholar] [CrossRef]
- Chang, L.; Zhao, Y.; Xie, K. Effect of inherent minerals on the release of fuel-nitrogen during coal pyrolysis. Energy Sources 2005, 27, 1019–1027. [Google Scholar] [CrossRef]
- Choi, S.; Ko, J. Analysis of cyclic pyrolysis products formed from amino acid monomer. J. Chromatogr. A 2011, 1218, 8443–8455. [Google Scholar] [CrossRef]
- Zhan, H.; Zhuang, X.; Song, Y.; Yin, X.; Cao, J.; Shen, Z.; Wu, C. Step pyrolysis of N-rich industrial biowastes: Regulatory mechanism of NO precursor formation via exploring decisive reaction pathways. Chem. Eng. J. 2018, 344, 320–331. [Google Scholar] [CrossRef]
- Zhang, J.; Tian, Y.; Cui, Y.; Zuo, W.; Tan, T. Key intermediates in nitrogen transformation during microwave pyrolysis of sewage sludge: A protein model compound study. Bioresour. Technol. 2013, 132, 57–63. [Google Scholar] [CrossRef]
- Li, C.; Tan, L.L. Formation of NOx and SOx precursors during the pyrolysis of coal and biomass. Part III. Further discussion on the formation of HCN and NH3 during pyrolysis. Fuel 2000, 79, 1899–1906. [Google Scholar] [CrossRef]
- Kambara, S.; Takarada, T.; Yamamoto, Y.; Kato, K. Relation between functional forms of coal nitrogen and formation of nitrogen oxide (NOx) precursors during rapid pyrolysis. Energy Fuel 1993, 7, 1013–1020. [Google Scholar] [CrossRef]
- Liu, H.; Yi, L.; Hu, H.; Xu, K.; Zhang, Q.; Lu, G.; Yao, H. Emission control of NOx precursors during sewage sludge pyrolysis using an integrated pretreatment of Fenton peroxidation and CaO conditioning. Fuel 2017, 195, 208–216. [Google Scholar] [CrossRef]
- Li, Y.; Hong, C.; Wang, Y.; Xing, Y.; Chang, X.; Zheng, Z.; Li, Z.; Zhao, X. Nitrogen migration mechanism during pyrolysis of penicillin fermentation residue based on product characteristics and quantum chemical analysis. ACS Sustain. Chem. Eng. 2020, 8, 7721–7740. [Google Scholar] [CrossRef]


| Characteristic | Biomass Sample | Removal Ratio % | ||
|---|---|---|---|---|
| RMS | AMS | |||
| Ultimate analysis wt%, dry basis | C | 41.83 | 44.69 | |
| H | 5.08 | 6.18 | ||
| S | 0.58 | 0.68 | ||
| N | 1.39 | 1.13 | ||
| O 1 | 51.13 | 47.33 | ||
| Proximate analysis wt%, dry basis | Volatile matter | 68.68 | 75.70 | |
| Fixed carbon | 16.94 | 13.01 | ||
| Ash | 12.69 | 8.67 | ||
| Composition% | Hemicellulose | 31.11 | 36.49 | |
| Cellulose | 29.03 | 34.47 | ||
| Lignin | 3.72 | 3.62 | ||
| Inorganic elements 2 mg/kg | K | 21,245.4 | 92.1 | 99.57 |
| Na | 1474.9 | 61.5 | 95.83 | |
| Mg | 2171.9 | 91.7 | 95.78 | |
| P | 2254.1 | 364.4 | 83.84 | |
| Fe | 379.1 | 203.3 | 46.38 | |
| Ca | 3979.7 | 2444.4 | 38.58 | |
| Sample | C | H | S | O 1 | N |
|---|---|---|---|---|---|
| RMS350 | 53.47 ± 0.19 | 3.71 ± 0.03 | 0.18 ± 0.03 | 40.70 ± 0.28 | 1.94 ± 0.04 |
| RMS450 | 54.56 ± 0.06 | 3.16 ± 0.04 | 0.29 ± 0.03 | 40.18 ± 0.18 | 1.82 ± 0.04 |
| RMS550 | 56.32 ± 0.16 | 2.45 ± 0.05 | 0.35 ± 0.04 | 39.19 ± 0.30 | 1.69 ± 0.04 |
| RMS650 | 57.92 ± 0.16 | 1.75 ± 0.03 | 0.29 ± 0.04 | 38.63 ± 0.28 | 1.41 ± 0.04 |
| AMS350 | 58.56 ± 0.16 | 4.40 ± 0.03 | 0.65 ± 0.06 | 34.49 ± 0.29 | 1.91 ± 0.04 |
| AMS450 | 61.42 ± 0.14 | 3.87 ± 0.04 | 0.93 ± 0.04 | 31.78 ± 0.27 | 2.01 ± 0.04 |
| AMS550 | 63.93 ± 0.20 | 2.98 ± 0.08 | 0.64 ± 0.06 | 30.37 ± 0.38 | 2.09 ± 0.04 |
| AMS650 | 65.52 ± 0.20 | 2.36 ± 0.04 | 0.53 ± 0.05 | 29.83 ± 0.35 | 1.77 ± 0.06 |
| Sample | Char-N | Gas-N | Tar-N and Others 1 |
|---|---|---|---|
| RMS350 | 67.80 | 1.06 | 31.14 |
| RMS450 | 51.87 | 2.04 | 46.09 |
| RMS550 | 45.23 | 2.28 | 52.49 |
| RMS650 | 34.98 | 3.18 | 61.84 |
| AMS350 | 76.39 | 1.76 | 21.85 |
| AMS450 | 63.32 | 3.03 | 33.65 |
| AMS550 | 61.53 | 2.96 | 35.51 |
| AMS650 | 48.13 | 4.07 | 47.80 |
Publisher’s Note: MDPI stays neutral with regard to jurisdictional claims in published maps and institutional affiliations. |
© 2021 by the authors. Licensee MDPI, Basel, Switzerland. This article is an open access article distributed under the terms and conditions of the Creative Commons Attribution (CC BY) license (http://creativecommons.org/licenses/by/4.0/).
Share and Cite
Li, H.; Mou, H.; Zhao, N.; Yu, Y.; Hong, Q.; Philbert, M.; Zhou, Y.; Dizaji, H.B.; Dong, R. Nitrogen Migration during Pyrolysis of Raw and Acid Leached Maize Straw. Sustainability 2021, 13, 3786. https://doi.org/10.3390/su13073786
Li H, Mou H, Zhao N, Yu Y, Hong Q, Philbert M, Zhou Y, Dizaji HB, Dong R. Nitrogen Migration during Pyrolysis of Raw and Acid Leached Maize Straw. Sustainability. 2021; 13(7):3786. https://doi.org/10.3390/su13073786
Chicago/Turabian StyleLi, Huan, Huawei Mou, Nan Zhao, Yaohong Yu, Quan Hong, Mperejekumana Philbert, Yuguang Zhou, Hossein Beidaghy Dizaji, and Renjie Dong. 2021. "Nitrogen Migration during Pyrolysis of Raw and Acid Leached Maize Straw" Sustainability 13, no. 7: 3786. https://doi.org/10.3390/su13073786