Article

iResponse: An AI and IoT-Enabled Framework for Autonomous COVID-19 Pandemic Management

1
Amity Institute of Information and Technology, Amity University, Jaipur 303007, India
2
Department of Computer Science and Artificial Intelligence, University of Jeddah, Jeddah 23218, Saudi Arabia
3
Department of Computer Science, Faculty of Computing and Information Technology, King Abdulaziz University, Jeddah 21589, Saudi Arabia
4
High Performance Computing Center, King Abdulaziz University, Jeddah 21589, Saudi Arabia
*
Author to whom correspondence should be addressed.
Sustainability 2021, 13(7), 3797; https://doi.org/10.3390/su13073797
Submission received: 1 March 2021 / Revised: 21 March 2021 / Accepted: 24 March 2021 / Published: 30 March 2021

Abstract

:
SARS-CoV-2, a tiny virus, is severely affecting the social, economic, and environmental sustainability of our planet, causing infections and deaths (2,674,151 deaths, as of 17 March 2021), relationship breakdowns, depression, economic downturn, riots, and much more. The lessons that have been learned from good practices by various countries include containing the virus rapidly; enforcing containment measures; growing COVID-19 testing capability; discovering cures; providing stimulus packages to the affected; easing monetary policies; developing new pandemic-related industries; support plans for controlling unemployment; and overcoming inequalities. Coordination and multi-term planning have been found to be the key among the successful national and global endeavors to fight the pandemic. The current research and practice have mainly focused on specific aspects of COVID-19 response. There is a need to automate the learning process such that we can learn from good and bad practices during pandemics and normal times. To this end, this paper proposes a technology-driven framework, iResponse, for coordinated and autonomous pandemic management, allowing pandemic-related monitoring and policy enforcement, resource planning and provisioning, and data-driven planning and decision-making. The framework consists of five modules: Monitoring and Break-the-Chain, Cure Development and Treatment, Resource Planner, Data Analytics and Decision Making, and Data Storage and Management. All modules collaborate dynamically to make coordinated and informed decisions. We provide the technical system architecture of a system based on the proposed iResponse framework along with the design details of each of its five components. The challenges related to the design of the individual modules and the whole system are discussed. We provide six case studies in the paper to elaborate on the different functionalities of the iResponse framework and how the framework can be implemented. These include a sentiment analysis case study, a case study on the recognition of human activities, and four case studies using deep learning and other data-driven methods to show how to develop sustainability-related optimal strategies for pandemic management using seven real-world datasets. A number of important findings are extracted from these case studies.

1. Introduction

COVID-19 has shown that a tiny virus can gravely affect social, economic, and environmental sustainability [1,2,3,4,5,6,7,8,9]. The pandemic has subdued the whole world and has shown the vulnerability of our people, our nations, and its various public and private organizations and organizational systems [10,11,12,13,14,15,16,17,18,19]. Government sectors, businesses, educational institutions, and social life have come to a halt in many parts of the world. As of 2 August 2020, nearly 18 million people have been infected with COVID-19, claiming over 680,000 deaths around the globe and it is increasing [20]. These numbers were at the time of the first submission of this article. As of 27 February 2021, the time this first revision of the article was submitted, 1.126 billion people have been infected with COVID-19, claiming nearly 2.5 million deaths. COVID-19 is the name of the disease caused by the virus SARS-CoV-2 (Severe Acute Respiratory Syndrome Corona Virus 2). The pandemic is being called COVID-19 pandemic or coronavirus pandemic [20].

1.1. COVID-19: Key Observations and the Winners

A number of important observations can be made about the epidemic. The evolution of the pandemic has varied greatly across nations and these trends have been dependent upon the specifics of the virus itself and the variations in responses by various countries around the globe. For example, China, where COVID-19 is believed to have been originated, to date, has had less than 90,000 cases compared to 4.6 million cases in the U.S., equating to 0.006% cases in China, compared to 27% cases in the U.S., of the total number of cases in the world [21]. As of 2 August 2020, the five most affected countries in terms of the number of cases are the U.S., Brazil, India, Russia, and South Africa with 4.6 million, 2.7 million, 1.7 million, 0.8 million, and 0.5 million cases, respectively. The five most affected countries in terms of the number of deaths are the U.S., Brazil, Mexico, the U.K., and India with approximately 154,000, 93,000, 47,000, 46,000, and 37,000 deaths, respectively [21]. These numbers were at the time of the first submission of this article. As of 27 February 2021, the time this first revision of the article was submitted, the five most affected countries in terms of the number of cases are the U.S., India, Brazil, Russia, and the United Kingdom with 28.33 million, 11.04 million, 10.32 million, 4.16 million, and 4.15 million cases, respectively (based on the population reported in [22], the respective incidence rates of the number of COVID-19 cases per 100,000 population for these countries are 8559, 800, 4856, 2851, and 6112). The five most affected countries in terms of the number of deaths are the U.S., Brazil, Mexico, India, and the U.K. with approximately 506,000, 250,000, 183,000, 157,000, and 122,000 deaths, respectively. The respective incidence rates of the number of COVID-19 deaths per 100,000 population for these countries are 152, 118, 142, 11, and 178. Figure 1 provides information for the top 20 countries in the world in terms of the incidence rates of COVID-19 cases and deaths.
Pandemics have always challenged human existence on our planet [23]. During 1347–1351, the Bubonic plague, also known as Black Death, killed around 200 million people [23]. The Spanish flu took more than 40 million human lives during 1918–1919 [23]. We now live in a much more technologically advanced time with unprecedented technological capabilities. We deserve a better response to the current pandemic and use our current and past experiences to develop better preparedness for future pandemics. The frequencies and severity of natural disasters and pandemics are increasing due to the convergence of factors including the global population, frequent traveling, rapid urbanization, climate change, and ecological destruction [24,25,26,27,28,29]. Using facts from The Global Risks Report 2020 [30] of the World Economic Forum [31], Kate Whiting writes in her article “Coronavirus isn’t an outlier, it’s part of our interconnected viral age” [24], “Coronavirus COVID-19 is part of a pattern of increasingly frequent epidemics that have coincided with globalization, urbanization and climate change”. Therefore, the risks of pandemics and challenges to manage pandemics are far greater [26,28].
Eurasia Group developed a methodology to assess and rank national responses across three key areas: healthcare management, political response, and financial policy response [32]. The top five countries with the best global response to COVID-19 that they ranked are Taiwan, Singapore, South Korea, New Zealand, and Australia. Taiwan had 443 COVID-19 cases and 7 deaths in total. To achieve such an admirable COVID-19 response, Taiwan closed its border and banned exports of surgical masks. Instead of closing businesses, Taiwan used mobile tracing apps and aggressive precautionary measures to control the virus spread [33]. Singapore had a total of 38,000 cases and 25 deaths. Singapore relied on contact tracing and widespread testing to curtail the pandemic and spent 20% of its GDP to maintain the national economy [34,35]. South Korea used extensive testing, contact tracing, and financial aid to curtail the pandemic to 11,000 cases and 276 deaths, and maintain socioeconomic conditions [36,37]. New Zealand used aggressive lockdown, national border closure, and financial strategies to manage pandemic to 1000 cases and 22 deaths, and maintain national socioeconomic health [38,39]. Australia contained its COVID-19 cases to below 8000 and deaths to 102 using a coordinated approach across the government including financial relief for the citizens [40,41]. The countries that have the highest number of COVID-19 cases and deaths were unable to understand the pandemic effects and did not take timely actions.
Note that the assessment and ranking of Eurasia Group [32] mentioned above is to motivate the reader and highlight some of the challenges and response mechanisms for managing the COVID-19 pandemic. There are several other successful stories that have not been highlighted by Eurasia Group in their mentioned rankings. For example, Sri Lanka has been able to keep the cumulative number of cases to below 83,000 and the number of deaths to 464 despite a large population of 21.5 million living in an area of 62,710 km2 [20]. Sri Lanka has been able to successfully manage this pandemic with measures including early and strict lockdowns, aggressive testing, etc. [42,43]. Similarly, Vietnam, with nearly 100 million in population and close geographic proximity to China, was able to successfully manage the pandemic, limiting to 2426 cases and 35 deaths in the country [44]. It seems possible that these countries, and other countries with good pandemic management, were not ranked in the Eurasia Group rankings due to the differences in economic capabilities among those countries and, therefore, the methodology of Eurasia Group could be biased toward the economic strengths of countries. Moreover, the Eurasia Group’s initial list [32] was comprised mostly of open democracies and therefore countries such as China and Vietnam were not included in the list (this is not an endorsement from the authors of this methodology). These issues should be considered by the community while developing and ranking good practices and standards for pandemic management from across the globe. Our focus in this manuscript is a technology-driven framework for autonomous pandemic management. Finding or endorsing the specifics of the response mechanisms is not the primary focus of our manuscript. We will see later in the paper that the proposed system can use data-driven analytics and learn specific policies, strategies, and mechanisms to manage pandemics.

1.2. COVID-19: Good Practices

The lessons that have been learned from good practices by various countries, including those discussed above, could be summarized as follows: contain the virus rapidly using measures including physical distancing (also called social distancing), quarantines, lockdowns, curfews, providing sanitizers, etc. [32]; enforce containment measures using contact tracing and other methods; grow testing capacity in terms of the number of tests that could be carried out in a given time and the reach, flexibility, and quality of the testing [45]; identify and discover cures, not necessarily in a pharmaceutical lab but by engaging with the wider community.
Healthcare is but one part of pandemic management. Pandemics could gravely affect environmental, economic and social sustainability and necessary measures should be taken to improve economic and social conditions. Such measures include providing stimulus packages to citizens, Small Medium Enterprise (SMEs), and other businesses [46]; support policies for mortgage holders to avoid losing their homes [47]; easing monetary policies [48]; developing new industries related to the pandemic management for in-country resource planning and for export to aid and strengthen national economy [36]; wage subsidies and other support plans for controlling unemployment [39,41]; free childcare for all [41]; and overcoming racial, poverty-related, and other inequalities [49,50,51,52].
In addition to these, returning to “normal” involves reopening government services, businesses, education, and other sectors. Mental health and relationships have also been severely affected due to the pandemic and these need to be understood and proper response policies and activities should be developed and implemented. The World Health Organization (WHO) has taken several measures for a global response to COVID-19 including accelerating relevant research and development efforts, helping countries prepare and respond to global response coordination, and educating people about the COVID-19 protection methods [53]. These guidelines could be used by national governments to fight pandemics. Coordination and multi-term planning should be the key in any of the successful national and global endeavors to fight pandemics [54,55,56,57,58].

1.3. COVID-19 and Smart Societies

Developments under the umbrella of smart cities and societies have focused on the use of emerging technologies, particularly artificial intelligence, and the integration of various city, rural and national objectives and systems [59,60,61,62,63,64]. The penetration of information and communication technologies into our lives and various socioeconomic sectors started long ago. However, the integration and coordination of multiple systems and objectives across cities, nations, and the planet sets smart cities apart from the earlier Information and Communications Technology (ICT) developments. Social, environmental, and economic sustainability through integration and coordination are the key defining factors of smart cities, societies, and the planet.
We have identified four key areas for successful pandemic preparedness, planning, and response: (i) effective monitoring measures; (ii) agile coordination and planning across scales; (iii) informed, data-driven, predictive preparedness and timely decision making; and (iv) dexterous actions. There are clear synergies between these four key areas that we have identified for agile pandemic management and the key themes in designing smart cities, nations, and the planet. The pandemic has taught us that humans are one body, and effective coordination across nations to safeguard the planet and its inhabitants should be the way forward.

1.4. Research Gap, Objectives, and Contributions

The current research and practice on COVID-19 pandemic management have mainly focused on specific aspects of the response to COVID-19 pandemics such as data analytics, resource planning, contact tracing, and COVID-19 testing [65,66,67,68,69,70,71,72,73]. There is a need to automate the learning process such that we can learn from good practices and bad practices during pandemics, disasters, emergencies, and normal times. A part of this is to automate the coordination process such that it can predict potential future outbreaks, inform on and take various actions autonomously, predict resource requirements and procure resources accordingly, etc.
To this end, this paper proposes a technology-driven framework (we call it iResponse) for autonomous pandemic management, allowing pandemic-related monitoring and policy enforcement, resource planning and provisioning, data-driven planning and decision-making, and coordination across these areas. The framework consists of five modules: Monitoring and Break-the-Chain (MBC), Cure Development and Treatment (CDT), Resource Planner (RP), Data Analytics and Decision Making (DADM), and Data Storage and Management (DSM).
The MBC module monitors the environment using a range of Internet of Things (IoT), social, and other sensors to detect potential pandemics and other anomalies and takes necessary actions. The actions include contact tracing, maintaining physical distancing, and others. The CDT module is aimed at developing various cures for pandemics and these could include mainstream drugs, vaccines, and natural remedies. The RP module plans the required resources and the provisioning of these resources. The resources include testing and medical equipment and supplies, quarantine and treatment centers, and human resources. The DADM module provides data analytics and decision-making services using cutting-edge AI and other scientific methods. The DSM module manages big data, its storage, preparation, and provisioning. It could be located remotely (cloud), locally (edge), or somewhere in the middle (fog).
All modules collaborate dynamically to make coordinated and informed decisions. We provide the technical architecture of a system based on the proposed iResponse framework along with the design details of each of its five components. The challenges related to the design of the individual modules and the whole system are discussed. We provide six case studies in the paper to elaborate on the different functionalities of the iResponse framework and how the framework can be implemented. Firstly, we present a sentiment analysis case study (see Section 4.1) that could be used by the authorities to understand how seriously the public has perceived the COVID-19 situation and accordingly form appropriate pandemic management policies and strategies. Secondly, we present a case study on the recognition of human activities, such as walking, playing, etc., which could be used by the authorities to monitor people’s whereabouts and activities to know, for example, how seriously people are following the pandemic measures (Section 4.1). These two case studies are part of the MBC module.
The next four case studies are related to sustainability. Two of these case studies are related to health and social sustainability (Section 10.1 and Section 10.4). One of these case studies is related to economic sustainability (Section 10.2) and another one to environmental sustainability (Section 10.3). We use deep learning and other data-driven methods to show how to develop sustainability-related optimal strategies for pandemic management using various data. The datasets we have used are real-world open datasets including a human activity recognition (HAR) dataset [74], the World Bank COVID-19 dataset [75], Google COVID-19 mobility report dataset [76], credit card transactional data by the U.S. Bureau of Economic Analysis (BEA) [77], air quality data acquired through OpenAQ API [78], and a dataset from the World Happiness Report [79]. A number of important findings are extracted from these case studies (see the relevant sections).
We hope that our work in this paper will motivate the design and adoption of holistic pandemic management systems. These pandemic management systems will be an integral part of other national operational systems, which in turn will be connected globally. Such an approach will allow us to be better prepared for future pandemics with predicted warnings, allowing better resilience for social, economic, and environmental sustainability.
The rest of the paper is organized as follows. Section 2 reviews the relevant works. Section 3 gives an overview of the proposed iResponse framework. The five modules of the iResponse framework are described in Section 4, Section 5, Section 6, Section 7 and Section 8, whereas in Section 9 the importance of integration is discussed. Section 10 provides four case studies that show how to develop sustainability-related optimal strategies for pandemic management. Section 11 discusses the challenges of realizing the iResponse framework. We conclude and give future directions in Section 12.

2. Literature Review

Countries around the world panicked when they witnessed the early exponential growth of COVID-19 cases in their cities and towns. This prompted them to respond in a variety of ways such as the formation of the new policy to deal with the COVID-19 pandemic, integrated with the use of sophisticated technologies, and race for developing drugs and vaccines. Lockdowns are one universal policy that is followed by most of the countries to pause the number of cases and prepare facilities for managing the exponential growth of COVID-19 cases in the near future [80]. Countries like Taiwan, South Korean, Singapore, New Zealand, etc., were able to manage and control COVID-19 effectively without any panic wave. All of them used testing as a potent tool. On the other hand, bigger countries witnessed a little late arrival but the uncontrollable exponential growth of this infection, such as in Brazil, India, Russia, the U.K., and the USA. This proves policy failure at various levels because these countries were alerted in advance, but despite this, they did not take result-oriented policy formation decisions. Another mistake some countries have made is to use lockdowns as the primary tool for controlling COVID-19, (such as in India) rather than focusing on maximizing testing and improving health infrastructure. Lockdown is merely a tool used to hinder COVID-19 cases. In Figure 2, we depicted three clusters of cases in the world. The data used in the figure are taken from World Bank [75]. We can see that from the first cluster (15 January to 31 March) to the third (1 June to 18 July), lockdown only delayed the exponential growth of the cases. Managing a pandemic effectively needs multi-facet efforts and policymaking which consists of planning, sophisticated technologies, data sharing, financial resources, logistics, and transparency [81].
This paper focuses on the technological aspect of pandemic management with particular focus on the integration of various technologies to serve a universal goal. In this section, we discuss the research and development works, which are focused on making sensors and AI-based technologies to control the spread of infectious diseases. The COVID-19 pandemic started as a localized infection in Wuhan, which has now infected more than 166 countries around the world [1]. As we are witnessing today, sensors and AI-based technologies are successfully used in several domains to enhance decision-making accuracy and to achieve full automation. Today, machine learning and deep learning are at the core of any AI-based technology and tool, such as big data analytics [82], social media analysis [83], networking [84], autonomous driving [85], biology [86], healthcare [87], astronomy, physics [88], and transportation [89], which are a few examples.
Sentiment analysis can play an important role in policymaking to counter COVID-19. Social media and online news are unstructured data sources, which contain sentiments and behavioral insights of individuals, communities, and events. One of the potent tools that can help to control the spread of COVID-19 is to give the right information to the public about the do’s and don’ts in these pandemic times. Today, the world is witnessing an info-demic [90]; there is an excessive flow of correct and incorrect information (for example, which type of mask to wear, magical drugs, treatments, rules to follow, and isolation guidelines). Sentiment analysis can help to find ways to tackle COVID-19’s info-demic. Samuel and Ali [68] used machine learning for analyzing fear sentiment progression using tweets among the public and found that as the number of cases grows, fear also incrementally increases. However, there are signs of tiredness in people now. Similarly, using machine learning in [68], Nemes and Kiss found interesting trends related to COVID-19 on Twitter, where a Sentiment analysis-based chatbot tool which uses deep learning to engage with quarantined patients to keep them fresh and far from negative thought is introduced in [91]. Social distancing is a critical aspect to break the chain of infection so it cannot be transferred further. Social media analyses [92], and human activity recognition [93] can help to track people and events. People’s moods can also be predicted using unstructured social media data. However, there will be privacy concerns that can be addressed separately [94].
Medical image segmentation is widely used in infectious disease detection. For example, deep learning-based methods were introduced to identify COVID-19 infected patients using their CT images [95,96]. However, these methods need to improve their predicting accuracy. One reason for low accuracy is limited data availability. An improved deep learning-based method in terms of detection accuracy is introduced by Chen et al. [69] using high-resolution computed tomography; deep learning is playing a major role for scientists in enhancing their understanding of COVID-19.
On the other hand, drug discovery plays a very crucial role in controlling highly infectious diseases like COVID-19. Drug discovery, particularly for the newly discovered pathogens, is a time consuming task. Various benefits of machine learning and deep learning can be exploited to design drugs, such as identification of the target population, recognizing the prognostic biomarkers, examining pathological datasets, and data-driven decisions [97]. Chen et al. [98] compared deep learning with conventional machine learning algorithms for drug discovery problems; deep learning outperformed all others. Following this, a deep learning-based method that ranks the protein-ligand interactions is proposed in [99]. The method can recognize candidate drugs for the COVID-19 protease by using drug screening from four databases of chemical compounds.
For managing and controlling COVID-19 effectively, Internet of Things (IoT) applications are used by some countries for surveillance and contact tracing, which is integrated with AI [70,71]. IoT and AI are widely used in the healthcare industry, such as IBM Watson which can find valuable insights from unstructured data and can even correct doctors in their prescriptions and diagnoses [100]. AI can answer several complex questions during the outbreak of infectious diseases. One such application is BlueDot; it is the first AI-based tool which quantified the global risks in the initial phase of COVID-19 in China. It communicated the risk factors to its clients. It anticipates the impact of infection using highly diverse datasets such as global flight itineraries, climate conditions, animal and insect populations, and the health system capacity of a specific region.
Healthcare services can take advantage of connected autonomous vehicles (CAVs) to improve ambulance services greatly. Two main advantages of CAVs during pandemics such as COVID-19 are: (1) it is a much safer mode to transport an infected person in total isolation [101], and (2) CAVs can also deliver essential commodities to homes during lockdowns. Connected vehicles can share information among them to understand the situation better. The literature reviewed so far establishes the fact that the use of advanced sensors is critical for collecting important data, and AI can greatly help to control pandemics. However, the full potential of AI can only be unleashed when all of its applications are integrated to serve a single objective of making an efficient epidemic and pandemic response system. Today, several frameworks deal with a specific aspect of COVID-19, some of which are stated in Table 1. However, to the best of our knowledge, no framework exists which has a comprehensive and holistic view of the various aspects of COVID-19, as the proposed work presents.

3. Proposed Framework

The key to fighting extremely infectious COVID-19 is to have an efficient response system that is intelligent, automated, and quick in making decisions. However, as we’ve seen in the last few months, even the developed countries around the world have failed to establish any state-of-the-art response system on a large scale. From a technological perspective, there are two main reasons for this:
  • There is a lack of integration between various sub-systems. This also means poor coordination. For example, AI-enabled tools predicted the COVID-19 outbreak; however, several countries did not prepare the requirements for medical equipment and medical supplies as per the threat. Once the cases had grown exponentially, then they rushed to procure critical medical necessities. Particularly, this was the situation between February and April in many countries like Italy, the U.S., and Brazil, etc.
  • There is significant human interference at every stage, which makes the decision-making process slower and full of personal biases.
We introduce in this section an AI-powered iResponse technology-driven framework for autonomous pandemic management. It allows pandemic-related monitoring and policy enforcement, resource planning and provisioning, data-driven planning and decision-making, and coordination across the various areas. We depict an iResponse framework in Figure 3, and it consists of five modules: Monitoring and Break-the-Chain (MBC), Cure Development and Treatment (CDT), Resource Planner (RP), Data Analytics and Decision Making (DADM), and Data Storage and Management (DSM).
We provide the technical system architecture of the iResponse framework in Figure 4. Diverse data sources are used to collect data such as IoT based sensors, social media, Electronic Health Records (EHRs), hospital occupancy data, Wi-Fi, GPS, travel itinerary, testing labs, smart devices, etc. Further, this data is processed. For example, missing values and outliers are identified and predicted or removed if needed. For text-related data, we remove all symbols, special characters, etc., to make a clean text corpus that can be analyzed further. The data is stored at the data centers which are cloud-based, as well as in-house data centers. These data centers are heterogeneous which means they are capable of storing a variety of data such as structured, unstructured, multi-media, spatial, and EHRs. There are several machine learning and deep learning algorithms available, which are trained on the data provided by data centers. Further, these trained models can perform a specific task on real-time data. The results obtained (data from data centers and real-time data) are visualized statically and interactively using data visualization capabilities.

4. Break-the-Chain

The optimum measure that any country can take to control the spread of any highly infectious disease is to quickly break the chain of infection transmission. In the case of COVID-19, one infected individual can infect two to three other healthy individuals [104]. Thus, the number of infected people will see the exponential rise depicted in Figure 5A. Further, as depicted in Figure 5B, if one of the legs of this transmission chain is broken, this could greatly reduce the number of infected people. In this section, we will discuss how the “Monitor and Break-the-Chain (MBC)” module of the iResponse framework can help in decreasing infection rates and transfer. The aim of the MBC module is to monitor the environment using a range of IoT, social, and other sensors to detect potential pandemics and other anomalies to take necessary actions. The actions include contact tracing, maintaining physical distancing, and others. In the proceeding subsections, we will discuss each of them.

4.1. Social Media Analysis

Social media has become an important part of our societies today. It is a medium which can have great impact in shaping public perception about a subject. It is also a place where we find abundant misinformation termed as fake news. Social media analysis is an important component of the MBC module of the iResponse framework. We believe that social media can play an important role in controlling epidemics and pandemics in the world. The objectives of the social media component are: (1) to create awareness among people with the right set of information about COVID-19; (2) to develop a public sentiment to take COVID-19 as a serious threat and abide by the policies of government as they are designed for their health benefits; and (3) use social media sentiment to map the behavior of individuals which can be useful in the analyses of how government advisories and rules are followed and how they are affecting the behavior of individuals [105].

4.1.1. Method

We used the R statistical platform for modeling and analysis. We gathered week-wise data from Twitter; 10,000 tweets were downloaded which include those of international leaders, organizations, and other famous personalities. We also used 50 published online news articles of well-known newspapers and magazines including The Guardian, Fortune, BBC, Wired, and Times. For collecting the Twitter and newspaper data, we used search keywords including corona, COVID-19, Corona Epidemics, Corona Recession, Corona Deaths, Corona Ventilators, Corona Job loss, etc. For sentiment analysis of the tweets, we first downloaded data based on the above-mentioned keywords into the R by using the twitteR package [106]. Data access is provided with the combination of the access token, access secret code, consumer key, and consumer secret, and is generated with the help of the Twitter API. Similarly, for online news media, we used Google to search for news articles related to the above-mentioned keywords. We then downloaded the data and imported it into R using the RCurl package [107]. The RCurl package filters out the useful text data from the HTML pages. We have used the Naïve Bayes algorithm for sentiment analysis. The Sentiment-Analyzer algorithm is given in Figure 6, which is self-explanatory.

4.1.2. Results

The results obtained from the Sentiment-Analyzer component show significant sentiment fluctuations, as depicted in Figure 7, among individuals, organizations, and governments. Sentiments are classified into four classes:not concerned, concerned, serious, and afraid. By class “Not Concerned”, we mean people that are not at all serious about COVID-19, whereas by type “Concerned” we mean that people are presuming it as a health threat. The third type “Serious” means that people are very serious about this infection and lastly “Afraid” type means that people are serious and frightened by this infection. Figure 7 depicts the week-wise aggregated sentiments of a particular type. It is evident in Figure 7 that in the first three weeks people were not much bothered about COVID-19 infection. However, from the fourth week onwards there was a significant shift in people’s perceptions toward COVID-19; as a result, only 41% of people are not bothered. At the same time, the percentage of people who are concerned, serious, and afraid started to increase significantly. Further, for the last two weeks, people who are not concerned are around negligible and almost 100% of people are from types concerned, serious, and afraid. This signifies that as COVID-19 infection grows from an epidemic to a pandemic, it greatly affects people’s sentiments. From the response perspective, the first four weeks are important because we can break the chain of virus transmission and the exponential growth as depicted in Figure 7. Therefore, if we can change the percentage of people who are not concerned about the infection in the first four weeks in Figure 7, that can break the chain significantly. This is due to the reason that people will follow government advisories and rules with seriousness and stick to social distancing. Figure 7 also serves as a source of information for the governments that they need to change and modify the way they want people to perceive the dangers of any highly infectious disease like COVID-19 in the initial stages.

4.2. Social Distancing

Social distancing is a technique of minimizing or limiting the social movements and physical contacts of the individual in everyday life. It is a potent method of breaking the chain of COVID-19 infection transfer. It is practiced very aggressively by China and followed by several other countries in various forms [108]. One major problem faced by countries in implementing social distancing effectively is that people are causal in following it. Due to this, it becomes crucial to know in real-time the activities of residents which can show their seriousness in practicing social distancing. To track the outdoor activities for the same is an expensive, time-consuming, and resource-exhausting task if done physically by police, etc., and delays the decision-making process. The social distancing component aims to mitigate this. There is a need for technology that can perform this in a timely and cost-effective manner. We identify sensor-based human activity recognition by which we can identify the current state of individual activity with the help of IoT infrastructure. Further tracking and crowdsensing can be used with the help of Wi-Fi and cellular spatial data.

4.2.1. Activity Recognition

IoT-enabled Human Activity Recognition (HAR) has gained significant importance and expanded its application domain, specifically concerning the context-aware systems. IoT-enabled HAR today is used in diverse applications such as improving quality-of-care for the disabled, infants, the elderly, and sick people [109,110]. The objective of the IoT-enabled HAR component is to help in analyzing how dedicatedly residents follow social distancing. This can be analyzed in real-time using machine learning [93]. Today, smartphones and smartwatches are equipped with accelerometer sensors which can help to sense x, y, z coordinates data that can be further used to predict individual activities. We have used human activity recognition for the following goals:
  • To provide context-aware tracking of activities.
  • To identify users based on the spatio-temporal activity data.

Method

IoT-enabled HAR is a widely researched topic today. There are several numbers of real-world datasets available for performing simulation studies. To demonstrate the proof of concept of this component, we used the dataset [74]. It is recorded by using accelerometer and gyroscope sensors in smartphones and smartwatches. We used the smartphone accelerometer data in this work. The dataset consists of user id, timestamp, axis (x, y, z), and activity class. We divided the dataset into 60% for the training phase and 40% for the testing phase. There are 17 activity classes as depicted in Figure 8. We trained the C5.0 decision tree to predict activity classes.

Results

We used the C5.0 decision tree classifier to predict activity classes. In Figure 8, we depicted the prediction accuracy of each class. The overall prediction accuracy is 84% and can be termed as satisfactory. Ten-activity class prediction accuracy is above 90%. However, the prediction accuracy of activity classes such as walking, kicking football, and playing tennis are below 70%. If we look more closely at Figure 8, we will find that the prediction accuracy of outdoor activities is lower compared to indoor activities. The average prediction accuracy of outdoor and indoor activities is 68.13% and 90% respectively. We can establish the fact that HAR is possible using machine learning. If the individual activity falls in prohibited activities during social distancing restrictions, the government can know it in real-time.

4.2.2. Wi-Fi and Cellular Tracking

Social distancing can only be effective if practiced with the utmost sincerity. There are two ways to do it; one is that residents take it as a social responsibility, and the second is to implement it strictly by using the state’s power. In both cases, the state needs to make sure that people are following social distancing strictly to measure its effectiveness. The Italian government failed miserably in implementing social distancing. As a result, it has one of the highest initial case numbers [111]. What the world can learn from Italy is that social distancing is one of the important pillars in the fight against COVID-19. The systematic inability of our leaders and people to listen to virologists and doctors highlights an important aspect of supporting wrong practices in dire, highly complex events like COVID-19. Spatial data from Wi-Fi and cellular operators can play a very crucial role to analyze social distancing. It can be used in two ways by the government:
  • Spatial coordinates from data can be used to track the location of the user.
  • Spatial coordinates can be used to sense crowds within a certain area.
The objective of the “Wi-Fi and Cellular Usage Tracking” component is to transform spatial coordinates tracking applications into social distancing applications, to provide authorities the means to analyze social distancing effectiveness. The major challenge will be to ensure residents’ data privacy. This issue is addressed by some countries such as in the South Korean contact tracing app in which the user id dynamically changes in a fixed interval of time, and Singapore’s TraceTogether application which uses Bluetooth. It does not store any user location data. However, India’s Arogaya Setu application stores user location data in encrypted form. Governments around the world need to create a balance between privacy and application efficiency. A recent comparative study published in MIT Technology Review gave India’s Arogaya Setu contact tracing application 2 rating points on a scale of 5, which is one of the worst among several others [67]. To the best of our knowledge, all these major contact tracing applications’ objectives are limited to contact tracing. This information is used for further decision making. iResponse wants to go one step further with these contact tracing applications. We should start using IoT infrastructures along with Wi-Fi and cellular networks to have an automated decision-making process rather than human-based biased decision making.
Wi-Fi and cellular networks can give real-time spatial data (latitude, longitude) of the users’ physical presence. This data has two purposes that will help in evaluating the effectiveness of the social distancing by the relevant authorities and redesigning the strategies based on the evaluation. Firstly, the movement of residents from their location can be tracked. For example, in Figure 9A, a patient is tested positive at a location highlighted with a red circle. Now, with the help of his Wi-Fi or cellular spatial data or IoT infrastructure, immediately, his last 15 days movements can be tracked. Figure 9B gives details with zoom. We can know the places he/she visited and declare them high risked zones, as visualized in Figure 10.
Secondly, the proximity of social distancing can also be determined among the residents through crowdsensing. This component can count the number of Wi-Fi and cellular users present within a particular diameter. Violation of social distancing rules can be determined if the number of persons exceeds the permitted threshold in the given area. The longitude and latitude points are used to mark the locations of the infected person on the map as depicted in Figure 11. To demonstrate the proof of concept, we visualized a scenario from the world-famous tourist city Jaipur which has 3000 plus COVID-19 cases. In Figure 11, areas that have crowds above the social distancing limit within a certain diameter are highlighted in red dotted circles a bigger circle means more and more people are present within the pre-specified diameter. After locating the social-distancing violation hot spots in real-time, authorities can identify the violators automatically, and form new strategies to implement the social-distancing protocol.

4.3. Detection and Isolation

The objective of the “Detection and Isolation” component is to detect new infection cases as early as possible. This is the key to stop further transmission of COVID-19 from an infected person and it can maximize the chances of early recovery too. This component is subdivided into four subcomponents that are: Test, Clustering (Risked Population), Trace, and Isolation. These are discussed in the proceeding subsections.

4.3.1. Test

To test as many people as we can, a test coupled with social distancing is the optimal strategy to manage and control COVID-19. The number of positive cases in Germany was high; however, Germany was doing 500,000 tests every day even in the initial stages which was very impressive [45]. As a result, they reduced the death rates significantly from COVID-19. However, testing is heavily dependent on the availability of testing kits and testing labs. An automated search of testing kit manufacturers who are selling quality testing kits can be done. The iResponse framework uses technologies to have a holistic view of all testing related information and resources at one dashboard which plays a critical role in planning and decision-making as now, all of the information is a click away. This will help to understand the whole situation and to formulate a more effective future course of action in a short time.

4.3.2. Clustering (Risked Population)

Particularly in developing economies and underdeveloped economies, mass testing is an expensive and resource exhausting operation. To deal with this issue, the best strategy is to identify the most prone population clusters for COVID-19 to limit testing in these highly prone population clusters. The criteria of selection of highly risked population clusters are as following:
  • Residents who come from countries and cities which have a high rate of COVID-19 cases and people who have a recent international travel history.
  • Residents from the locality where new COVID-19 cases are reported.
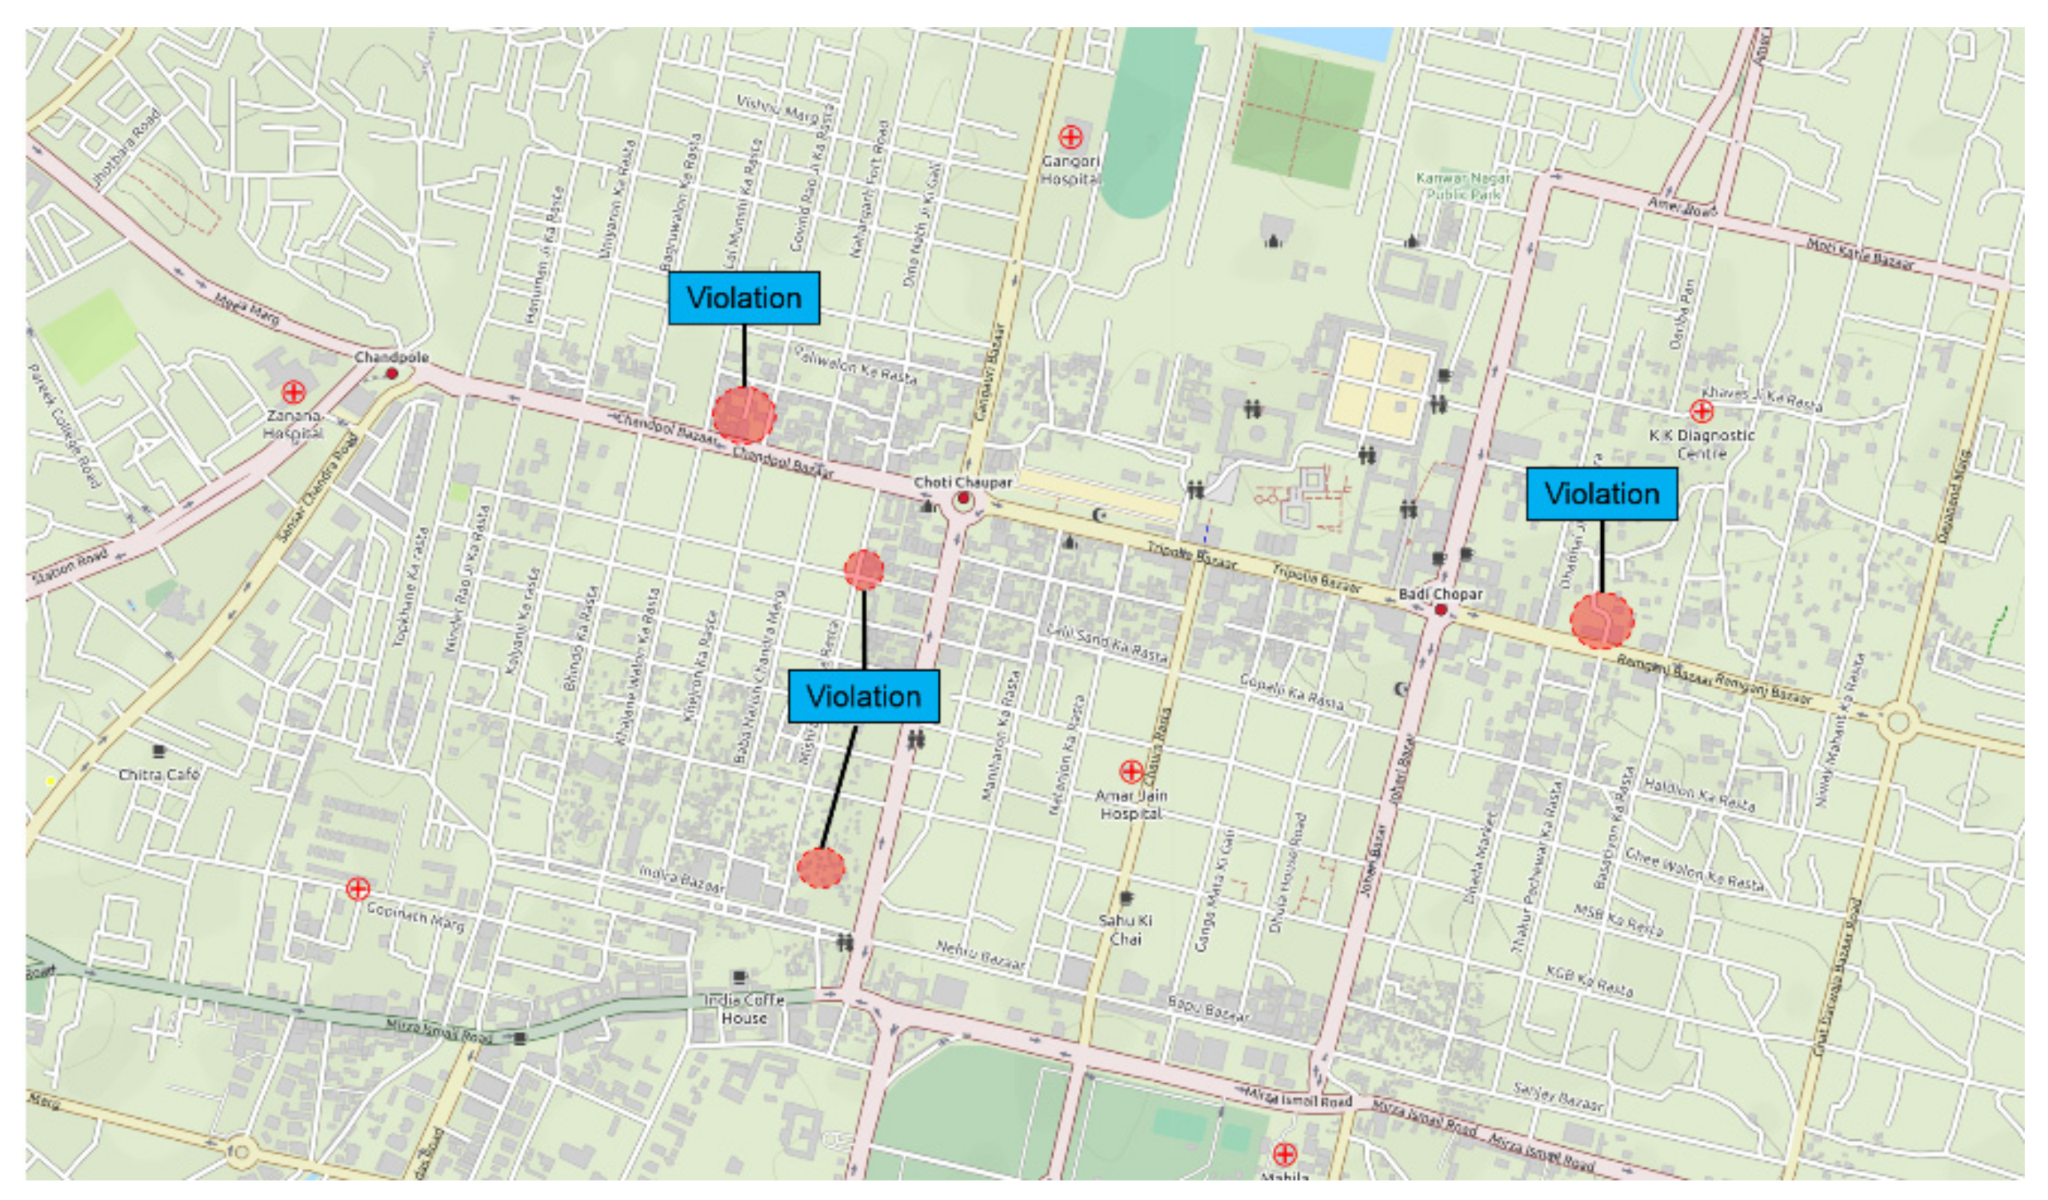
  • Localities where a COVID-19 infected person visited, such as a market, coffee shops, etc.
This component will use data from several diverse data sources to automate the clustering task. Machine learning-based clustering algorithms will be used to segment the population into groups that urgently need the tests, and groups that do not need immediate testing.

4.3.3. Trace

Once a resident is confirmed as infected with COVID-19, authorities must know where he/she traveled and whom he/she met with in the last two weeks. Wi-Fi and cellular tracking can be used for this purpose, as explained in Section 4.2.2. It is observed that infected people try to hide where they went and with whom they met. In this quest, technology can play a significant role in automating the tracing process. For the above purpose, we need the travel itinerary, GPS, Wi-Fi, and mobile tracking data which would certainly hurt the privacy of individuals. However, we need to bring up the mechanism that ensures privacy remains intact.

4.3.4. Isolate

Isolation is the key to contain infection such as COVID-19. In several places, it is noted that people do not obey the isolation protocol; in these cases, if they turn COVID-19 positive then that means that they would have transferred the virus to many. For example, in the Ramganj area in the Indian tourist city Jaipur, a person returned from the Middle East. As per the government advisory, international travelers must keep themselves in self-isolation for two weeks but the person ignored the advisory, tested COVID-19 positive, and transmitted the virus to more than a hundred people as per till date records [112]. Suspected and infected COVID-19 residents must be kept under surveillance, particularly in societies that are very casual about isolation. Tracking technologies as discussed in Section 4.2.2 can be used to track the moments and locations of COVID-19 suspected and infected residents. Isolation can have adverse psychological effects on people suffering from depression, anxiety, and other mental and physical disorders. A set of activities must be designed for isolated people to keep themselves busy rather than with self-thoughts. For example, on-demand multimedia content can be provided.

4.4. Safe Delivery and Transport

Connected and autonomous vehicles (CAVs) can accelerate, increase and decrease speeds, put and release brakes, and steer themselves, avoiding any sort of accidents. They can also share information among themselves [113,114]. The CAV paradigm can play a key role in breaking the chain of virus transfer. They can assure the safe delivery and transport of people and goods. For example, when an infected person is transported to medical facilities, there are high chances that the ambulance drivers, doctors, and nurses who are present in the ambulance can get infected. Several confirmed reports from around the world give concrete evidence of the above-discussed challenge. In Armenia, ambulance drivers and doctors get infected [115], and the same happens in India [116], while transporting COVID-19 infected patients. The use of CAVs can completely break this chain of infection transfer due to the following reasons:
  • CAVs use AI to plan trips. Authorized persons can command CAVs in the form of voice as input to pick people who have COVID-19 symptoms or infected by it.
  • CAVs can plan the best possible route, in terms of time, to transport patients to hospital and quarantine centers.
  • CAVs are more time and fuel-efficient which will help to save overall operational costs.
  • CAVs reduce healthcare human resource requirements, which can be diverted to hospitals.
  • CAVs can communicate and share information with other vehicles. This helps to enhance their understanding of the driving environment.
  • The eCommerce industry can provide touch-free automated delivery to its customers with the help of CAVs.
In Figure 12, we demonstrate scenarios where both conventional ambulance and autonomous ambulance are used. Conventional ambulances selected the shortest path by distance whereas autonomous ambulance intelligently selected the shortest path in terms of reducing the time of journey. This was achieved by taking into consideration dynamic traffic congestion, traffic lights, and road conditions. As depicted in Figure 12, the conventional ambulance took 20 min, which means that for this entire time, the driver and healthcare staff present in the vehicle has sufficient proximity to the patient to get infected. However, the exposure time window is zero when the patient traveled by autonomous ambulance. This shows by using CAVs, we can tremendously increase operational efficiency as well as break the chain of infection transfer.

5. Cure Development and Treatment

The development of dedicated drugs and vaccines for COVID-19 is a challenging and time-consuming task. Besides this, it might be possible that we never have a vaccine [117]. Now, the challenge is how to treat people with this infection. Early detection means a higher chance for successful treatment. From a technological perspective, there is an immediate need that research labs, hospitals must be connected and share the information which will be stored in a common database. Further, machine learning can be used to find insights from this information to develop case-based treatments and find inferences that are hard to deduce without connectivity and machine learning. Many theories are erupting in support of specific drug effectiveness against COVID-19. However, there are no solid pieces of evidence for any of these claims or even if they exist, they are limited and cannot be considered generalized pieces of evidence. The “Cure Development and Treatment (CDT)” module is aimed at developing various cures and treatments for pandemics at a very fast pace by using a huge knowledge base and making it available to the masses. These could include mainstream drugs, vaccines, and natural remedies. The CDT module can help to develop patient-specific treatments and accelerate decision-making related to the treatments.

5.1. Synchronizing Labs

Lab synchronization plays an important role in finding critical insights at national and international levels. The initial issue is that research labs do not share critical findings as they belong to various independent groups or if they do share them, it is generally too late. However, an online platform must be there which can be activated, particularly during the times of pandemics where human lives matter more than stakeholders’ profit. Particularly in developing economies, governments do not act on time in this respect.

5.2. Drugs Discovery

Presently, there is no drug dedicatedly designed to treat COVID-19. However, several drugs, such as Avigan and Hydroxychloroquine, are already in the market and have shown effectiveness on small clusters of infected people [118,119]. Higher dosages of vitamin C can speed-up recovery [120]. On the other hand, plasma therapy is showing promising results too [121]. Now, several papers highlight the benefits of nano-silver in the initial stages of this infection [122]. Despite little successes, these drugs and methods are not considered the universal solutions to the problem. We need to study their side effects, the population cluster on which they are effective, the possibility of mass production, and their effectiveness on different strains of COVID-19. We strongly believe that there is a need for universal databases which contain various information such as patient demographic details, age, health conditions, drugs, dosage quantities, and outcomes.

5.3. Treatment Prediction

We need an AI-enabled automated system that can formulate and evolve treatment protocols for patients based on situational awareness and the universal response of patients to specific treatments. In Section 5.2, we highlighted the need for a comprehensively synchronized database which stores COVID-19 treatments and response information of patients within the country and, if possible, globally. The major issue in developing an AI-based system to predict treatments for the patients is that the governments around the world are not willing to provide health and treatment-related details of patients [66]. However, an AI-based algorithm does not need any information such as names or biometrics through which patients can be identified, which assures privacy protection. The various advantages that an AI-based treatment prediction system has over a conventional treatment protocol design are:
  • The knowledge base is wider; as a result, the best treatment can be formulated.
  • Possibilities of errors and negligence are lessened.
  • Patient-specific treatment can be formulated in a very short time or just with a click.
  • Viruses like COVID-19 are very infectious. The treatment time window can be decreased significantly which can also result in saving lives and operational resources.

6. Resource Planner

Lack of resource planning for COVID-19 has landed several countries in complete chaos. The COVID-19 pandemic is testing the extremes of healthcare systems of countries around the world. For example, New York has a severe scarcity of ventilators; major western countries have very limited stocks of drugs like Hydroxychloroquine, limited testing kits, and inadequate availability of personal protective equipment (PPE) kits for healthcare workers. On the other hand, we have countries like Germany, Taiwan, Singapore, and New Zealand that foresee the need for rigorous prioritization of medical resources; as a result, they can contain deaths and social chaos in their societies. We need to do purposeful resource allocations of the above-mentioned resources [123].
The “Resource Planner (RP)” module as depicted in Figure 3 aims to plan the required resources and provisioning of these resources. The resources include testing and medical equipment and supplies, quarantine and treatment centers, and human resources. RP highlights the technological side; today, we have machine-learning algorithms that can predict the required resources with the utmost certainty. For example, by learning from COVID-19 growth patterns, these algorithms can predict how many numbers of ventilators will be needed in the coming days. With the help of data from electronic health records (HER), these machine-learning algorithms can predict if a particular patient will need intensive care admission and a ventilator after hospitalization. A researcher from the University of Copenhagen developed an AI-based algorithm that can predict the above stated by using the computation powers of a supercomputer [124]. Using these sophisticated algorithms, hospitals can know, in advance, resource requirements. If they do not have the resource, then they have time to arrange for it, avoiding last minute chaos. RP can find sellers, perform cost analysis, and select the most suitable product and seller with a click. As depicted in Figure 3, the most important resources that need to be planned are the following:
  • Medical equipment and supplies: We have witnessed around the world that even developed countries faced serious shortages and were undersupplied with ventilators, masks, glasses, and medicines [125]. To obviate this, first, we need to map how the number of cases will grow, and how many of them need critical medical equipment like ventilators.
  • Hospitals and quarantine centers: Countries where the healthcare system is under-developed, need to identify make-shift hospitals and quarantine centers to check and admit infected people.
  • Medical human resource: Availability of doctors, nurses, and other medical support staff in the right number is very important to manage any sudden rise of infection. For example, in Italy we witnessed doctors and nurses worked overtime which tested their physical strength too.
  • Testing labs and testing kits: Testing resources are very important to evaluate the total situation. It also helps to answer a question like whom to treat. Test data helps to forecast the growth of infection and the requirement of resources.

7. Data Analytics and Decision Making

The “Data Analytics and Decision Making (DADM)” module aims to provide data analytics and decision-making services using cutting-edge AI and other scientific methods. It is the core of the iResponse framework. The various components of this module are discussed in the proceeding subsections.

7.1. Deep Learning

Deep learning is a branch of machine learning which is used to acquire AI [126]. A deep learning component is the main pillar of the iResponse framework from which critical and complex hidden data insights are gathered. It mimics the neural system of humans. Gartner classified deep learning as one of the top 10 technology trends which have a significant impact on the strategic planning of most organizations [127]. LeCun, the director of AI research at Facebook, in his famous Nature review publication on deep learning [128], stated that deep learning will see many near future successes because of two important factors: (1) it needs very little engineering by hand and (2) it inherently benefits from the increases in the amount of available computational resources and data. Healthcare is one of the major application areas of deep learning (DL) algorithms, due to their ability for critical learning from complex data patterns [129]. Deep learning architectures and mathematical formulation of these algorithms are succinctly discussed in [130,131] which can be referred for further information. Deep learning is already showing a promising sign in the fight against COVID-19 [132]. Some of the application areas where the power of deep learning has started to be unleashed are in drug discovery, disease detection through image segmentation, outbreak prediction, etc. [95,133]. We believe deep learning components can play an important role in understanding pandemics like COVID-19, which will further improve our decision-making.

7.2. Transfer Learning

Transfer learning is a branch of machine learning where the intelligence gained by solving one problem is used for solving a related problem. The transfer learning component of the iResponse framework can use the insights gained from past infectious diseases to understand COVID-19 in a more comprehensive manner, which will not be just concentrated on correlation but causation. It has great potential to unlock hidden knowledge. Transfer learning algorithms are now actively used for disease prediction [134], medical healthcare records [135], mortality prediction [132], and COVID-19 detection in chest X-ray images [136], etc.

7.3. Data Fusion

Data fusion is a domain where we combine the data sensed from multiple sources to address a single objective and has a wide range of applications [137]. Data fusion is now used widely in the healthcare domain [138]. We believe for COVID-19 like pandemics, data fusion can play an important role. For example, whom to test first is an important question, particularly concerning under-developed and developing economies. These countries’ healthcare systems are already overburdened and practically cannot perform mass testing due to financial reasons and lack of testing kit availability. They need to use their limited testing resources in an optimized manner to form an efficient detection system. Therefore, it is necessary first to test highly risked residents. For this scenario, we need an intelligent algorithm that can fuse data from multiple sources to predict whom to test first. Data fusion can be used to predict case-based treatment. By the above examples, it is clear that we need to use data fusion to enhance our decision making to manage and control COVID-19 like pandemics.

7.4. Big Data Processing

Big data can play a vital role in understanding COVID-19 from completely new perspectives. It can give us new hidden insights to answer various critical problems. Today, the major advantage in our fight against COVID-19 is the availability of big data, which was not the case for SARS in 2003 or the swine flu [139]. Big data processing algorithms and technologies are crucial parts of the iResponse framework. Big data sources related to COVID-19 are surveillance cameras, electronic health record databases, IoT, tracking data from mobiles, social media, testing labs, healthcare devices, and hospitals [140]. Challenges that big data bring with it are real-time processing, parallel and distributed processing, security, etc.

7.5. Data Imputation

The healthcare domain heavily relies on survey and sensor-based hardware to sense health-related data. Sensors are not reliable, which is a fact [141,142,143,144]. One of the outcomes of this is the missing values produced in healthcare systems-based applications. The missing values problem arises due to a variety of reasons, such as synchronization problems, unstable communications, sensor failure, power loss, and weather conditions [145]. Two approaches used to deal with missing data are (1) deleting the missing observation and (2) substituting predicted data in place of missing data, which is known as data imputation. It is the most preferred and widely accepted approach as it helps to improve prediction accuracy [146]. A lot of attention has been given for the development of data imputation algorithms in several areas such as natural sciences, census surveys, Wireless Sensor Networks (WSN), robotics, and scientific applications.

7.6. Anomaly Detection

Anomalies, which are also known as outliers [147], are the data patterns that are different from the rest of the data and signify abnormal data behavior [147,148,149]. The iResponse framework will have certain data with anomalies where sensors are involved due to: (1) low-cost sensors which means low quality, (2) weather conditions, (3) electronic inferences, (4) mechanical error, and (5) data communication errors [141,142,150]. Outliers must be detected, then deleted or replaced by some predicted values, which is a crucial aspect to maintaining high data quality from which, ultimately, machine-learning algorithms dig-out the key insights. Modern-day machine-learning algorithms are not only used for gaining valuable knowledge but also for improving data quality by detecting data aberrations [151]. Particularly in the healthcare domain, an outlier can result in the wrong decision that can cost a human life. Further, at some point in time, we will also see IoT playing a vital role in the healthcare domain at a large scale where data anomalies are a common issue.

7.7. Feature Selection

The process of selecting the subset of the most relevant feature is known as feature selection. The identification of the most important information, which is potentially overpowering the amount of medical and healthcare data, has become increasingly significant from the perspective of managing and controlling COVID-19 like pandemics. High dimensional data introduce several problems for machine-learning algorithms: (1) reducing model accuracy, (2) high computation (3) increasing memory requirements, and (4) increased difficulty of visualization which is necessary for decision making. The iResponse framework consists of feature selection algorithms based on machine-learning which can be applied to enhance drug discovery [152], the efficiency of treatments, etc.

7.8. Data Visualization

For decision-making, infographics, charts, plots, graphs, and maps play an important role as they summarize and visualize the findings. The iResponse framework uses dashboards, which can display multiple visualized results in a single system. This gives an ultimate view of the situation for enhanced decision-making. We depict a scenario in Figure 13 with information gathered from the iResponse framework on a dashboard which gives a holistic view of the current situation, and thus, enhances decision making, and helps us to make more informed decisions.

8. Data Centers

The aim of the “Data Storage and Management (DSM)” module is to manage big data and its storage, preparation, and provisioning. It can be located remotely (cloud), locally (edge), or somewhere in the middle (fog). The DSM module will power the DADM module’s algorithms with data. Traditionally, the healthcare system has limited IT infrastructure and computing resources. Therefore, scalability is always an issue and a time-consuming task. The DSM module is also a platform for researchers, doctors, and policymakers where data and resources can be shared. It allows healthcare workers to enter data with a click from anywhere at anytime. For example, a healthcare worker records onsite test data of a resident. These data centers are highly fault-tolerant systems. They are distributive and support parallel computing. The cloud computing data center plays a vital role today in our fight against COVID-19. For example, IBM introduced a drug treatments cloud application based on AI for researchers [153], AWS facilitating diagnostic tools [154], and recently Oracle introduced a cloud-based clinical trial system for rapid vaccine development [155]. In the iResponse framework, a variety of data will be sensed and recorded from diverse sources. For example, for sentiment analysis, unstructured data storage is required, whereas for travel itinerary and EHRs, structured and semi-structured data storage are required. The round the clock availability is important to keep updated of the ever-changing situation which is the target of the iResponse framework through cloud data centers.

9. Integration Benefits

Today we have technologies; however, they all lack integration that is visible in COVID-19 exponential growth. Without integration, coordinating different activities at a huge level is a difficult task. Poor coordination results in poor outcome [156]. The core idea behind the iResponse framework is to have integration among various systems for pandemic management and controlling. For example, Figure 14, which is self-explanatory, highlights why integration is important. The need is to have a holistic view of all sub-systems as one system to manage and control any future outbreaks of highly infectious diseases. We cannot achieve this until information sharing is made mandatory during these critical times so when the world faces a post-COVID-19 pandemic, it is ready to exploit sophisticated technologies to their limits [66].

10. iResponse: Devising Optimal Strategies for Triple Bottom Line (TBL) and Other Strategic Goals

We mentioned earlier that iResponse is a framework for autonomous pandemic management, allowing pandemic-related monitoring and policy enforcement, resource planning and provisioning, data-driven planning and decision-making, and coordination across these areas. The framework comprises five modules: MBC, CDT, RP, DADM, and DSM (see Section 3). The DADM (Data Analytics and Decision Making) is a key module in the framework because it is the brain of the framework and provides data analytics and decision-making services using cutting-edge AI and other scientific methods. We provided two case studies in Section 4 to elaborate on the different functionalities of the iResponse framework and how the framework can be implemented. In Section 4.1, we presented a sentiment analysis case study that could be used by the authorities to understand how seriously the public has perceived the COVID-19 situation and accordingly form appropriate pandemic management policies and strategies. In Section 4.2, we presented a case study on the recognition of human activities such as walking, playing, etc., which could be used by the authorities to monitor people’s whereabouts and activities to know, for example, how seriously people are following the pandemic measures. These two case studies were part of the Monitoring and Break-the-Chain (MBC) module.
This section provides four case studies to further elaborate the functioning of the iResponse framework and how it can be used for pandemic management. The first and the last case studies are related to health and social sustainability (Section 10.1 and Section 10.4). The second and third case studies are related to economic sustainability (Section 10.2) and environmental sustainability (Section 10.3), respectively. We use deep learning and other methods to show how to develop optimal strategies for pandemic management using various data. Table 2 lists the various features that we have used in the four case studies. These features and the datasets for these features will be explained later in the relevant sections. Figure 15 gives a pictorial account of a broad methodology for developing optimal strategies for sustainable pandemic management. The left of the figure shows various features that can be extracted from different datasets (there can be many other features and datasets) and ingested by various deep learning models to predict strategic goals for a given set of pandemic measures and other contextual factors. An example of these strategic goals includes a pragmatic maximum number of COVID-19 cases that the authorities wish to obtain by a given time in the future. These goals can be used to devise optimal strategies (the use of a specific set of pandemic measures and financial incentives for people and industry, etc.) for pandemic control. These optimal strategies can be evaluated for their Triple Bottom Line (TBL) impact. The improvement loop could be implemented until optimal strategies are found and could continue dynamically and perpetually. The devised strategies can be implemented through external systems and organizations.
Note that these case studies are not supposed to be implemented as part of the Data Analytics and Decision Making module alone. All of the five modules of the framework are expected to work together to provide effective solutions for social, environmental, and economic sustainability. Our aim of developing the iResponse system is to provide solutions that meet the TBL and requirements. We hope our proposed approach will motivate the design and adoption of holistic pandemic management systems that will be an integral part of other national operational systems, which in turn will be connected globally. Such an approach will allow us to better prepare for future pandemics with predicted warnings, allowing improved resilience for social, economic, and environmental sustainability.
Note also that the topics covered in this section—TBL, mobility, pandemic measures, economic activities, public happiness levels, air quality levels, and more—are complex topics. A detailed understanding of the topics and their modelling is outside the scope of this work. Our intention in this paper is to give some ideas or proof of concepts for modelling sustainability and other goals and for devising optimal strategies to manage a pandemic. Each of these topics requires many research efforts per se and we plan to extend some of the directions and also open this to the community for further investigations.

10.1. Case Study I (Health and Well-Being: Controlling COVID-19 Cases)

We mentioned in Section 1 the good practices used by various countries to contain COVID-19 cases. These include physical distancing, quarantines, lockdowns, curfews, providing sanitizers, and contact tracing. The importance of using appropriate pandemic measures could be seen in the extreme variations in the number of cases and deaths across countries around the world (compare New Zealand with the U.S., for instance). This section presents a deep learning-based case study on computing the relative impact of different pandemic measures on the number of COVID-19 cases. This allows predicting the number of COVID-19 cases for a given set of pandemic measures and devising optimal strategies for health and well-being (see Figure 15). We have used real data for twenty countries around the world for the case study.

10.1.1. Methods to Model and Manage Epidemics

We use here the World Bank COVID-19 dataset [75]. It consists of over fifty variables. These variables could be used for COVID-19 related studies. From these variables, we used 12 variables that are related to pandemic measures. We call them pandemic measures henceforth. The dataset contains the daily pandemic measures and the number of COVID-19 cases (the 13th variable) for almost all the countries in the world. The period of the dataset is 15 January to 18 July 2020. The titles of these pandemic measures are listed in Figure 16 along with the various options that were defined for these pandemic measures. For example, the first pandemic measure listed on the top left of the figure is “School Closures”. The various options for this pandemic measure are to take no measures, recommend closing the closing the school (but do not enforce), enforce closing the schools but for some levels, and enforce closing schools for all levels.
We selected twenty countries from around the world from various continents and modelled the impact of the 12 pandemic measures on the number of COVID-19 cases in each country. We modelled this problem as a multiple regression problem such that we can understand the relationship between the 12 pandemic measures and the number of COVID-19 cases and predict the number of cases. We used a deep feedforward neural network with 100 epochs and two hidden layers with 64 neurons in each. This deep neural network enables us to predict the number of cases and the relative impact of the features (in this case, the pandemic measures are the features). The relative impact, in this case, signifies to what extent a pandemic measure is impacting the number of daily cases. From the iResponse perspective, it answers some of the very critical questions needed to develop a sustainable and dynamic pandemic solution such as the following. What options (see Figure 16) for pandemic measures could increase the daily number of new COVID-19 cases? What pandemic measures are likely to reduce new infections? What pandemic measures and options are suitable for a particular country, city, region, or neighborhood?
The relative impact is calculated as the feature importance that signifies the features that are relevant and to what extent. To elaborate considering the case study under discussion, we calculate to what extent (i.e., relative to features) a pandemic measure (a feature in this case) is impacting the number of daily cases, i.e., how significant is this variable (or feature or pandemic measure) in predicting the response variable (the number of cases). The variable importance is relative to the other variables in the model and hence relative. We predict here the number of cases using deep neural networks and then calculate the feature importance; therefore we call it the relative impact of the pandemic measures.
We have used the h2o [157] package in R that implements deep learning and uses the Gedeon method [158]. The Gedeon method is a widely used method for the computation of feature importance that we use here to calculate the relative impact of pandemic measures and other features [159]. The Gedeon method [158] is an extension of the work by Wong et al. [160] and has been widely used in the literature for the purpose in various application domains [159]. We briefly explain it below.
To calculate the relative impact of a pandemic measure or other features, the total contribution of the ith input is calculated by Equation (1) as follows.
q i = j = 1 G Q i j p = 1 G Q p j
In Equation (1), Q i j , the contribution of the ith input (a pandemic measure) to the jth output (the number of cases) is calculated by Equation (2) as follows.
Q i j = k = 1 K P i k × P k j
where K is the number of hidden layer neurons, P i k is the contribution of the ith input to the kth neuron of the hidden layer, and P k j is the contribution of the kth neuron of the hidden layer to the jth output; these two contributions are calculated using Equations (3) and (4) as follows.
P i k =   W i k p = 1 G W p k
P k j =   W k j r = 1 K W r k
In Equations (3) and (4), G is the total number of inputs, and W p k are the weights that link the neuron couples corresponding couples of neurons (same applies to W r k and other weights).

10.1.2. Results and Analysis (Health and Well-Being)

Figure 17 shows the relative impact of the 12 pandemic measures on the daily number of COVID-19 cases for twenty countries around the world. The pandemic measures are country specific. We note in the figure that the various pandemic measures have different levels of impact on the number of cases. For example, Canada, Germany, Taiwan, and South Korea did not close transportation during the lockdowns. However, the closure of schools, workplaces, and gathering restrictions had a larger impact on the increase or decrease in new daily COVID-19 cases. In India, which is a highly populated country, the pandemic measures, Close Public Transport and Restrictions on Gathering, had the highest impact on the number of cases (we do not consider the Stringency Index in this discussion because as mentioned earlier, the Stringency Index is computed using ten pandemic measures; see Figure 16). This makes sense because of India’s large and high-density population. In Sri Lanka, which is a relatively small country but with a similar population density as India, School Closures (same as India) and Restrictions on Gatherings had the highest impacts. In Taiwan, International Travel Restriction and Contact Tracing had the highest impact on controlling the number of new COVID-19 cases. Note that the level of impact of these two pandemic measures is higher than the other countries, which may be related to the fact that Taiwan was ranked the top country in managing the COVID-19 pandemic [32]. The variations in the impacts of the various pandemic measures show that a single lockdown approach for all the countries will not work and it has to be specific to the local environment and other factors. Indeed, the lockdown approach would be specific to cities and neighborhoods. The pandemic has also shown that a flawed pandemic measure strategy could create chaos in a country, socially and economically, such as India’s biggest migration crisis in recent history [161,162,163].

10.2. Case Study II (Economic Sustainability)

The COVID-19 pandemic has gravely affected the financial situation of individuals and countries around the world. The World Bank has reported a forecast that COVID-19 will cause the global economy to plummet into the worst recession since World War II [164]. Countries around the world have used different measures to address the affected citizens and the weakening economy. These measures include providing stimulus packages to citizens, SMEs, and other businesses; support policies for mortgage holders to avoid losing their homes; easing monetary policies; wage subsidies and other support plans for controlling unemployment; free childcare for all; and overcoming racial, poverty-related, and other inequalities (see Section 1). The importance of selecting appropriate economy-related measures is evident from the vast variation in economic policies of different countries and the impact of these policies on citizens, their satisfaction, and on national economies. This section presents a case study on methods to manage economic sustainability. Specifically, we compute, using deep learning, the relative impact of different mobility features and pandemic measures on economic activity in 17 different economic domains in the U.S. This allows for the prediction of the economic activity for a given set of pandemic measures and mobility features, and the devising of optimal strategies to improve economic activity (see Figure 15). We used three real datasets for this case study.

10.2.1. Methods to Model and Manage Economic Activity and Sustainability

We aim, here, to understand economic activity in relation to other environmental parameters such that it could enable devising optimal strategies for economic sustainability. To demonstrate this, we select three real-life datasets and model their relationship using deep learning. The first dataset is the Google COVID-19 mobility report dataset [76]. This dataset consists of six mobility features recorded during COVID-19, such as retail and recreation, grocery and pharmacy, parks, transit stations, workplaces, and residential areas. These features are listed in Table 2. For further details of the dataset, see [76]. The second dataset is the card transactional data recorded between the period of 15 February to 31 May 2020 by the U.S. Bureau of Economic Analysis (BEA) (see [77], for details). The BAE dataset contains 17 different types of card transactions, each of these represents a specific type of economic activity. We refer to them as Card Spending (to emphasize the economic activity aspects of this data) and have listed them in Table 2. The third dataset is the World Bank COVID-19 dataset [75] that we have already used in the case study in Section 10.1. We have used these three datasets to study three different aspects of economic activity.
Firstly, we modelled the problem described in the previous paragraph as a multiple regression problem such that we can understand the relationship between the six mobility features and economic activity using card spending in 17 different domains and predict economic activity in terms of the card spending in the 17 areas. We used a deep feedforward neural network with 200 epochs and two hidden layers with 128 neurons in each. This deep neural network enables us to predict economic activity and the relative impact of the six mobility features. The relative impact, in this case, signifies to what extent a mobility feature is impacting the economic activity in the 17 domains.
Secondly, we model the pandemic measures data from the World Bank COVID-19 dataset [75] and the BEA dataset [77] as another multiple regression problem to understand the relationship between the 12 pandemic measures and the economic activity in 17 different domains. This model enables us to predict economic activity in terms of card spending in the 17 areas in relation to the 12 pandemic measures and the relative impact of these pandemic measures. The relative impact, in this case, signifies to what extent each of the 12 pandemic measures is impacting the economic activity in the 17 economic domains. The deep neural network is the same as in the first model specified in the previous paragraph.
Thirdly, we compute the correlation matrices of the six mobility features and 12 pandemic measures with the 17 card spending domains using the cor() function of the stats package [165] in R.

10.2.2. Results and Analysis (Economic Activity and Sustainability)

Figure 18 shows the relative impact in percentage of the six mobility features on the economic activity in the 17 card spending domains. The mobility data gives us information about the mobility of people in six different areas while the card spending data provides us with information about the economic activity in the 17 domains (see Table 2 for the names of these parameters). Note in the figure that the various mobility features have different levels of impacts on the card spending in each of the 17 domains. For example, the Retail and Recreation (MF04) mobility feature has a maximum relative impact on card transactions (spending) in almost all card spending domains (represented by the yellow bar in the figure).
In other words, the mobility in the Retail and Recreation had the highest impact on the economic activities in almost all of the 17 economic activity domains. This could imply that a lower activity or mobility in Retail and Recreation could be among the strong causes of the decline in the U.S. economy (the USA economy declined by 9.5% in the April–June quarter [166]). This information could be used to develop optimal strategies for economic sustainability (see Figure 15).
Figure 19 shows the relative impact in the percentage of the 12 pandemic measures on the economic activity in the 17 card spending domains. The pandemic measures data has already been explained in the previous section. Note in the figure that the various pandemic measures have different levels of impacts on the card spending in each of the 17 domains. Overall, Gathering Restrictions (PM05) has the highest relative impact on card-based financial transactions in the USA. This could imply that Gathering Restrictions is among the strongest causes of the decline in the U.S. economy. This information could be used to develop optimal strategies for economic sustainability.
Figure 20 plots the correlation matrices of pandemic measures (left) and mobility features with card spending domains. Note that some features and card spending domains show a very high positive (blue) and negative (red) correlation with each other. Comparing Figure 19 and Figure 20, note that PM05, mostly, has a high positive correlation with other pandemic measures but has a high negative correlation with most of the card-based financial transactions. It implies that PM05 (Gathering Restrictions) weakens the economic activity in the given domains. Note also in Figure 20 that MF03 (Residential) has a negative correlation with other mobility features (MF01, MF02, MF04–MF06) indicating that high mobility in residential areas has a negative correlation with mobility in the other areas. Moreover, MF03 also has a negative (mild to strong) correlation with most of the card spending domains, revealing that high mobility in residential areas weakens the economic activity. These mobility features and pandemic measures can be used to predict card-based financial transaction patterns. This can help the governments to form policies, which are socially and economically sustainable during COVID-19 and other pandemics; see Figure 15.

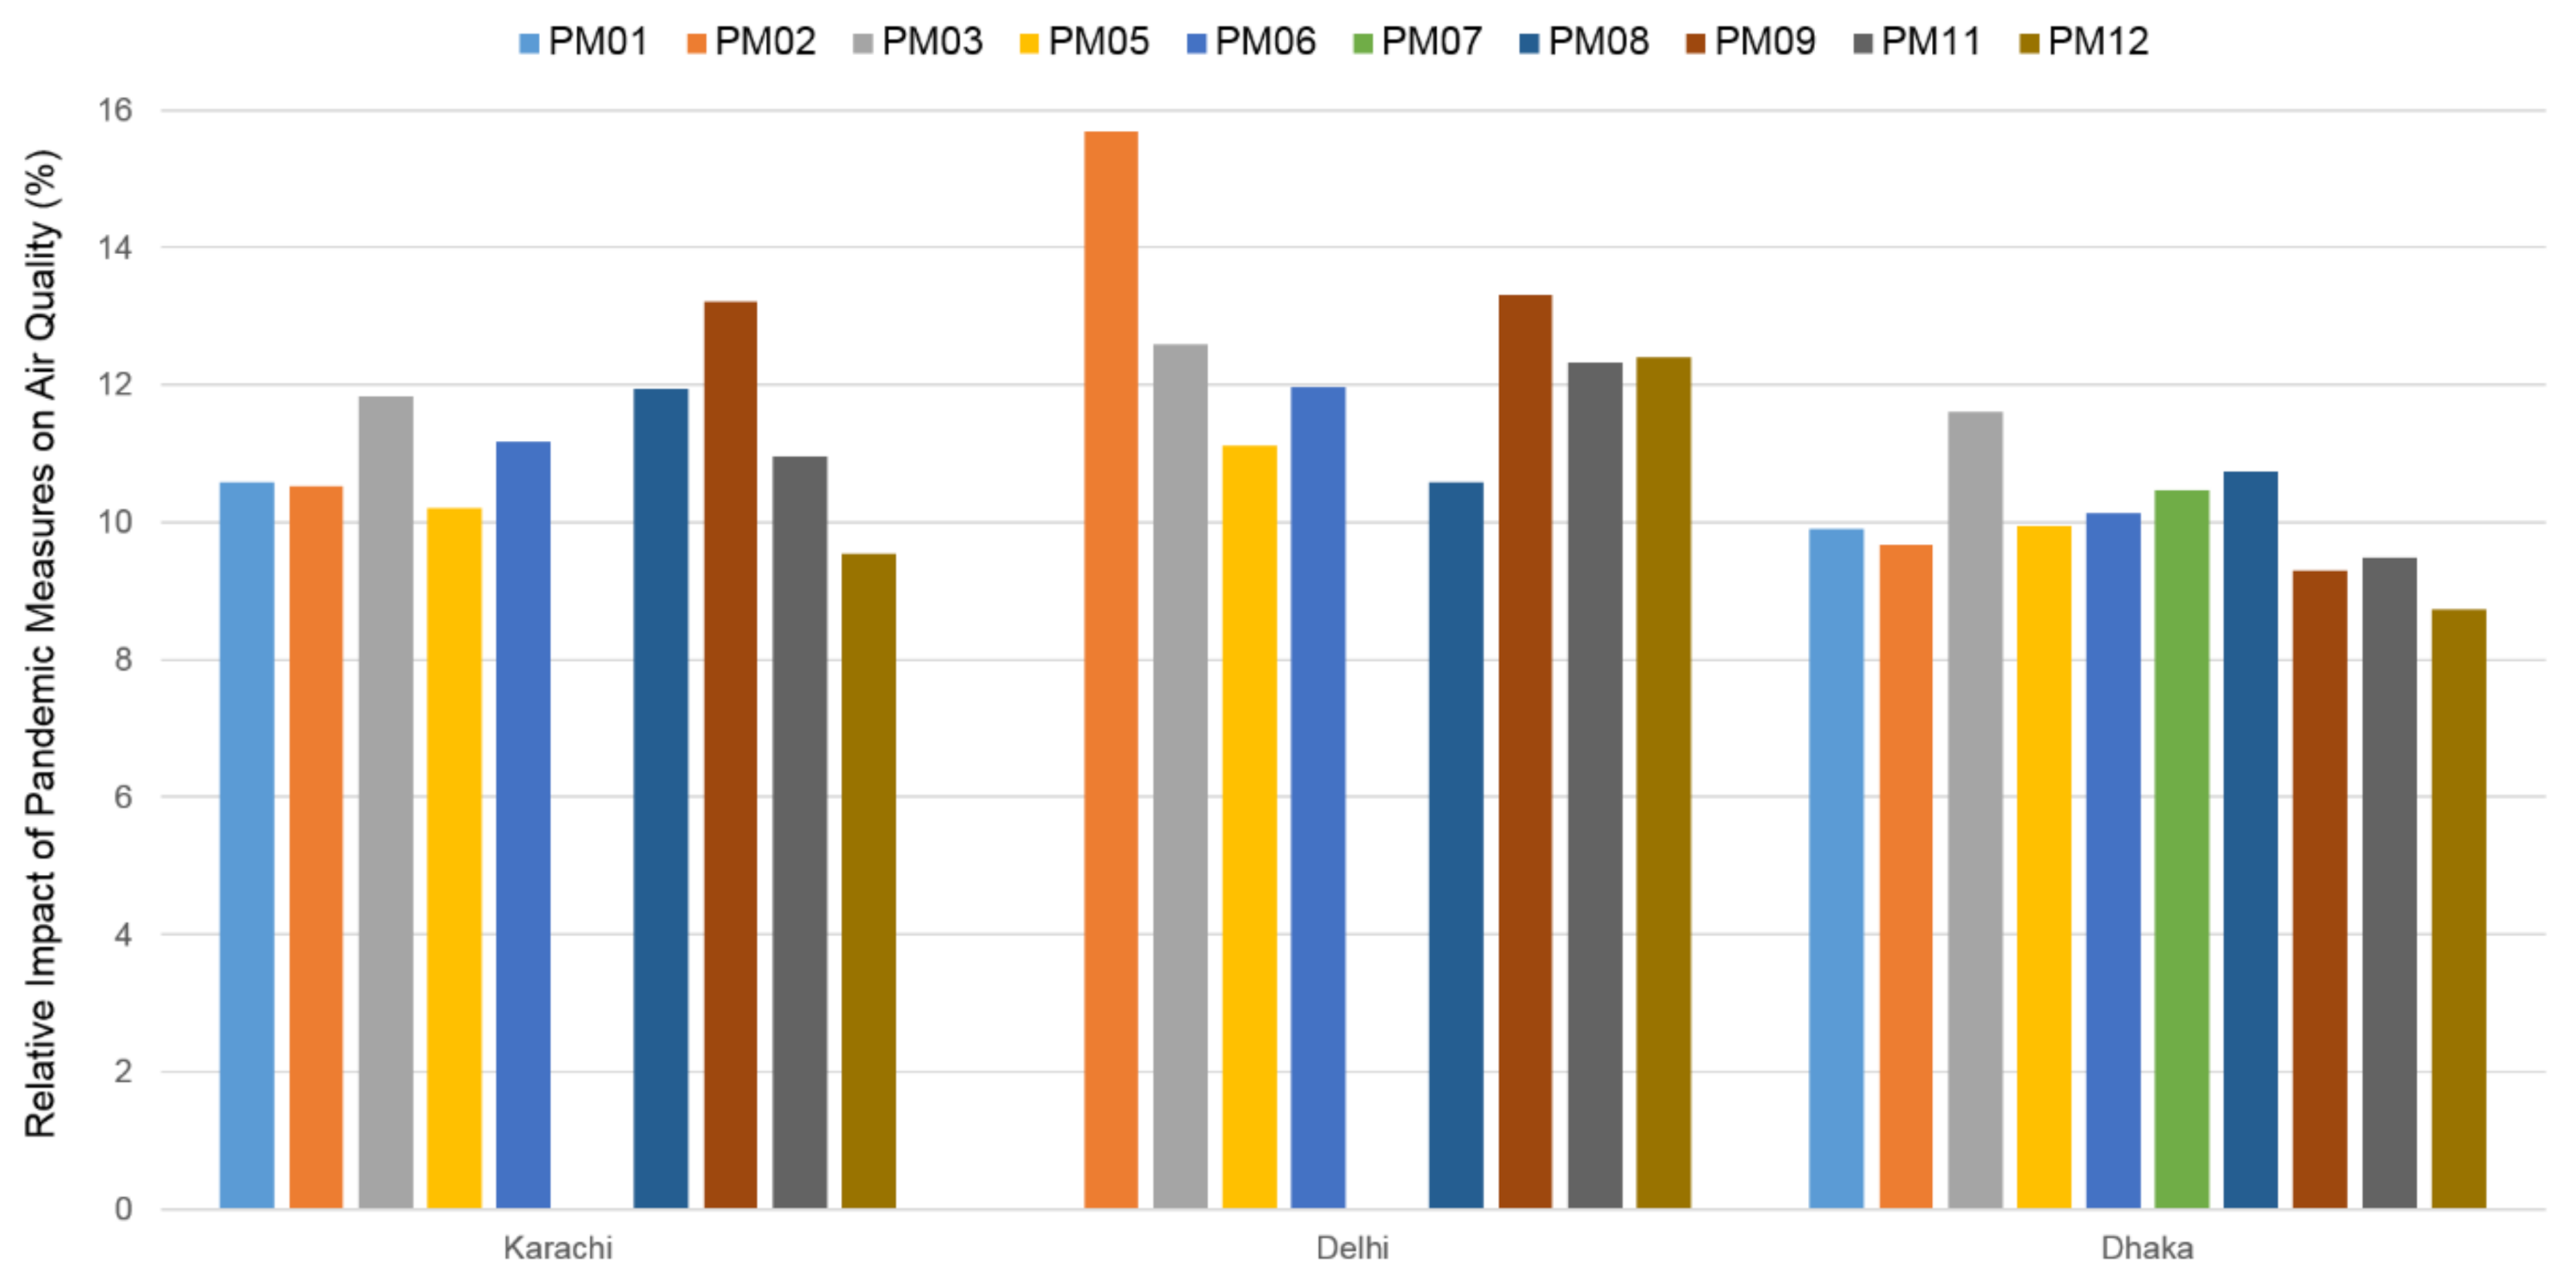
10.3. Case Study III (Environmental Sustainability)

Environmental sustainability is of paramount importance as it relates to our survival. It has recently been high on the global agenda. The ecological conditions of the planet have direct and indirect effects on people’s health and well-being, and these have been linked with the growing number and severity of various pandemics around the world. Moreover, the COVID-19 pandemic has created both positive and negative effects on the planet. This section presents a case study on methods to model and manage environmental sustainability. Specifically, using three real datasets, we use deep learning to compute the relative impact of different mobility features and pandemic measures on air quality levels in three of the most polluted cities in the world. This allows broadly predicting the air quality for a given set of pandemic measures and mobility features and devising optimal strategies to improve ecological conditions (see Figure 15).

10.3.1. Methods to Model and Manage Environmental Sustainability

We aim, here, to understand our earth environment in relation to other parameters (e.g., pandemic measures) such that it could enable devising optimal strategies for environmental sustainability. We used three datasets for this purpose. Two of the three datasets are the World Bank COVID-19 dataset [75] and the Google COVID-19 mobility report dataset [76]. These datasets were used in the economic sustainability case study in the previous section (Section 10.2.1). For the third dataset, we used the ropenaq package in R and the OpenAQ API [78] to access the air quality data. This dataset contains all major air quality measures used in the Air Quality Index (AQI) including PM2.5, PM10, SO2, NO2, O3, CO, and BC [78]. Our focus here is to show an example proof of concept on how iResponse can be used to develop strategies to manage or consider environmental pollution while optimizing other objectives. Moreover, this paper needs to be kept within a certain page limit. We, therefore, consider modelling one air quality measure, the Particulate Matter 2.5 (PM2.5), which refers to atmospheric PM with diameter less than 2.5 micrometers and are considered important pollution indicators. It is one of the most lethal pollutants in the air as proved by several studies and it is believed to potentially increase the COVID-19 infection rate [167,168]. We used day-wise PM2.5 data for the years 2019 and 2020 to compare pre-COVID-19 (2019) and COVID-19 times (2020) air quality levels. The specific time periods for 2019 and 2020 are between 15 February and 31 August. These time periods are based on the availability of the data for the three cities that we have considered in this case study. The cities are Karachi, Delhi, and Dhaka. We selected these cities because they are among the top polluted cities in the world [169]. We used the three datasets to study four different aspects of environmental sustainability.
Firstly, we compared the PM2.5 levels of the three selected cities for 2019 and 2020 to highlight the differences between the pre-pandemic and pandemic times. Secondly, we developed a multiple regression model to understand the relationship between the six mobility features and the environmental condition using the 2020 PM2.5 data and predict environmental conditions in terms of the PM2.5 levels in the three cities. As in the economic activity case study, we used a deep feedforward neural network with 200 epochs and two hidden layers with 128 neurons in each. This neural network enables us to predict environmental conditions and the relative impact of the six mobility features. The relative impact, in this case, signifies to what extent a mobility feature is impacting the environmental conditions.
Thirdly, we model the pandemic measures data and the PM2.5 data as another multiple regression problem to understand the relationship between the 12 pandemic measures and the environmental conditions. This model enables us to predict the environmental conditions in relation to the 12 pandemic measures and the relative impact of these pandemic measures on the environmental conditions. The relative impact, in this case, signifies to what extent each of the 12 pandemic measures is impacting the environmental conditions in the three selected cities. The deep neural network is the same as in the first model specified in the previous paragraph. Fourthly, we compute the correlation matrices of the six mobility features and 12 pandemic measures with the environmental conditions using the equations given in Section 10.2.1 on economic activity.

10.3.2. Results and Analysis (Environmental Sustainability)

Figure 21 plots the concentration of PM2.5 during the same time periods of 2019 and 2020. As mentioned earlier, the time periods are different for each city due to the availability of the data. The 2020 data are plotted using blue bars while the 2019 data are plotted using the orange line plot to avoid overlapping of bars and have clarity. The plots show that the PM2.5 air quality levels are better in 2020 compared to 2019 (also see the mean values given in the figure). The better air quality in 2020 is likely due to the lower levels of activities in industry, transportation, etc. The drop in the PM2.5 levels during the summer periods could be, among other reasons, due to the Monsoon season in Delhi, as highlighted in [170,171,172].
Figure 22 shows the relative impact in the percentage of the six mobility features on the environmental conditions (PM2.5 here) for the three cities. The mobility data gives us information about the mobility of people in six different areas (see Table 2) while the air quality data provides us with information about the environmental conditions. Note in the figure that the various mobility features have different levels of impacts on the environmental conditions in the three cities. The mobility features MF04, MF02, and MF05 have the highest impact on air quality in Karachi, Delhi, and Dhaka, respectively.
Figure 23 shows the relative percent of impact of the 12 pandemic measures on the ecological conditions in the three selected cities. The pandemic measures data have already been explained in the earlier sections. Note in the figure that the various pandemic measures have different levels of impacts on the ecological conditions in the three cities, Delhi showing, among the three, the highest differentials across the pandemic measures. Looking closely at Delhi, PM02 (Close Public Transport) has the highest relative impact on PM2.5. The other pandemic measures have a more or less similar impact on PM2.5 in Delhi, though PM09 is slightly higher than the other pandemic measures.
Looking closely at Karachi where MF04 had the highest impact on PM2.5 levels, a conforming behavior can be found in Figure 24, where MF04 and PM2.5 have a correlation coefficient of 0.15, implying that an increase in Retail and Recreation causes an increase in PM2.5 levels in Karachi. However, note that in Karachi, the differences in the impacts of the mobility features are small, and the same is visible in Figure 24 where the correlations between the six mobility features and the PM2.5 levels have small differences. MF03 (Residential) has a negative correlation with PM2.5 but a low correlation value, and it is in agreement with Figure 22 because it only tells us about the relative impact and not whether it is directly or indirectly proportional. Note that a higher residential activity can be seen as less mobility and other activities, and hence results in lower levels of PM2.5.
Looking closely at Delhi, the mobility in Parks (MF02) and Retail and Recreation (MF04) witnessed the most changes from the baseline during the specified period. Relating the MF02 impact on PM2.5 levels in Figure 22 with the correlation matrix in Figure 24, we note that MF02 has a 0.1 correlation with PM2.5. This shows that higher mobility in parks (more people visiting parks) is directly proportional to the PM2.5 levels in Delhi, though the low correlation value indicates low proportionality. On the other hand, the correlation between MF04 and PM2.5 is −0.21 which indicates inverse proportionality, though to a smaller extent (compared to the highest −1.0). This could be due to MF04 causing a reduction in other mobility activities which cause higher PM2.5 levels.
For Dhaka, MF05 (transit stations) show the highest impact on PM2.5. Investigating this with correlation data in Figure 24, MF05 and PM2.5 have a correlation coefficient of 0.41 and shows a similar behavior in that an increase in transit station mobility increases the PM2.5 levels in Dhaka.
Comparing Figure 23 with Figure 24, we note that all of the pandemic measures have a mild positive or negative impact on the PM2.5 levels in Delhi and Karachi (with some differences). However, the situation in Dhaka is very different with very strong positive correlations between different pandemic measures (see blue color all around the figure except the last column) and a fairly strong negative impact of all pandemic measures on the PM2.5 levels (see orange and red colors in the last column). The dynamics of these variations of course are very complex. Various cities around the world, including the three selected cities here, have implemented different sets of pandemic measures with different combinations over time. For example, Delhi had many variations over time in implementing various pandemic measures, the situation of pandemic measures implementation in Karachi was very erratic, while Dhaka seemed to have a very consistent and coordinated approach toward implementing pandemic measures. The PM2.5 levels, even in normal times, have a very complex behavior including a drop in PM2.5 levels during the Monsoon season in Delhi [170,171,172]. To elaborate and conclude, removing restrictions on public transportation measures may not increase PM2.5 levels if the restrictions on public gatherings and movements are still in place due to a lower public interest in travelling. Moreover, the correlation values change with the time based on the combinations of pandemic measures and other factors (we have noted correlations between MP2.5 and PM09 changing from negative to positive over time).
Moreover, we tested the significance of the correlation coefficients using p-values, using the t distributions with n 2 degrees of freedom for the significance level, α = 0.05 ). The test statistic is calculated by Equation (5) as follows:
t = r n 2 1 r 2
where the correlation coefficient is denoted by r, and n is the total number of the data items. In Figure 25, statistically significant values of the correlation coefficient between a pair of features are shown in green, and statistically non-significant values of the correlation coefficients are shown in orange. For computing the above, we used the Hmisc package [173] in R. Note in the figure that most of the values are in green, indicating that most of the values are statistically significant. We have indicated the values in the figure with three decimal places due to the space constraints in the matrix cells. Many of the values are smaller than 0.0001 and are written as 0.000.
Note that the purpose of the case studies in this section (Section 10) is to demonstrate how the iResponse Framework can be used for pandemic management, particularly addressing social, economic and environmental sustainability. We used deep learning and other methods to show how to develop optimal strategies for pandemic management using various real-life data. We did not intend to introduce new deep learning or statistical methods, but rather to show that existing and well-known methods can be used for the purpose such as the use of deep learning to compute the relative impact of different pandemic measures on the number of COVID-19 cases that could allow predicting the number of COVID-19 cases for a given set of pandemic measures and devising optimal strategies for health and well-being. Similarly, the use of the correlation matrix was to show the use of basic statistical methods to validate that various pandemic measures and other features were correlated and were in agreement with the deep learning results.
The correlations given in this section are for the whole time period, so these changes are not visible. Giving time-based correlations of features and outputs will require substantial space and is not the focus here. These dynamics between the various pandemic measures and ecological conditions need to be investigated by the experts in the related fields and could be incorporated into automated pandemic management tools. Our future work will investigate it.

10.4. Case Study IV (Social Sustainability)

The COVID-19 pandemic and the resulting government measures across the world have severely affected us in many ways. While many people are able to spend quality time with their family members during lockdowns, many in the working classes have lost their jobs or suffered salary cuts that affected their financial capabilities and adversely affected the prosperity of their families. Social interactions and connections play a vital role in the happiness of individuals and sustainable development [79]. There has been an overall decline in people’s mobility and physical interactions due to various lockdown measures as well as peoples’ fear of getting infected with COVID-19 by others. For example, Greyling et al. [174] analyzed people from South Africa, New Zealand, and Australia during the lockdown and found a close relationship between the duration of lockdown and a decline in happiness of individuals, with severe stay-at-home measures causing a severe decline in happiness. The impact of COVID-19 on the workload, social interactions and shore leave of seafarers are discussed in [175]. In another work [176], an employee-centric happiness index analysis during COVID-19 is reported. The results show that the happiness scores had dropped to 5.8 by late April from 7.6 in late March 2020. Employees were found to be more uncertain, stressed, depressed, and emotionally weak. In short, various factors have contributed to the decline in happiness levels among individuals, affecting social sustainability.
Social sustainability, while an overlooked topic, is perhaps the most important of all due to it being related to us and touching on areas such as human rights, social justice, health equity, and many more. This is a complex topic involving politics, culture, and economics and can be modelled in different ways to understand its various dynamics. A detailed understanding of the topic is outside the scope of this work. Our intention in this paper is to give some ideas or proof of concepts for modelling sustainability and other goals and for devising optimal strategies to manage a pandemic. We discuss here some possibilities on the subject.
One way of measuring social sustainability is by understanding the collective happiness of society. Figure 26 plots happiness measured by six happiness factors (or features to be used in AI models) for the year 2019. The features are GDP per Capita, Social Support, Healthy Life Expectancy at Birth, Freedom to Make Life Choices, Generosity, and Perceptions of Corruption (see Table 2). The data for these have been taken from the World Happiness Report [79] which has produced annual happiness reports since 2012. The World Happiness Report 2020 ranked 156 countries based on the happiness perceived by their citizens. The 2020 report also ranked cities based on people’s well-being. It also discussed the impact of natural, urban and social environments on people’s happiness. The reports series is based on a range of data sources, including the Gallup World Poll, as a key source. Since the report for 2020 is produced using 2019 data, the data for 2020 will not be available until 2021. However, the use of 2019 data shows an example of data modelling and computing people’s happiness as a means of social sustainability. This data is not real-time; however, we believe more efforts in the future in these directions will produce real-time or instantaneous measures of people’s happiness and social sustainability.
Furthering our discussion on real-time or instantaneous reporting and management of people’s happiness, we note that social media has the potential to provide data for this task. Particularly, micro-blogging platforms such as Twitter have been used to detect events, emotions and other important information from online social interactions at a much faster pace and in higher detail compared to the data collected from other means of surveying. A particular benefit of collecting sentiments and other information from these sources is that they avoid the natural biases that happen due to targeted surveys. Twitter and other social media have been used during the COVID-19 pandemic to extract important information. For example, a study on detecting COVID-19 related stress symptoms in the U.S. using Twitter data has been reported in [177]. Such studies clearly show the potential of developing surveillance systems for monitoring and managing happiness and social sustainability. Future work will investigate adding such functionalities in the iResponse system.

11. Challenges

The iResponse framework and applications which can use the knowledge gained meticulously to form intelligence to enhance decision making, face several hurdles. We discuss in this section several challenges, including those mentioned in [66], that any future system needs to overcome to manage and control any epidemic or pandemic successfully.

11.1. Lack of Data

Data play a critical role in answering some of the most important and complex questions which the human race faces during an infectious disease outbreak like COVID-19, regarding how infections occur, how infection evolves, how infection can be controlled, what are the promising treatments, and how to develop a drug and vaccine.
AI is a mighty tool that can learn from hidden insights acquired from mounds of data. However, an important question arises; where is this data? For example, in the COVID-19 case, only publicly available datasets that are time series forecasting and social media related datasets on the WHO, World Bank, Kaggle, Google, AWS, and GitHub websites are found [178]. If we have a closer look at these datasets, we will find that these datasets can answer a small array of questions only. However, the data which can be critical to manage and control the COVID-19 pandemic are only limited to hospitals, government agencies, and research centers. This limits research and development on a large scale. Research labs, governments, and hospitals must provide timely data access to the public to speed up our efforts and enhance our chances to understand COVID-19 and to develop possible ways to control it in a better manner.

11.2. Lack of Integration

During times of the swine flu, SARS, and Ebola, there was very limited use of technology. This is not the case with the COVID-19 pandemic. Around the world, countries use AI, IoT, and GPS applications to manage and control one or more aspects of COVID-19 through them. Some examples are: (1) Arogaya Setu, developed by India to inform citizens [179] of possible infected people near them, and (2) BlueDot which predicts health outbreaks [65]. These applications serve scattered objectives, which limits their success. For the COVID-19 pandemic or any pandemic, in the future, we need more cohesion, a centralized aim, which is the outcome of the integration of multiple technologies, and objectives to serve a common aim.

11.3. Government Unwillingness

The decision making of most of the countries in managing COVID-19 is vulnerable to the fears of the outcome. As a result, they took much time to respond or showed an unwillingness to take prompt decisions regarding lockdowns, stopping flights, etc. For example, Italy and the U.S. were late to realize the dangers of the COVID-19 pandemic, and India saw the worst migrant crisis in its history post-independence during lockdowns. On the other hand, several countries in the world are interested in recording manufactured data, which hinders effective policymaking. The reasons for this are related to the economy, lack of political will, and fear of losing. Countries need to show transparency in data sharing and decision-making so that it is easy to understand the current situation and to make better policies for managing and improving pandemic response.

11.4. Digitally Born Data and Interdisciplinary Research: Dilemmas, Limitations, and Solutions

In this paper, we proposed a technology and data-driven framework for autonomous pandemic management. The framework is an interdisciplinary one and encompasses several functions, namely pandemic-related monitoring and policy enforcement, resource planning and provisioning, data-driven planning and decision-making, and coordination across these areas. We have described the framework design in detail and several use cases of the proposed framework, such as those related to the Triple Bottom Line which were developed and presented in the earlier sections. The proposed framework incorporates cutting-edge digital technologies and methodologies and offers immense potential for innovation.
Technology and interdisciplinary and digital methods of data collection and curation have increasingly become vital ingredients of research, both qualitative and quantitative. This is because of the prevalence of personal devices that allow real-time interaction with the stakeholders and collection of location, activity, preferences, opinion, and other data. Traditional methods of research and data collection using surveys and other means cannot capture timely, course-grained, dynamic, and large-scale data, in addition to having other disadvantages [177,180]. Therefore, it seems inevitable that digital and emerging technologies will become part of the existing research and data collection methodologies and will be included in research design and methodology curricula.
However, despite the success and the unimaginable potential of digital research and data collection methods, it is important also to consider the risks, dilemmas, and limitations of digitally born data and interdisciplinary research; some of these are discussed below.
Data ownership, security, and privacy are among the most critical issues in digital research and practice [181,182,183]. Many types of invaluable and personal data are being collected by digital research methods, governments, and industry using technologies such as AI, IoT, GPS, surveillance-camera, and electronic health records [184,185]. The question of data ownership [186,187,188,189] has been the subject of very many debates but without reaching globally satisfactory conclusions [190]. Data is usually stored in digital systems such as public, private, or hybrid clouds that are prone to security breaches [191,192,193,194]. The organizations collecting data have their own definition of data privacy and based on those definitions, the data may be used in ways that are not preferred by the originators of the data. The data held by a company may get used in a way that produces an impact that was not intended by the organization but causes harm to the data originators or owners. The organizations collecting data may also be selling or sharing the data with other parties. The fight against COVID-19 has exacerbated the challenges related to protecting individuals’ privacy. For example, several major concerns have been raised against quarantine-related tracking and other applications around the world that are increasingly being made mandatory for government and private sector employees or even for all citizens in some countries. These privacy issues must be addressed with supportive facts to give users assurance that their privacy is fully respected and protected [195]. Governments around the world and the international community must work together to develop policies and instruments to protect individuals’ privacy while managing pandemics. Some of our earlier works [196,197,198] have investigated this topic and we plan to address these issues in the future.
Ethical standards and compliance: Technology is moving at an unprecedentedly fast pace and this requires understanding and addressing the risks associated with the dynamically changing nature of technologies. Digital-driven frameworks such as iResponse, as proposed in this paper, require extreme measures to comply with ethical standards and ensure the safety of the people involved and protection of data. The procedures and processes relevant to these digital and data-driven systems should be robustly designed and maintained [199].
Safety of researchers, subjects, and others: Many works have looked at the safety of people involved in digital research, e.g., issues related to minors [200,201], families [202], research related to patients and diseases [203,204], and the use of online surveys [205]. It is important to ensure the safety of the people involved in digital-driven research, directly or indirectly, including those who conduct research and are the subjects of the research.
Vulnerabilities of the digital platforms: Any vulnerabilities in the digital platforms, such as data leakages, could be exploited and result in unimaginable losses at incomprehensible speeds. Robust systems need to be developed.
Technology and culture: Technologies are evolving, and new technologies are coming at a high pace. It is normal to be excited for using these technologies in existing data collection and research methods, and in operational and other systems. However, using new technologies requires cultural changes in researchers, peoples, organizations, and nations. We need to be aware of cultures surrounding the environments where digital methods are being used and should create necessary interventions for the acceptance and adoption of these methods and systems in their environments. These considerations are likely to minimize the risks surrounding the use of digital technologies and the digital divide.
Technology value versus risks need to be evaluated when selecting technologies for digital data collection and research methods. Technologies should not be used for the sole sake of their being cutting-edge and exciting; rather, technologies should be used with keeping the risks and value they bring to the research methods and solutions.
Location of data: The location where the data is stored—in a location outside the country of the origin of data, remotely in a public cloud, locally on the user-owned mobile devices, somewhere in the middle, such as fog computing infrastructure—is another issue that needs to be publicly discussed, and the comparative risks and benefits should be made transparent to the public to create public awareness, confidence, and individual or collective freedom of choice.
Rigidity versus openness: Some people may have a very rigid understanding of research and operational methods, organizations, and societies. We should be open to new technologies and use them for our benefit while maintaining priorities and keeping risks at a minimum. Public awareness programs should be initiated to create awareness and nurture people.
Nevertheless, the immense potential of digital data and methods are well known, and the associated risks should not deter us from the use of digital methods. It is normal to expect no mishaps and perfection from digital data-driven methods; however, there is no perfect method or system, and any mishaps and shortcomings should be taken as opportunities to improve digital methods and systems. The vulnerabilities of these methods can be studied, and robust methods can be developed over time to minimize the risks.

11.5. Digital Divide

Another issue related to our proposed system is that of the digital divide that could exist due to reasons such as race, socioeconomics, geography, education, age, or gender [206]. The digital divide has been considered by some to have progressed in three orders: caused by internet access, caused due to disparities in internet use and digital skills, and thirdly caused by the outcome of internet use [207].
Access to internet and devices: Access to the internet, computers, and other digital devices are very much dependent on socioeconomics. Internet access is no more a luxury but a necessity. Governments need to work together with the communities and industry to address the digital divide caused due to the inequalities in accessing digital devices and the internet. Governments may use subsidies and implement policies to facilitate, encourage, and/or enforce industry to reduce costs of digital devices and internet access. Similarly, the variations in the quality of internet connections between urban, rural, and residential areas of lower socioeconomics should also be stabilized through subsidies and other interventions. Governments should also develop resource centers for disadvantaged communities to provide access to digital devices and internet access. Governments need to work with educational institutions, communities, industry, and the fourth sector to develop curricula and technically skilled workers to support actions against the digital divide and remove digital inequalities. The governments need to develop interventions to educate the public about their attitudes toward technologies. The public should perceive technology as an important element of the future of humanity.
Governments throughout the world need to take the digital divide seriously and solve it using a coordinated effort. Industries around the world also need to work together to develop devices and solutions that could help disadvantaged and isolated groups to join the national efforts toward better health, wealth, and future.
Another approach to address the digital divide is to identify and groom champions in different sections of the society and give them the needed autonomy to nurture their own disadvantaged sections toward inclusiveness. This will allow the ideas to flow from the sections of the societies upwards toward the governments and a better understanding of their problems will be achieved and therefore will pave the way towards better solutions to bring inclusiveness and social sustainability.
COVID-19 has shown the effects of these variations on students and the working class in terms of their abilities to attend online schools and perform their job-related duties. Equalities in these respects not only will help reduce the well-known negative effects of the digital divide but will also help governments to monitor and manage pandemic situations using systems such as the one proposed in this paper.

12. Conclusions and Outlook

The ongoing COVID-19 pandemic caused by the virus SARS-CoV-2 has subdued the whole world and has shown the vulnerability of our people, our nations, and its various public and private organizations and organizational systems. As of 17 March 2021, nearly 121 million people have been infected with COVID-19, claiming over half a million deaths around the globe, and the numbers are increasing. COVID-19 is severely affecting the social, economic, and environmental sustainability of our planet, causing deaths, health damages, relationship breakdowns, depression, economic downturn, riots, and much more. Pandemics have always challenged human existence on our planet; however, we now live in much more technologically advanced times and, therefore, deserve a better response to the current pandemic. The frequencies and severity of pandemics are increasing due to the convergence of factors including the global population, frequent traveling, rapid urbanization, climate change, and ecological destruction. Therefore, the risks of pandemics and challenges to manage pandemics are far greater. We must use our current and past experiences to develop better preparedness for future pandemics.
In this paper, we discussed a number of important observations about the epidemic. The evolution of the pandemic has varied greatly across nations and these trends have been dependent upon the specifics of the virus itself and the variations in responses by countries around the globe. As of 2 August 2020, the five most affected countries in terms of the number of cases are the the U.S., Brazil, India, Russia, and South Africa. The five most affected countries in terms of the number of deaths are the U.S., Brazil, Mexico, the U.K., and India. According to Eurasia Group who developed a methodology to assess and rank national responses across three key areas (healthcare management, political response, and financial policy response) the top five countries with the best global response to COVID-19 are Taiwan, Singapore, South Korea, New Zealand, and Australia. The lessons that have been learned from good practices by various countries include containing the virus rapidly using measures including physical distancing (also called social distancing), quarantines, lockdowns, curfews, providing sanitizers, etc.; enforcing containment measures using contact tracing and other methods; growing testing capacity; and identifying and discovering cures, not necessarily in a pharmaceutical lab but by engaging with the wider community.
We also discussed that pandemics could gravely affect economic and social sustainability, and necessary measures should be taken to improve economic and social conditions. Such measures include providing financial stimulus packages (wage subsidies, free childcare, etc.), easing monetary policies, developing new industries related to pandemic management, and inequalities (overcoming those that are racial, poverty-related, and others). Mental health and relationships have also been severely affected due to the pandemic; these need to be understood and proper response policies and activities should be developed and implemented for social cohesion. Coordination and multi-term planning should be the key in any of the successful national and global endeavors to fight pandemics.
The past decade has seen unprecedented developments under the umbrella of smart cities and societies, focusing on the use of emerging technologies, particularly artificial intelligence, and the integration of various city, rural and national objectives and systems. We identified four key areas for successful pandemic preparedness, planning, and response: (i) effective monitoring measures; (ii) agile coordination and planning across scales; (iii) informed, data-driven, predictive preparedness, and timely decision making; and (iv) dexterous actions. There are clear synergies between these four key areas that we have identified for agile pandemic management and the key themes in designing smart cities, nations, and the planet. The current research and practice on COVID-19 pandemic management have mainly focused on specific aspects of the response to COVID-19 pandemics such as data analytics, resource planning, contact tracing, and COVID-19 testing. There is a need to automate the learning process such that we can learn from good practices and bad practices during pandemics, disasters, emergencies, and normal times. A part of this is to automate the coordination process such that it can predict potential future outbreaks, inform on and take various actions autonomously, predict resource requirements, procure resources accordingly, etc.
We proposed in this paper the technology-driven framework, iResponse, for autonomous pandemic management, allowing pandemic-related monitoring and policy enforcement, resource planning and provisioning, data-driven planning and decision-making, and coordination across these areas. The framework consists of five modules. We provided the technical architecture of a system based on the proposed iResponse framework along with the design details of each of its five components. The challenges related to the design of the individual modules and the whole system were discussed.
We provided six case studies in the paper to elaborate on the different functionalities of the iResponse framework and how the framework can be implemented. These include a sentiment analysis case study, a case study on the recognition of human activities, and four case studies using deep learning and other data-driven methods to show how to develop sustainability-related optimal strategies for pandemic management using seven real-world datasets. The datasets we used are real-world open datasets including a human activity recognition (HAR) dataset, the World Bank COVID-19 dataset, Google COVID-19 mobility report dataset, credit card transactional data by the U.S. Bureau of Economic Analysis (BEA), air quality data acquired through OpenAQ API, and a dataset from the World Happiness Report. A number of important findings were extracted from these case studies (see the relevant sections for the findings, particularly Section 10). We also reported a number of important findings and recommendations while explaining the iResponse framework and its five modules. The MBC module has shown the criticality of monitoring the physical and virtual space through various IoT and other sensing mechanisms. Social media could be very effective in detecting various events (such as pandemics), understanding the effectiveness of policies and procedures related to pandemic management, understating public views on various matters, etc. [82,83,208,209,210,211,212]. Monitoring and tracing people and their activities are important; however, related privacy and security concerns must also be addressed [196,197]. All of these areas need further investigation.
Another matter related to this topic of pandemic management practices and standards is the effectiveness of contact tracing and its impacts on social distribution [213,214]. Starting the contact tracing at the beginning of the pandemic spread was found to be an important factor in its success and in avoiding or minimizing social distribution. For example, Sri Lanka set a good example in its implementation of contact tracing which was carried out with the support of the military intelligence service and other relevant officials. This is an important topic and requires attention and efforts from the international community to reduce social and other inequalities.
Cure identification, development, and treatment is another area where cutting-edge medicine and treatment practices have failed the expectations globally. We believe that there is a need to think openly about it. New ways of identifying and developing cures, including treatment pathways, should be explored. Personalized medicine is likely to advance this area; however, there is a need to seek input from a wider set of stakeholders and the general public to understand the ground truth dynamically. One of the important platforms for this is the use of machine learning for social media analysis [82]. We plan to work in this direction in the future.
Data analytics using deep learning and broader statistical and artificial intelligence methods are becoming fundamental to everything we do today. This makes the brain of the iResponse system that needs to provide support for many tasks including autonomous decision-making and coordination. A part of this is to manage big data that is particularly challenging for iResponse and smart city systems [215,216,217,218,219]. Pandemics management, including resource planning, requires a sophisticated method that integrates knowledge and operations leveraging cutting-edge technologies [61,89,220,221,222]. Moreover, education and training for preparedness before and during pandemics using eLearning methods is an important building block for any successful pandemic management system [53,92]. A great deal of works are needed in these areas. The use of AVs in coronavirus type pandemics where human isolation is important due to the risk of contagion has been seen in recent times, and this topic is likely to see significant growth in the future [113,223,224,225].
iResponse is a framework that, to realize its full vision and benefits in a functioning system, requires massive collaborative efforts from governments, industry, public and other stakeholders. We have built prototypes of some of its components and functions, such as for the Triple Bottom Line case studies in Section 10. These prototypes can easily be built by others using the same methods used in the paper or by using alternative methods.
We hope that our work in this paper will motivate the design and adoption of holistic pandemic management systems. These pandemic management systems will be an integral part of other national operational systems, which in turn will be connected globally. Such an approach will allow us to be better prepared for future pandemics with predicted warnings, allowing better resilience for social, economic and environmental sustainability.

Author Contributions

Conceptualization, F.A. and R.M.; methodology, F.A. and R.M.; software, F.A. and A.A. (Ahmed Almaghthawi); validation, F.A.; formal analysis, F.A. and R.M.; investigation, F.A.; resources, R.M., I.K., and A.A. (Aiiad Albeshri); data curation, F.A. and A.A. (Ahmed Almaghthawi); writing—original draft preparation, F.A. and R.M.; writing—review and editing, R.M., A.A. (Aiiad Albeshri) and I.K.; visualization, F.A.; supervision, R.M.; project administration, R.M., I.K., and A.A. (Aiiad Albeshri); funding acquisition, R.M., A.A. (Aiiad Albeshri) and I.K. All authors have read and agreed to the published version of the manuscript.

Funding

This project was funded by the Deanship of Scientific Research (DSR) at King Abdulaziz University, Jeddah, under grant number RG-11-611-38. The authors, therefore, acknowledge with thanks the DSR for their technical and financial support.

Institutional Review Board Statement

Not applicable.

Informed Consent Statement

Not applicable.

Data Availability Statement

All the datasets used in this work are publicly available.

Acknowledgments

The experiments reported in this paper were performed on the Aziz supercomputer at KAU. The authors are thankful to the anonymous reviewers whose comments helped us to significantly improve this paper. We are thankful to Jagdish Prasad (Amity University, Jaipur) for the discussions related to statistical aspects of Figure 20 and Figure 24.

Conflicts of Interest

The authors declare no conflict of interest.

References

  1. Eroğlu, H. Effects of Covid-19 outbreak on environment and renewable energy sector. Environ. Dev. Sustain. 2020, 1–9. [Google Scholar] [CrossRef]
  2. OCED. COVID-19 and Responsible Business Conduct. OECD Policy Responses to Coronavirus (COVID-19). 2020. Available online: http://www.oecd.org/coronavirus/policy-responses/covid-19-and-responsible-business-conduct-02150b06/#:~:text=A%20re-sponsible%20business%20conduct (accessed on 20 December 2020).
  3. Winkle, T. Safety Benefits of Automated Vehicles: Extended Findings from Accident Research for Development, Validation and Testing. In Autonomous Driving: Technical, Legal and Social Aspects; Springer: Berlin/Heidelberg, Germany, 2016; pp. 335–364. ISBN 9783662488478. [Google Scholar]
  4. How COVID-19 is impacting the environment and sustainability|Business West. Available online: https://www.businesswest.co.uk/blog/how-covid-19-impacting-environment-and-sustainability (accessed on 1 August 2020).
  5. Implications of COVID-19 for the Environment and Sustainability|Business Wire. Available online: https://www.businesswire.com/news/home/20200513005941/en/Implications-COVID-19-Environment-Sustainability (accessed on 1 August 2020).
  6. COVID-19’s Impact on Sustainability: 3 Trends in Media Coverage. Available online: https://www.commpro.biz/covid-19s-impact-on-sustainability-3-trends-in-media-coverage/ (accessed on 1 August 2020).
  7. The Social Impact of COVID-19|DISD. Available online: https://www.un.org/development/desa/dspd/2020/04/social-impact-of-covid-19/ (accessed on 1 August 2020).
  8. Conticini, E.; Frediani, B.; Caro, D. Can atmospheric pollution be considered a co-factor in extremely high level of SARS-CoV-2 lethality in Northern Italy? Environ. Pollut. 2020, 261, 114465. [Google Scholar] [CrossRef] [PubMed]
  9. COVID-19 and Environmental and Social Sustainability. Available online: https://www.eib.org/en/publications/covid19-guidance-note-to-promoters (accessed on 1 August 2020).
  10. COVID-19 Impacts on Supply Chains, Sustainability and Climate Change|Deloitte|Blog. Available online: https://www2.deloitte.com/global/en/blog/responsible-business-blog/2020/covid-19-impacts-on-supply-chains-sustainability-and-climate-change.html (accessed on 1 August 2020).
  11. Indriastuti, M.; Fuad, K. Impact of covid-19 on digital transformation and sustainability in small and medium enterprises (smes): A conceptual framework. In Advances in Intelligent Systems and Computing; Springer: Cham, Switzerland, 2021; Volume 1194 AISC, pp. 471–476. [Google Scholar]
  12. Why Business Needs to Address the Social Impacts of COVID-19: An Interview with Lise Kingo, UN Global Compact Chief|UN News. Available online: https://news.un.org/en/story/2020/06/1065142 (accessed on 1 August 2020).
  13. Coronavirus Pandemic as A Catalyst for Organizational Change—Connected World. Available online: https://connectedworld.com/coronavirus-pandemic-as-a-catalyst-for-organizational-change/ (accessed on 2 August 2020).
  14. Why the U.S. and U.K. Failed Their Coronavirus Responses|Time. Available online: https://time.com/5861697/us-uk-failed-coronavirus-response/ (accessed on 2 August 2020).
  15. International Anarchy and Failure to Cope with COVID-19|East Asia Forum. Available online: https://www.eastasiaforum.org/2020/05/06/international-anarchy-and-failure-to-cope-with-covid-19/ (accessed on 2 August 2020).
  16. The WHO Has Failed the World in Its Pandemic Response|The Strategist. Available online: https://www.aspistrategist.org.au/the-who-has-failed-the-world-in-its-pandemic-response/ (accessed on 2 August 2020).
  17. US Says WHO “Failure” on Covid-19 “Cost Many Lives”, Europe News & Top Stories—The Straits Times. Available online: https://www.straitstimes.com/world/europe/us-says-who-failure-on-covid-19-cost-many-lives (accessed on 2 August 2020).
  18. Covid-19 Is a Massive Failure of Public Health Leadership—Bloc. Available online: https://bloncampus.thehindubusinessline.com/columns/world-view/covid-19-is-a-massive-failure-of-public-health-leadership/article31220809.ece (accessed on 2 August 2020).
  19. Coronavirus Is a Failure of Global Governance—Now the World Needs a Radical Transformation. Available online: https://theconversation.com/coronavirus-is-a-failure-of-global-governance-now-the-world-needs-a-radical-transformation-136535 (accessed on 2 August 2020).
  20. Johns Hopkins University. Coronavirus COVID-19 Global Cases by the Center for Systems Science and Engineering (CSSE) at Johns Hopkins University (JHU); Johns Hopkins University: Baltimore, MD, USA, 2020. [Google Scholar]
  21. Home—Johns Hopkins Coronavirus Resource Center. Available online: https://coronavirus.jhu.edu/ (accessed on 26 July 2020).
  22. Population by Country (2021)—Worldometer. Available online: https://www.worldometers.info/world-population/population-by-country/ (accessed on 25 February 2020).
  23. History.com Editors Pandemics That Changed History. Available online: https://www.history.com/topics/middle-ages/pandemics-timeline (accessed on 24 December 2020).
  24. Whiting, K. Coronavirus Isn’t an Outlier, It’s Part of Our Interconnected Viral Age. Available online: https://www.weforum.org/agenda/2020/03/coronavirus-global-epidemics-health-pandemic-covid-19/ (accessed on 27 February 2021).
  25. Laczko, F.; Aghazarm, C. Migration, Environment and Climate Change; International Organization for Migration (IOM): Geneva, Switzerland, 2009; ISBN 9789290684541. [Google Scholar]
  26. Mcmichael, A.J.; Campbell-Lendrum, D.H.; Corvalán, C.F.; Ebi, K.L.; Githeko, A.K.; Scheraga, J.D.; Woodward, A. Climate Change and Human Health Risks and Responses; World Health Organization: Geneva, Switzerland, 2003. [Google Scholar]
  27. Saker, L.; Lee, K.; Cannito, B.; Gilmore, A.; Campbell-Lendrum, D.H. Globalization and Infectious Diseases: A Review of the Linkages; World Health Organization: Geneva, Switzerland, 2004. [Google Scholar]
  28. Estrada, R.; Griffith, A.; Prim, C.; Sinn, J. Pandemics in a Changing Climate-Evolving Risk and the Global Response; School of Advanced International Studies, John Hopkins University: Baltimore, MD, USA, 2016. [Google Scholar]
  29. Pandemics to Increase in Frequency and Severity Unless Biodiversity Loss Is Addressed. Available online: https://en.unesco.org/news/pandemics-increase-frequency-and-severity-unless-biodiversity-loss-addressed (accessed on 27 February 2021).
  30. Franco, E.G. The Global Risks Report 2020, 15th ed.; World Economic Forum: Davos, Switzerland, 2020. [Google Scholar]
  31. The World Economic Forum. Available online: https://www.weforum.org/ (accessed on 27 February 2021).
  32. Bremmer, I. The Best Global Responses to COVID-19 Pandemic. Available online: https://time.com/5851633/best-global-responses-covid-19/ (accessed on 29 July 2020).
  33. How Taiwan Is Containing Coronavirus—Despite Diplomatic Isolation by China|Coronavirus Outbreak|The Guardian. Available online: https://www.theguardian.com/world/2020/mar/13/how-taiwan-is-containing-coronavirus-despite-diplomatic-isolation-by-china (accessed on 2 August 2020).
  34. Customers Advised to Bring NRIC to Enter Shopping Malls, Supermarkets: Enterprise Singapore—CAN. Available online: https://www.channelnewsasia.com/news/singapore/covid-19-bring-nric-supermarket-malls-entry-contact-tracing-12691114 (accessed on 2 August 2020).
  35. Singapore Races To Build Beds for COVID-19 Patients as Cases Surge—Reuters. Available online: https://www.reuters.com/article/us-health-coronavirus-singapore-temp-hos/singapore-races-to-build-beds-for-covid-19-patients-as-cases-surge-idUSKCN22805B (accessed on 2 August 2020).
  36. Ferrier, K. South Korea Ramps-up Exports of COVID-19 Testing Kits—The Diplomat. Available online: https://thediplomat.com/2020/04/south-korea-ramps-up-exports-of-covid-19-testing-kits/ (accessed on 26 July 2020).
  37. How South Korea Has Used Tech to Successfully Contain COVID-19—Business Insider. Available online: https://www.businessinsider.com/coronavirus-south-korea-tech-contact-tracing-testing-fight-covid-19-2020-5 (accessed on 2 August 2020).
  38. How New Zealand Brought New Coronavirus Cases Down to Zero. Available online: https://www.cnbc.com/2020/05/05/how-new-zealand-brought-new-coronavirus-cases-down-to-zero.html (accessed on 2 August 2020).
  39. Graham-McLay, C. New Zealand Budget: Robertson Lays Out $50bn Plan to Return Jobs to pre-Covid-19 Levels. Available online: https://www.theguardian.com/world/2020/may/14/new-zealand-budget-robertson-lays-out-50bn-plan-to-return-jobs-to-pre-covid-19-levels (accessed on 26 July 2020).
  40. Opinion|Did the Coronavirus Kill Ideology in Australia?—The New York Times. Available online: https://www.nytimes.com/2020/05/18/opinion/coronavirus-australia.html?searchResultPosition=17 (accessed on 2 August 2020).
  41. Australia’s Rescue Package the World’s Biggest, Bar One. Available online: https://www.afr.com/policy/economy/australia-s-rescue-package-the-world-s-biggest-bar-one-20200506-p54qdc (accessed on 2 August 2020).
  42. Hettiarachchi, D.; Noordeen, N.; Gamakaranage, C.; Somarathne, D.; Jayasinghe, S. Ethical Responses to the COVID-19 Pandemic—Lessons from Sri Lanka. Asian Bioeth. Rev. 2020, 1–9. [Google Scholar] [CrossRef] [PubMed]
  43. KPMG Sri Lanka: Tax Developments in Response to COVID-19. Available online: https://home.kpmg/xx/en/home/insights/2020/04/sri-lanka-tax-developments-in-response-to-covid-19.html (accessed on 2 August 2020).
  44. Dinh, L.; Dinh, P.; Nguyen, P.D.M.; Nguyen, D.H.N.; Hoang, T. Vietnam’s response to COVID-19: Prompt and proactive actions. J. Travel Med. 2020, 27, 27. [Google Scholar] [CrossRef] [Green Version]
  45. AFP Germany Ramps up Coronavirus Tests to 500,000 a Week; The Local: Stockholm, Sweden, 2020.
  46. FACTBOX-Global Economic Policy Response to the Coronavirus Crisis—Reuters. Available online: https://www.reuters.com/article/health-coronavirus-economy/factbox-global-economic-policy-response-to-the-coronavirus-crisis-idUSL3N2C11C3 (accessed on 26 July 2020).
  47. Covid-19 Coronavirus: Finance Minister Says Government Has More Fiscal Firepower to Fight Virus—NZ Herald. Available online: https://www.nzherald.co.nz/nz/news/article.cfm?c_id=1&objectid=12319300 (accessed on 26 July 2020).
  48. Singapore Eases Monetary Policy Sharply as Virus Heralds Deep Recession—Reuters. Available online: https://www.reuters.com/article/us-singapore-cenbank-idUSKBN21H0HF (accessed on 26 July 2020).
  49. Projected Poverty Impacts of COVID-19 (Coronavirus). Available online: https://www.worldbank.org/en/topic/poverty/brief/projected-poverty-impacts-of-COVID-19 (accessed on 26 July 2020).
  50. Iacobucci, G. Covid-19: Deprived areas have the highest death rates in England and Wales. BMJ 2020, 369, m1810. [Google Scholar] [CrossRef]
  51. Coronavirus vs. Inequality. Available online: https://feature.undp.org/coronavirus-vs-inequality/ (accessed on 26 July 2020).
  52. Lin, Y.; Zhang, X.; Geertman, S. Toward smart governance and social sustainability for Chinese migrant communities. J. Clean. Prod. 2015, 107, 389–399. [Google Scholar] [CrossRef]
  53. How Is WHO Responding to COVID-19? Available online: https://www.who.int/emergencies/diseases/novel-coronavirus-2019/who-response-in-countries (accessed on 26 July 2020).
  54. Coordination Essential to Beat Coronavirus, Keep Development Goals on Track|UN News. Available online: https://news.un.org/en/story/2020/05/1064392 (accessed on 26 July 2020).
  55. OECD. The Territorial Impact of COVID-19: Managing the Crisis across Levels of Government; OECD: Paris, France, 2020. [Google Scholar]
  56. WHO/Europe|Coronavirus Disease (COVID-19) Outbreak—Statement—COVID-19: Collaboration, Coordination, Communication—Joining Forces for Healthier Populations. Available online: https://www.euro.who.int/en/health-topics/health-emergencies/coronavirus-covid-19/statements/statement-covid-19-collaboration,-coordination,-communication-joining-forces-for-healthier-populations (accessed on 26 July 2020).
  57. U.S. Coronavirus Response: Who’s in Charge of What? Available online: https://www.cfr.org/article/us-trump-coronavirus-response-covid19-agencies-in-charge (accessed on 28 July 2020).
  58. Coordinating the Federal Response|Homeland Security. Available online: https://www.dhs.gov/coronavirus/federal-response (accessed on 28 July 2020).
  59. Mehmood, R.; Bhaduri, B.; Katib, I.; Chlamtac, I. (Eds.) Smart Societies, Infrastructure, Technologies and Applications; Lecture Notes of the Institute for Computer Sciences, Social Informatics and Telecommunications Engineering; Lecture Notes of the Institute for Computer Sciences, Social Informatics and Telecommunications Engineering (LNICST); Springer: Cham, Switzerland, 2018; Volume 224, p. 367. ISBN 978-3-319-94179-0. [Google Scholar]
  60. Mehmood, R.; See, S.; Katib, I.; Chlamtac, I. (Eds.) Smart Infrastructure and Applications: Foundations for Smarter Cities and Societies; EAI/Springer Innovations in Communication and Computing; Springer International Publishing: Cham, Switzerland, 2020; p. 692. ISBN 9783030137045. [Google Scholar]
  61. Yigitcanlar, T.; Butler, L.; Windle, E.; DeSouza, K.C.; Mehmood, R.; Corchado, J.M. Can Building “Artificially Intelligent Cities” Safeguard Humanity from Natural Disasters, Pandemics, and Other Catastrophes? An Urban Scholar’s Perspective. Sensors 2020, 20, 2988. [Google Scholar] [CrossRef]
  62. Yigitcanlar, T.; Kankanamge, N.; Regona, M.; Maldonado, A.; Rowan, B.; Ryu, A.; DeSouza, K.C.; Corchado, J.M.; Mehmood, R.; Li, R.Y.M. Artificial Intelligence Technologies and Related Urban Planning and Development Concepts: How Are They Perceived and Utilized in Australia? J. Open Innov. Technol. Mark. Complex. 2020, 6, 187. [Google Scholar] [CrossRef]
  63. Yigitcanlar, T.; Corchado, J.; Mehmood, R.; Li, R.; Mossberger, K.; Desouza, K. Responsible Urban Innovation with Local Government Artificial Intelligence (AI): A Conceptual Framework and Research Agenda. J. Open Innov. Technol. Mark. Complex. 2021, 7, 71. [Google Scholar] [CrossRef]
  64. Janbi, N.; Katib, I.; Albeshri, A.; Mehmood, R. Distributed Artificial Intelligence-as-a-Service (DAIaaS) for Smarter IoE and 6G Environments. Sensors 2020, 20, 5796. [Google Scholar] [CrossRef]
  65. BlueDot. BlueDot’s Outbreak Risk Software Safeguards Lives by Mitigating Exposure to Infectious Diseases That Threaten Human Health, Security, and Prosperity; BlueDot: Toronto, ON, Canada, 2020. [Google Scholar]
  66. Heaven, W.D. AI could help with the next pandemic—But not with this one. MIT Technology Review, 12 March 2020. [Google Scholar]
  67. O’Neill, P.H. India is forcing people to use its covid app, unlike any other democracy. MIT Technology Review, 7 May 2020. [Google Scholar]
  68. Samuel, J.; Ali, G.; Rahman, M.; Esawi, E.; Samuel, Y. COVID-19 Public Sentiment Insights and Machine Learning for Tweets Classification. Information 2020, 11, 314. [Google Scholar] [CrossRef]
  69. Chen, J.; Wu, L.; Zhang, J.; Zhang, L.; Gong, D.; Zhao, Y.; Hu, S.; Wang, Y.; Hu, X.; Zheng, B.; et al. Deep learning-based model for detecting 2019 novel coronavirus pneumonia on high-resolution computed tomography: A prospective study. Sci. Rep. 2020, 10, 19196. [Google Scholar]
  70. Rahman, S.; Peeri, N.C.; Shrestha, N.; Zaki, R.; Haque, U.; Ab Hamid, S.H. Defending against the Novel Coronavirus (COVID-19) outbreak: How can the Internet of Things (IoT) help to save the world? Health Policy Technol. 2020, 9, 136–138. [Google Scholar] [CrossRef] [PubMed]
  71. Singh, R.P.; Javaid, M.; Haleem, A.; Suman, R. Internet of things (IoT) applications to fight against COVID-19 pandemic. Diabetes Metab. Syndr. Clin. Res. Rev. 2020, 14, 521–524. [Google Scholar] [CrossRef]
  72. Rao, A.S.R.S.; Vazquez, J.A. Identification of COVID-19 can be quicker through artificial intelligence framework using a mobile phone–based survey when cities and towns are under quarantine. Infect. Control Hosp. Epidemiol. 2020, 41, 826–830. [Google Scholar] [CrossRef] [Green Version]
  73. Farooq, M.; Hafeez, A. COVID-ResNet: A Deep Learning Framework for Screening of COVID19 from Radiographs. Cornell Univ. Libr. 2020, arXiv:2003.14395. [Google Scholar]
  74. Weiss, G.M.; Yoneda, K.; Hayajneh, T. Smartphone and Smartwatch-Based Biometrics Using Activities of Daily Living. IEEE Access 2019, 7, 133190–133202. [Google Scholar] [CrossRef]
  75. World Bank. Open Data of World Bank. Available online: http://data.worldbank.org (accessed on 20 October 2018).
  76. Google COVID-19 Community Mobility Reports. Available online: https://www.google.com/covid19/mobility/ (accessed on 20 October 2020).
  77. Dunn, A.; Hood, K.; Driessen, A. Measuring the Effects of the COVID-19 Pandemic on Consumer Spending Using Card Transaction Data. BEA Work. Pap. Ser. WP2020-5 2020. [Google Scholar] [CrossRef]
  78. Salmon, M.; MacDonald, A.; Teucher, A.; Murphy, M. Accesses Air Quality Data from the Open Data Platform OpenAQ. CRAN. 2020. Available online: https://www.researchgate.net/deref/http%3A%2F%2Fdx.doi.org%2F10.13140%2FRG.2.2.20007.29600 (accessed on 10 October 2020).
  79. Helliwell, J.F.; Layard, R.; Sachs, J.D.; Neve, J.E. World Happiness Report 2020. Available online: https://worldhappiness.report/ed/2020 (accessed on 20 December 2020).
  80. Hale, T.; Angrist, N.; Kira, B.; Petherick, A.; Phillips, T.; Webster, S. Variation in Government Responses to COVID-19; Blavatnik School of Government: Oxford, UK, 2020.
  81. WHO. WHO Pandemic Influenza Risk Management Guidance; WHO: Geneva, Switzerland, 2017. [Google Scholar]
  82. Alotaibi, S.; Mehmood, R.; Katib, I.; Rana, O.; Albeshri, A. Sehaa: A Big Data Analytics Tool for Healthcare Symptoms and Diseases Detection Using Twitter, Apache Spark, and Machine Learning. Appl. Sci. 2020, 10, 1398. [Google Scholar] [CrossRef] [Green Version]
  83. AlOmari, E.; Mehmood, R. Analysis of Tweets in Arabic Language for Detection of Road Traffic Conditions. In Lecture Notes of the Institute for Computer Sciences, Social-Informatics and Telecommunications Engineering, LNICST; Springer: Cham, Switzerland, 2018; Volume 224, pp. 98–110. [Google Scholar]
  84. Alam, F.; Thayananthan, V.; Katib, I. Analysis of round-robin load-balancing algorithm with adaptive and predictive approaches. In Proceedings of the 2016 UKACC 11th International Conference on Control (CONTROL), Belfast, UK, 31 August–2 September 2016; pp. 1–7. [Google Scholar]
  85. Alam, F.; Mehmood, R.; Katib, I. D2TFRS: An object recognition method for autonomous vehicles based on RGB and spatial values of pixels. In Lecture Notes of the Institute for Computer Sciences, Social-Informatics and Telecommunications Engineering, LNICST; Springer: Cham, Switzerland, 2018; Volume 224, pp. 155–168. [Google Scholar]
  86. Baldi, P. Deep Learning in Biomedical Data Science. Annu. Rev. Biomed. Data Sci. 2018, 1, 181–205. [Google Scholar] [CrossRef]
  87. Muhammed, T.; Mehmood, R.; Albeshri, A.; Katib, I. UbeHealth: A Personalized Ubiquitous Cloud and Edge-Enabled Networked Healthcare System for Smart Cities. IEEE Access 2018, 6, 32258–32285. [Google Scholar] [CrossRef]
  88. Raissi, M. Deep Hidden Physics Models: Deep Learning of Nonlinear Partial Differential Equations. Cornell Univ. Libr. 2018, arXiv:1801.06637. [Google Scholar]
  89. Mehmood, R.; Meriton, R.; Graham, G.; Hennelly, P.; Kumar, M. Exploring the influence of big data on city transport operations: A Markovian approach. Int. J. Oper. Prod. Manag. 2017, 37, 75–104. [Google Scholar] [CrossRef]
  90. United Nations Department of Global Communications. UN Tackles ‘Infodemic’ of Misinformation and Cybercrime in COVID-19 Crisis; United Nations Department of Global Communications: New York, NY, USA, 2020. [Google Scholar]
  91. Ouerhani, N.; Maalel, A.; Ghézala, H.B.; Chouri, S. Smart Ubiquitous Chatbot for COVID-19 Assistance with Deep learning Sentiment Analysis Model during and after quarantine. Artif. Intell. Mach. Learn. 2020. [Google Scholar] [CrossRef]
  92. Mehmood, R.; Alam, F.; Albogami, N.N.; Katib, I.; Albeshri, A.; Altowaijri, S.M. UTiLearn: A Personalised Ubiquitous Teaching and Learning System for Smart Societies. IEEE Access 2017, 5, 2615–2635. [Google Scholar] [CrossRef]
  93. Alam, F.; Mehmood, R.; Katib, I.; Albeshri, A. Analysis of Eight Data Mining Algorithms for Smarter Internet of Things (IoT). Procedia Comput. Sci. 2016, 98, 437–442. [Google Scholar] [CrossRef] [Green Version]
  94. Morrison, R. US government is “in talks with Facebook and Google” about tracking the location of citizens using their smartphones during the coronavirus pandemic to ensure they are practicing social distancing. Daily Mail, 18 March 2020. [Google Scholar]
  95. Wang, S.; Kang, B.; Ma, J.; Zeng, X.; Xiao, M.; Guo, J.; Cai, M.; Yang, J.; Li, Y.; Meng, X.; et al. A deep learning algorithm using CT images to screen for Corona virus disease (COVID-19). Eur. Radiol. 2021, 1–9. [Google Scholar] [CrossRef]
  96. Gozes, O.; Frid-Adar, M.; Greenspan, H.; Browning, P.D.; Zhang, H.; Ji, W.; Bernheim, A.; Siegel, E. Rapid AI Development Cycle for the Coronavirus (COVID-19) Pandemic: Initial Results for Automated Detection & Patient Monitoring using Deep Learning CT Image Analysis. Cornell Univ. Libr. 2020, arXiv:2003.05037. [Google Scholar]
  97. Vamathevan, J.; Clark, D.; Czodrowski, P.; Dunham, I.; Ferran, E.; Lee, G.; Li, B.; Madabhushi, A.; Shah, P.; Spitzer, M.; et al. Applications of machine learning in drug discovery and development. Nat. Rev. Drug Discov. 2019, 18, 463–477. [Google Scholar] [CrossRef]
  98. Chen, H.; Engkvist, O.; Wang, Y.; Olivecrona, M.; Blaschke, T. The rise of deep learning in drug discovery. Drug Discov. Today 2018, 23, 1241–1250. [Google Scholar] [CrossRef] [PubMed]
  99. Zhang, H.; Saravanan, K.M.; Yang, Y.; Hossain, T.; Li, J.; Ren, X.; Pan, Y.; Wei, Y. Deep Learning Based Drug Screening for Novel Coronavirus 2019-nCov. Interdiscip. Sci. Comput. Life Sci. 2020, 12, 368–376. [Google Scholar] [CrossRef]
  100. Marr, B. The Rise of Thinking Machines: How IBM’s Watson Takes on The World. Forbes. 2016. Available online: https://forbes.com/sites/bernardmarr/2016/01/06/the-rise-of-thinking-machines-how-ibms-watson-takes-on-the-world/?sh=5253bd4c1e43 (accessed on 20 November 2020).
  101. Gowda, V.; Shah, S.; Gardampaali, B. Concept Of Self-Driven Ambulance Synchronized With Live GPS Feed For Faster and Safe Transport Of Patients. Int. J. Eng. Res. Appl. 2018, 8, 32–36. [Google Scholar]
  102. Khashan, E.A.; Eldesouky, A.I.; Fadel, M.; Elghamrawy, S.M. A Big Data Based Framework for Executing Complex Query over COVID19 Datasets (COVID-QF). Cornell Univ. Libr. 2020, arXiv:2005.12271. [Google Scholar]
  103. Chen, Y.; Ouyang, L.; Bao, F.S.; Li, Q.; Han, L.; Zhu, B.; Ge, Y.; Robinson, P.; Xu, M.; Liu, J.; et al. An Interpretable Machine Learning Framework for Accurate Severe vs Non-Severe COVID-19 Clinical Type Classification. SSRN Electron. J. 2020. [Google Scholar] [CrossRef]
  104. Roberts, S. You Can Help Break the Chain of Transmission. Available online: https://www.nytimes.com/2020/03/19/health/coronavirus-distancing-transmission.html (accessed on 10 June 2020).
  105. Calabrese, B.; Cannataro, M.; Ielpo, N. Using Social Networks Data for Behavior and Sentiment Analysis. In Internet and Distributed Computing Systems; Lecture Notes in Computer Science; Springer: Cham, Switzerland, 2015; pp. 285–293. [Google Scholar] [CrossRef]
  106. Gentry, J. R Based Twitter Client. Available online: https://cran.r-project.org/web/packages/twitteR/index.html (accessed on 10 June 2020).
  107. Lang, D.T.; CRAN-Team. Client Interface for R. Available online: https://cran.r-project.org/web/packages/RCurl/index.html (accessed on 10 June 2020).
  108. Lewnard, J.A.; Lo, N.C. Scientific and ethical basis for social-distancing interventions against COVID-19. Lancet Infect. Dis. 2020, 20, 631–633. [Google Scholar] [CrossRef] [Green Version]
  109. Attal, F.; Mohammed, S.; Dedabrishvili, M.; Chamroukhi, F.; Oukhellou, L.; Amirat, Y. Physical Human Activity Recognition Using Wearable Sensors. Sensors 2015, 15, 31314–31338. [Google Scholar] [CrossRef] [PubMed] [Green Version]
  110. Stisen, A.; Blunck, H.; Bhattacharya, S.; Prentow, T.S.; Kjærgaard, M.B.; Dey, A.K.; Sonne, T.; Jensen, M.M. Smart Devices are Different. In Proceedings of the 13th ACM Conference on Embedded Networked Sensor Systems, Seoul, Korea, 1–4 November 2015; pp. 127–140. [Google Scholar]
  111. Pisano, G.P.; Sadun, R.; Zanini, M. Lessons from Italy’s Response to Coronavirus. Harvard Business Review, 17 March 2020. [Google Scholar]
  112. Bohra, S. ‘Super Spreader’ Infects Nearly 100 People in Jaipur, Rajasthan Gets Second Covid-19 Hotspot. Available online: https://www.theprint.in/india/super-spreader-infects-nearly-100-people-in-jaipur-rajasthan-gets-second-covid-19-hotspot/398537/ (accessed on 1 June 2020).
  113. Alam, F.; Mehmood, R.; Katib, I.; Altowaijri, S.M.; Albeshri, A. TAAWUN: A Decision Fusion and Feature Specific Road Detection Approach for Connected Autonomous Vehicles. Mob. Netw. Appl. 2019. [Google Scholar] [CrossRef]
  114. Alam, F.; Mehmood, R.; Katib, I. Comparison of Decision Trees and Deep Learning for Object Classification in Autonomous Driving. Adv. Controll. Smart Cities 2019, 135–158. [Google Scholar] [CrossRef]
  115. One Ambulance Driver, One Doctor Infected with Coronavirus in Armenia; Armen Press: Yerevan, Armenia, 26 March 2020. Available online: https://armenpress.am/eng/news/1010140.html (accessed on 1 June 2020).
  116. Dutt, A. The ambulance driver who ferried Italian tourists with coronavirus. Hindustan Times, 18 March 2020. [Google Scholar]
  117. Rouse, A. Scientist leading the search for a coronavirus cure issues chilling warning that we may NEVER find a vaccine—And desperately need to come up with a Plan B. Daily Mail Australia, 11 April 2020. [Google Scholar]
  118. Hu, T.Y.; Frieman, M.; Wolfram, J. Insights from nanomedicine into chloroquine efficacy against COVID-19. Nat. Nanotechnol. 2020, 15, 247–249. [Google Scholar] [CrossRef] [PubMed] [Green Version]
  119. Liu, I.; Cao, R.; Xu, M.; Wang, X.; Zhang, H.; Hu, H.; Li, Y.; Hu, Z.; Zhong, W.; Wang, M. Hydroxychloroquine, a less toxic derivative of chloroquine, is effective in inhibiting SARS-CoV-2 infection in vitro. Cell Discov. 2020, 6, 1–4. [Google Scholar] [CrossRef] [Green Version]
  120. Muscogiuri, G.; Barrea, L.; Savastano, S.; Colao, A. Nutritional recommendations for CoVID-19 quarantine. Eur. J. Clin. Nutr. 2020, 74, 850–851. [Google Scholar] [CrossRef]
  121. Rabby, I.I. Current Drugs with Potential for Treatment of COVID-19: A Literature Review. J. Pharm. Pharm. Sci. 2020, 23, 58–64. [Google Scholar] [CrossRef]
  122. Zachar, O. Formulations for COVID-19 Treatment via Silver Nanoparticles Inhalation Delivery. OSF Prepr. 2020. [Google Scholar] [CrossRef]
  123. Emanuel, E.J.; Persad, G.; Upshur, R.; Thome, B.; Parker, M.; Glickman, A.; Zhang, C.; Boyle, C.; Smith, M.; Phillips, J.P. Fair Allocation of Scarce Medical Resources in the Time of Covid-19. N. Engl. J. Med. 2020, 382, 2049–2055. [Google Scholar] [CrossRef] [PubMed]
  124. Faculty of Science, University of Copenhagen. Artificial Intelligence to Predict Corona-Patients’ Risk of Needing Ventilators; Faculty of Science, University of Copenhagen: Copenhagen, Denmark, 2020. [Google Scholar]
  125. Elegant, N.X. Fortune; Fortune Media Group Holdings: New York, NY, USA, 2020. [Google Scholar]
  126. Jiang, F.; Jiang, Y.; Zhi, H.; Dong, Y.; Li, H.; Ma, S.; Wang, Y.; Dong, Q.; Shen, H.; Wang, Y. Artificial intelligence in healthcare: Past, present and future. Stroke Vasc. Neurol. 2017, 2, 230–243. [Google Scholar] [CrossRef]
  127. Levy, H.P. Top 10 Technology Trends Signal the Digital Mesh. Available online: http://www.gartner.com/smarterwithgartner/top-ten-technology-trends-signal-the-digital-mesh/ (accessed on 10 June 2020).
  128. LeCun, Y.; Bengio, Y.; Hinton, G. Deep learning. Nature 2015, 521, 436–444. [Google Scholar] [CrossRef] [PubMed]
  129. Miotto, R.; Wang, F.; Wang, S.; Jiang, X.; Dudley, J.T. Deep learning for healthcare: Review, opportunities and challenges. Brief. Bioinform. 2018, 19, 1236–1246. [Google Scholar] [CrossRef] [PubMed]
  130. Schulz, H.; Behnke, S. Deep Learning. KI—Künstliche Intell. 2012, 26, 357–363. [Google Scholar] [CrossRef]
  131. Bengio, Y. Learning Deep Architectures for AI. Found. Trends® Mach. Learn. 2009, 2, 1–127. [Google Scholar] [CrossRef]
  132. Desautels, T.; Calvert, J.; Hoffman, J.; Mao, Q.; Jay, M.; Fletcher, G.; Barton, C.; Chettipally, U.; Kerem, Y.; Das, R. Using Transfer Learning for Improved Mortality Prediction in a Data-Scarce Hospital Setting. Biomed. Inform. Insights 2017, 9. [Google Scholar] [CrossRef] [Green Version]
  133. Scudellari, M. Deep learning models predict old and new drugs that might successfully treat COVID-19. IEEE Spectrum, 19 March 2020. [Google Scholar]
  134. Song, Y.; Yue, T.; Wang, H.; Li, J.; Gao, H. Disease Prediction Based on Transfer Learning in Individual Healthcare. Relat. Datenbanken 2017, 727, 110–122. [Google Scholar] [CrossRef]
  135. Dubois, S.; Romano, N.; Jung, K.; Shah, N.; Kale, D.C. The Effectiveness of Transfer Learning in Electronic Health Record Data. ICLR 2017 Workshop. 2017. Available online: https://openreview.net/forum?id=B1_E8xrKe (accessed on 10 June 2020).
  136. Loey, M.; Smarandache, F.; Khalifa, N.E.M. Within the Lack of Chest COVID-19 X-ray Dataset: A Novel Detection Model Based on GAN and Deep Transfer Learning. Symmetry 2020, 12, 651. [Google Scholar] [CrossRef] [Green Version]
  137. Alam, F.; Mehmood, R.; Katib, I.; Albogami, N.N.; Albeshri, A. Data Fusion and IoT for Smart Ubiquitous Environments: A Survey. IEEE Access 2017, 5, 9533–9554. [Google Scholar] [CrossRef]
  138. Liu, Z.; Bing, X.; Zhi, X.Z. Prediction modeling with data fusion and prevention strategy analysis for the COVID-19 outbreak. Prime Pub. 2020, 41, 480–484. [Google Scholar]
  139. Marr, B. The Vital Role of the Bigdata in the Fight against Coronavirus. Forbes Tech. April 2020. Available online: https://www.forbes.com/sites/bernardmarr/2020/04/09/the-vital-role-of-the-bigdata-in-the-fight-against-coronavirus/?sh=27a607bd3806 (accessed on 1 October 2020).
  140. Wang, C.J.; Ng, C.Y.; Brook, R.H. Response to COVID-19 in Taiwan. JAMA 2020, 323, 1341. [Google Scholar] [CrossRef]
  141. Kempf, J.; Arkko, J.; Beheshti, N.; Yedavalli, K. Thoughts on reliability in the internet of things. Interconnect. Smart Objects Internet Work 2011, 1, 1–4. [Google Scholar]
  142. Mahmood, M.A.; Seah, W.K.; Welch, I. Reliability in wireless sensor networks: A survey and challenges ahead. Comput. Netw. 2015, 79, 166–187. [Google Scholar] [CrossRef]
  143. Zhao, K.; Pan, K.; Zhang, B. Cooperative Transmission in Mobile Wireless Sensor Networks with Multiple Carrier Frequency Offsets: A Double-Differential Approach. Math. Probl. Eng. 2014, 2014, 1–13. [Google Scholar] [CrossRef]
  144. McDonald, S.A.; Devleesschauwer, B.; Speybroeck, N.; Hens, N.; Praet, N.; Torgerson, P.R.; Havelaar, A.H.; Wu, F.; Tremblay, M.; Amene, E.W.; et al. Data-driven methods for imputing national-level incidence in global burden of disease studies. Bull. World Health Organ. 2015, 93, 228–236. [Google Scholar] [CrossRef] [PubMed]
  145. Ding, Z.; Mei, G.; Cuomo, S.; Li, Y.; Xu, N. Comparison of Estimating Missing Values in IoT Time Series Data Using Different Interpolation Algorithms. Int. J. Parallel Program. 2018, 48, 534–548. [Google Scholar] [CrossRef]
  146. Farhangfar, A.; Kurgan, L.; Dy, J. Impact of imputation of missing values on classification error for discrete data. Pattern Recognit. 2008, 41, 3692–3705. [Google Scholar] [CrossRef]
  147. Hodge, V.J.; Austin, J. A Survey of Outlier Detection Methodologies. Artif. Intell. Rev. 2004, 22, 85–126. [Google Scholar] [CrossRef] [Green Version]
  148. Broeck, J.V.D.; Cunningham, S.A.; Eeckels, R.; Herbst, K. Data Cleaning: Detecting, Diagnosing, and Editing Data Abnormalities. PLoS Med. 2005, 2, e267. [Google Scholar] [CrossRef] [Green Version]
  149. Ben-Gal, I. Outlier Detection. In Data Mining and Knowledge Discovery Handbook; Springer: Boston, MA, USA, 2006; pp. 131–146. [Google Scholar] [CrossRef]
  150. Andreas, W.; Karl, H. Data Transport Reliability in Wireless Sensor Networks. St. Petersbg. State Univ. 2005, 28, 86–92. [Google Scholar]
  151. Qiu, J.; Wu, Q.; Ding, G.; Xu, Y.; Feng, S. A survey of machine learning for big data processing. EURASIP J. Adv. Signal Process. 2016, 2016, 327–336. [Google Scholar] [CrossRef] [Green Version]
  152. Ponzoni, I.; Sebastián-Pérez, V.; Requena-Triguero, C.; Roca, C.; Martínez, M.J.; Cravero, F.; Díaz, M.F.; Páez, J.A.; Arrayás, R.G.; Adrio, J.; et al. Hybridizing Feature Selection and Feature Learning Approaches in QSAR Modeling for Drug Discovery. Sci. Rep. 2017, 7, 2403. [Google Scholar] [CrossRef] [Green Version]
  153. Gil, D. IBM Releases Novel AI-Powered Technologies to Help Health and Research Community Accelerate the Discovery of Medical Insights and Treatments for COVID-19. IBM Research Blog, 3 April 2020. [Google Scholar]
  154. Tsidulko, J. AWS Commits To $20M In Cloud Credits to Coronavirus Researchers. CRN, 20 March 2020. [Google Scholar]
  155. Oracle. Oracle Therapeutic Learning System Records Effectiveness of COVID-19 Drugs. Oracle Press Release, 1 April 2020. [Google Scholar]
  156. Jason, C. COVID-19 Exposes Lack of Health Data Exchange, Interoperability. Available online: https://ehrintelligence.com/news/covid-19-exposes-lack-of-health-data-exchange-interoperability (accessed on 10 October 2020).
  157. Candel, A.; LeDell, E.; Parmar, V.; Arora, A. Deep Learning With H2O; H2O.ai Inc.: Mountain View, CA, USA, 2018. [Google Scholar]
  158. Gedeon, T.D. Data Mining of Inputs: Analysing Magnitude and Functional Measures. Int. J. Neural Syst. 1997, 8, 209–218. [Google Scholar] [CrossRef]
  159. Xu, X.; Gu, H.; Wang, Y.; Wang, J.; Qin, P. Autoencoder Based Feature Selection Method for Classification of Anticancer Drug Response. Front. Genet. 2019, 10, 233. [Google Scholar] [CrossRef] [PubMed] [Green Version]
  160. Wong, P.; Gedeon, T.; Taggart, I. An improved technique in porosity prediction: A neural network approach. IEEE Trans. Geosci. Remote Sens. 1995, 33, 971–980. [Google Scholar] [CrossRef]
  161. Mukhra, R.; Krishan, K.; Kanchan, T. COVID-19 Sets off Mass Migration in India. Arch. Med. Res. 2020, 51, 736–738. [Google Scholar] [CrossRef]
  162. Lockdown in India Has Impacted 40 Million Internal Migrants: World Bank—The Hindu. Available online: https://www.thehindu.com/news/international/lockdown-in-india-has-impacted-40-million-internal-migrants-world-bank/article31411618.ece (accessed on 18 October 2020).
  163. Coronavirus: India’s Pandemic Lockdown Turns into a Human Tragedy—BBC News. Available online: https://www.bbc.com/news/world-asia-india-52086274 (accessed on 18 October 2020).
  164. COVID-19 to Plunge Global Economy into Worst Recession since World War II. Available online: https://www.worldbank.org/en/news/press-release/2020/06/08/covid-19-to-plunge-global-economy-into-worst-recession-since-world-war-ii (accessed on 9 November 2020).
  165. R Core Team. R: A Language and Environment for Statistical Computing; Team RC: Vienna, Austria, 2017. [Google Scholar]
  166. US GDP 2Q 2020: Shrinks 32.9% Record Pace Since at Least 1940s—Bloomberg. Available online: https://www.bloomberg.com/news/articles/2020-07-30/u-s-economy-shrinks-at-record-32-9-pace-in-second-quarter (accessed on 12 November 2020).
  167. Xing, Y.-F.; Xu, Y.-H.; Shi, M.-H.; Lian, Y.-X. The impact of PM2.5 on the human respiratory system. J. Thorac. Dis. 2016, 8, E69–E74. [Google Scholar] [PubMed]
  168. Wu, X.; Nethery, R.C.; Sabath, B.M.; Braun, D.; Dominici, F. Exposure to air pollution and COVID-19 mortality in the United States: A nationwide cross-sectional study. medRxiv 2020. [Google Scholar] [CrossRef] [Green Version]
  169. World Air Quality Index (AQI) Ranking|AirVisual. Available online: https://www.iqair.com/us/world-air-quality-ranking (accessed on 25 October 2020).
  170. Tiwari, D.C.S.; Pragya, K.A.P.; Bisht, D.S. Variations in Mass of the PM10, PM2.5 and PM1 during the Monsoon and the Winter at New Delhi. Aerosol Air Qual. Res. 2012, 12, 20–29. [Google Scholar] [CrossRef]
  171. Sembhi, H.; Wooster, M.; Zhang, T.; Sharma, S.; Singh, N.; Agarwal, S.; Boesch, H.; Gupta, S.; Misra, A.; Tripathi, S.N.; et al. Post-monsoon air quality degradation across Northern India: Assessing the impact of policy-related shifts in timing and amount of crop residue burnt. Environ. Res. Lett. 2020, 15, 104067. [Google Scholar] [CrossRef]
  172. Dhaka, S.K.; Dang, C.; Kumar, V.; Panwar, V.; Dimri, A.P.; Singh, N.; Patra, P.K.; Matsumi, Y.; Takigawa, M.; Nakayama, T.; et al. PM2.5 diminution and haze events over Delhi during the COVID-19 lockdown period: An interplay between the baseline pollution and meteorology. Sci. Rep. 2020, 10, 1–8. [Google Scholar] [CrossRef]
  173. Harrell, F.E.; Dupont, C. Hmisc: Harrell Miscellaneous. Available online: https://cran.r-project.org/web/packages/Hmisc/index.html (accessed on 18 March 2021).
  174. Talita, G.; Stephanie, R.; Tamanna, A. A Tale of Three Countries: How did Covid-19 Lockdown Impact Happiness? GLO Discussion Paper No. 584. Available online: https://www.econstor.eu/handle/10419/221748 (accessed on 18 March 2021).
  175. The Mission to Seafarers. Seafarers Happiness Index Q1 2020; The Mission to Seafarers: London, UK, 2020. [Google Scholar]
  176. O’Keeffe, C. Employee Happiness during Covid-19—How Are Employees Feeling during Lockdown? Available online: https://thehappinessindex.com/tech/employee-happiness-covid19/ (accessed on 1 November 2020).
  177. Li, D.; Chaudhary, H.; Zhang, Z. Modeling Spatiotemporal Pattern of Depressive Symptoms Caused by COVID-19 Using Social Media Data Mining. Int. J. Environ. Res. Public Health 2020, 17, 4988. [Google Scholar] [CrossRef]
  178. Lamsal, R. Corona Virus (COVID-19) Geolocation-based Sentiment Data. IEEE Dataport 2020. [Google Scholar] [CrossRef]
  179. Government of India. Aarogya Setu Mobile App; Government of India: New Delhi, India, 2020.
  180. AlOmari, E.; Katib, I.; Albeshri, A.; Mehmood, R. COVID-19: Detecting Government Pandemic Measures and Public Concerns from Twitter Arabic Data Using Distributed Machine Learning. Int. J. Environ. Res. Public Health 2021, 18, 282. [Google Scholar] [CrossRef]
  181. Hummel, P.; Braun, M.; Dabrock, P. Own Data? Ethical Reflections on Data Ownership. Philos. Technol. 2020, 2020, 1–28. [Google Scholar] [CrossRef]
  182. Mikk, K.A.; Sleeper, H.A.; Topol, E.J. The Pathway to Patient Data Ownership and Better Health. JAMA 2017, 318, 1433–1434. [Google Scholar] [CrossRef]
  183. Contreras, J.L.; Rumbold, J.; Pierscionek, B. Patient Data Ownership. JAMA 2018, 319, 935. [Google Scholar] [CrossRef] [Green Version]
  184. Lin, L.; Martin, T.W. How Coronavirus Is Eroding Privacy. The Wall Street Journal, 15 April 2020. [Google Scholar]
  185. Solangi, Z.A.; Solangi, Y.A.; Chandio, S.; Aziz, M.B.S.A.; Bin Hamzah, M.S.; Shah, A. The future of data privacy and security concerns in Internet of Things. In Proceedings of the 2018 IEEE International Conference on Innovative Research and Development (ICIRD), Bangkok, Thailand, 11–12 May 2018; pp. 1–4. [Google Scholar]
  186. Lessig, L. Privacy as property. Soc. Res. Int. Q. 2002, 69, 247–269. [Google Scholar]
  187. Purtova, N. Property in personal data. A European perspective on the instrumentalist theory of propertisation. Eur. J. Leg. Stud. 2010, 2, 193–208. [Google Scholar]
  188. Montgomery, J. Data Sharing and the Idea of Ownership. New Bioeth. 2017, 23, 81–86. [Google Scholar] [CrossRef] [PubMed]
  189. Purtova, N. The illusion of personal data as no one’s property. Law Innov. Technol. 2015, 7, 83–111. [Google Scholar] [CrossRef]
  190. Rodwin, M.A. The Case for Public Ownership of Patient Data. JAMA 2009, 302, 86. [Google Scholar] [CrossRef] [PubMed]
  191. Carter, A.B. Considerations for Genomic Data Privacy and Security when Working in the Cloud. J. Mol. Diagn. 2019, 21, 542–552. [Google Scholar] [CrossRef] [PubMed] [Green Version]
  192. Terzi, D.S.; Terzi, R.; Sagiroglu, S. A survey on security and privacy issues in big data. In Proceedings of the 2015 10th International Conference for Internet Technology and Secured Transactions (ICITST), London, UK, 14–16 December 2015; pp. 202–207. [Google Scholar]
  193. Xu, L.; Jiang, C.; Wang, J.; Yuan, J.; Ren, Y. Information Security in Big Data: Privacy and Data Mining. IEEE Access 2014, 2, 1149–1176. [Google Scholar] [CrossRef]
  194. Jain, P.; Gyanchandani, M.; Khare, N. Big data privacy: A technological perspective and review. J. Big Data 2016, 3, 25. [Google Scholar] [CrossRef] [Green Version]
  195. Show evidence that apps for COVID-19 contact-tracing are secure and effective. Nat. Cell Biol. 2020, 580, 563. [CrossRef]
  196. Al-Dhubhani, R.S.; Cazalas, J.; Mehmood, R.; Katib, I.; Saeed, F. A Framework for Preserving Location Privacy for Continuous Queries. In Advances in Human Factors, Business Management, Training and Education; Springer: Cham, Switzerland, 2020; Volume 1073, pp. 819–832. [Google Scholar]
  197. Al-Dhubhani, R.; Mehmood, R.; Katib, I.; Algarni, A. Location Privacy in Smart Cities Era. In Lecture Notes in Computer Science (Including Subseries Lecture Notes in Artificial Intelligence and Lecture Notes in Bioinformatics); Springer: Cham, Switzerland, 2018; Volume 224, pp. 123–138. [Google Scholar]
  198. Ayres, G.; Mehmood, R. LocPriS: A security and privacy preserving location based services development framework. In Lecture Notes in Computer Science (Including Subseries Lecture Notes in Artificial Intelligence and Lecture Notes in Bioinformatics); Part 4; Springer: Cham, Switzerland, 2010; Volume 6279, pp. 566–575. [Google Scholar]
  199. Sparks, H.; Collins, F.L.; Kearns, R. Reflecting on the risks and ethical dilemmas of digital research. Geoforum 2016, 77, 40–46. [Google Scholar] [CrossRef]
  200. Facca, D.; Smith, M.J.; Shelley, J.; Lizotte, D.; Donelle, L. Exploring the ethical issues in research using digital data collection strategies with minors: A scoping review. PLoS ONE 2020, 15, e0237875. [Google Scholar] [CrossRef] [PubMed]
  201. Huang, X.; O’Connor, M.; Ke, L.S.; Lee, S. Ethical and methodological issues in qualitative health research involving children: A systematic review. Nurs. Ethics 2016, 23, 339–356. [Google Scholar] [CrossRef]
  202. Hokke, S.; Hackworth, N.J.; Quin, N.; Bennetts, S.K.; Win, H.Y.; Nicholson, J.M.; Zion, L.; Lucke, J.; Keyzer, P.; Crawford, S.B. Ethical issues in using the internet to engage participants in family and child research: A scoping review. PLoS ONE 2018, 13, e0204572. [Google Scholar] [CrossRef] [PubMed]
  203. Curtis, B.L. Social Networking and Online Recruiting for HIV Research: Ethical Challenges. J. Empir. Res. Hum. Res. Ethics 2014, 9, 58–70. [Google Scholar] [CrossRef] [PubMed] [Green Version]
  204. Dike, C.C.; Candilis, P.; Kocsis, B.; Sidhu, N.; Recupero, P. Ethical Considerations Regarding Internet Searches for Patient Information. Psychiatr. Serv. 2019, 70, 324–328. [Google Scholar] [CrossRef]
  205. Buchanan, E.A.; Hvizdak, E.E. Online Survey Tools: Ethical and Methodological Concerns of Human Research Ethics Committees. J. Empir. Res. Hum. Res. Ethics 2009, 4, 37–48. [Google Scholar] [CrossRef]
  206. Cullen, R. Addressing the digital divide. Online Inf. Rev. 2001, 25, 311–320. [Google Scholar] [CrossRef] [Green Version]
  207. Matzat, U.; van Ingen, E. Social inequality and the digital transformation of Western society: What can stratification research and digital divide studies learn from each other? In Soziologie des Digitalen—Digitale Soziologie? Nomos Verlagsgesellschaft mbH & Co. KG: Baden-Baden, Germany, 2020; pp. 379–397. [Google Scholar]
  208. AlOmari, E.; Mehmood, R.; Katib, I. Sentiment Analysis of Arabic Tweets for Road Traffic Congestion and Event Detection. In Smart Infrastructure and Applications: Foundations for Smarter Cities and Societies; Springer International Publishing: Cham, Switzerland, 2020; pp. 37–54. [Google Scholar]
  209. AlOmari, E.; Mehmood, R.; Katib, I. Road Traffic Event Detection Using Twitter Data, Machine Learning, and Apache Spark. In Proceedings of the 2019 IEEE SmartWorld, Ubiquitous Intelligence & Computing, Advanced & Trusted Computing, Scalable Computing & Communications, Cloud & Big Data Computing, Internet of People and Smart City Innovation (SmartWorld/SCALCOM/UIC/ATC/CBDCom/IOP/SCI), Leicester, UK, 19–23 August 2019; pp. 1888–1895. [Google Scholar]
  210. Suma, S.; Mehmood, R.; Albeshri, A. Automatic Detection and Validation of Smart City Events Using HPC and Apache Spark Platforms. In Smart Infrastructure and Applications: Foundations for Smarter Cities and Societies; Springer: Cham, Switzerland, 2020; pp. 55–78. [Google Scholar]
  211. Alsulami, M.; Mehmood, R. Sentiment Analysis Model for Arabic Tweets to Detect Users’ Opinions about Government Services in Saudi Arabia: Ministry of Education as a case study. In Proceedings of the Al Yamamah Information and Communication Technology Forum, Riyadh, Saudi Arabia, 4–5 March 2018; pp. 1–8. [Google Scholar]
  212. AlOmari, E.; Katib, I.; Mehmood, R. Iktishaf: A Big Data Road-Traffic Event Detection Tool Using Twitter and Spark Machine Learning. Mob. Netw. Appl. 2020, 1–16. [Google Scholar] [CrossRef]
  213. Almagor, J.; Picascia, S. Exploring the effectiveness of a COVID-19 contact tracing app using an agent-based model. Sci. Rep. 2020, 10, 1–11. [Google Scholar] [CrossRef]
  214. Kretzschmar, M.E.; Rozhnova, G.; Bootsma, M.C.J.; van Boven, M.; van de Wijgert, J.H.H.M.; Bonten, M.J.M. Impact of delays on effectiveness of contact tracing strategies for COVID-19: A modelling study. Lancet Public Health 2020, 5, e452–e459. [Google Scholar] [CrossRef]
  215. Alamoudi, E.; Mehmood, R.; AlJudaibi, W.; Albeshri, A.; Hasan, S.H. Open Source and Open Data Licenses in the Smart Infrastructure Era: Review and License Selection Frameworks. Adv. Controll. Smart Cities 2019, 537–559. [Google Scholar] [CrossRef]
  216. Arfat, Y.; Usman, S.; Mehmood, R.; Katib, I. Big Data Tools, Technologies, and Applications: A Survey. In Smart Infrastructure and Applications Foundations for Smarter Cities and Societies; Springer: Cham, Switzerland, 2020; pp. 453–490. [Google Scholar]
  217. Alotaibi, S.; Mehmood, R.; Katib, I. The Role of Big Data and Twitter Data Analytics in Healthcare Supply Chain Management. In Smart Infrastructure and Applications Foundations for Smarter Cities and Societies; Springer: Cham, Switzerland, 2020; pp. 267–279. [Google Scholar]
  218. Alamoudi, E.; Mehmood, R.; Albeshri, A.; Gojobori, T. A Survey of Methods and Tools for Large-Scale DNA Mixture Profiling. Adv. Controll. Smart Cities 2020, 217–248. [Google Scholar] [CrossRef]
  219. Arfat, Y.; Usman, S.; Mehmood, R.; Katib, I. Big Data for Smart Infrastructure Design: Opportunities and Challenges. In Smart Infrastructure and Applications Foundations for Smarter Cities and Societies; Springer: Cham, Switzerland, 2020; pp. 491–518. [Google Scholar]
  220. Mehmood, R.; Graham, G. Big Data Logistics: A health-care Transport Capacity Sharing Model. Procedia Comput. Sci. 2015, 64, 1107–1114. [Google Scholar] [CrossRef] [Green Version]
  221. Suma, S.; Mehmood, R.; AlBugami, N.; Katib, I.; Albeshri, A. Enabling Next Generation Logistics and Planning for Smarter Societies. Procedia Comput. Sci. 2017, 109, 1122–1127. [Google Scholar] [CrossRef]
  222. Aqib, M.; Mehmood, R.; Alzahrani, A.; Katib, I. A Smart Disaster Management System for Future Cities Using Deep Learning, GPUs, and In-Memory Computing. In Smart Infrastructure and Applications Foundations for Smarter Cities and Societies; Springer: Cham, Switzerland, 2020; pp. 159–184. [Google Scholar]
  223. How Coronavirus Is Accelerating a Future with Autonomous Vehicles|MIT Technology Review. Available online: https://www.technologyreview.com/2020/05/18/1001760/how-coronavirus-is-accelerating-autonomous-vehicles/ (accessed on 3 August 2020).
  224. Securing the Future of Mobility for a Post-Pandemic World. Available online: https://www.intelligenttransport.com/transport-articles/101306/securing-the-future-of-mobility-for-a-post-pandemic-world/ (accessed on 3 August 2020).
  225. The Role of Drones and Self-Driving Cars in the Pandemic|2020-05-27|SupplyChainBrain. Available online: https://www.supplychainbrain.com/articles/31400-the-role-of-drones-and-self-driving-cars-in-the-pandemic (accessed on 3 August 2020).
Figure 1. Top 20 countries in the world by cases and deaths (cumulative total per 100,000 population).
Sustainability 13 03797 g001
Figure 2. Month-wise clusters for the number of confirmed cases in the world.
Sustainability 13 03797 g002
Figure 3. iResponse framework block diagram.
Sustainability 13 03797 g003
Figure 4. The technical system architecture of the iResponse framework.
Sustainability 13 03797 g004
Figure 5. (A) Infection can grow exponentially from one infected person; (B) chain of transmission is broken, significantly reducing the number of newly infected cases.
Sustainability 13 03797 g005
Figure 6. Algorithm for analyzing sentiments of the people.
Sustainability 13 03797 g006
Figure 7. Week-wise sentiment analysis for the seriousness of people.
Sustainability 13 03797 g007
Figure 8. Human activity prediction accuracy in %.
Sustainability 13 03797 g008
Figure 9. (A) Places infected residents visited in the last 15 days. (B) Shown, in detail, the places visited by infected persons with zoom.
Sustainability 13 03797 g009
Figure 10. High risk areas where a resident who is infected visited.
Sustainability 13 03797 g010
Figure 11. City map showing in real-time the hot spots violating social distancing. The bigger the hot spots, the higher the number of Wi-Fi and cellular users presence.
Sustainability 13 03797 g011
Figure 12. Infographic to show the benefits of connected autonomous vehicles (CAVs).
Sustainability 13 03797 g012
Figure 13. Data visualization on the dashboard.
Sustainability 13 03797 g013
Figure 14. Importance of the integration of various sub-systems.
Sustainability 13 03797 g014
Figure 15. iResponse: devising optimal strategies for sustainable pandemic management.
Sustainability 13 03797 g015
Figure 16. Pandemic measures for COVID-19 control.
Sustainability 13 03797 g016
Figure 17. The relative impact of 12 pandemic measures on the daily number of COVID-19 cases by country.
Sustainability 13 03797 g017
Figure 18. The relative impact of the mobility features on card transactions (card spending).
Sustainability 13 03797 g018
Figure 19. The relative impact of the pandemic measures on card transactions.
Sustainability 13 03797 g019
Figure 20. Correlation matrices between card spending and pandemic measures (left) and mobility features (right).
Sustainability 13 03797 g020
Figure 21. PM2.5 during 2019 and 2020 for Karachi (Pakistan), Delhi (India), and Dhaka (Bangladesh).
Sustainability 13 03797 g021
Figure 22. Relative impact of mobility features on environment (air quality) for Karachi, Delhi, and Dhaka.
Sustainability 13 03797 g022
Figure 23. Relative impact of pandemic measures on environment (air quality) for Karachi, Delhi, and Dhaka.
Sustainability 13 03797 g023
Figure 24. Correlation between mobility features (left column), pandemic measures (right column), and air quality for Karachi (top row), Delhi (middle row), and Dhaka (bottom row).
Sustainability 13 03797 g024
Figure 25. The p-values of the correlation between mobility features (left column), pandemic measures (right column), and air quality for Karachi (top row), Delhi (middle row), and Dhaka (bottom row).
Sustainability 13 03797 g025
Figure 26. Happiness measured by six happiness factors (year 2019).
Sustainability 13 03797 g026
Table 1. Frameworks for dealing with a specific aspect of COVID-19.
No.PaperObjectiveLimitation
1.Farooq and Hafeez [73]To differentiate between COVID-19 and other pneumonia cases using deep learningSpecific to one problem
2.Khashan et al. [102]To execute complex big data queriesSpecific to one problem
3.Rao and Vazquez [72]AI-based COVID-19 detection using a mobile phone-based web surveySpecific to one problem
4.Chen et al. [103]Classification between severe and non-severe COVID-19 casesSpecific to one problem and limited to Wuhan
Table 2. The features used in the four case studies.
Card Spending (Transactions)CodesPandemic MeasuresCodesMobility FeaturesCodes
Furniture and Home Furnishings StoresCS01Cancel Public EventsPM01Grocery and PharmacyMF01
Electronics and Appliance StoresCS02Close Public TransportPM02ParksMF02
Building Material and Garden Equip and Supplies DlrsCS03International Travel RestrictionsPM03ResidentialMF03
Food and Beverage StoresCS04Public Information CampaignsPM04Retail and RecreationMF04
Health and Personal Care StoresCS05Restrictions on GatheringsPM05Transit StationsMF05
Gasoline StationsCS06Restrictions on Internal MovementPM06WorkplacesMF06
Clothing and Accessories StoresCS07School ClosuresPM07
Sporting Goods, Hobby, Musical Instr and Book StoresCS08Stay at HomePM08Happiness Features
General Merchandise StoresCS09Stringency IndexPM09GDP Per CapitaHF01
Miscellaneous Store RetailersCS10Testing PolicyPM10Social SupportHF02
Nonstore RetailersCS11Workplace ClosuresPM11Healthy Life Expectancy at BirthHF03
Ambulatory Health Care ServicesCS12Contact TracingPM12Freedom to Make Life ChoicesHF04
Amusement, Gambling, and Recreation IndustriesCS13 GenerosityHF05
AccommodationCS14 Perception of CorruptionHF06
Food Services and Drinking PlacesCS15 Subjective Well-Being inequalityHF07
Repair and MaintenanceCS16
Automotive Parts, Accessories, and Tire StoresCS17
Publisher’s Note: MDPI stays neutral with regard to jurisdictional claims in published maps and institutional affiliations.

