Article

A Comprehensive Study of Spatiotemporal Variations in Temperature Extremes across China during 1960–2018

1
State Key Laboratory of Resources and Environmental Information System, Institute of Geographic Sciences and Natural Resources Research, Chinese Academy of Sciences, Beijing 100101, China
2
College of Resources and Environment, University of Chinese Academy of Sciences, Beijing 100101, China
3
Jiangsu Center for Collaborative Innovation in Geographic Information Resource Development and Application, Nanjing 210023, China
4
Key Laboratory of Regional Sustainable Development Modeling, Institute of Geographical Sciences and Natural Resources Research, CAS, Beijing 100101, China
*
Author to whom correspondence should be addressed.
Sustainability 2021, 13(7), 3807; https://doi.org/10.3390/su13073807
Submission received: 2 February 2021 / Revised: 23 March 2021 / Accepted: 25 March 2021 / Published: 30 March 2021

Abstract

:
Understanding the changing patterns of extreme temperatures is important for taking measures to reduce their associated negative impacts. Based on daily temperature data derived from 2272 meteorological stations in China, the spatiotemporal variations in temperature extremes were examined with respect to covariates by means of the Mann–Kendall test and a spatiotemporal model during 1960–2018. The results indicated that the temporal changes in cold extremes showed decreasing trends and warm extremes experienced increasing trends across almost all of China, with mean change rates of −3.9 days, −1.8 days, 3.7 days and 2.3 days per decade for TN10p, TX10p, TN90p and TX90p, respectively. Nighttime warming/cooling was higher than daytime warming/cooling, which indicated that trends in minimum temperature extremes are more rapid than trends in maximum temperature extremes. In addition, the temporal effect on the temperature extremes varied throughout the year, with significant increasing trends in the temporal heterogeneity of warm extremes occurring during 1992–2018. The areas with strong spatial heterogeneity of cool nights mainly included northeastern and central China, and the spatial variation on cool days was more prominent in northern China. For warm nights, the areas showing high spatial heterogeneity were mainly located in the northwestern part of China, while areas for warm days were distributed in northern China. Our results provide meaningful information for a deeper understanding of the spatiotemporal variations in temperature extremes across mainland China.

1. Introduction

The Intergovernmental Panel on Climate Change, Fifth Assessment Report, indicated an increase in surface air temperature worldwide during the last several decades, with warming projected to continue in the future [1]. Consistent with global climate change, the number of extreme climate events has increased, with more warm extreme events and fewer cool extreme events occurring on different spatial and temporal scales around the world [2,3,4]. Extreme climate events can cause devastating impacts on natural environments and human societies, such as eco-environmental systems, agricultural products, economic development, social stability, urban planning and human health [5,6,7]. From 1995 to 2015, more than 6000 recorded extreme events generated 90% of the world’s major disasters, leaving more than 600,000 people dead and an additional 4.1 billion injured [8]. A better understanding of the trends and variations in climate extremes is crucial not only for making reliable projections of future changes in climate extremes but also for addressing the special concerns of scientific researchers and decision-makers.
In recent decades, studies on extreme temperature events have received increasing attention throughout the world. With global warming, spatial differences exist in the changing patterns of temperature extremes due to the complex interaction between local and regional factors and the nonlinear climate system [9]. Studies have suggested that significantly increasing warm extremes and decreasing cold extremes have been detected over 70% of the globe, including Australia, Europe, and South America [10,11,12,13]. In China, temperatures have changed significantly in recent decades [14,15,16]. The annual mean temperature has increased by 1.1–1.4 °C at rates of 0.22–0.35 °C per decade, which is higher than the global average over the past 50 years [16,17]. In line with surface warming trends, widespread changes in temperature extremes have been detected across China [18,19,20,21,22]. Shi et al. [15] suggested that warm days have increased by 0–0.3% per decade in most parts of China. Ren et al. [14] showed that warm events increased, while cold extreme events decreased significantly. Sun et al. [23] found significant decreases in the occurrence of cold extremes in most regions of China. It is clear that regional differences have been observed for extreme temperature indices in response to the background conditions of various areas, and it is very important to study the spatial differences by considering the complicated natural and human environments across the country.
Currently, researches on extreme climate events mainly focus on studying the spatiotemporal changes in temperature extremes, conducting analyses and discussing the various influencing factors involved in extreme temperatures [24,25,26]. Studies have examined extreme temperature changes in parts of China and throughout China, and it has been shown that these changes in extreme temperature are closely related to climate warming and atmospheric circulation based on the result of univariate linear regression and correlation analysis [27,28,29]. These analyses, however, ignored the spatial and temporal effects on the temperature extremes and failed to sufficiently reveal the spatiotemporal heterogeneity in temperature extremes. The temperature extremes in China vary with region and exhibit high spatial heterogeneity due to the combined effects of natural and human forces. Thus, it is necessary to conduct a comprehensive examination of spatiotemporal variations in temperature extremes and their variability attributable to locations and time, especially in large areas, by considering the spatiotemporal structure of the temperature extremes, which has great significance for formulating adaptive strategies for extreme climate events.
The aim of this study was to provide an improved understanding of the spatiotemporal variations in climate extremes by using the Mann–Kendall statistical test, a spatiotemporal method and a dense meteorological observation network of more than 2000 stations across China from 1960 to 2018. The parameter estimates of the spatiotemporal model were obtained via the integrated nested Laplace approximations (INLA) method [30], which provides a simple way to compute complicated models that include spatial and temporal structures. In Section 2, we describe the dataset and the methods. The results are presented in Section 3. A discussion and conclusions are given in Section 4 and Section 5, respectively.

2. Data and Methods

2.1. Data

Daily temperature observations from 2419 weather stations in China were obtained from the China Meteorological Administration (CMA). The dataset was quality controlled and homogeneity-adjusted. RClimDex software was used for quality control. Daily temperature values were considered anomalous if the deviations from the mean temperature value over the 1981–2010 reference period were greater than four standard deviations. The outliers were manually checked and edited by consulting the data center. The inhomogeneities in this study were tested using the RHtest [31]. The inhomogeneous data were then excluded from the data series and not adjusted, as has been suggested by some researchers [2,32]. Finally, 2272 observations with consistent and missing data less than 5% were used during the period 1960–2018, representing a relatively complete sequence (Figure 1). The distribution of those stations is nonuniform, with approximately 75% of them located in areas with elevations below 1000 m. The average elevation of these stations is 653 m, the maximum elevation is 4800 m, and 1% of the stations are located above 4000 m. Most stations are distributed across eastern China, which has a developed economy, dense population and intense human activity. We considered four percentile-based extreme temperature indices in this research (Table 1), including TN10p (cool nights), TN90p (warm nights), TX10p (cool days), and TX90p (warm days), which were calculated based on definitions by the IPCC Special Report on Extreme Events with the reference period of 1980–2010 [2,33].
There is now a general consensus that natural forces and human activities are the main drivers of extreme events [34,35,36]. We limited covariates that were relevant to temperature extremes and were readily available at the national scale during the study time period. China is located in Southeast Asia, west of the Pacific Ocean, and has complicated and varied topography. The terrain descends in altitude from west to east, and the landmass extends out into the ocean to the east. A digital elevation model (DEM), which was obtained from http://srtm.csi.cgiar.org/SELECTION/inputCoord.asp in 3 April 2020, was used as one of the covariates of temperature extremes. The E1 Niño-Southern Oscillation (ENSO) phenomenon, the best-known natural fluctuation inherent in the global climate system, has teleconnection signals throughout the globe and has direct and indirect impacts on extreme events, which are exerted at different magnitudes in different regions of the world [37]. China’s climate is influenced by the East Asian monsoon, which is significantly affected by ENSO [38]. The Niño 3.4 index (N3.4), available from http://www.esrl.noaa.gov/psd/data/correlation/nina34 in 29 April 2020, was used in this study and is one of the most commonly used indices to define E1 Niño and La Niña events. Additionally, the distances between the meteorological stations and the sea were computed using ArcGIS to characterize the contribution of the sea to extreme temperature changes. Previous studies have enriched the evidence of the impact of urbanization on the climate record and its extremes [24,26,39]. The time series of nighttime light data (NTL) has been used by some researchers to estimate the urbanization process from local and regional to global scales [40,41,42]. An integrated and consistent NTL dataset from 1992 to 2018 was used by harmonizing the intercalibrated NTL observations from the Defense Meteorological Satellite Program’s (DMSP) Operational Linescan System (OLS) and the Visible Infrared Imaging Radiometer Suite (VIIRS) instruments [43].

2.2. Methods

The Mann–Kendall statistical test was used to evaluate the statistical significance of the change trend of temperature extremes at the 5% significance level, and the test is not very sensitive to outliers and missing values [44]. The rate of the trend was estimated by Sen’s slope [45]. The geographic variations in the four extreme temperature indices with respect to four influencing factors were analyzed.
To assess the spatiotemporal variations in temperature extremes and their variations with the change in covariates, a spatiotemporal model was applied. A Thiessen polygon was generated based on the meteorological stations, creating 2272 small geographic regions for the whole study area, and they were indexed by j { 1 , , 2272 } . The temperature extremes were estimated for each of these regions for t { 1992 , , 2018 } time periods. Specifically, let Y j t be the temperature event in area j { 1 , , 2272 } at time t { 1992 , , 2018 } , and the spatiotemporal model can be developed as follows:
log ( Y j t ) = β 0 + S j + T t + C j t + X j t β
where β 0 is the intercept, and S j is the spatial component that reflects the degrees of spatial heterogeneity in the temperature extremes across China, that is, the variability in temperature extremes attributable to a location. T t is the time structure representing the temporal heterogeneity of the temperature extremes that varies throughout the year; C j t is the residual spatiotemporal interaction term providing spatial variations not accounted for by the main space and time effects; X j t represents the covariates including the DEM, ENSO, urbanization and distance to the sea of region j and time t ; and β denotes the vector of the regression coefficients. To assist in the interpretation of the relative influences of the covariates on the temperature extremes, predictor variables were centered and scaled by subtracting the mean and dividing by the standard deviation. The parameters of the model were computed through an integrated nested Laplace approximation (INLA) in R software [46,47].

3. Results

The temporal variations in regionally averaged annual extreme temperature events in China during 1960–2018 are shown in Figure 2. The red line denotes the decadal mean value of the temperature extremes. TN10p decreased at a rate of 3.9 days per decade from 1960 to 2018 for the whole of China (Figure 2a). The average decadal value were the largest in the 1960s (50.1 days) and the smallest in the 2000s (32.0 days), and then slightly increased during 2010–2018 (34.5 days) (Table 2). TX10p increased firstly during 1960s with a change rate of 1.7 days per decade and decreased after 1970 with the minimum value of 21.7 days occurred in 2007. The regionally averaged trend was −1.8 days per decade for TX10p, with a higher decadal mean value of 40.3 days in the 1960s and a lower value of 34.2 days during 2010–2018 (Figure 2b, Table 2). The regionally averaged trends were 3.7 days and 2.3 days per decade for TN90p and TX90p, respectively, which indicated that the nighttime warming was higher than daytime warming during 1960–2018. TN90p decreased at a rate of 5.9 days per decade during the 1960s with the mean value of 29.6 days, and increased during 1970–2018 with the maximum value of 56.8 days which occurred in 2018 (Figure 2c). For TN90p, Student’s t test indicated that significant changes occurred between the 2000s and the period 2010–2018, with mean values of 40.3 days and 47.5 days, respectively (Table 2). TX90p decreased during 1960s, 1970s, and 1980s, while it increased with a change rate of 5.4 days per decade during 1990–2018. In addition, significant changes occurred from 1990s to 2000s, and 2000s to the period 2010–2018, with TX90p values of 34.8 days, 40.9 days, and 45.5 days in 1990s, 2000s, and the period 2010–2018, respectively (Figure 2d, Table 2).
The spatial patterns of annual mean cool nights (TN10p), cool days (TX10p), warm nights (TN90p) and warm days (TX90p) over the period from 1960 to 2018 are displayed in Figure 3, which were interpolated at a spatial resolution of 1 km × 1 km by using the inverse distance weighted (IDW) method in a GIS environment with default parameters. The maximum value of TN10p was 55.4 days/year, and the low values were mainly located in the Tibetan Plateau, south of the Yangtze River, and Shanxi Province, with a minimum value of 25.4 days/year. The regional average value of cool nights was 39.8 days/year across the country, with a standard deviation of 1.9 days/year. Cool nights above the average value affected 51.6% of China’s total land area. For the cool days, the high values were mainly distributed in the northeast and northwest, with a maximum value of 50.7 days/year. The low values were mainly located in southwestern China, with a minimum value of 29.6 days/year. The regional average TX10p was 37.8 days/year, and the standard deviation was 1.6 days/year, which was smaller than that of the cool nights, indicating a smaller cool day spatial variation. Cool days with values greater than 37.8 days/year accounted for approximately 53.4% of mainland China. The average values were 34.5 days/year and 35.7 days/year, and the standard deviations were both 1.5 days/year for TN90p and TX90p, respectively (Table 3). High values of TN90p were mainly observed in the middle of China, while low values were mainly distributed in South China. For TX90p, the high values were mainly located in the middle of China, especially in Guizhou and Henan Provinces and their surrounding areas (Figure 3d). The low values of TX90p were mainly distributed in southern and northwestern China. Values greater than 34.5 days/year accounted for 51.3% for TN90p, and values above 35.7 days/year accounted for 44.7% for TX90p. The spatial variations in the four temperature extremes indicated the important role of nonstationary natural and human forces. Compared with other regions, Northeast and Northwest China showed more cold extremes and fewer warm extremes; the area between Yellow and Yangtze rivers experienced more warm nights, while this pattern moved south for warm days.
Figure 4 depicts the spatial variations in trends and the stations with significant changes in the four percentile-based extreme indices at the 5% level. The trend was calculated based on Sen’s slope [45], and the map was interpolated by using the IDW method. Clear decreases in extreme cold nights and days (TN10p and TX10p) were observed in almost all of China, accounting for 99.8% and 99.2%, respectively, of the total land area of China. The large negative trends of TN10p and TX10p were both found in the area of the Tibetan Plateau, with maximum decrease rates of 15 days and 12 days per decade, respectively. In most regions, TN10p decreased significantly at rates of 1.7–14.8 days per decade, accounting for 75.2% of the total stations (Figure 4a). At 46.8% of the stations, TX10p decreased significantly in China, distributed mainly in the Yellow River Basin, Jiangsu and Yunnan Provinces (Figure 4b). The magnitude of the change trends of TN90p ranged from 0.01 to 14.6 days per decade, with a mean change rate of 4.6 days per decade and a large magnitude over southwestern China. TN90p increased in almost all of China, taking up 99.6% of the total land area; and at 65.3% of the total stations, it increased significantly at rates of 1.7–14.6 days per decade. Approximately 97.9% of the total land area experienced an increasing trend for TX90p, with the maximum increase rate of 16.1 days per decade occurring in Yunnan Province. Regions with significantly increased warm days were mainly concentrated in the southeastern coast area, southwest and north China, and TX90p changed significantly at 69.3% of the total stations, with significant increasing rates of 1.3–16.1 days per decade.
Figure 5 displays the spatial heterogeneity of temperature extremes during 1992–2018 by using the spatiotemporal model with respect to the four covariates, where the heterogeneous impact of locations is clearly shown. Considering the NTL time series data spanning from 1992 to 2018, we conducted our analysis during this period in the following text. A spatial estimate exceeding 1 means strong spatial heterogeneity, and ‘+’ denotes the extremes with high spatial heterogeneity identified to at least the 95% probability level. The variability in cool nights (TN10p) attributable to location was high, mainly in the northeast, part of the northwest, southeastern coastal area and Central China (Figure 5a). The areas with high spatial heterogeneity of TX10p were mainly observed in northern China, Guizhou Province and its surrounding areas (Figure 5b). The spatial variations in warm nights (TN90p) were more prominent over northwestern China than in the southeast and were significant in Gansu Province, parts of the Tibetan Plateau, Yunnan Province and the Xinjiang Uygur autonomous region. For TX90p, areas with strong spatial heterogeneity mainly included the northern part of China, and areas with strong spatial heterogeneity identified to at least the 95% probability level were mainly located in Gansu Province and its surrounding areas.
The temporal effect on the temperature extremes is presented in Figure 6. The points above the dashed line indicate obvious variations in temperature extremes throughout the year, and the red points denote large variations occurring with probabilities larger than 95%. The relatively large variation was 9 years for cool extremes (TN10p and TX10p) and 10 and 9 years for warm extremes (TN90p and TX90p), respectively, at probability levels greater than 95%. The temporal variations in warm extremes mainly occurred after 2004. In addition, the Mann–Kendall statistical test demonstrated that significant increasing trends in the temporal heterogeneity of warm extremes were observed from 1992 to 2018, with significantly faster increases in the years between 2012 and 2018 (Figure 6c,d) according to Student’s t-test; this was the period when China implemented a new urbanization agenda. Student’s t-test also showed that significant differences existed in the temporal variability of warm extremes (TN90p and TX90p) from T1 (1992–1997) to T2 (1998–2012) and T2 to T3 (2013–2018) (Table 4), which may be due to the strong El Niño event in 1997 and the national new urbanization development stage after 2012 [48,49]. However, the year-to-year variations in cool extremes did not show any trends at a significance level of 5%.
The effects of the four explanatory variables on extreme temperature events, including anthropogenic features, circulation patterns, and both geographical and topographical factors, were analyzed (Figure 7), and these variables have been generally understood and investigated individually by many studies [4,38,39,40,41,42]. In the figure, the box width shows the 2.5–97.5 percentile, that is, the 95% credibility interval, and the mean of the fixed effect parameter is denoted by a vertical red line within each box. The negative effects of the ENSO event on TN10p, TX10p, TN90p and TX90p were detected with some uncertainties at the 94%, 82%, 95% and 80% levels, respectively. It can be concluded that, compared to that for the day-related indices (TX10p and TX90p), the ENSO played a relatively stronger negative role for the night-related indices (TN10p and TN90p). A larger effect was seen for indices of the daily minimum temperature than those related to the daily maximum temperature. The distance to the sea (Dist.) had a positive effect on TN10p and negative effects on TX10p and TN90p, with probabilities of 98%, 87% and 100%, respectively; meanwhile, the effect of Dist. on TX90p was undetectable, as the median of the 95% confidence interval was close to zero. The negative effects of the DEM on TN10p, TX10p and TN90p were clearly detected, with probabilities of 97%, 100% and 92%, respectively, while the DEM had a weak negative effect on TX90p (at a 66% probability level). Strong positive effects of urbanization on TX10p and TX90p are shown in Figure 7, suggesting that anthropogenic forces might be the most important factor for day-related temperature extremes. For the night-related indices, the effect of urbanization on TN10p was undetectable for all of China, while urbanization had a negative effect on TN90p, with a probability of 78%. In general, strong positive effects of urbanization on the indices related to the daily maximum temperature (Figure 7b,d) were prevalent across the country, while the effect on the indices of daily minimum temperature showed regionally marked variations (Figure 7a,c).

4. Discussion

Global warming has led to large changes of local temperatures, causing more frequent heat events in the Northern Hemisphere [50]. There is an ongoing interest in exploring the possible changes in climate extremes since they can cause significant damage to both the natural environment and human society [51]. Although the variability of temperature extremes has been the focus of attention during the past several decades, most of the previous studies concerning the changing trends of the temperature extremes have ignored their spatial patterns, characteristics and spatiotemporal heterogeneity [10,11,12,13,14,15,21,22,23,52]. Moreover, existing studies mainly relied on the methods of linear trend analysis, Mann–Kendall test and Pearson correlation analysis but failed to consider the spatial and temporal effects in the methods [26,29,53,54]. In this study, we provide a comprehensive investigation of the spatiotemporal variations of the four temperature extremes by using Mann–Kendall test and a spatiotemporal model with respect to covariates from the perspectives of both humans and nature, and this approach incorporates the spatial and temporal effects of extreme indices. In addition, the influences and uncertainties of the effect of covariates, including circulation patterns, proximity to the coastal environment, topography, and anthropogenic factors on temperature extremes were analyzed in this study.
To the best of our knowledge, there is little related analysis on the spatial patterns of the temperature extremes across China, which is of great importance to agriculture and ecology. The characteristics of the temperature extremes were investigated based on GIS software in this study. For China as a whole, the regional average cool nights, cool days, warm nights, and warm days are 39.8 days/year, 37.8 days/year, 34.5 days/year, and 35.7 days/year, respectively. The magnitudes of the cold extremes (TN10P and TX10p) are larger than those of the warm extremes (TN90p and TX90p), and high spatial variation of TN10p is found during the period 1960–2018 with the standard deviation of 1.9 days/year across China. Compared with other regions, Northeast and Northwest China experience more cold extremes; the area between Yellow and Yangtze rivers shows more warm nights, while this pattern moves to south for warm days.
Our results suggest a consistent result with the previous studies, which showed that the indices of extreme warm temperatures have generally evidenced increasing trends, while extreme cold events have shown decreasing trends across almost all of China [2,52]. Cold extremes show decreasing trends and warm extremes generally show increasing trends, with mean change rates of −3.9 days, −1.8 days, 3.7 days and 2.3 days per decade for TN10p, TX10p, TN90p and TX90p, respectively. This result is also consistent with other results, despite a slightly different country-averaged linear trend due to the different data used and time periods analyzed [54,55]. The trend magnitudes of cool nights and warm nights are greater than those of cool days and warm days in mainland China, indicating the nighttime warming (cooling) is higher than daytime warming (cooling). Our results are consistent with some existing regional studies. Jiang et al. [56] also found that cold indices (TN10p and TX10p) decrease and warm indices (TX90p and TN90p) increase in the Tibetan Plateau and surrounding areas. Changes in the warm and cold extremes on the Tibetan Plateau are relatively larger than those in other regions; specially, the cold extremes show larger decreasing trends, while the warm extremes experience relatively larger increasing trends. In the south of the Yangtze River, the warm indices increase significantly, and the cold indices decrease significantly in Yunnan Province but decrease insignificantly in other regions for TX10p, which is in accordance with the existing research findings [18]. The North China Plain experiences decreasing trends for cold extremes and increasing trends of warm extremes, which is in accordance with the work of Tong et al. [26], who found that both the frequency of extreme hot and cold events increases and decreases respectively in this region. Warm extremes and cold extremes show increasing and decreasing trends over northeastern China, which is consistent with the findings of Yu and Li [57]. Although the recent hiatus in global warming features a decrease in the trend of global surface temperature, temperature extremes exhibit inconsistent behaviors in mainland China as indicated by our results [58].
There is currently very little research on the spatiotemporal heterogeneity analyses of temperature extremes across China. The variability in temperature extremes attributable to locations and time was revealed by applying a spatiotemporal model during 1992–2018 in this study. The results show that spatial heterogeneity in extreme temperatures occurs in different regions of China. The areas with high spatial heterogeneity for the warm and cold indices are identified in Figure 5, denoting areas with prominent variations for the different temperature extremes, and this information could be helpful for the urgent requirement of society and is important for forecasting extreme climate events. Temporally, compared with cold extremes, the year-to-year variations in warm extremes show significant increasing trends in China, especially after 2004 (Figure 6), due to the combined effects of complex human activities and continued global warming. Moreover, the increasing trends for the temporal heterogeneity of warm extremes show significant differences from the period of the global warming hiatus to the period of the new urbanization and development.
The influence and uncertainty of the influence of explanatory variables on temperature changes were analyzed. The results show that, compared with that on the indices related to the daily maximum temperature, the ENSO has a relatively strong negative effect on the indices related to the daily minimum temperature for all of China, which is in accordance with the findings of Shi et al. [15]. A larger effect is seen for nighttime extremes than for daytime extremes. Stefanoca et al. [59] suggested that the driving mechanism behind the daily minimum temperature response is the corresponding El Niño-related increase in cloudiness that promotes nighttime radiational cooling cloudiness. Researchers have also found that climate extremes are more likely linked to the combined influence of ENSO and other factors [60]. The proximity to the coastal environment exerts strong negative effects on warm nights (100%) and poses a positive effect (98%) on cold nights; these results are related to the daily minimum temperature. The ocean plays a vital role in moderating the climate by transferring heat and moisture, affecting weather and climate extremes around the world. Hu et al. [61] found that the high temperature extremes across southern China are influenced by Indian Ocean variability. Elevation has negative effects on cold and warm extremes, but the effect on warm days is relatively weak (with a probability of 66%). The results indicated that anthropogenic features have strong positive effects on the indices related to the daily maximum temperature at the national scale. The impact of urbanization on the TN90p has a probability of 78% across China, and large uncertainty is obtained for the effect of urbanization on TN10p, which is consistent with the findings of Zhou and Ren [49]. Our analysis identifies urbanization as having a general effect on temperature extremes, and this result is consistent with previous analyses [62] despite the differences in significant effects due to the different study areas. It should be noted that the effects of urbanization and other covariates are different in different study regions, and it can be argued that variations in temperature events are associated with a combination of the four external forces (ENSO, the proximity to the coastal environment, elevation and urbanization) and more covariates could be introduced in further studies.

5. Conclusions

The spatiotemporal variations in temperature extremes (TN10p, TX10p, TN90p, and TX90p) and their responses to covariates (ENSO, DEM, urbanization, and proximity to the coastal environment) were investigated across China in this study. The spatiotemporal variations in temperature events are associated with a combination of these forces. Spatially, TN10p was greater in northeastern China, TX10P was greater in northeastern and northwestern China, and TN90p and TX90p were greater in the middle of China. Strong spatial heterogeneity of temperature extremes was observed across China. The areas with a strong spatial heterogeneity for cool nights mainly included northeastern and central China. For cool days, the spatial variation was prominent in northern China. For warm nights, the areas showing high spatial heterogeneity were mainly located in the northwest part of China and were distributed in northern China for warm days. Statistically significant increases in the year-to-year variations in warm extremes were detected during the period from 1992 to 2018. In addition, warm indices generally showed increases across China, with regional mean rates of increase of 3.7 days and 2.3 days per decade for warm nights (TN90p) and warm days (TX90p), respectively. Cold extremes are generally decreased in almost all of China, with regional mean decrease rates of 3.9 days and 1.8 days per decade for cold nights (TN10p) and cold days (TX10p), respectively. Additionally, the temporal change in night-related indices showed higher spatial variations than day-related indices. The results also indicated that both elevation and ENSO had negative effects on cold and warm extremes but with different probability levels at the national scale. Proximity to the coastal environment exerted a strong negative effect on warm nights. Urbanization had positive effects on the indices related to the daily maximum temperature at the national scale, and the effect on the indices of the daily minimum temperature showed large uncertainties across mainland China.

Author Contributions

Conceptualization, N.Z.; methodology, N.Z.; software, N.Z. and M.C.; validation, N.Z. and M.C.; formal analysis, N.Z. and M.C.; investigation, N.Z. and M.C.; resources, N.Z.; data curation, N.Z. and M.C.; writing—original draft preparation, N.Z.; writing—review and editing, N.Z. and M.C.; visualization, N.Z.; supervision, N.Z.; project administration, N.Z.; funding acquisition, N.Z. and M.C. All authors have read and agreed to the published version of the manuscript.

Funding

This research was funded by Program of Frontier Sciences of Chinese Academy of Sciences, grant number ZDBS-LY-DQC005, the National Natural Science Foundation of China (grant number 42071374, 41930647), and the Strategic Priority Research Program (A) of the Chinese Academy of Sciences (XDA20030203).

Institutional Review Board Statement

Not applicable.

Informed Consent Statement

Not applicable.

Data Availability Statement

The data are not publicly available due to the confidentiality of the research projects.

Conflicts of Interest

The authors declare no conflict of interest.

References

  1. IPCC. Climate Change 2013: The Physical Science Basis. Contribution of Working Group I to the Fifth Assessment Report of the Intergovernmental Panel on Climate Change; Cambridge University Press: Cambridge, UK, 2013. [Google Scholar]
  2. Alexander, L.V.; Zhang, X.; Peterson, T.C.; Caesar, J.; Gleason, B.; Klein Tank, A.M.G.; Haylock, M.; Collins, D.; Trewin, B.; Rahimzadeh, F.; et al. Global observed changes in daily climate extremes of temperature and precipitation. J. Geophys. Res. 2006, 111, D05109. [Google Scholar] [CrossRef] [Green Version]
  3. Mazdiyasni, O.; AghaKouchak, A. Substantial increase in concurrent droughts and heatwaves in the United States. Proc. Natl. Acad. Sci. USA 2015, 112, 11484–11489. [Google Scholar] [CrossRef] [PubMed] [Green Version]
  4. Chen, W.; Dong, B.W.; Wilcox, L.; Luo, F.F. Attribution of recent trends temperature extremes over China: Role of changes in anthropogenic aerosol emissions over Asia. J. Clim. 2019, 32, 7539–7560. [Google Scholar] [CrossRef]
  5. Piao, S.; Ciais, P.; Huang, Y.; Shen, Z.H.; Peng, S.S.; Li, J.S.; Zhou, L.P.; Liu, H.Y.; Ma, Y.C.; Ding, Y.H.; et al. The impacts of climate change on water resources and agriculture in China. Nature 2010, 467, 43–51. [Google Scholar] [CrossRef]
  6. Curtis, S.; Fair, A.; Wistow, J.; Val, D.V.; Oven, K. Impact of extreme weather events and climate change for health and social care systems. Environ. Health 2017, 16, 23–32. [Google Scholar] [CrossRef] [Green Version]
  7. Zhang, Y.; Yang, P.L.; Gao, Y.; Leung, R.L.; Bell, M.L. Health and economic impacts of air pollution induced by weather extremes over the continental U.S. Environ. Int. 2020, 143, 105921. [Google Scholar] [CrossRef] [PubMed]
  8. United Nations Office for Disaster Risk Reduction (UNISDR). The Human Cost of Weather-Related Disasters, 1995–2015; UNISDR: Geneva, Switzerland, 2015; p. 27. [Google Scholar]
  9. IPCC. Summary for Policymakers Global Warming of 1.5 °C. An IPCC Special Report on the Impacts of Global Warming of 1.5 °C above Pre-industrial Levels and Related Global Greenhouse Gas Emission Pathways, in the Context of Strengthening the Global Response to the Threat of Climate Change, Sustainable Development, and Efforts to Eradicate Poverty; Masson-Demotte, V., Zhai, P., Portner, H.O., Roberts, D., Skea, J., Shukla, P.R., Pirani, A., Moufouma-Okia, W., Pean, C., Pidcock, R., et al., Eds.; World Meteorological Organization: Geneva, Switzerland, 2018. [Google Scholar]
  10. Yan, Z.; Jones, P.D.; Davies, T.D.; Moberg, A.; Bergstorm, H.; Camuffo, D.; Cocheo, C.; Maugeri, M.; Demaree, G.R.; Verhoeve, T.; et al. Trends of extreme temperatures in Europe and China based on daily observations. Clim. Chang. 2002, 53, 355–392. [Google Scholar] [CrossRef]
  11. Klein, T.A.; Peterson, T.C.; Quadir, D.A.; Dorji, S.; Zou, X.; Tang, H.; Santhosh, K.; Joshi, U.R. Changes in daily temperature and precipitation extremes in central and South Asia. J. Geophys. Res. Atmos. 2006, 111, D16105. [Google Scholar] [CrossRef]
  12. Coumou, D.; Rahmstorf, S. A decade of weather extremes. Nat. Clim. Chang. 2012, 2, 491–496. [Google Scholar] [CrossRef]
  13. Wang, B.; Liu, D.L.; Macadam, I.; Alexander, L.V.; Abramowitz, G.; Yu, Q. Multi-model ensemble projections of future extreme temperature change using a statistical downscaling method in south eastern Australia. Clim. Chang. 2016, 138, 85–98. [Google Scholar] [CrossRef]
  14. Ren, G.Y.; Feng, G.L.; Yan, Z.W. Progresses in observation studies of climate extremes and changes in mainland China. Clim. Environ. Res. 2010, 15, 337–353. [Google Scholar]
  15. Shi, J.; Cui, L.; Ma, Y.; Du, H.W. Trends in temperature extremes and their association with circulation patterns in China during 1961–2015. Atmos. Res. 2018, 2122, 59–72. [Google Scholar] [CrossRef]
  16. Yue, T.X.; Zhao, N.; Ramsey, R.D.; Wang, C.L.; Fan, Z.M.; Chen, C.F.; Lu, Y.M.; Li, B.L. Climate change trend in China, with improved accuracy. Clim. Chang. 2013, 120, 137–151. [Google Scholar] [CrossRef]
  17. Ding, Y.; Ren, G.Y.; Shi, G. National assessment report of climate change (I): Climate change in China and its future trend. Clim. Chang. Res. 2007, 3, 1–5. [Google Scholar]
  18. Guan, Y.; Zhang, X.; Zheng, F.; Wang, B. Trends and variability of daily temperature extremes during 1960–2012 in the Yangtze River Basin, China. Glob. Planet. Chang. 2015, 124, 79–94. [Google Scholar] [CrossRef] [Green Version]
  19. Zeng, W.; Yu, Z.; Li, X. The influence of elevation, latitude and Arctic oscillation on trends in temperature extremes over northeastern China, 1961–2011. Meteorol. Atmos. Phys. 2018, 130, 191–209. [Google Scholar] [CrossRef]
  20. Wang, Z.; Zhang, W.; Geng, X. Different influences of two types of ENSO on winter temperature and cold extremes in northern China. Acta Meteor. Sin. 2017, 75, 564–580. [Google Scholar]
  21. Shen, X.; Liu, B.; Lu, X. Weak cooling of cold extremes versus continued warming of hot extremes in China during the recent global surface warming hiatus. J. Geophys. Res. Atmos. 2018, 123, 4073–4087. [Google Scholar] [CrossRef]
  22. Han, J.; Du, H.; Wu, Z.; He, H.S. Changes in extreme precipitation over dry and wet regions of China during 1961–2014. J. Geophys. Res. Atmos. 2019, 12458, 47–59. [Google Scholar] [CrossRef]
  23. Sun, Q.; Miao, C.; Duan, Q. A projected changes in temperature and precipitation in ten river Basins over China in 21st century. Int. J. Climatol. 2015, 35, 1125–1141. [Google Scholar] [CrossRef]
  24. Sun, Y.; Zhang, X.B.; Ren, G.Y.; Zwiers, F.W.; Hu, T. Contribution of urbanization to warming in China. Nat. Clim. Chang. 2016, 6, 706–709. [Google Scholar] [CrossRef]
  25. Fan, J.A.; Sun, W.C.; Zhao, Y.; Xue, B.L.; Zuo, D.P.; Xu, Z.X. Trend analyses of extreme precipitation events in the Yarlung Zangbo River basin, Chain using a high resolution product. Sustainability 2018, 10, 1369. [Google Scholar] [CrossRef] [Green Version]
  26. Tong, R.Z.; Sun, W.C.; Han, Q.; Yu, J.S.; Tian, Z.F. Spatial and temporal variations in extreme precipitation and temperature events in the Beijing-Tianjin-Hebei region of China over the past six decades. Sustainability 2020, 12, 1415. [Google Scholar] [CrossRef] [Green Version]
  27. Chen, H.; Sun, J. Changes in climate extreme events in China associated with warming. Int. J. Climatol. 2015, 35, 2735–2751. [Google Scholar] [CrossRef]
  28. Su, Z.; Hao, Z.; Yuan, F.; Chen, X.; Cao, Q. Spatio-temporal variability of extreme summer precipitation over the Yangtze River basin and the associations with climate patterns. Water 2017, 9, 873. [Google Scholar] [CrossRef] [Green Version]
  29. Zhou, J.J.; Huang, J.M.; Zhao, X.; Li, L.; Shi, W.; Wang, L.Y.; Wei, W.; Liu, C.F.; Zhu, G.F.; Yang, X.M. Changes of extreme temperature and its influencing factors in Shiyang river basin, northwest China. Atmosphere 2020, 11, 1171. [Google Scholar] [CrossRef]
  30. Rue, H.; Martino, S.; Chopin, N. Approximate Bayesian inference for latent Gaussian models by using integrated nested Laplace approximations. J. R. Stat. Soc. Ser. B 2009, 71, 319–392. [Google Scholar] [CrossRef]
  31. Wang, X.L. Comment on “Detection of undocumented change points: A revision of the two-phase regression model”. J. Clim. 2003, 16, 3383–3385. [Google Scholar] [CrossRef]
  32. Vincent, L.A.; Zhang, X.; Bonsal, B.R.; Hong, W.D. Homogenization of daily temperatures over Canada. J. Clim. 2002, 15, 1322–1334. [Google Scholar] [CrossRef]
  33. IPCC. Managing the Risks of Extreme Events and Disasters to Advance Climate Change Adaptation. In A Special Report of Working Groups I and II of the Intergovernmental Panel on Climate Change; Cambridge University Press: Cambridge, UK, 2012. [Google Scholar]
  34. Schaller, N.; Kay, A.L.; Allen, M. Human influence on climate in the 2014 southern England winter floods and their impacts. Nat. Clim. Chang. 2016, 6, 627–634. [Google Scholar] [CrossRef]
  35. Zhang, J.P.; Zhao, T.B.; Dai, A.G. Detection and attribution of atmospheric precipitation water changes since the 1970s over China. Sci. Rep. 2019, 9, 17–60. [Google Scholar]
  36. Hu, T.; Sun, Y.; Zhang, X.B.; Min, S.K.; Kim, Y.H. Human influence on frequency of temperature extremes. Environ. Res. Lett. 2020, 15, 064014. [Google Scholar] [CrossRef]
  37. Horton, D.E.; Johnson, N.C.; Singh, D.; Swain, D.L.; Rajaratnam, B.; Diffenbaugh, N.S. Contribution of changes in atmospheric circulation patterns to extreme temperature trends. Nature 2015, 52246, 5–9. [Google Scholar] [CrossRef] [PubMed] [Green Version]
  38. Qi, W.; Wang, Y.Q. Changes in the observed trends in extreme temperatures over China around 1990. J. Clim. 2012, 25, 5208–5222. [Google Scholar] [CrossRef]
  39. McCarthy, M.P.; Best, M.J.; Betts, R.A. Climate change in cities due to global warming and urban effects. Geophys. Res. Lett. 2010, 37, L09705. [Google Scholar] [CrossRef] [Green Version]
  40. Ma, T.; Zhou, C.H.; Pei, T.; Haynie, S.; Fan, J.F. Quantitative estimation of urbanization dynamics using time series of DMSP/OLS nighttime light data: A comparative case study from China’s cities. Remote Sens. Environ. 2012, 124, 99–107. [Google Scholar] [CrossRef]
  41. Xie, Y.H.; Weng, Q.H.; Fu, P. Temporal variation of artificial nighttime lights and their implications for urbanization in the conterminous United States, 2013–2017. Remote Sens. Environ. 2019, 225, 160–174. [Google Scholar] [CrossRef]
  42. Zhao, N.; Jiao, Y.M.; Ma, T.; Zhao, M.M.; Fan, Z.M.; Yin, X.Z.; Liu, Y.; Yue, T.X. Estimating the effect of urbanization on extreme climate events in the Beijing–Tianjin–Hebei region, China. Sci. Total Environ. 2019, 688, 1005–1015. [Google Scholar] [CrossRef]
  43. Li, X.C.; Zhou, Y.Y.; Zhao, M.; Zhao, X. A harmonized global nighttime light dataset 1992–2018. Sci. Data 2020, 7, 168. [Google Scholar] [CrossRef]
  44. Ewa, B.L.; Stephanie, H.; Jorg, M. Regional and seasonal variability of extreme precipitation trends in southern Poland and central-eastern Germany 1951–2006. Int. J. Climatol. 2011, 31, 2249–2271. [Google Scholar]
  45. Chatterjee, S.; Khan, A.; Akbari, H.; Wang, Y.P. Monotonic trends in spatio-temporal distribution and concentration of monsoon precipitation (1901–2002), West Bengal, India. Atmos. Res. 2016, 182, 54–75. [Google Scholar] [CrossRef]
  46. R Core Team. R: A Language and Environment for Statistical Computing. Vienna. Available online: https://www.R-project.org (accessed on 8 October 2020).
  47. Bivand, R.S.; Rubio-Gomez, V.; Rue, H. Spatial data analysis with R-INLA with some extensions. J. Stat. Softw. 2015, 63, 1–31. [Google Scholar] [CrossRef] [Green Version]
  48. Li, X.Y. Significant climate events in the world during 1997. Acta Meteorol. Sin. 1998, 24, 21–25. [Google Scholar]
  49. Fang, C.L.; Yu, D.L. China’s Urban Agglomerations; Springer: Beijing, China, 2019. [Google Scholar]
  50. Zhang, P.; Jeong, J.H.; Yoon, H.H.; Kim, H.; Wang, S.; Linderholm, H.W.; Fang, K.Y.; Wu, X.C.; Chen, D.L. Abrupt shift to hotter and drier climate over inner East Asia beyond the tipping point. Science 2020, 370, 1095–1099. [Google Scholar] [CrossRef] [PubMed]
  51. Sivakumar, M.V.K. Weather and climate extremes: Need for and importance of the journal. Weather Clim. Extrem. 2013, 1, 1–3. [Google Scholar] [CrossRef] [Green Version]
  52. Zhou, Y.; Ren, G. Change in extreme temperature event frequency over mainland China, 1961–2008. Clim. Res. 2011, 50, 125–139. [Google Scholar] [CrossRef] [Green Version]
  53. Deng, H.J.; Chen, Y.N.; Shi, X.; Li, W.H.; Wang, H.J.; Zhang, S.H.; Fang, G.H. Dynamics of temperature and precipitation extremes and their spatial variation in the arid region of northwest China. Atmos. Res. 2014, 138, 346–355. [Google Scholar] [CrossRef]
  54. Shi, J.; Cui, L.L.; Wang, J.B.; Du, H.Q.; Wen, K.M. Changes in the temperature and precipitation extremes in China during 1961–2015. Quat. Int. 2019, 527, 64–78. [Google Scholar] [CrossRef]
  55. Shen, X.J.; Liu, B.H.; Lu, X.G.; Fan, G.H. Spatial and temporal changes in daily temperature extremes in China during 1960–2011. Theor. Appl. Climatol. 2017, 130, 933–943. [Google Scholar] [CrossRef]
  56. Jiang, C.; Mu, X.; Wang, F.; Zhao, G. Analysis of extreme temperature events in the Qingling Mountains and surrounding area during 1960-2012. Quat. Int. 2016, 392, 155–167. [Google Scholar] [CrossRef]
  57. Yu, Z.; Li, X. Recent trends in daily temperature extremes over northeastern China (1960–2011). Quat. Int. 2016, 380-381, 35–48. [Google Scholar] [CrossRef]
  58. Kosaka, Y.; Xie, S.P. Recent global-warming hiatus tied to equatorial Pacific surface cooling. Nature 2013, 7, 403–501. [Google Scholar] [CrossRef] [PubMed] [Green Version]
  59. Stefanoca, L.; Sura, P.; Griffin, M. Quantifying the non-gaussianity of wintertime daily maximum and minimum temperatures in the southeast. J. Clim. 2013, 26, 838–850. [Google Scholar] [CrossRef]
  60. Gregory, S.; Noone, D. Variability in the teleconnection between the Southern Oscillation and West Antarctic climate deduced from West Antarctic ice core isotope records. J. Geophys. Res. Atmos. 2008, 113, D17110. [Google Scholar] [CrossRef] [Green Version]
  61. Hu, Z.; Zhang, C.; Hu, Q. Temperature changes in central Asia from 1979 to 2011 based on multiple datasets. J. Clim. 2014, 27, 1142–1167. [Google Scholar] [CrossRef]
  62. Li, C.; Fang, Y.Y.; Caldeira, K.; Zhang, X.B.; Diffenbaugh, N.; Michalak, A.M. Widespread persistent changes to temperature extremes occurred earlier than predicted. Sci. Rep. 2018, 8, 1007. [Google Scholar] [CrossRef] [Green Version]
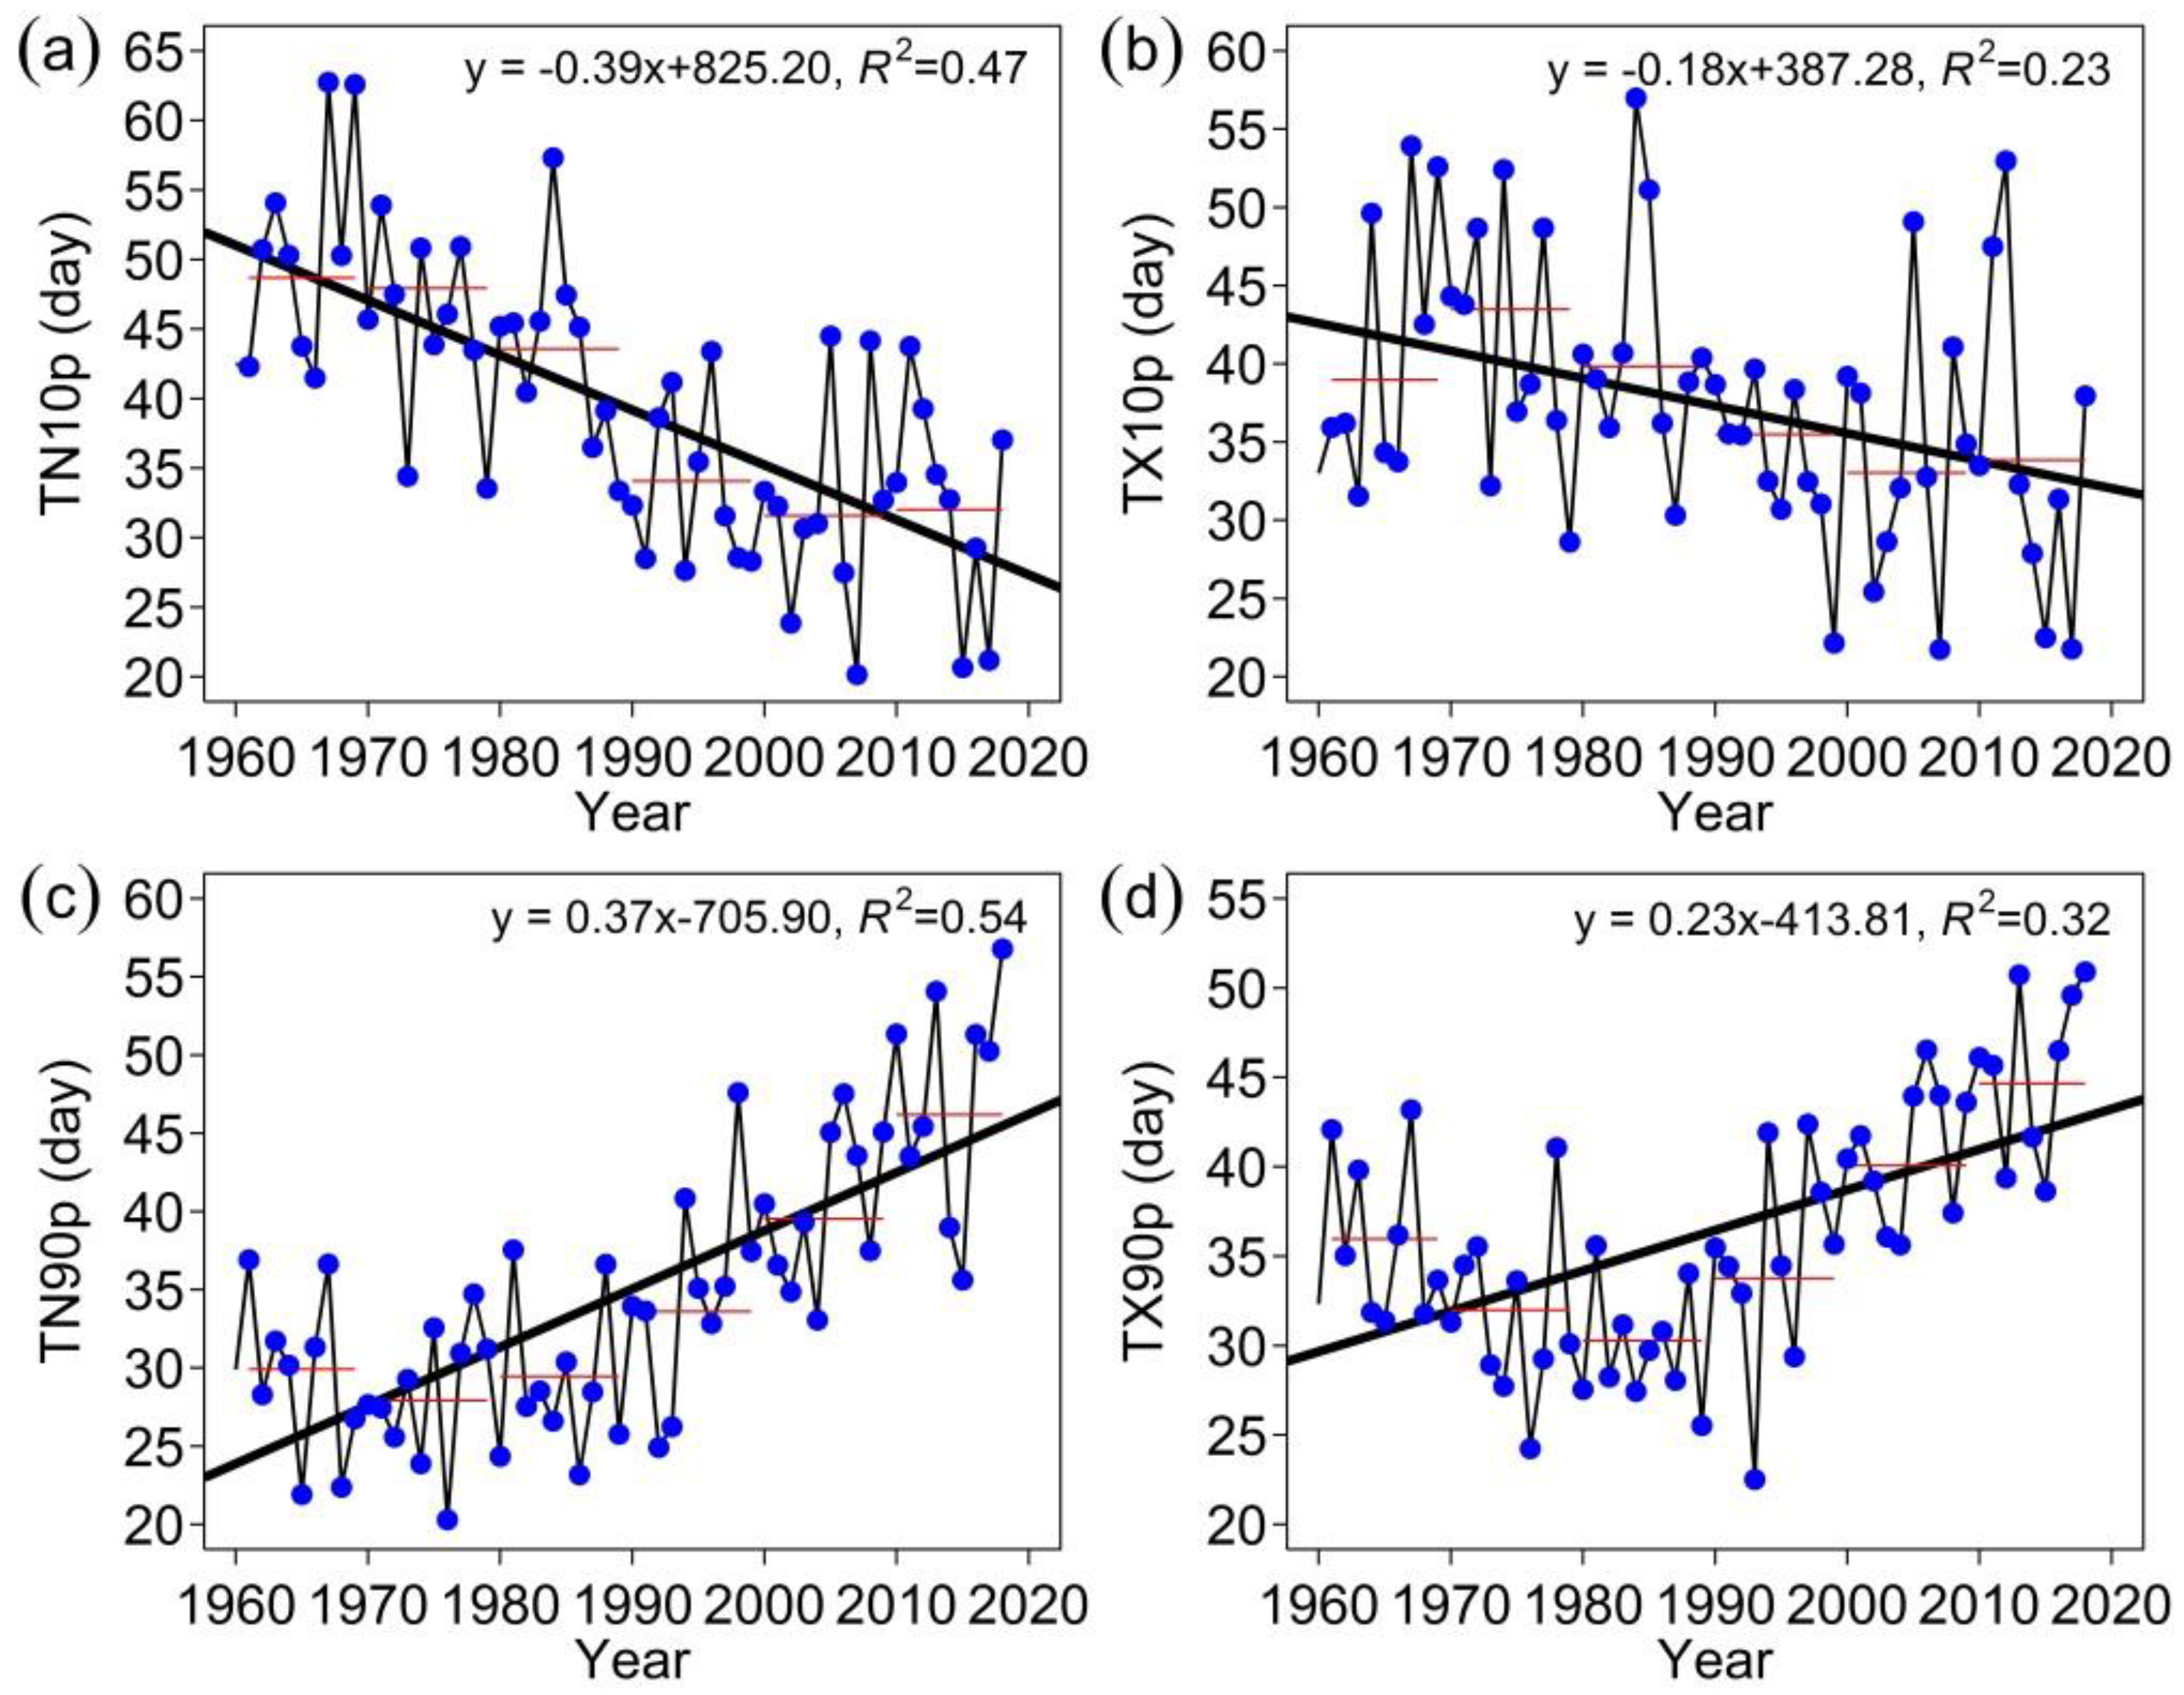
Figure 1. Spatial distribution of meteorological stations on a digital elevation model in China.
Sustainability 13 03807 g001
Figure 2. Time series of the number of days of temperature extremes in China during 1960–2018 (a) TN10p; (b) TX10p; (c) TN90p; (d) TX90p.
Sustainability 13 03807 g002
Figure 3. Spatial patterns of the annual mean temperature extremes over the period 1960–2018 at a resolution of 1 km × 1 km: (a) TN10p; (b) TX10p; (c) TN90p; (d) TX90p.
Sustainability 13 03807 g003
Figure 4. Spatial trends in temperature extremes at a resolution of 1 km × 1 km in China from 1960 to 2018: (a) TN10p; (b) TX10p; (c) TN90p; (d) TX90p.
Sustainability 13 03807 g004
Figure 5. Spatial heterogeneity of temperature extremes (Sj in Equation (1)) over the period 1992–2018 across China based on Thiessen polygon by using ArcGIS software: (a) TN10p; (b) TX10p; (c) TN90p; (d) TX90p.
Sustainability 13 03807 g005
Figure 6. Year-to-year variations in temperature extremes (Tt in Equation (1)) from 1992 to 2018: (a) TN10p; (b) TX10p; (c) TN90p; (d) TX90p.
Sustainability 13 03807 g006
Figure 7. Effects of different forces on temperature extremes (β in Equation (1)): (a) TN10p; (b) TX10p; (c) TN90p; (d) TX90p. N3.4 denotes the Niño 3.4 index; Dist. means the distance to the sea; and DEM and NTL denote the digital elevation model and nighttime light data, respectively.
Sustainability 13 03807 g007
Table 1. Temperature indices used in the present study.
IndicatorIDIndicator DefinitionUnits: Year−1
Cool nightsTN10pTotal number of days when Tmin < 10th percentileDays
Cool daysTX10pTotal number of days when Tmax < 10th percentileDays
Warm nightsTN90pTotal number of days when Tmin > 90th percentileDays
Warm daysTX90pTotal number of days when Tmax > 90th percentileDays
Note: Tmin means daily minimum temperature; Tmax means daily maximum temperature.
Table 2. Decadal average value of temperature extremes in China.
Decadal Average Value (Days)TN10PTX10PTN90PTX90P
1960–196950.140.329.635.7
1970–197945.041.128.431.6
1980–198943.641.028.929.8
1990–199933.633.734.834.8
2000–200932.034.340.340.9
2010–201832.534.247.545.5
Table 3. Summary of temperature extremes across China.
Indicators (Days/Year)TN10PTX10PTN90PTX90P
Maximum55.450.744.946.2
Minimum25.429.623.025.1
Average39.837.834.535.7
Standard deviation1.91.61.51.5
Table 4. Student’s t-test for the temporal heterogeneity of temperature extremes.
p-ValueTN10pTX10pTN90pTX90p
(T1, T2)0.96550.61460.0120.036
(T3, T2)0.76520.94070.0360.021
Publisher’s Note: MDPI stays neutral with regard to jurisdictional claims in published maps and institutional affiliations.

