Article

The Influence of Seasonal Water Level Fluctuations on the Soil Nutrients in a Typical Wetland Reserve in Poyang Lake, China

1
Key Laboratory of Integrated Regulation and Resource Development on Shallow Lakes, Ministry of Education, College of Environment, Hohai University, Nanjing 210098, China
2
Center of Eco-environmental Monitoring and Scientific Research, Administration of Ecology and Environment of Haihe River Basin and Beihai Sea Area, Ministry of Ecology and Environment of PRC, Tianjin 300170, China
*
Authors to whom correspondence should be addressed.
Sustainability 2021, 13(7), 3846; https://doi.org/10.3390/su13073846
Submission received: 20 January 2021 / Revised: 24 March 2021 / Accepted: 26 March 2021 / Published: 31 March 2021
(This article belongs to the Section Environmental Sustainability and Applications)

Abstract

:
To comprehend the distribution characteristics of the nutrients and the variations in the soil fertility, a total of 23 samples were collected from Nanjishan wetland reserve in the dry season, wet season, and water-recession season. The study area was divided into four areas (A1, A2, A3, and A4) based on the local hydrological conditions, geographical locations, and nutrient load characteristics. The findings showed that the highest concentration of nutrients appeared in A1, followed by A2 due to anthropogenic activities and the sewage discharge along Ganjiang River. Except for the total amounts of nutrients (the total nitrogen (TN), total phosphorus (TP), and total potassium (TK)), the nutrient concentrations dropped in the wet season and recovered in the water-recession season. A close association between microorganisms and the soil nutrients was observed. The Integrated Fertility Index (IFI) indicated a significant spatio-temporal variability in the soil fertility. The soil quality was higher in the dry season. The values of the IFI displayed a decreasing trend during the growing season (wet season). The single factor standard index method (SFSI) suggested that the whole area had a potential risk of eutrophication, to which the TN could be considered a main contributor.

1. Introduction

Wetlands play an irreplaceable role in maintaining the balance of ecosystems with the characteristics of abundant diversity and high productivity, as well as ecological and economic benefits. Wetland vegetation is considered as an important component to the wetland ecosystem for feeding aquatic animals and degrading contaminants [1,2,3,4]. There are three common vegetation types in overwater wetlands, including meadows, swamps, and aquatic vegetation, which are habitats of different kinds of birds. Investigated results have shown that damage to the vegetation structures in wetlands has an impact on the bird community and species, as well as the avian density [5,6,7]. Previous studies focused on the effect of water level fluctuations on vegetation succession, and this is particularly profound in a typical lake that both takes in and discharges water with seasonal alterations [8,9].
However, wetland soil is an important carrier for wetland ecosystems, of which the concentration and distribution of nutrients limits the growth and characteristics of vegetation during the growing season [10]. Zhang et al. studied the correlation between plants and nutrients, and found that the plant weights were negatively correlated with the soil organic carbon (SOC), total nitrogen (TN), and total phosphorus (TP) content and positively correlated with the total potassium (TK) content in soil [11]. The concentrations of SOC, TN, and TP had an obvious effect on the weight of the dominant vegetation [12]. Therefore, for this study related to wetland vegetation, we pay attention to assessing the soil nutrients and fertility with experimental and mathematical methods. In essence, microorganisms play an important role in improving the soil fertility and promoting the cycle of nutrients [13]. Previous studies offer some insight into how plant diversity affects the ecosystem functioning, including soil processes, soil structure, and soil biota [14,15]. However, the relationships between the microbial community and plant diversity are reciprocal [16,17]. Thus, we quantitatively analyzed the effect of the microbial biomass on soil nutrients.
As the largest freshwater lake in China, Poyang lake plays a significant role in ensuring the ecological security of Poyang basin. Poyang lake is fed by five inflows including the Ganjiang, Xinjiang, Fuhe, Raohe, and Xiuhe Rivers in Jiangxi Province and freely interchanges water with the Yangtze River by a narrow channel in the north. The difference between the high water level and low water level is large as a result of seasonal alternation, with an approximate value of 10 m [18,19]. The lowest water level has decreased year over year due to economic development and human activities around Poyang lake and the operation of water conservancy projects in the upper and middle of the Yangtze River [20]. The wetland ecosystem of Poyang lake has been challenged, and the pattern of vegetation distribution has been changed during recent decades. This has drawn the attention of researchers [21,22]. The present studies focusing on the water quality and quantity, eutrophication, and vegetation distribution in Poyang lake has been published. Much research has been conducted to evaluate the toxicity of heavy metals in sediments [18,23,24]. Few studies have investigated the soil fertility of the wetland area in Poyang lake.
Nanjishan wetland area, as a National Wetland Nature Reserve, is located at the south of Poyang lake with an important role in maintaining the ecological security of the local area. Nanjishan wetland is not only a traditional functional wetland but also has a unique wetland ecosystem due to the interactions of hydrology, biology, and vegetation. Thus, it is considered as a reservoir with the function of removing pollutants; simultaneously, it is crucial to maintaining the habitat for wintering water birds [25,26,27].
By means of the above methods, the effects of nutrient release from sediments on the eutrophication and soil fertility of Nanjishan wetland regarding the vegetation were evaluated. In this research, the primary objectives were (1) to clarify the spatial distribution and annual variation in the soil nutrients, (2) to analyze the relationship between microorganisms and the soil nutrients from a quantitative perspective, (3) to investigate the current status of the soil fertility, and (4) to estimate the effect of nutrient (TN, TP) release from sediments on the water quality in the wet season. The above experiments were carried out under different submerged conditions. The research on the soil nutrients and fertility in Nanjishan wetland is important for ensuring plant growth and characteristics and guiding the control of eutrophication, in addition to providing a potential support to protect the biodiversity in Nanjishan wetland.

2. Materials and Methods

2.1. Study Area

Nanjishan Wetland Nature Reserve is located in the south of Poyang lake, Jiangxi Province, ranging from 28°51′21″–29°06′46″ N and 116°10′24″–116°23′50″ E, the outer part of the delta located in the downstream of Ganjiang River into Poyang lake. The reserve is rich in resources, with many rivers with various forms. The annual average temperature is 17–17.8 °C, with an annual average natural rainfall of 1570 mm. The surface area of the lake fluctuates dramatically due to seasonal variations; it covers an area of about 32.89 hm2 in flood-season, accounting for more than 98% of this area, and accounting for 37.9% of the whole area in the dry season. The water from these five rivers flows into Poyang lake during April to July, which occupies 66.7% of the total area in the year. After September, the lake water recedes dramatically with the conclusion of the rainy season.
Nanjishan Wetland Nature Reserve has evolved a unique, primitive, and diverse style of its own. Its major functions are (1) to maintain the wetland ecosystem and environment, (2) to provide habitats for the rare and endangered waterbirds, and (3) to protect the spawning and growing grounds of important economic fish. In the wet season (From April to August), the delta of Nanjishan is submerged in water from the tributaries of Ganjiang River due to the variations in seasonal hydrology. In October, as the water recedes, extensive marshland is exposed according to the different elevations. In paper, according to the hydrological conditions, the geographical position, and characteristics of nutrient loading, the study area was subdivided into four sections (Table 1).

2.2. Sampling, Preparation and Analysis

The sediment samples were collected from March (Mar) to November (Nov) 2018 by stainless steel drilling from each sampling site and were wrapped in the polyethylene plastic bags (Mar, in the dry season; June (Jun), in the wet season; and Nov, in the low-flow recession period), The location of the sampling point is shown in Figure 1. All the samples were extracted at 0–20 cm depth from the surface, large debris and stones were removed, and the samples were stored at 4 °C prior to analysis. The samples were freeze-dried at room temperature and sieved according to the different experimental requirements of each index before the laboratory analyses. The soil samples were homogenized in a mortar.
The SOM was determined according to Nelson and Sommers (1996) [28]. The concentrations of nutrients (the total nitrogen (TN), total phosphorus (TP), total potassium (TK), alkali-hydrolyzable nitrogen (AN), available phosphorus (AP), and available potassium (AK)) were measured referring to Bremner (1996) [29]. After 20 min of sterilization with a high-pressure pot, beef extract-peptone medium, improved Gause No.1 medium, and Martin agar medium were used to culture the bacteria, actinomycetes, and fungi, respectively [30].
We added 3% potassium dichromate 1/300 mL and 1% streptomycin 3.3/1000 mL into the improved Gause No.1 medium and Martin agar medium to inhibit the growth of bacteria and actinomycetes. All test appliances were sterilized using a high-pressure sterilization pot.

2.3. Evaluation of Soil Fertility

The Integrated Fertility Index (IFI) is a common method used to access the soil fertility and quality via assigning a weight (Wi) and membership value (Ni) to the variables [31]. The formula of IFI is shown in the following (Equation (1)). In this study, the weight of the soil fertility index was obtained through a correlation coefficient between variables, and the membership value was determined using the method where the concentration of indexes was substituted into its corresponding membership function.
IFI = i = 1 p W i × N i
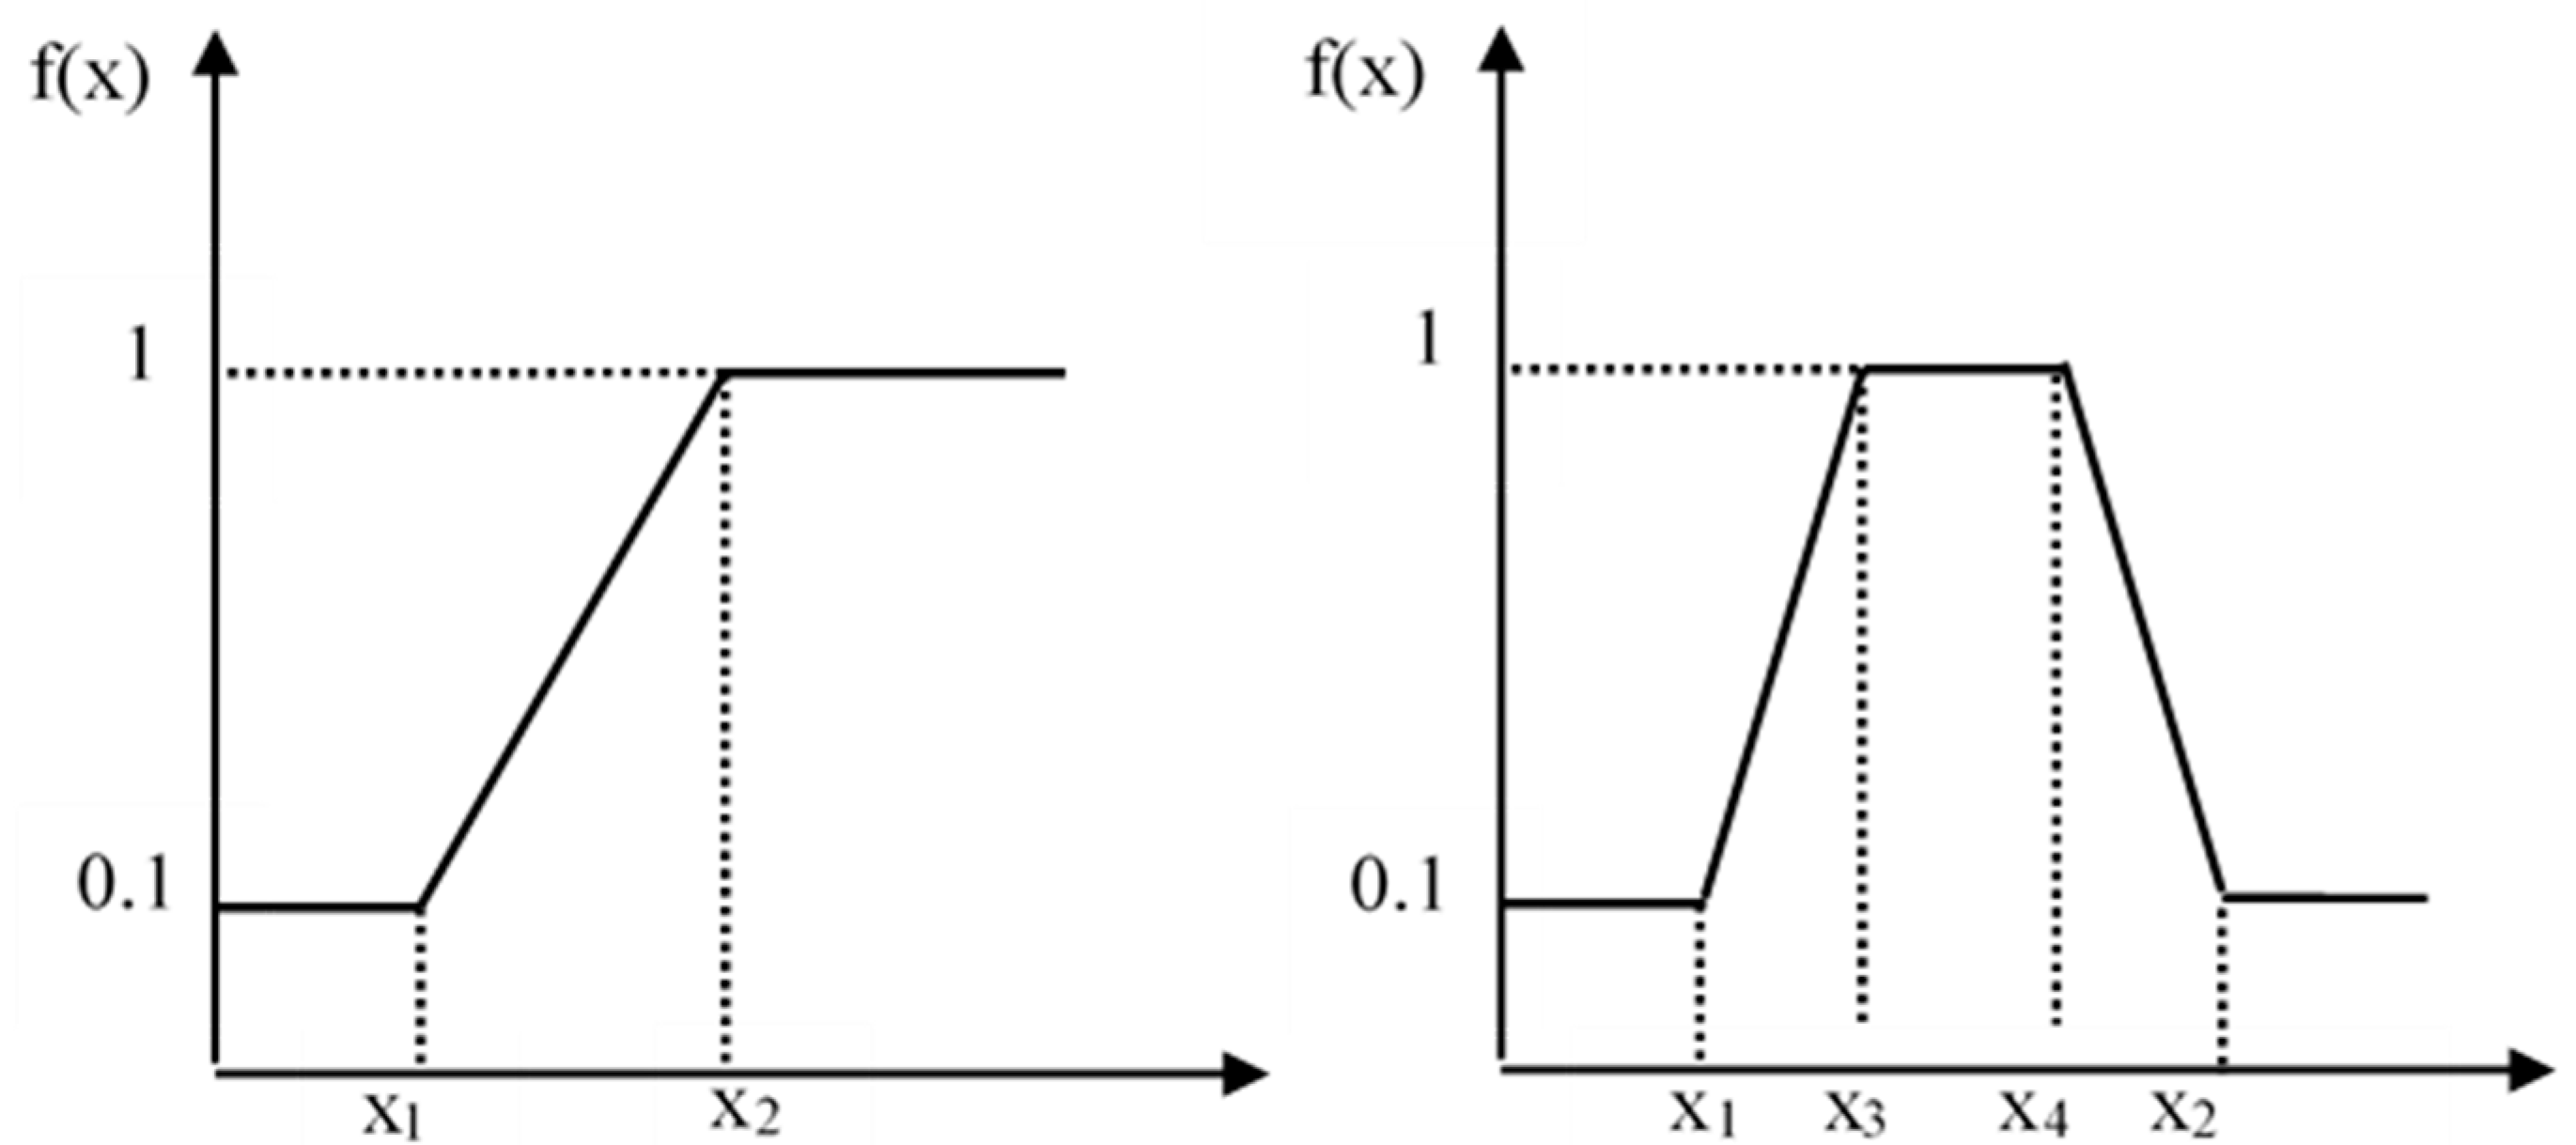
There were two types of membership function, including S-type curves and parabola type curves (Figure 2). The function threshold values of each fertility index were based on Li et al. (2011) and the results of the Second National Soil General Survey (Table 2) [31]. The value of IFI ranged from 0 to 1, which present the sufficient or lacking states in the soil. The higher the value of IFI, the more favorable the soil for the growth and development of vegetation.
0.1: x < x1
f(x) = 0.1 + 0.9 × (x − x1)/(x2 − x1) x1 ≤ x < x2     (S-type)
1: x ≥ x2
0.1: x < x1, x ≥ x2
f(x) = 0.1 + 0.9 × (x − x1)/(x3 − x1)      x1 ≤ x < x3
1: x3 ≤ x < x4     (parabola type)
0.1 + 0.9 × (x − x4)/(x2 − x4)      x4 ≤ x < x2.

2.4. Application of Single Factor Standard Index Method

Here, the single factor standard index method (SFSI) is introduced to estimate whether the TN and TP in the sediments measured in June (in the submerged season) would exceed the thresholds. The designation number was calculated with the following mathematical relation.
Where Si is the designation number, Si > 1 indicates the measured concentration of the indexes exceeds the criteria value and has a possibility of eutrophication in water. Ci is the measured concentration of indexes in the sediment, and Cs is the criteria value of the evaluation factors. The criteria values of the indexes were determined according to the Ministry of the Environment and Energy’s Guide of Ontario, Canada [32]. The TN and TP were 550 mg/kg and 600 mg/kg, respectively—thresholds with the lowest ecological risk.
S i = C i / C s .

3. Result and Discussion

3.1. Quantitative Analysis of Biological Properties

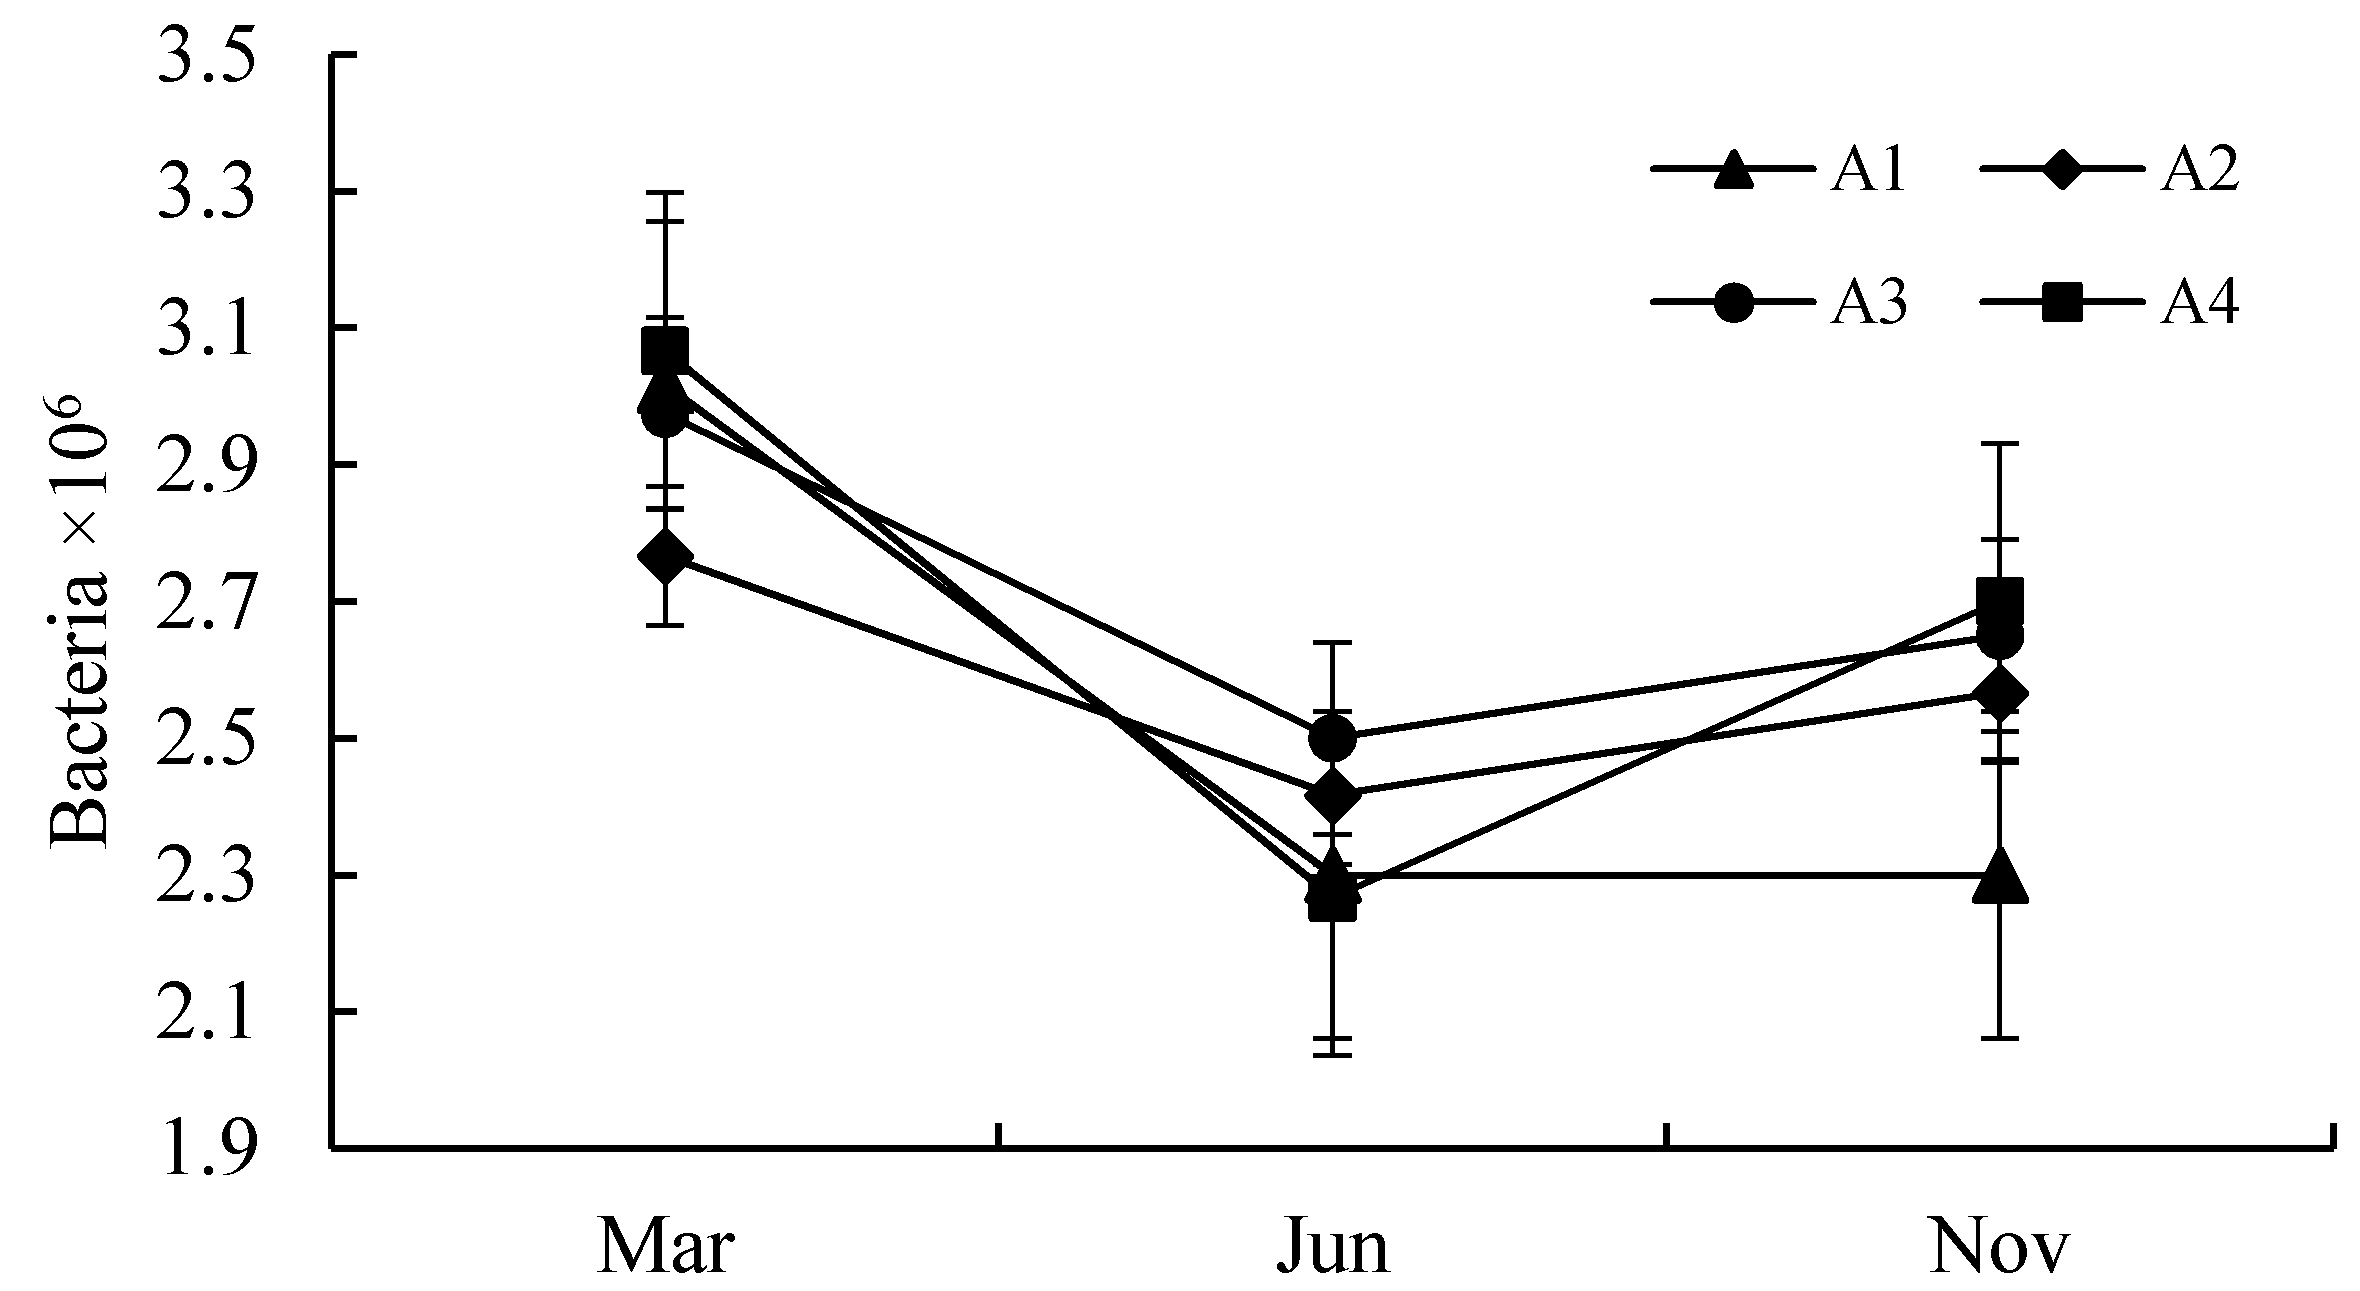
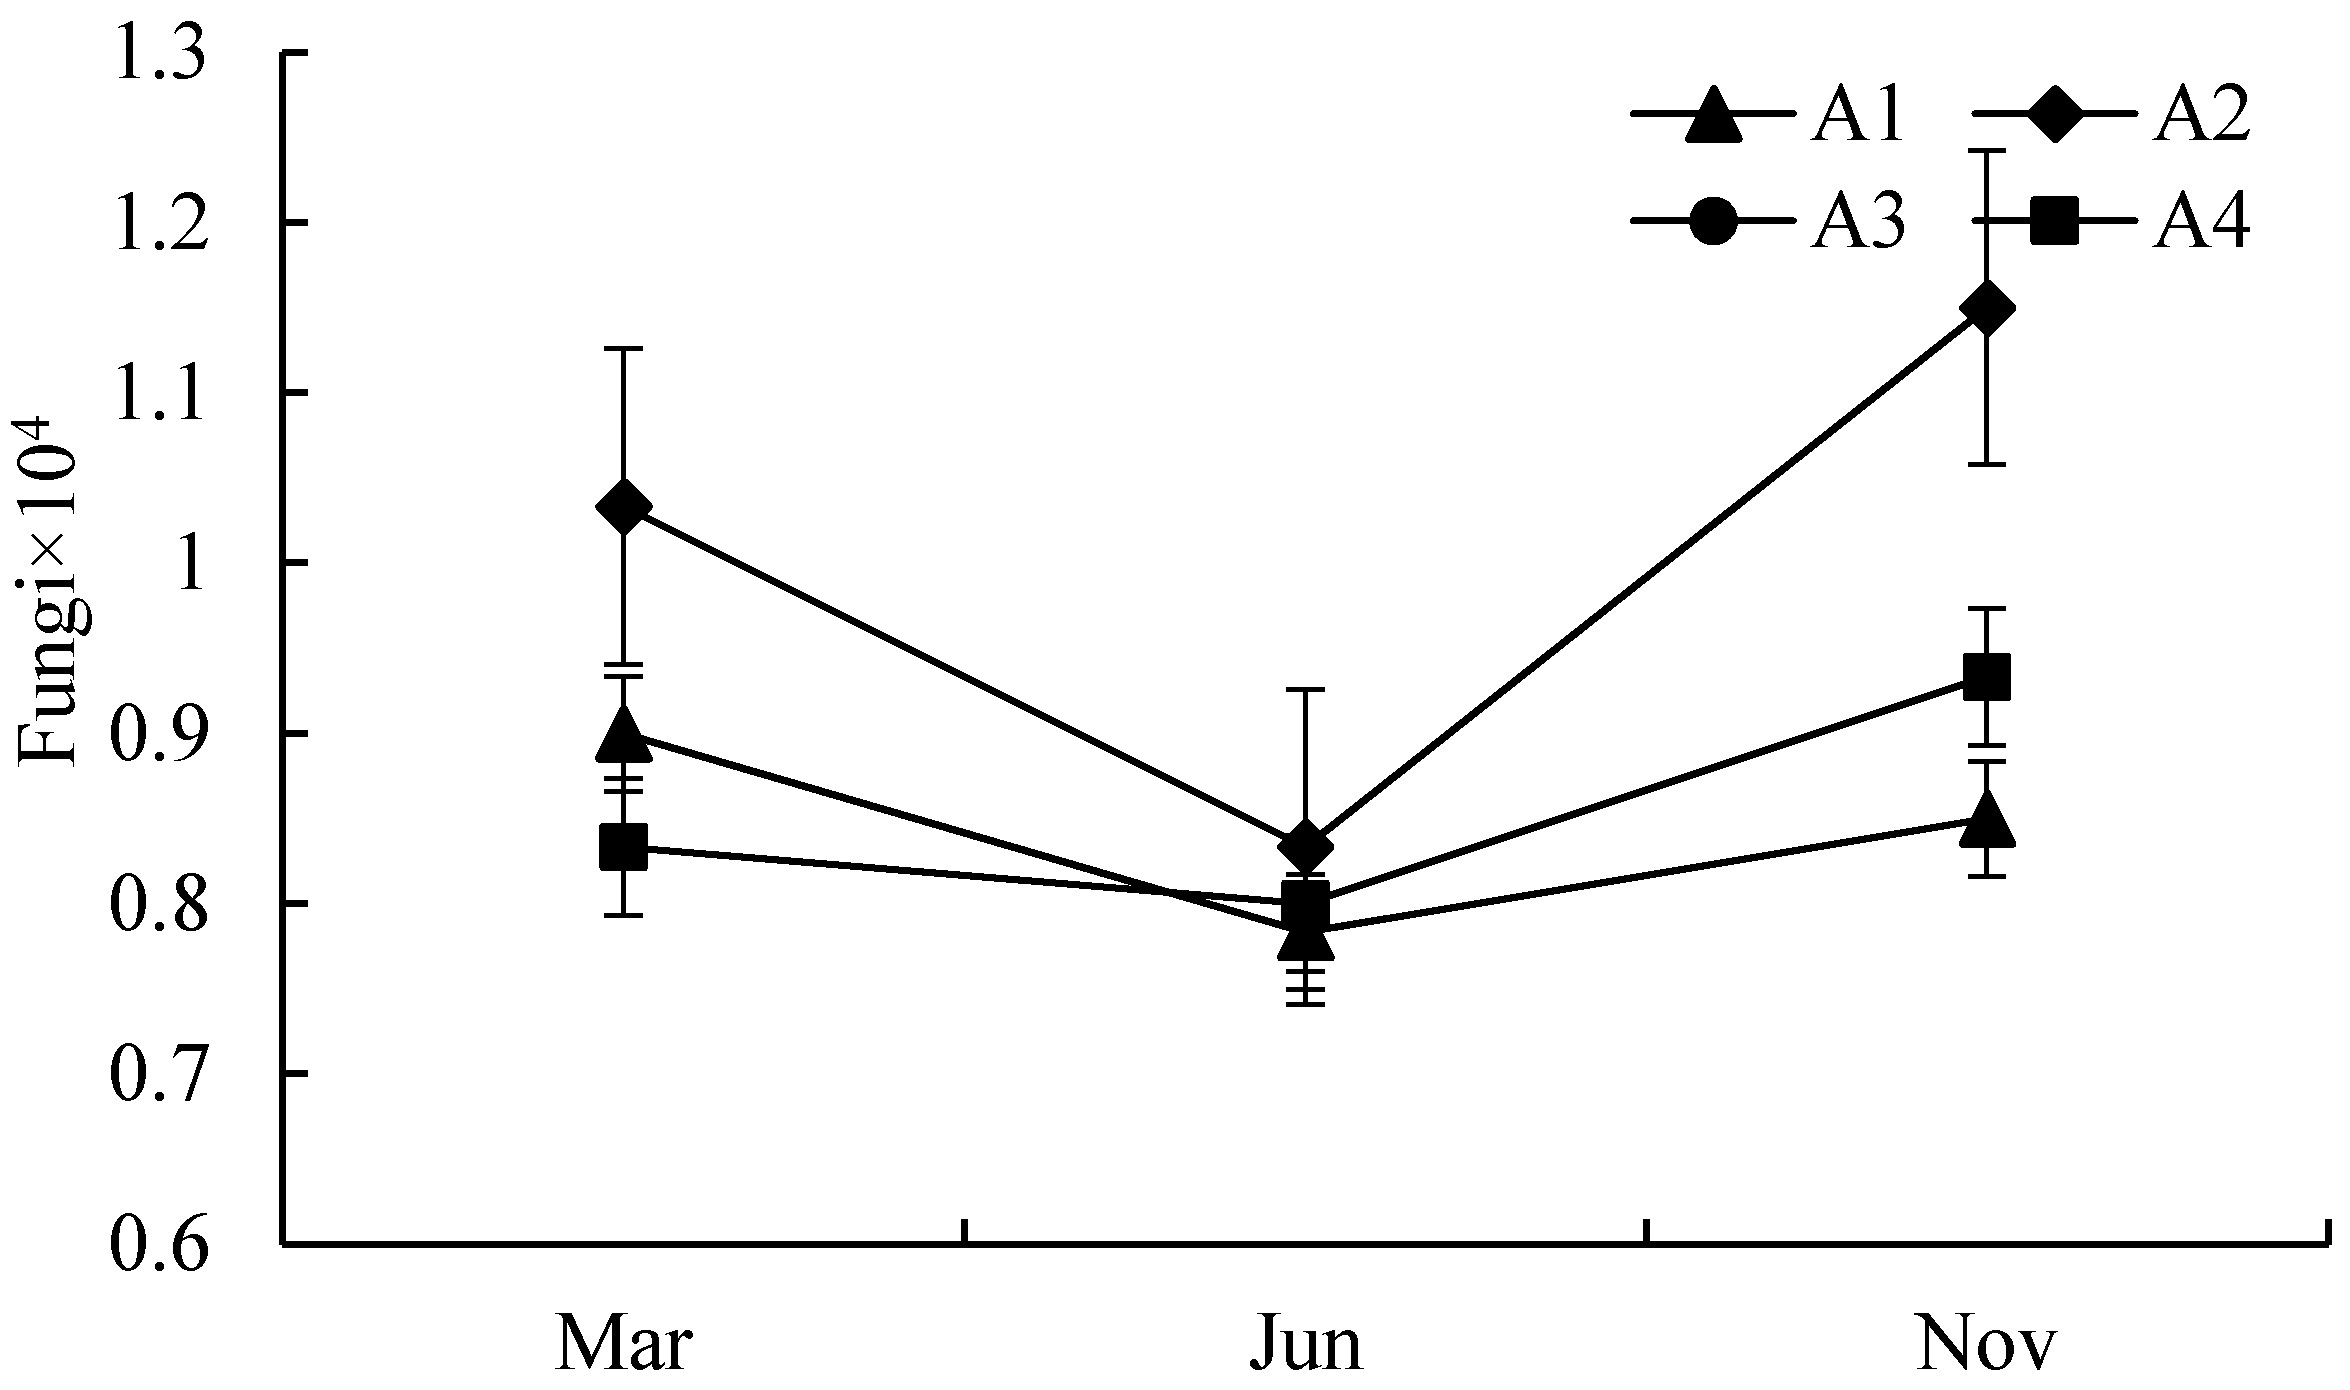
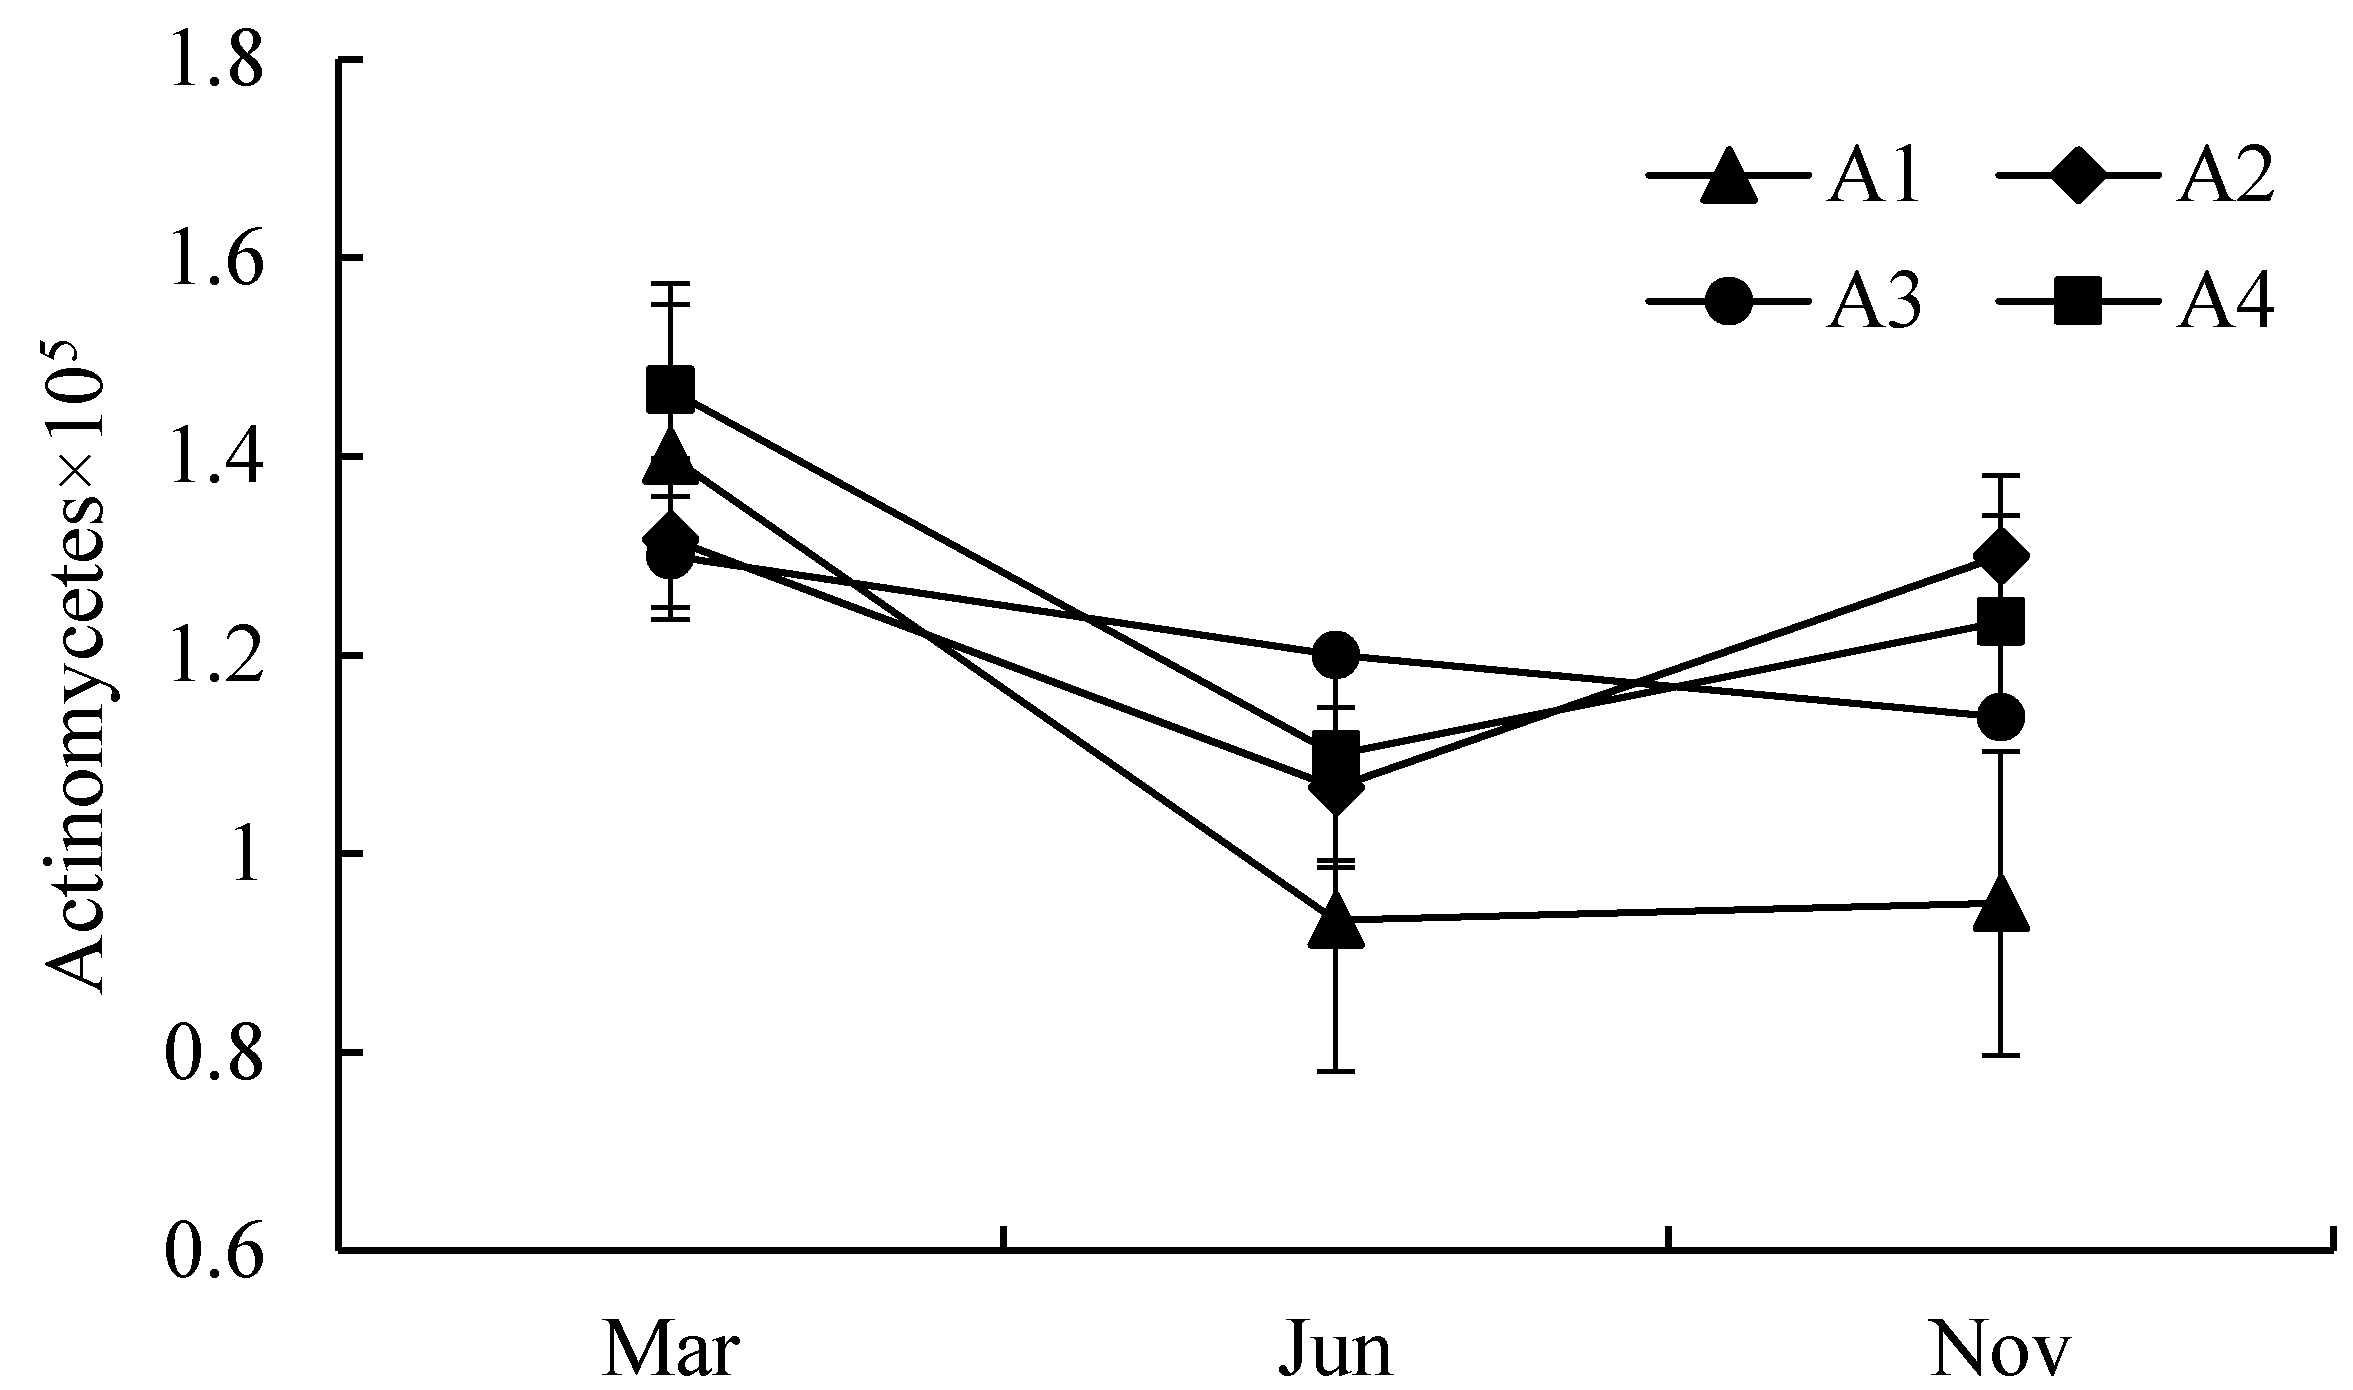
The biomass in the soil had a noticeable drop from Mar to Jun until Nov. In general, the proper temperature aids the reproduction of microorganisms; however, in our research, the soil under submerged conditions may affect the results [33]. The biomass in A1 was lower than the others, and the human activities (fertilization, grazing, and fishery activities) may make it different from the other areas. These trends are in line with the previous research of soil microorganisms [34].
Qualitative analysis of the effect of microorganisms on soil nutrients is arduous due to the highly sophisticated natural factors and anthropic factor [33]. We analyzed the biological characteristics of the soil in wetlands from a quantitative angle. The distribution and change in the number of bacteria can be seen in Figure 3. Based on the experimental results, the bacteria in the soil were recorded with the highest quantity, its average ranges were 1.7 − 4.0 × 10⁶ cfu/g in Mar, 1.3 − 3.6 × 10⁶ cfu/g in Jun, and 1.4 − 3.1 × 10⁶ cfu/g in Nov.
The main role of bacteria in soil is to decompose organic matter, and the decomposed product is essential for plants growth. The abundance of bacteria in the four sampling areas in our study is the high in March and the low in Jun. The number of growing plants is consistently low in Jun. With the climate changes in south China and Poyang Lake, it is reasonable to have a certain influence on the abundance and decomposition ability of soil bacterial communities in the soil of Antarctic mountain wetland, thus affecting the soil fertility.
The distribution and change in the number of Fungi can be seen in Figure 4. Fungi play an important role in the decomposition of macromolecular organic matter as well as in the maintenance of soil structure. The quantities of fungi were 0.5–1.4 × 10⁴ cfu/g in Mar, 0.5–1.2 ×10⁴ cfu/g in Jun, and 0.6–1.4 × 10⁴ cfu/g in Nov. The decrease of the fungi in soil in rainy season has certain influence on the soil supplying nutrients for plant growth and the structure of soil. Also, the advancement of the drawdown time and the change of the lowest water level in Poyang lake in recent years will greatly change the soil microorganisms in the wetland, thus changing the characteristics of submerged, emergent, and terrestrial vegetation communities.
The distribution and change in the number of Actinomycetes can be seen in Figure 5. The quantity of actinomycetes in soil is close to that of bacteria, although the actinomycetes abundance is small, but the biomass in soil is almost the same as bacteria. The secretion of Cytokinin promotes the growth of crops, and has the role in disease prevention against Zhuang bacteria. The numbers of the soil actinomycetes were in the range of 0.90–1.9 × 10⁵ CFU/G in Mar, 0.8–1.5 × 10⁵ CFU/G in Jun, and 0.6–1.6 × 10⁵ CFU G in Nov. The difference of biomass in the four areas was not significant. The change trend of actinomycetes in different periods was consistent with that of bacteria. In this study, the number of actinomycetes in A1 in June and November was lower compared to other regions, and this may be owing to agricultural and fishery activities.

3.2. The Spatial and Temporal Distribution of the Soil Organic Matter (SOM) and Nutrients

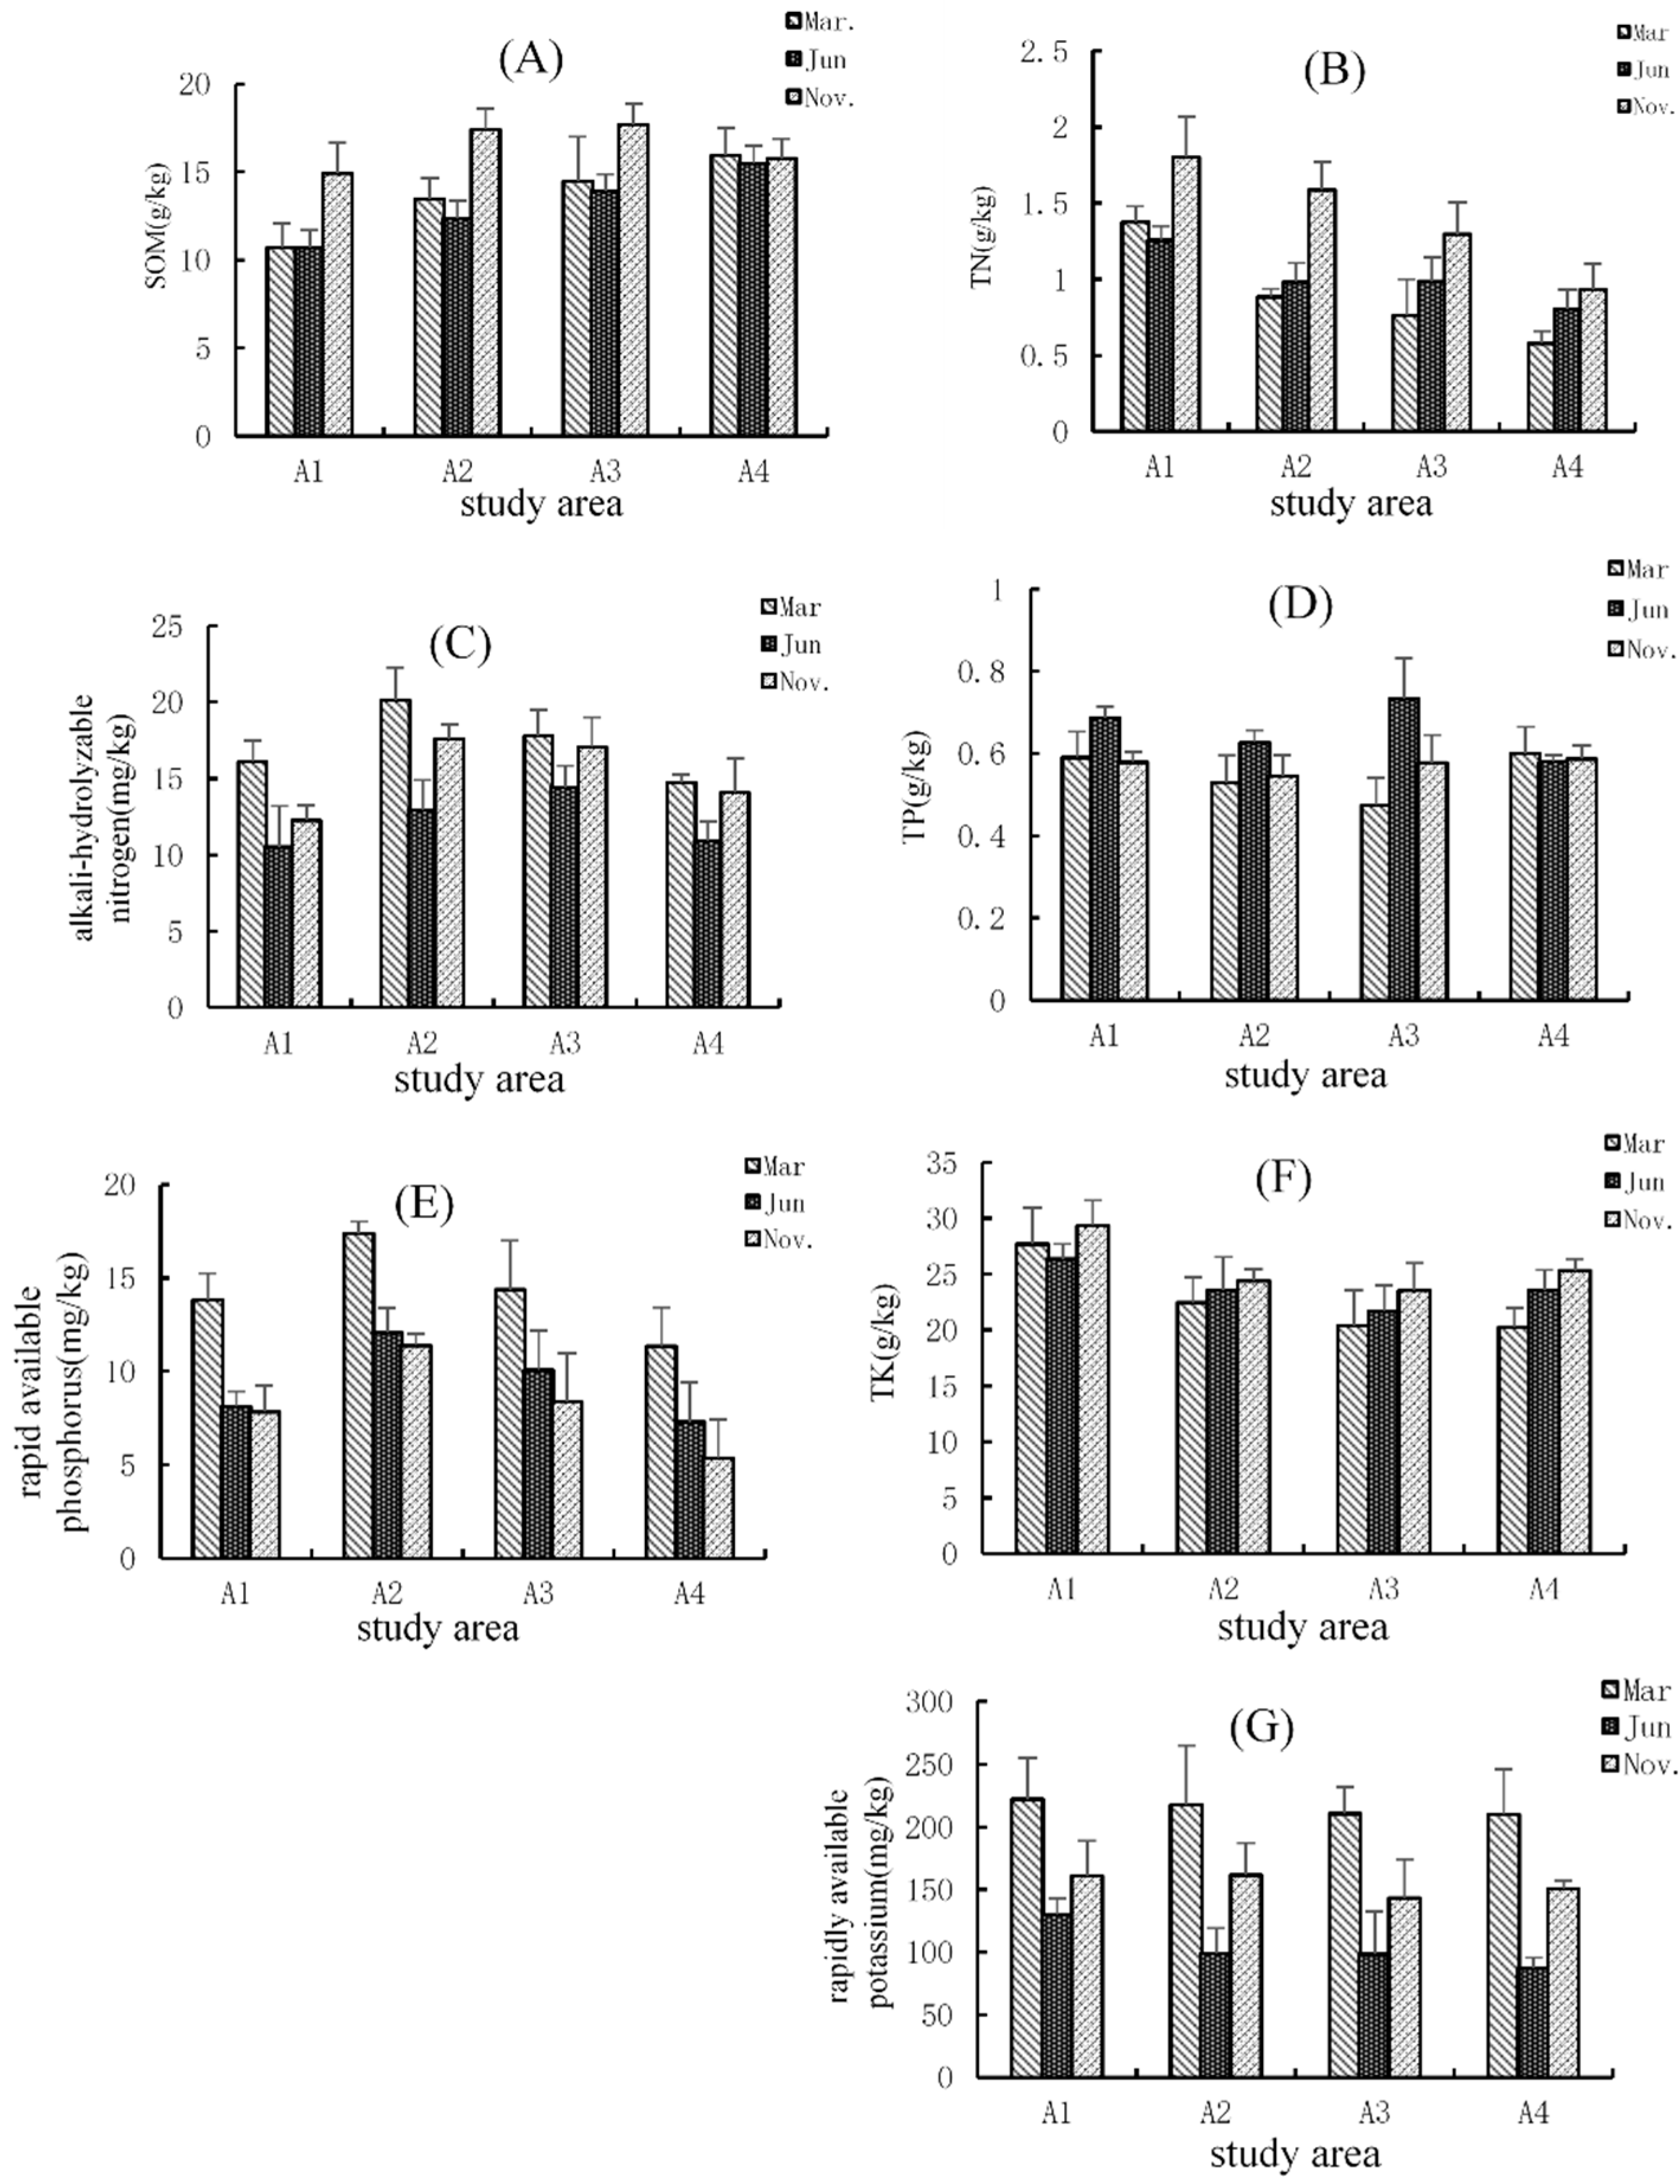
The results showed less significant spatial heterogeneity in the SOM among sampling areas except in Mar (Figure 6A). The average concentrations (ranges) of the SOM in Mar, Jun, and Nov were 13.4 g kg−1 (8.65–17.90 g kg−1), 12.86 g kg−1 (7.28–17.44 g kg−1), and 16.63 g kg−1 (10.16–19.87 g kg−1), respectively. During Mar, the highest average value (15.9 g kg−1) was recorded at A4 due to the lower amount of human activities and large amount of vegetation., this is consistent with Paul et al. (2016) and Haynes et al. (2005), plant detritus was an important component of the SOM [35,36].
The lowest average value of the SOM occurred in A1, and this result can be mainly controlled by human activities, such as grazing, mowing grass, and fishing. For intra-annual trends, the contents of the SOM showed fluctuations and decreased gradually from Mar to Jun, then increased in Nov. The submergence and backwater conditions may have caused this trend, lower SOM in the wet season would likely be due to water current. When the water subsides (during flow recession), material depositions would likely account for higher SOM. As the water level decreases and soil microbes become more active (due to sufficient air and water-filled pore spaces), decomposition of SOM may account for the lower SOM in Mar than in Nov [35,36]. Although there was no significant difference in total microbial biomass between A2 and A3 in March, soil moisture promoted the formation of soil AN.
The spatial pattern of the TN showed a significant difference in Mar (Figure 6B) with an average value of 0.93 g kg−1. The concentration of TN decreased in the order of A1 > A2 > A3 > A4. The spatial variation in TN can be considered as a result of anthropogenic activities, i.e., fertilization and domestic sewage. In contrast, there was insignificant spatial variability in Jun and Nov. While the temporal pattern showed an insignificant difference, the highest average concentration of TN, with a value of 1.42, was in Nov, followed by that of Jun (1.02) and Mar (0.93). This was because the same hydrological conditions acted on these areas, promoting the process of nitrogen accumulation in the wet season.
The mean values of the AN in Mar, Jun, and Nov were 17.55, 12.58, and 15.56 mg kg−1, respectively (Figure 6C). The concentration of the AN varied among sampling times, the highest concentration of AN was recorded in Mar. The differences of the AN content in the four sampling areas can be neglected except in Mar. The concentration ranged from 14 mg kg−1 to 24.5 mg kg−1, while A3 had the highest value, followed by A2. Although the total microbial biomass of A2 and A3 had no significant difference in March, soil moisture promoted the formation of AN [37,38] (Area 3 is located next to the river mouth of Ganjiang River and A2 is located center of Poyang Lake with higher moisture).
According to our data, the content of the TP in A3 was larger with a value of 0.73 g kg−1, followed by A1 (0.69 g kg−1) in Jun (Figure 6D). These differences may arise from the agricultural processing of fertilization, the accumulation of P in the soil, and the entering loads of nutrition from Ganjiang River downstream in the wet season [39]. The ranges (and mean values) of the TP concentrations were: Mar, 0.38–0.68 g kg−1 (0.53 g kg−1); Jun, 0.56–0.88 g kg−1 (0.67 g kg−1); and Nov, 0.48–0.7 g kg−1 (0.57 g kg−1). The higher concentration value in Jun might be attributed to a considerable effect from cultivated activities and sewage treatment from Ganjiang River.
The content ranges of the AP in soil were 9.3–19.7, 5.5–14, and 3.3–13.7 mg kg−1 in Mar, Jun, and Nov, respectively (Figure 6E). The average AP content in Mar (14.61 mg kg−1) was higher than that in Jun and Nov (9.76 and 8.61 mg kg−1). The contents of the AP in A2 and A3 were determined with relatively high values compared with A1 and Area 4, and there were significant discrepancies among the four sampling areas. The cause of this pattern is similar to that of AN. The AP content in the wet season was governed by, e.g., urban sewage, agricultural drains from Ganjiang River, and the changing hydrological conditions.
The concentration of TK showed insignificant spatial and temporal variations (Figure 6F), except for these sites near Nanji county, with a range between 15.6–32.4 g kg−1. Spatially, Area 1 had the highest average value, which may be attributed to the agricultural activities characterized by a large amount of inorganic fertilizer. Temporally, the average values of the TK contents were 22.8, 23.7, and 25.5 g kg−1 in Mar, Jun, and Nov, respectively. According to Li et al. (2015), the TK has an indifferent response to different inundation zones; to some extent, this can be used to explain the temporal distribution in our study [40].
The mean concentrations of AK for Mar, Jun, and Nov were 216.3 mg kg−1, 105.3 mg kg−1, and 153.5 mg kg−1, and the ranges were 154–284 mg kg−1, 46–148 mg kg−1, and 108–202 mg kg−1, respectively (Figure 6G). The temporal variation in the AK content was more significant than that in space. Based on these data, we can reasonably conclude that the soil temperature and humidity conditions in March are more conducive to the growth and reproduction of microorganisms, thereby promoting the cyclic conversion of effective nutrients [41].

3.3. Correlation Analysis for Statistics

There is a quantitative relationship between microorganisms and soil nutrients, as shown in Table 3. In the three periods of sampling, except for bacteria in Mar and Nov, the AN had a significant relation to the biomass in soil. In terms of results, fungi promote the circulation of AN in different periods and actinomycetes has an inhibition in Mar and promotion in Jun and Nov. TOC does not have a significant relation in Mar but has a significant positive relation in Jun. Besides, TP, AP, TK, and AK have different correlation with flora in different periods (shown in Table 3). A significant correlation between the TN and biomass was not observed except for with bacteria in Nov. The effect of microorganisms on soil nutrients is highly sophisticated, particularly in wetlands [36]. The results of correlation analysis indicated that microorganisms have an important role linked to the nutrient cycle in wetland soil, and the microbial biomass activity also has a great impact on the soil physico-chemical characteristics [41,42].
As shown in Table 4, in Mar, the SOM showed a negative correlation with the TN and TK. The concentration of the TN was highly correlated to the TK with r = 0.627. The AN compared with the AP showed a significant positive correlation. In Jun, the TK content was inversely related to the AN and was positively related to the AK. The concentration of the SOM was closely related to the AN. However, there were no notable correlations among the other variables. The results showed that, in Nov, the nutrients, except for two groups (TN and TK with r = 0.438, TK and AN with r = −0.642), did not process significant correlations with each other.
These variables showed insignificant correlations in Jun and Nov. The effect of multi-factors on the cycle and accumulation of nutrients in wetland soil is complicated, and, together with the hydrodynamic and hydrologic processes in the wet season, the recycling and accumulation processes of nutrients were more intricate. Although slight correlations among these variables were observed, there was a strong possibility that common factors had an effect on different variables.

3.4. Evaluation of Soil Fertility Using the IFI

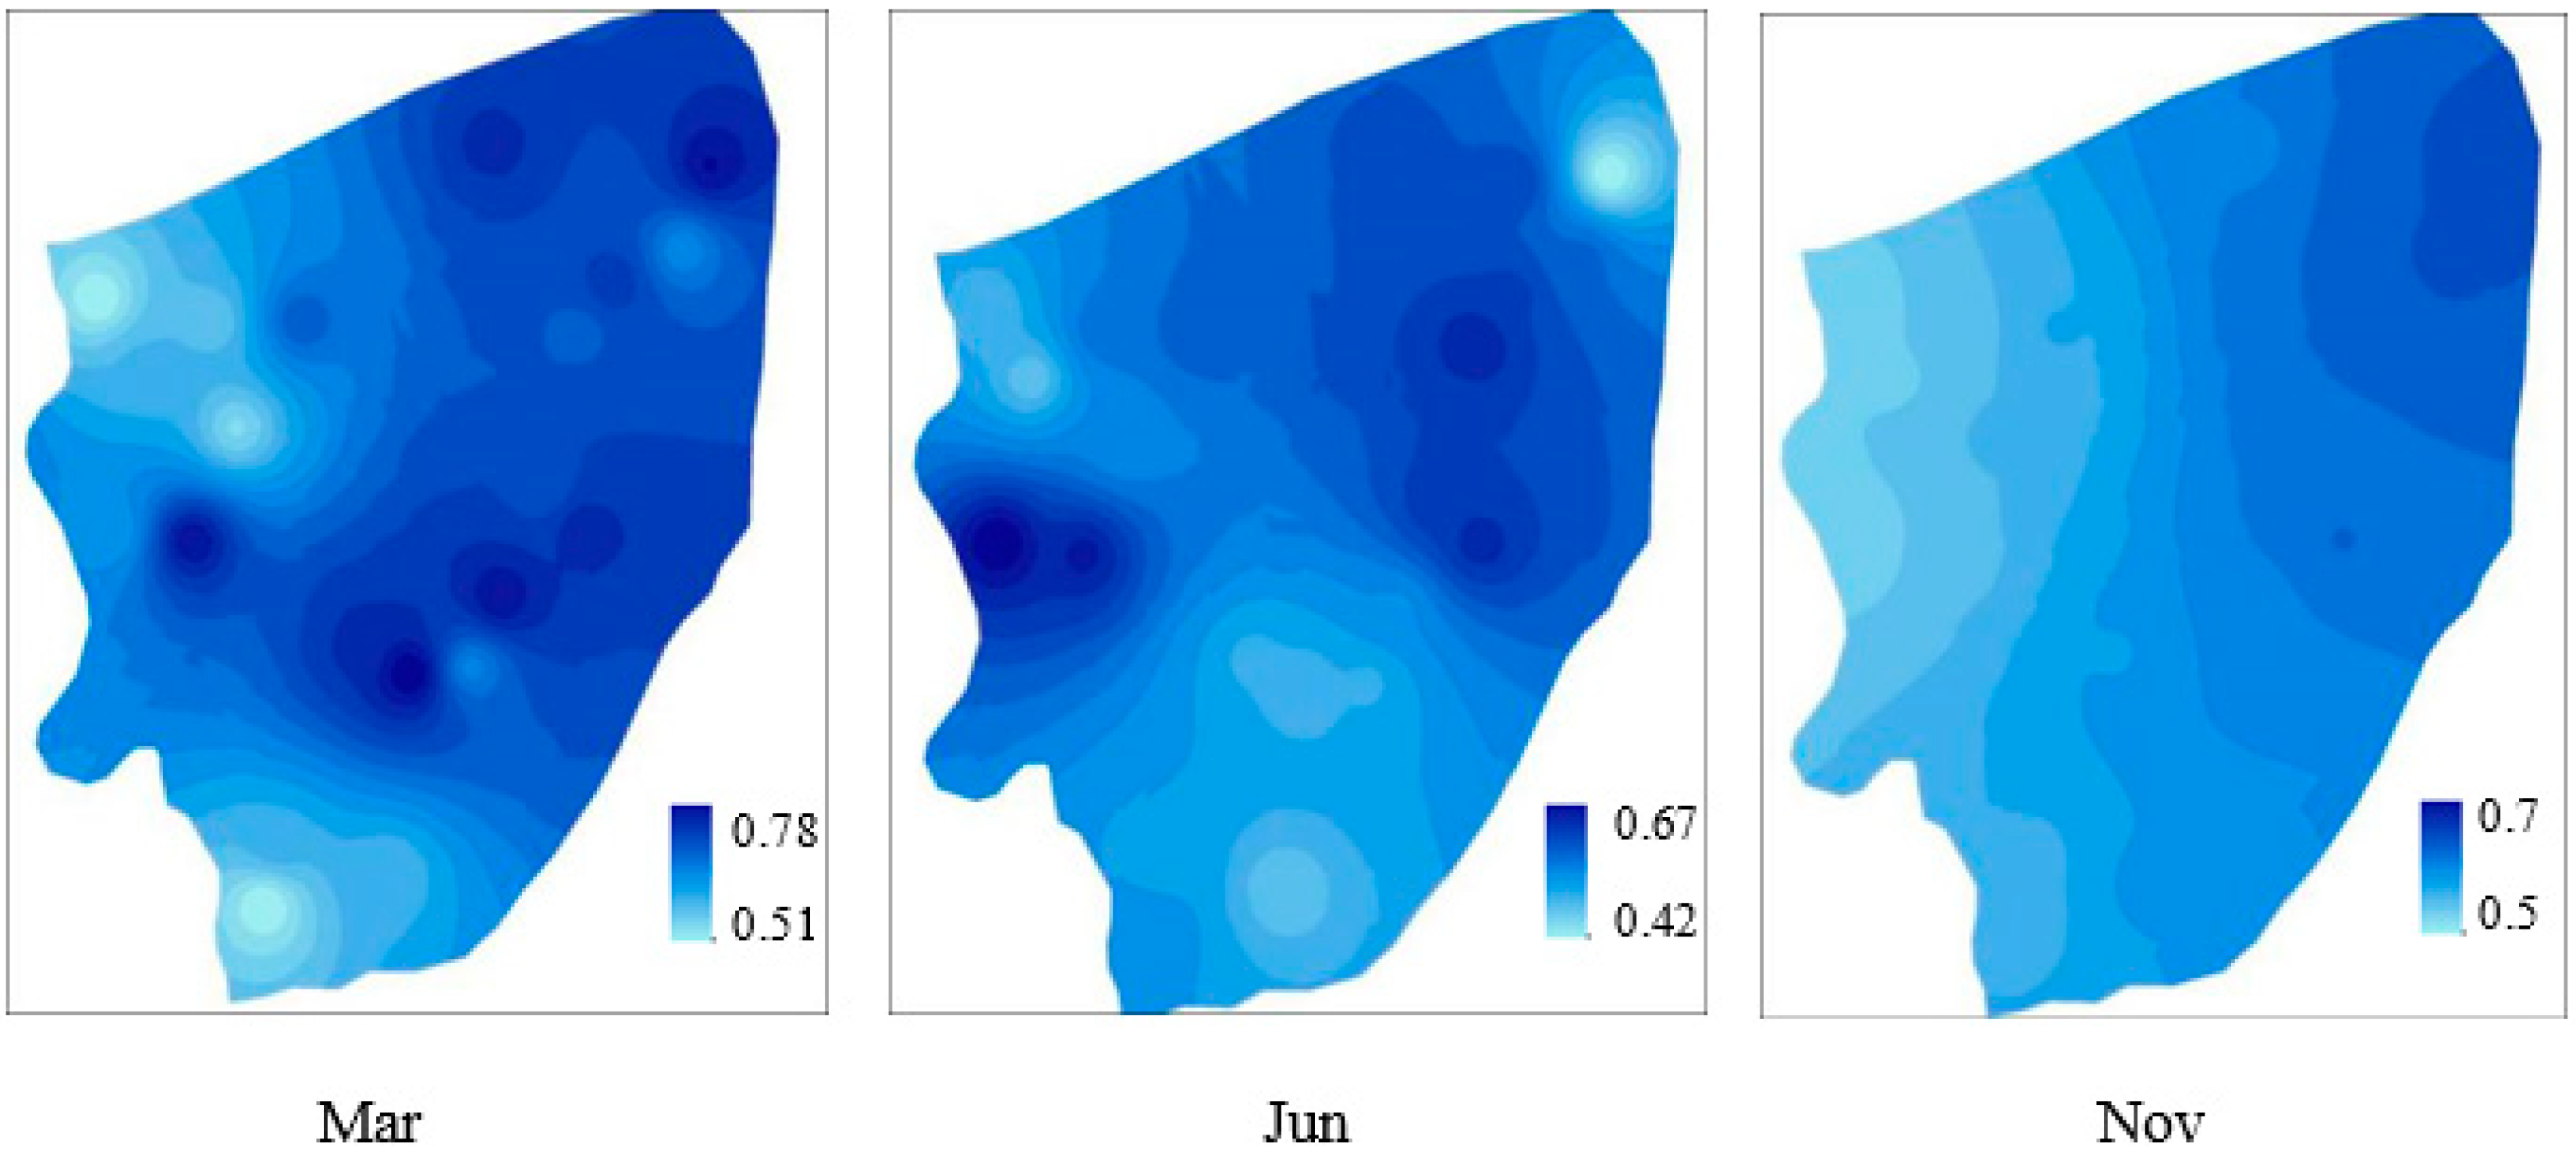
The IFI was performed using the data of seven variables. The seven original variables were standardized by curve type related to each index, and, combined with the geographical information system (GIS), the soil fertility spatial and temporal distribution of Nanjishan Wetland National Nature Reserve (Figure 7) was obtained. In Mar (the dry season), the IFI values of the study area ranged from 0.51 to 0.78 with a mean of 0.66. The fertility levels of the sampling areas A1 (0.73) and A2 (0.71) were higher than A3 (0.63) and A4 (0.56), this spatial variability was caused by the location of A1, which is Nanji county with agricultural activities, and the longer-term inundation in A2 [43,44].
We concluded that anthropogenic activities were the major influencing factor on the soil fertility in Mar (the dry season). There was no significant spatial variability during June. At the time of growth, the mean values of the IFI in the four study areas were: A1, 0.55; A2, 0.56; A3, 0.57; and A4, 0.5. Compared with Mar, the spatial pattern of the IFI in the wetland indicated that the effects of hydrological processes on the nutrient distribution were greater than those of human activities in the wet season [45]. This can be explained in that nutrients release from the sediments to the overlying water and transform with the water [46,47].
The value of the IFI measured in A4 was relatively high, possibly due to the tributary of Ganjiang River with an abundance of nutrients dumping into the waters [39]. The value of the IFI measured in Nov (the water recession period) had the same variability with the hydraulic gradient and recession hydrograph with a range from 0.53 (shorter submerged duration) to 0.7 (longer submerged duration); therefore, human activities appeared to play an important role in the spatial variation in nutrients in the wet season, and the recession hydrograph beyond the human activities was a crucial factor influencing the distribution of nutrients.
The temporal variability of the IFI in the wetland displayed a decreasing trend from Mar (0.67) to Jun (0.55), and then recovered in Nov (0.61). In Jun (the growing season), according to Edwards et al. (2013) and Ge et al. (2014), the soil nutrients showed a downward trend with the vegetation growth [48,49]. Therefore, the plants uptake nutrients from the soil, and retention can be considered as a major factor that affected the soil fertility in Jun. A significant concentration gradient was observed from the estuary of Ganjiang River to the center of Poyang lake with a relatively high average value. The higher value of the IFI in Nov compared with in Jun, accompanied by diminished plants, indicated that a large amount of plant debris was a key factor in influencing the nutrient loading in autumn [50].

3.5. Potential Risk Assessment of Eutrophication

The calculated designation number values for the TN and TP in the sediments of the Nanjishan wetland sampling sites are summarized in Table 5. In all 23 sampling sites, the designation numbers of the TN and TP showed a range as follows: TN, 1.22–2.44 (1.87) and TP, 0.93–1.47 (1.21); thus, we concluded that the possibility of eutrophication was large. The designation numbers of the TN had high scale ranges in S1–S7, and the highest values were found in S2 and S19.
Thus, these areas are sensitive to changes of the TN contents, and effects on eutrophication from the TN release from sediments are more likely than others. The designation numbers of the TP, except for S9 and S20–S22, did not show notable differences and were >1. However, according to Liu et al. (2016), the water quality of Poyang Lake is polluted on a slight level and is relatively good, and the current eutrophication index is relatively low [45]. The effect of nutrient release from sediments on phytoplankton may be concealed by the underwater light and may be a secondary factor for phytoplankton in the study area [23].

4. Conclusions

In Nanjishan Wetland Nature Reserve, similar to many other wetlands, the spatiotemporal characteristics of the soil nutrient variables are essential for understanding the vegetation succession in the wetland and in maintaining the wetland ecosystem. We investigated four typical sampling areas during Mar, Jun, and Nov, and we found the areas characterized by different factors, such as anthropogenic activities and hydrological processes. The results of the nutrient distribution demonstrated significant spatial and temporal variations, and we concluded that anthropogenic activities and riverine discharge from Ganjiang River were the principal factors in the spatial variations, while the submerged environment and plant debris limited the temporal variations.
The seasonal variations in the microbial biomass in the four areas were analyzed, and we found that the difference in the biomass in the four areas was not significant. However, a close association between the microorganisms and soil nutrients was found. According to the correlations between the chemical properties of the soils, there were slight correlations between each index. The soil fertility was well represented by the IFI. Compared with Mar, the IFI presented a decreasing tendency in Jun and an increasing tendency in Nov.
These trends were attributed to the nutrient distribution and seasonal variations. As for the single factor standard index method (SFSI), there was a significant eco-environmental risk during the wet season. However, the water quality of Poyang lake is relatively good (polluted at a slight level) [45]. Future research is needed to ascertain the effects of the nutrients released from sediments on the water quality in the wetland.

Author Contributions

Conceptualization, S.Z. and Y.L.; methodology, M.D.; software, M.D.; formal analysis, S.Z.; investigation, J.W., S.Z., M.D., A.S.N. and E.N.; writing—original draft preparation, J.W. and S.Z.; writing—review and editing, Y.L., A.S.N. and E.N.; supervision, Y.L.; project administration, Y.L.; funding acquisition, Y.L. All authors have read and agreed to the published version of the manuscript.

Funding

This research was funded by the National Natural Science Foundation of China (52039003, 51779072), the Fundamental Research Funds for the Central Universities (B200204014), and the Major Science and Technology Program for Water Pollution Control and Treatment (2017ZX07204003).

Institutional Review Board Statement

Not applicable.

Informed Consent Statement

Not applicable.

Data Availability Statement

The data used to support the findings of this study are available from the corresponding author upon request.

Conflicts of Interest

The authors declare no conflict of interest.

References

  1. Borin, M.; Malagoli, M. Ecology, functioning and management of wetland systems. Environ. Sci. Pollut. Res. 2015, 22, 2357–2359. [Google Scholar] [CrossRef] [PubMed] [Green Version]
  2. Macci, C.; Peruzzi, C.; Doni, S.; Iannelli, E.; Masciandaro, G. Ornamental plants for micropollutant removal in wet-land sys-tems. Environ. Sci. Pollut. Res. 2015, 22, 2406–2415. [Google Scholar] [CrossRef]
  3. Zou, X.; Zhang, H.; Zuo, J.; Wang, P.; Zhao, D.; An, S. Decreasing but still significant facilitation effect of cold-season macro-phytes on wetlands purification function during cold winter. Sci. Rep. 2016, 6, 27011. [Google Scholar] [CrossRef] [PubMed] [Green Version]
  4. Wei, J.; Duan, M.; Li, Y.; Nwankwegu, A.S.; Ji, Y.; Zhang, J. Concentration and pollution assessment of heavy metals within surface sediments of the Raohe Basin, China. Sci. Rep. 2019, 9, 1–7. [Google Scholar] [CrossRef] [PubMed] [Green Version]
  5. MacArthur, R.H.; MacArthur, J.W. On Bird Species Diversity. Ecology 1961, 42, 594–598. [Google Scholar] [CrossRef]
  6. Schmidt, M.H.; Lefebvre, G.; Poulin, B.; Tscharntke, T. Reed cutting affects arthropod communities, potentially reducing food for passerine birds. Biol. Conserv. 2004, 121, 157–166. [Google Scholar] [CrossRef]
  7. Wu, X.X.; Lv, M.; Jin, Z.Y.; Michishita, R.; Chen, J. Normalized difference vegetation index dynamic and spatiotem-poral distribution of migratory birds in the Poyang Lake wetland, China. Ecol. Indic. 2014, 47, 219–230. [Google Scholar] [CrossRef]
  8. You, H.; Xu, L.; Liu, G.; Wang, X.; Wu, Y.; Jiang, J. Effects of Inter-Annual Water Level Fluctuations on Vegetation Evolution in Typical Wetlands of Poyang Lake, China. Wetlands 2015, 35, 931–943. [Google Scholar] [CrossRef]
  9. Dai, X.; Wan, R.; Yang, G.; Wang, X.; Xu, L. Responses of wetland vegetation in Poyang Lake, China to water-level fluctua-tions. Hydrobiologia 2016, 773, 35–47. [Google Scholar] [CrossRef]
  10. Myungsyun, S.; Seongyoul, C.; Sangkun, P.; Ohkeun, K. Growth responses and nutrient absorption characteristics of ardisia pot plants in two growth stages as influenced by nutrient solution strengths. Hortic. Environ. Biotechnol. 2009, 50, 525–531. [Google Scholar]
  11. Zhang, Q.J.; Yu, X.B.; Qian, J.X.; Xiong, T. Distribution characteristics of plant communities and soil organic matter and main nutrients in the Poyang Lake Nanji Wetland. Acta Ecol. Sin. 2012, 12, 3656–3669. (In Chinese) [Google Scholar] [CrossRef] [Green Version]
  12. Xu, J.X.; Xu, L.G.; Jiang, J.H.; Wang, X.L.; Chen, Y.L.; Xu, J. Change of vegetation community structure and the rela-tionship between it and soil nutrients in typical beaches in Poyang Lake Area. Wetl. Sci. 2013, 2, 186–191. (In Chinese) [Google Scholar]
  13. Sun, B.; Hallett, P.D.; Caul, S.; Daniell, T.J.; Hopkins, D.W. Distribution of soil carbon and microbial biomass in arable soils under different tillage regimes. Plant Soil 2011, 338, 17–25. [Google Scholar] [CrossRef]
  14. Heemsbergen, D.; Berg, M.P.; Loreau, M.; Hal, J.; Faber, J.H.; Verhoef, H. Biodiversity effects on soil processes ex-plained by site-specific functional dissimilarity. Science 2004, 306, 1019–1020. [Google Scholar] [CrossRef] [Green Version]
  15. Zak, D.R.; Holmes, W.; White, D.C.; Peacock, A.; Tilman, D. Plant diversity, soil microbial communities, and ecosys-tem function: Are there any link? Ecology 2003, 84, 2042–2050. [Google Scholar] [CrossRef] [Green Version]
  16. Bardgett, R.D.; Shine, A. Linkages between plant litter diversity, soil microbial biomass and ecosystem function in temper-ate grasslands. Soil Biol. Biochem. 1999, 31, 317–321. [Google Scholar] [CrossRef]
  17. Broughton, L.C.; Gross, K.L. Patterns of diversity in plant and soil microbial communities along a productivity gra-dient in a Michigan old field. Oecologia 2000, 125, 420–427. [Google Scholar] [CrossRef]
  18. Ji, Y.; Zhang, J.; Li, R.; Pan, B.; Zhang, L.; Chen, X. Distribution and partitioning of heavy metals in sediments of the Xinjiang River in Poyang Lake Region, China. Environ. Prog. Sustain. Energy 2015, 34, 713–723. [Google Scholar] [CrossRef]
  19. Zhang, L.; Yao, X.L.; Tang, C.J.; Xu, H.X.; Jiang, X.Y.; Zhang, Y.L. Influence of long-term inundation and nutrient ad-dition on denitrification in sandy wetland sediments from Poyang Lake, a large shallow subtropical lake in China. Environ. Pollut. 2016, 219, 440–449. [Google Scholar] [CrossRef]
  20. Ye, X.; Li, Y.; Li, X.; Zhang, Q. Factors influencing water level changes in China’s largest freshwater lake, Poyang Lake, in the past 50 years. Water Int. 2014, 39, 983–999. [Google Scholar] [CrossRef]
  21. Wang, X.L.; Han, J.Y.; Xu, L.G.; Wan, R.G.; Chen, Y.W. Soil characteristics in relation to vegetation communities in the wet-lands of Poyang Lake, China. Wetlands 2014, 34, 829–839. [Google Scholar]
  22. Tan, Z.; Jiang, J.-H. Spatial–Temporal Dynamics of Wetland Vegetation Related to Water Level Fluctuations in Poyang Lake, China. Water 2016, 8, 397. [Google Scholar] [CrossRef] [Green Version]
  23. Wu, Z.; Cai, Y.; Liu, X.; Xu, C.P.; Chen, Y.; Zhang, L. Temporal and spatial variability of phytoplankton in Lake Poyang: The largest freshwater lake in China. J. Great Lakes Res. 2013, 39, 476–483. [Google Scholar] [CrossRef]
  24. Li, B.; Yang, G.S.; Wan, R.G.; Zhang, Y.H.; Dai, X.; Chen, Y.W. Spatiotemporal variability in the water quality of po-yang lake and its associated responses to hydrological conditions. Water 2016, 8, 296–312. [Google Scholar] [CrossRef] [Green Version]
  25. Shao, M.Q.; Jiang, H.J.; Guo, H.; Zeng, B.B. Abundance, distribution and diversity variations of wintering water birds in Poyang Lake, Jiangxi Province, China. Pak. J. Zool. 2014, 46, 451–462. [Google Scholar]
  26. Dronova, I.; Beissinger, S.R.; Burnham, J.W.; Gong, P. Landscape-Level Associations of Wintering Waterbird Diversity and Abundance from Remotely Sensed Wetland Characteristics of Poyang Lake. Remote. Sens. 2016, 8, 462. [Google Scholar] [CrossRef] [Green Version]
  27. Yang, P.; Liu, X.; Xu, B. Spatiotemporal pattern of bird habitats in the Poyang Lake based on Landsat images. Environ. Earth Sci. 2016, 75, 1230. [Google Scholar] [CrossRef]
  28. Nelson, D.W.; Sommers, L.E. Total carbon, organic carbon and organic matter. In Methods of Soil Analysis: Part 3, Chemical Methods; Bigham, J.M., Ed.; Soil Science Society of America Society of Agronomy, Inc.: Madison, WI, USA, 1996; pp. 961–1010. [Google Scholar]
  29. Bremner, J.M. Nitrogen-total. In Methods of Soil Analysis: Part 3; Chemical, Methods, SSSA Book, Series no 5, Bigham, J.M., Eds.; Soil Science Society of America Society of Agronomy: Madison, WI, USA, 1996; pp. 1085–1121. [Google Scholar]
  30. Xu, G. Manual of Soil Microbial Analysis; Agricultural Publishing House: Beijing, China, 1986. [Google Scholar]
  31. Li, Z.; Huang, J.Q.; Li, Y.Y.; Guo, W.; Zhu, J.F. Assessment on soil fertility of Dongting Lake wetland area (China) based on GIS and fuzzy evaluation. J. Central South Univ. 2011, 18, 1465–1472. [Google Scholar] [CrossRef]
  32. Leivuori, M.; Niemist, Ö.L. Sedimentation of trace metals in the Gulf of Bothnia. Chemosphere 1995, 31, 3839–3856. [Google Scholar] [CrossRef]
  33. Liu, Y.; Li, F.; Sun, Q.; Xie, Y. Review on the Study of Soil Microorganisms in Wetland Ecosystems. Chin. J. Appl. Environ. Biol. 2013, 19, 547–552. [Google Scholar] [CrossRef]
  34. Wang, Y.; Ke, X.; Wu, L.; Lu, Y. Community composition of ammonia-oxidizing bacteria and archaea in rice field soil as af-fected by nitrogen fertilization. Syst. Appl. Microbiol. 2009, 32, 27–36. [Google Scholar] [CrossRef]
  35. Paul, E.A. The nature and dynamics of soil organic matter: Plant inputs, microbial transformations, and organic matter sta-bilization. Soil Biol. Biochem. 2016, 98, 109–126. [Google Scholar] [CrossRef] [Green Version]
  36. Haynes, R. Labile Organic Matter Fractions as Central Components of the Quality of Agricultural Soils: An Overview. Adv. Agron. 2005, 85, 221–268. [Google Scholar] [CrossRef]
  37. Burger, M.; Jackson, L.E.; Lundquist, E.J.; Louie, D.T.; Miller, R.L.; Rolston, D.E.; Scow, K.M. Microbial responses and nitrous oxide emissions during wetting and drying of organically and conventionally managed soil under to-matoes. Biol. Fertil. Soils 2005, 42, 109–118. [Google Scholar] [CrossRef]
  38. Cavagnaro, T.R. Soil moisture legacy effects: Impacts on soil nutrients, plants and mycorrhizal responsiveness. Biol. Biochem. 2016, 95, 173–179. [Google Scholar] [CrossRef]
  39. Ouyang, Q.L.; Gao, G.Q.; Liu, S.S.; Shi, X.L.; Ju, H.Y. Study on Adsorption and Desorption of Suspended Sediments to Phos-phorus in Ganjiang River. Adv. Mater. Res. 2012, 599, 669–672. [Google Scholar] [CrossRef]
  40. Li, Y.; Wang, D.M.; Xin, Z.B.; Wang, J.; Ren, Y.; Li, Q.S. Plant diversity and soil characteristics of different inundation zones in an aquatic-terrestrial ecotone, Li River. Acta Ecol. Sin. 2015, 15, 5121–5130. (In Chinese) [Google Scholar]
  41. Devi, N.B.; Yadava, P. Seasonal dynamics in soil microbial biomass C, N and P in a mixed-oak forest ecosystem of Manipur, Northeast India. Appl. Soil Ecol. 2006, 31, 220–227. [Google Scholar] [CrossRef]
  42. Parr, J.F.; Papendick, R.I. Soil quality, relationship and strategies for sustainable dryland farming system. Ann. Arid Zone 1997, 36, 181–191. [Google Scholar]
  43. Bai, J.; Gao, H.; Xiao, R.; Wang, J.; Huang, C. A Review of Soil Nitrogen Mineralization as Affected by Water and Salt in Coastal Wetlands: Issues and Methods. CLEAN–Soil Air Water 2012, 40, 1099–1105. [Google Scholar] [CrossRef]
  44. Huang, L.; Bai, J.; Xiao, R.; Shi, J.; Gao, H. The soil nitrogen dynamics in an inland salt marsh as affected by various experi-mental water levels. Hydrol. Process. 2014, 28, 4708–4717. [Google Scholar] [CrossRef]
  45. Liu, J.; Fang, S.; Sun, J. Nutrient zoning of Poyang Lake based on aquatic eco-environment indices. Environ. Earth Sci. 2016, 75, 61. [Google Scholar] [CrossRef]
  46. Wang, L.; Liang, T. Distribution Characteristics of Phosphorus in the Sediments and Overlying Water of Poyang Lake. PLoS ONE 2015, 10, e0125859. [Google Scholar] [CrossRef] [PubMed] [Green Version]
  47. Yang, Z.; Wang, L.; Liang, T.; Huang, M. Nitrogen distribution and ammonia release from the overlying water and sedi-ments of Poyang Lake, China. Environ. Earth Sci. 2015, 74, 771–778. [Google Scholar] [CrossRef]
  48. Edwards, K.A.; Jefferies, R.L. Inter-annual and seasonal dynamics of soil microbial biomass and nutrients in wet and dry low-Arctic sedge meadows. Soil Biol. Biochem. 2013, 57, 83–90. [Google Scholar] [CrossRef]
  49. Ge, P.; Da, L.; Wang, W.; Xu, X. Seasonal dynamics of dissolved organic carbon, nitrogen and other nutrients in soil of Pinus massoniana stands after pine wilt disease disturbance. J. soil Sci. Plant Nutr. 2014, 14, 75–87. [Google Scholar] [CrossRef] [Green Version]
  50. Zhao, Q.Q.; Bai, J.H.; Liu, Q.; Lu, Q.Q.; Gao, Z.Q.; Wang, J.J. Spatial and seasonal variations of soil carbon and nitro-gen con-tent and stock in a tidal salt marsh with tamarix chinensis, China. Wetlands 2016, 36 (Suppl. 1), S145–S152. [Google Scholar] [CrossRef]
Figure 1. Location of the Nanjishan wetland, Poyang Lake, and the sampling sites.
Sustainability 13 03846 g001
Figure 2. Curve diagrams of the S-type function and parabola-type function.
Sustainability 13 03846 g002
Figure 3. Microbial biomass (Bacteria) in sediments. (A1 is located in Nanji country with fisheries and agricultural activities; A2 with a longer submerged period and rare anthropogenic activities; A3 is located in the downstream of Ganjiang River in Jiangxi Province; A4 with abundant vegetation and few human activities).
Sustainability 13 03846 g003
Figure 4. Microbial biomass (Fungi) in sediments.
Sustainability 13 03846 g004
Figure 5. Microbial biomass (Actinomycetes) in sediments.
Sustainability 13 03846 g005
Figure 6. Distribution of the nutrients in sediments. (A) soil organic matter (SOM), (B) Total nitrogen (TN), (C) alkali-hydrolyzable nitrogen (AN), (D) total phosphorus (TP), (E): available phosphorus (AP), (F) total potassium (TK), (G) available potassium (AK).
Sustainability 13 03846 g006
Figure 7. Spatial and seasonal variations in the Integrated Fertility Index (IFI) in the study area.
Sustainability 13 03846 g007
Table 1. Location and description of the sampling sites.
Study AreaSampling SitesDetailed Description
A1S1–S6An area located neared the center of Poyang lake with a longer submerged period and rare anthropogenic activities.
A2S7–S12An area located in Ganjiang River downstream in Jiangxi Province, with heavy nutrients, such as nitrogen, phosphorus, and potassium.
A3S13–S20An area has abundant vegetation and few human activities.
A4S21–S23An area located neared the center of Poyang lake with a longer submerged period and rare anthropogenic activities.
Table 2. The types of functions and the threshold values of each fertility index. Total nitrogen (TN), total organic carbon (TOC), total phosphorus (TP), total potassium (TK), alkali-hydrolyzable nitrogen (AN), available phosphorus (AP), and available potassium (AK).
S-TypeParabola Type
AKTPTKANAPTNTOC
Point 1500.5101050.58.5
Point 2 111.5
Point 3 1.520
Point 42001.2259020225
Table 3. Pearson correlation coefficients between the biomass and chemical variables.
TNANTPAPTKAKTOC
Marbacteria0.06−0.21−0.04−0.45 *0.120.50 *0.04
fungi−0.080.51 *−0.46 *0.16−0.01−0.270.21
actinomycetes0.09−0.45 *0.40 *−0.010.110.42−0.23
Junbacteria−0.130.53 **0.48 *0.37−0.210.220.49 *
fungi−0.250.50 *0.170.02−0.120.43 *0.47 *
actinomycetes0.000.51 **0.120.16−0.49 *−0.46 *0.52 **
Novbacteria−0.45 *0.27−0.18−0.02−0.27−0.110.54 **
fungi−0.140.55 **0.110.52 **−0.50 *−0.190.44 *
actinomycetes−0.020.41 *0.050.42 *−0.47 *−0.090.08
Significant values (p < 0.05) are marked with an asterisk (*); significant values (p < 0.01) are marked with double asterisk (**).
Table 4. Pearson correlation coefficients for the relationships among the variables.
ParametersTNTPTKANAPAKSOM
TNA1
B1
C1
TPA0.361
B0.1531
C0.1081
TKA0.627 **0.1741
B0.2510.0271
C0.438 *0.2031
ANA0.023−0.330.0251
B−0.2270.378−0.474 *1
C−0.050.134−0.642 **1
APA0.189−0.1420.0650.593 **1
B−0.1470.221−0.2780.3051
C0.2470.123−0.2690.4021
AKA0.1910.4130.139−0.337−0.161
B0.1780.2160.419 *−0.051−0.2091
C0.3150.1610.292−0.1530.0481
SOMA−0.485 *−0.251−0.453 *0.4090.015−0.3321
B−0.3120.112−0.3860.523 *0.031−0.2551
C−0.199−0.042−0.1970.3460.2840.121
Significant values (p < 0.05) are marked with an asterisk (*); significant values (p < 0.01) are marked with double asterisk (**). A, B, and C stand for Mar, Jun, and Nov, respectively.
Table 5. The designation numbers and concentrations of the TN and TP in the surface sediments of Nanjishan wetland.
Sampling SiteTNDesignation NumberTPDesignation NumberSampling SiteTNDesignation NumberTPDesignation Number
11.292.340.661.10130.871.580.741.23
21.322.390.741.23140.951.730.861.43
31.061.930.701.17151.011.830.881.47
41.342.440.681.13160.951.730.781.30
51.322.390.681.13171.091.990.681.13
61.202.190.661.10180.981.780.721.20
71.232.240.621.03191.322.390.621.03
80.921.680.681.13200.731.320.580.97
90.951.730.580.97210.761.370.580.97
100.841.530.641.07220.981.780.560.93
111.041.880.621.03230.671.220.601.00
120.901.630.621.03
Publisher’s Note: MDPI stays neutral with regard to jurisdictional claims in published maps and institutional affiliations.