Abstract
The expansion of renewable energies and the concomitant compensatory measures, such as the expansion of the electricity grid, the installation of energy storage facilities, or the flexibilization of demand, lead to a more elaborated energy supply system. Furthermore, the technological development of small power plants has further progressed, and many novel technologies have achieved grid parity. For manufacturing companies, the integration of renewable generation plants at their own site therefore represents a promising strategy for being both technically independent of the electricity grid and autonomous of price policy decisions and volatile market prices. This paper outlines the existing decentralized, renewable power generation technologies, their energetic modeling, and a hybrid optimization methodology for their dimensioning that uses mixed integer linear programming (MILP) and linear programming (LP) problem formulation. Finally, the introduced dimensioning method is applied to an exemplary manufacturing company that is assumed to be in the central part of Germany and located in the metalworking sector. The company has an electricity demand of approximately 20,000 MWh/a. The optimization results in a maximum expansion of PV and the use of CHP to cover the base load leading to a promising energy cost reduction of almost 20%.
1. Introduction
In 2019, the European Commission introduced the ‘Green Deal’, which includes ambitious goals to enable Europe being carbon-neutral by 2050. An action plan and a draft for a European climate change law both address investments in new environmentally friendly technologies, supporting manufacturing industry in innovation and the energy sector in de-carbonization [1]. Reaching the environment goals, the energy supply system is heavily being transformed. In this dynamic area, climate change measures hold risks for manufacturing companies on a worldwide, European, or national scale, though they also may offer great opportunities for revolutionizing conventional approaches of energy supply.
On the one hand, the de-carbonization of the energy sector will result in a further expansion of renewable energies facing the existing energy system with rising challenges, e.g., concerning grid stability. The complexity of the system rises due to a greater amount of locally distributed energy generation from renewables that is hardly predictable and volatile. Therefore, prices for energy supply fluctuate, and the varying prices are partially transferred to the consumers [2]. Increasing incidental electricity costs as well as unclear governmental regulations are leading to a severe planning uncertainty for manufacturing companies [3]. Furthermore, the electricity price for industry is rising compared to the EU average and is particular high compared to the EU average especially within Germany (Figure 1).
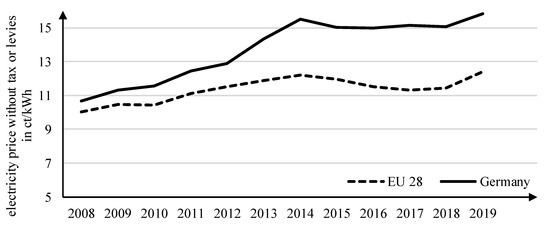
Figure 1.
Development of industrial electricity prices in cents per kWh for Germany and the EU 28, valid for 2000 MWh with a maximum consumption of 500 kW and an annual utilization of 4000 h, data according to [4].
On the other hand, the consumer demand for environmentally friendly products simultaneously rises [5] motivating manufacturing companies to strive for sustainable production. Additionally, the progressive development of decentralized, renewable generation technologies is leading to grid parity [6]. Governmental subsidies further support investments in renewable energy technologies and decentralized energy generation coupled with self-consumption.
Both the challenges and the opportunities described above can be faced by integrating renewable generation technologies in manufacturing companies. Partially supply independency, the use of renewable resources, as well as the reduction of emissions result in decisive competitive advantages for companies. Consequently, an approach for integrating renewable energy generation and self-consumption by applying energy-flexible production systems was developed [7]. In addition, decision-making support for companies considering such an investment is necessary. For manufacturing companies, this may offer the chance to reduce their energy costs, minimize outage costs, and increase turnover.
Figure 2 shows the steps in the procedure for integrating decentralized, renewable generation technologies into manufacturing companies detailed introduced in [8]. After the goal description, the company’s consumer analysis is necessary, both concluding in company-specific requirements. The second step of the procedure is the focus of this publication including a property description of decentralized, renewable generation technologies, an approach of modeling the technologies behavior and a method to dimension those considering company-specific circumstances. After dimensioning the generation technologies, the integration of the generation technology within the electro-technical micro-grid of the company is necessary. Finally, the demand response potential is utilized to apply operation strategies on the company’s energetic components to enable self-consumption.

Figure 2.
Approach for integrating renewable energy generation and self-consumption applying flexible production systems according to [8]; the focus of this publication is the selection and dimensioning of power generation technology.
This publication focuses on the selection and dimensioning of power generation technologies, which is the key step of the procedure for integrating renewable, decentralized generation technologies and essential to face the mentioned challenges and to take the introduced opportunities for manufacturing companies. Previous approaches mainly focus either on the design of whole energy systems (e.g., on regional level) or are concerned with the energy supply of single households showing very different circumstances compared with manufacturing companies. Based on the results of the comparison of different techniques, mixed-integer linear programming (MILP) optimization is applied for dimensioning the generation technologies.
In Section 2, the recent state of the art is outlined. The term of decentralized, renewable generation technologies used in this publication is defined, and the existing modeling and dimensioning approaches for these technologies are introduced. The mentioned research gap is elaborated in Section 3, and based on this, the applied methodology to develop the dimensioning method is introduced. The main results are described in Section 4. Herein, an overview of suitable technologies and their properties is given before describing the modeling approach of generation technologies. The dimensioning procedure applying mixed integer linear programming is introduced in the end of this section. The developed approach described in Section 4 is subsequently applied to an exemplary manufacturing company in Section 5 to prove the suitable applicability. Section 6 summarizes the procedure as well as the results and gives a short outlook.
2. Literature-Based Materials
This section provides a literature-based overview of the current state of the art regarding renewable generation technologies and their energetic modeling and further focuses on their dimensioning.
2.1. Decentralized, Renewable Generation Technologies
Renewable or regenerative energies are energy sources that are of inexhaustible supply within the human time horizon or that renew themselves relatively quickly [9]. In contrast, fossil energy sources are finite, or they can only regenerate over millions of years. According to the IREA [10], renewable energies include bioenergy (biomass potential), geothermal energy, hydropower, as well as ocean, solar, and wind energy. For using these energy sources, diverse generation technologies have been developed and novel power plants have been built recently.
The considered technologies must be sufficiently small and must not exceed a certain size to be used in manufacturing companies and to self-consume the energy. Therefore, decentralized technologies are taken into account. Decentralized energy generation is characterized by a much lower power output per unit compared to current generation of centralized and/or conventional power plants that feed into the public high-voltage grid. The maximum power output of decentralized generation technologies is generally below 10 MW [11]. Furthermore, decentralized technologies can be classified according to their grid connection level, which is mainly limited to the distribution grid level in the low voltage range (e.g., 0.4 kV in Germany) and rarely in the medium voltage range (e.g., 10 or 20 kV in Germany) [12].
Decentralized, renewable generation enables companies to become more independent and is a cost-effective alternative to purchasing energy. The decisive factor for the decision to operate such technologies is their grid parity. This means that the electricity production costs of renewable energies correspond to the average price paid. Grid parity is reached for many private consumers, what explains the high expansion of, e.g., small photovoltaic-systems. Due to the lower electricity costs for industrial consumers, this turning point for companies was reached after a longer development period. Therefore, the use of self-generated energy is now no longer (primarily) a decision for environmental reasons, but is based on economic considerations.
According to the German Chamber of Commerce and Industry [13], up to 43% of companies were operating their own generation technology in 2018, only a small proportion of these being manufacturing companies. In Figure 3a, the industry sectors with the largest share of self-supply in Germany are listed. Considering the share of self-generated energy sources (Figure 3b), those that are used to generate heat or thermal energy are mainly represented.
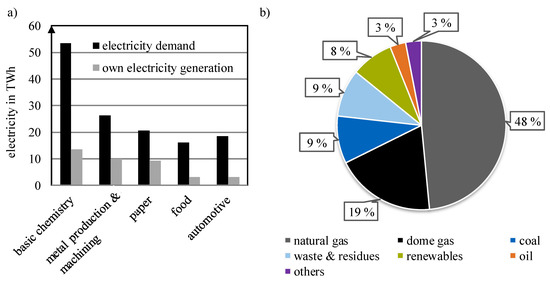
Figure 3.
(a) Self-generation by example sectors compared to the respective electricity consumption and (b) energy sources of self-generation; both figures are based on data of 2020 and are according to [14].
The dimensioning and operation of generation technologies within a manufacturing system requires their behavior modeling. Therefore, the following section gives an overview of the existing approaches, which are not specifically introduced for small generation technologies, but are also valid for big power plants and complex supply systems.
2.2. Modeling of Generation Technologies
Different modeling approaches for renewable generation technologies have been shown in literature to analyze, forecast, and finally adapt their load curve that is based on weather circumstances and consumer behavior. This section provides a representative overview of the methods and results found. In general, relevant approaches can be separated into stochastic modeling, where the focus is on the power generation forecast, and simulation-driven modeling, implementing a framework to simulate the current power generation of a renewable generation technology.
2.2.1. Stochastic Modeling Methods
When trying to predict the generation behavior of renewable power systems, one must deal with high uncertainties due to, e.g., fluctuating weather conditions. Data with high uncertainties should be handled carefully with stochastically methods, i.e., inferential statistics. A stochastic process is a mathematical model for a real process that is random and depends on parameters. The considered real process is time-dependent and usually cannot be predicted with certainty, which is why stochastic modeling is appropriate. To build up stochastic models, the probabilities with which the individual realizations occur have to be determined [15].
Talari et al. [16] gave an overview of stochastic modeling approaches to deal with these uncertainties by using stochastic dependencies and non-dependencies of random variables of weather parameters and thereby approximate the power generation output. However, their work focused on forecasting the generated power rather than on modeling with historical weather data. In a similar work, Chiacchio et al. [17] used the stochastic hybrid fault-tree-automaton to predict the deterministic and stochastic behavior of renewable energy plants. They applied this method to a sample photovoltaic plant. Mehrjerdi and Rakhshani [18] investigated the statistical influence of the timescale when modeling wind energy generation technologies. They concluded that shorter timescales led to more precise modeling results, but also to longer simulation runtimes. Besides using standard statistics for uncertainty handling in weather parameter prediction, machine-learning algorithms can be applied. A related study is presented by Würth et al. [19] and focused on minute-scale predictions of wind power generation. Kim et al. [20] has also covered the modeling of renewable energy systems using machine-learning approaches. While inspecting solar energy systems, they show a method for predicting the power generated by utilizing random forest regression models. The input data were collected from weather agencies and open databases. Sheng et al. [21] similarly used regression models to predict short-term solar power generation.
2.2.2. Simulation-Driven Modeling
The basis of simulation-driven modeling is a simulation environment that is either created or adopted from existing implementations. Compared to stochastic models, in simulation-driven models the weather parameters are known, deterministic, and can be passed on to the simulation. The modeled generation technologies are here understood as systems whose behavior is completely predictable based on the initial conditions and input signals. Meschede et al. [22] examined the influence of weather data in the simulation of hybrid wind–solar systems. Different probabilistic time series of weather parameters were used as input parameters for the simulation. The results showed a high variance of energy production for systems with a high share of wind energy. In a context-related study, Chirapongsananurak and Santoso [23] created a tool for the simulation of power distribution circuits incorporating generation technology models and electromechanical models, such as transformers and capacitors. Huber et al. [24] inspected grid load ramps in the context of renewable power generation systems. To model grid load ramps, they simulated the generation behavior of wind and photovoltaic power systems. As weather data collection, NASA’s database MERRA was used. The database includes data on wind speed and solar irradiance with a temporal resolution of hours and spatial resolution of 0.5° E/W and 0.66° N/S.
The introduced stochastic and simulation-driven approaches are representative examples for modeling the behavior of generation technologies to operate them in any kind of application. All approaches result in a modeled load curve of the regarded technology or a combination of them. Based on that, the selection and dimensioning of the generation technologies can be implemented.
2.3. Dimensioning of Generation Technology
To implement the sufficient generation technology or a combination of them, consumption-specific dimensioning of them is an important step for integration of renewable energy generation within manufacturing companies. Several approaches for dimensioning generation technologies have been addressed in the literature. This section outlines the underlying principal dimensioning methods, i.e., optimization methods. Based on this, several scientific publications are introduced that apply the optimization methods within the context of renewable power generation. In the final subsection, existing software tools are presented.
2.3.1. Main Optimization Methods
Many different approaches for optimizing the design of generation sites and energy systems are known. A consistent categorization of these methods based on their underlying principles is not always straightforward, as the characteristics can often be associated with different types of optimization methods. Nevertheless, the literature tries to classify the techniques in order to give an overview of the similarities and differences between them. Various review papers discuss this topic and give different categorizations: Luna-Rubio et al. [25] and Faccio et al. [26] were focused on the underlying principles of the methods, while Lian et al. [27] as well as Sinha and Chandel [28] considered their seniority. Abdmouleh et al. [29], Anoune et al. [30], as well as Al-falahi et al. [31] also examined the literature and came to similar conclusions. Essentially, distinguishing between graphical, probabilistic, analytical, and iterative approaches will be applied in this paper [25]. Additionally, new methods will be introduced to give an overview of the complete panel of potential ways to optimize energy systems.
For optimization problems with only two variables, an optimum can be identified by a visual representation of the objective function and the constraints, e.g., in a two-dimensional diagram [32]. Graphical approaches are distinguished by comparable simple and fast methods, but they barely correspond to the complexity of most of the problems [28].
For probabilistic approaches, only a few optimization variables are considered. Individual parameters like solar radiation or wind speed are not considered as fixed values, but are represented by a probability curve to incorporate the fluctuating nature of some renewable energies [33]. Accordingly, those approaches do not allow a dynamic consideration of the system and are therefore of limited suitability to ultimately explore an optimal solution [34].
Analytical methods built up a mathematical model of the energy system and search for an optimal point in the solution space. In linear programming (LP), all variables are floating-point numbers, which are restricted by linear equations [35]. With this method, the complexity of the modeled problem is limited. However, a potential global optimum can generally be determined through various matrix transformations. Extending the previous method, mixed-integer linear programming (MILP) is applied to represent decisions by introducing binary variables and thus creating a more realistic model [36]. This is associated with higher complexity and longer computing times due to a discontinuous solution space. Non-linear programming (NLP) is further employed to deal with complex physical relationships and results in even higher computing times than MILP. To simplify the optimization problem and thereby reduce the computational efforts, dynamic programming (DP) was introduced, along with separation into distinct sub-problems [35]. This approach is well suited to optimize the operation of controllable systems, because a division in similar sub-problems is easily implementable.
Iterative methods are based on a recursive optimization process until reaching a tear-off criterion [26]. The aim is to improve the objective function of the problem with each iteration. However, when using these methods, specific essential parameters for the design of the generation plants can be considered only to a limited extent due to a constrained complexity of the model. A high number of variables and complex equations increase the probability to reach insufficient local optima.
Established methods previously mentioned have been developed and widely used to optimize energy systems. With increasing computing power, new possibilities enable creating optimal hybrid power systems. Modern methods are often meta-heuristic methods that rely on an iterative approach. According to their rising practical relevance, the most common methods will be further outlined here but not explained in detail. Genetic algorithms (GA) use natural principles of evolution to check and improve the solutions and their potential after each calculation step [37]. Particle swarm optimization (PSO), e.g., applied from Kennedy and Eberhart [38], as well as ant colony optimization (ACO), e.g., shown by Dorigo et al. [39], are biologically inspired heuristic algorithms. The simulated annealing (SA) method is based on observations in material science. During the process of thermal annealing, atoms tend to find the minimum possible internal energy state at reduced temperature. The described process is adjusted by this method to find an optimal solution in a minimization problem [40]. The harmony search (HS) approach is inspired by a musician’s technique. The taboo search (TS) uses an internal memory to avoid the calculation of solutions already captured. The points in the solution space that are captured in the memory are no longer considered and regarded as taboos when searching for the optimum [29,41,42]. Artificial neuronal networks (ANN) imitate the human brain’s function and are applied to analyze, categorize, and recognize a wide variety of data. They are powerful tools for solving complex optimization problems, especially if no appropriate analytical solutions are available [43]. However, decision-making within a neuronal network is difficult to understand and clearly depends on the quality of the available data.
Hybrid processes combine some of the different methods mentioned above. The limitations and weaknesses of the individual optimization techniques can thus be overcome. These methods are especially suitable for optimization problems with multiple objectives [26]. When implemented well, the computation time can be reduced significantly and the quality of the results increases. The challenge when using hybrid methods is to achieve a good coordination and compatibility of the different techniques. A deep understanding of the system is necessary to enable the data transfer between the sub-areas of the optimization problem leading to local optima.
2.3.2. Existing Approaches of Application
After giving an overview of the different methods to optimize energy systems, this section focuses on relevant applications in literature. Many different configurations of hybrid systems may be economically viable, but problem-specific solution methods are required to achieve an improved composition of different types of energy sources. Many scientific publications deal with this problem, and due to the increasing computing power of computers and processors, new optimization approaches can be tested.
Classical methods are still widely used for dimensioning the generating plants and other components in energy systems. Tina and Gagliano [33] optimized a solar/wind power system with a probabilistic approach and focused on solar tracking devices to maximize the power output. Thereby, they showed that using a one-axis tracker, electricity generation could be significantly improved, which influences the optimal combination of generation technologies. Jacob et al. [32] proposed a graphical method for finding a cost-efficient balance of energy storage and photovoltaic (PV) modules in an off-grid system. Ming et al. [44] presented an optimization method based on dynamic programming for sizing a PV plant geographically close to an existing hydro power plant in China. The combination of both technologies (PV, hydro power plant) created synergies and increased the grid revenue of the energy system. Scheubel et al. [45] considered the heat supply in addition to electricity supply. The energy supply of industrial companies is optimized with MILP, and the following results show that the annual energy cost can be remarkably reduced. Thiem [36] introduced an approach of energy systems addressed by MILP including the thermal and electricity demand for different use cases. Optimized on-site generation reduced the total cost in all the considered scenarios. Atwa et al. [46] formulated the optimization problem with mixed integer non-linear programming (MINLP) to minimize the annual energy losses in a system with wind, PV, and biomass as the available technologies.
A variety of modern methods for solving similar problems arising for designing energy systems emerged and offered new possibilities for complex energy systems. Upadhyay and Sharma [47] used a particle swarm optimization to dimension an off-grid energy system in India with a small hydro plant, PV panels, a diesel generator, a battery energy storage system (BESS), and a biogas plant. The results show that in the case of the considered off-grid village, the optimal share of renewable energy to reduce the annual costs is above 90%. Ma et al. [48] also considered an autonomous system but with PV and pumped hydro storage. A double-objective optimization based on the GA method was implemented to reduce the cost of energy and the loss of load probability. To enhance the quality of the results, Zhang et al. [49] introduced a hybrid approach by combining modern methods like simulated annealing and harmony search. Lan et al. [50] combined PSO and GA to find the ideal size of a hybrid PV–diesel–battery system on a ship. To reduce the costs and the emissions, a multi-objective problem was formulated and an additional constraint of a mobile micro-grid was considered. Li et al. [51] suggested another hybrid optimization method, where the authors used MILP and GA to model different scenarios and find the best size for PV panels, as well as a hydrogen storage system and a BESS to minimize the annualized cost of the system.
Table 1 provides a selected overview of the relevant literature over the last decade with different applied methods to optimize energy systems. A wide range of optimization methods are used in the approaches, which unexceptionally pursue economic objectives. PV is considered in the overwhelming majority of publications, whereas CHP or fuel cells are barely included. Some of the analyzed manuscripts involve diesel generators instead. It is remarkable that there are hardly any publications in the field of industrial application. Most approaches are applied for residential use or considering the grid as an additional system element.

Table 1.
Overview of relevant literature over the last decade with different methods used to optimize energy systems.
2.3.3. Developed Software Solutions
The methods and approaches introduced in Section 2.3.1 and Section 2.3.2 are partially implemented in open-source or commercial software solutions with different optimization focuses (dimensioning or operation). Furthermore, the existing solutions can be distinguished in terms of their temporal resolution, technical depth, and system size. Table 2 summarizes the existing software solutions, including their distinctive features.
Table 2.
Overview of existing software solutions (✓ suitable | partially suitable | ✕ not suitable, + high | o medium | – low).
Balmorel is an open-source solution for designing energy systems. It focuses on the cogeneration of electricity and heat. A GAMS license is required to use this tool. The Berkley University developed DER-CAM, which optimizes both the dimensioning and operation of generation systems. The software is based on mixed integer programming, and the implemented simulation considers representative days to reduce the computing effort [36]. EnergyPlan designs generating plants based on hourly values and focuses on larger systems at a regional and national level. HOMER Pro is a widely used commercial tool with variable observation periods and time steps. With the aid of a simulation model, various scenarios are considered and evaluated in terms of their costs, emissions, and generation [29]. MARKAL is an IEA optimization tool for designing energy systems with linear programming. TIMES is its advanced version. It focuses on regional and national models. TOPEnergy is another commercial solution. It includes the consideration of industrial consumers, but is difficult to modify due to its protected source code. TRNSYS enables the generation and modeling of the system on a technical level and addresses the specific constraints of the generating plants. As a result, this software cannot model larger systems and it is computationally intensive [36]. The Technical University of Munich developed urbs, which applies a linear programming approach for the optimization of energy systems. The efficiency of individual systems under partial load cannot be calculated precisely with this tool, and decisions for or against an investment cannot be considered.
In conclusion, the observed literature in Section 2.3 deals with different optimization problems and uses different approaches for modeling and designing energy systems with renewable generation. In the following section, the need for research is outlined and the procedure in this paper is presented.
3. Need for Research and Methodology
The purpose of the study this paper is according to is the development of different supporting tools for manufacturing companies in order to facilitate the integration of renewable energies. On the one hand, this enables companies to save electricity costs, maintain planning security, and reduce their CO2-emissions. On the other hand, decentralized, renewable generation in combination with demand-controlled production behavior balances the local and temporal discrepancy between power generation and consumption, thus solving a major grid-specific problem arising with renewable generation. The supporting tools can be summarized in an approach for integrating renewable energy generation and self-consumption by applying flexible production systems (Figure 1). This paper aims to provide a tool for the selection, modeling, and dimensioning of generation technologies (step 2 in Figure 1).
Several techniques for modeling and dimensioning have been outlined in the previous literature sections. Only some of the available software solutions that are based on these techniques are freely accessible. It is noticeable that a wide range of mathematical methods have been developed and used for both modeling and design. In contrast to this wide range, the application area is mainly limited to problem solutions for complete energy systems on, e.g., regional level, considering grid operation problems. Consequently, many different actors and a large time step size are given in these approaches. Electricity demand and generation are treated at a rather aggregated level, and thus the considered power profiles tend to be less volatile. Furthermore, decentralized, small power plants were just partially taken into account.
Nowadays, decentralized and small generation technologies are mainly applied in households or to supply business and logistics buildings (non-residential use) due to their early reach of grid parity and governmental subsidies given in Germany. Therefore, the main part of the introduced methods are considering this application field being adapted to its specific challenges. Households are distinguished by low electricity and heat demand of a different composition than in manufacturing industry. Methods aligned with the specific requirements of manufacturing companies, which show a higher energy demand than households, are not yet given in literature. This high unexploited potential for improvement has to be utilized to finally achieve decarbonization.
Therefore, the integration of decentralized, renewable generation technologies within manufacturing systems is required by adaption of both methods applied in households and approaches used for large energy systems to industry surroundings, considering the specific requirements. In this paper, a methodology based on the investment decision and planning procedure was adapted and modified to the described problem. Friedemann [53] introduced a procedure of investment planning within the holistic investment process that covers several steps starting with the goal definition and finishing with the investment decision. Having defined the goal, the alternative search, the estimation and projection, as well as the evaluation lead to the final decision step. Figure 4 shows how the three methodological steps are applied to reach this study’s purpose. This paper investigates the properties of different decentralized and renewable generation technologies (Section 4.1). The described challenges and opportunities arising with the energy system change mentioned in Section 1 are mainly with focus on electricity generation. Therefore, electricity-generating technologies are mainly taken into account, introducing the dimensioning method. Heat and power combined power plants are also considered as electricity-operated technologies. Based on the technologies’ overview, their modeling is explained (Section 4.2). Using historical weather data, a method is introduced to model the generated power of different technologies. To integrate the technologies, their dimensioning is described in Section 4.3. The dimensioning procedure starts with a requirement-based decision for a suitable technology. In Section 5, the presented method is applied to an example manufacturing company.

Figure 4.
Applied methodology according to a procedure for investment planning.
4. Technologies for Renewable Energy Generation in Production Systems
4.1. Overview of Properties and Restrictions in Application
The definition for decentralized, renewable energy generation technologies (Section 2.1) differentiates technologies from central and larger power plants. The conclusive literature and product research outlines the described decentralized, renewable technologies in order to distinguish between the available technologies and to enable an adaption of their requirements for the implementation within production systems in the following steps.
The properties of decentralized, renewable technologies can be classified into technical, energetic, economic, and ecological aspects [54]:
- The technical aspects include properties to be assigned to the physical, facility-specific behavior of the technology.
- The energetic aspects are a subset of the technical aspects, as they describe the physical properties of the technology that specifically reflect the energetic behavior.
- The economic aspects relate technologies to business administration and economy.
- The ecological aspects address the sustainability of the technology.
In the following section, the most common properties of the mentioned categories are introduced. The technical aspects of decentralized power generation technologies are shown in Figure 5. For better readability, the properties of the pure electricity generators are shown on the right hand side, whereas the properties of CHP, fuel cell, and gas turbine are illustrated on the left hand side of Figure 5a. Comparing the illustrated properties, it is remarkable that coupled heat and power plants (CHP), fuel cells, gas turbines, as well as wind and hydropower plants cover a high range of different nominal power, whereas Photovoltaics (PV) tend to be in the lower range. Except for hydropower plants, the lifetime of the technologies is predominantly in the five- to 20-year range. High differences are determined considering full-load hours. Starting with gas turbines with up to 7000 h, PVs only show around 1000 h. The number of full-load hours might be traced back to the technologies’ weather dependency, since the mainly demand-driven operating technologies, i.e., CHP, gas turbine and fuel cell, show higher numbers of full-load hours than the weather-based technologies. A high number of full-load hours leads to a fast amortization of the investment costs of a power plant [54]. The space requirement is an important decision criterion for companies (Figure 5b). Suitable areas are undeveloped green/open spaces, unused roof areas, and reserve areas [55]. To enable comparability of all technologies, the land requirements are given in m2 per nominal output. In relation to the nominal power, PVs require by far the most space compared to the other technologies. The space requirements for hydropower plant and for fuel cells are very use case specific and therefore have not been considered.
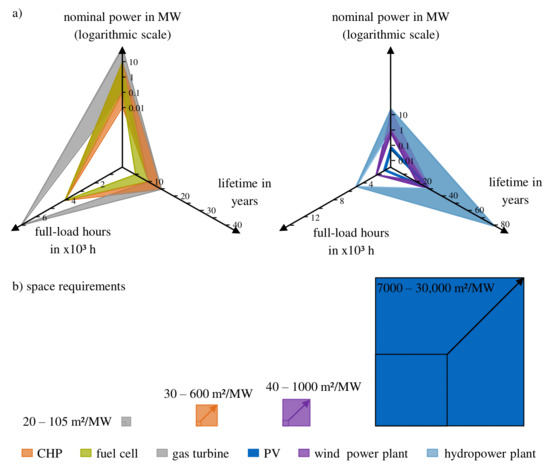
Figure 5.
Technical aspects of specific decentralized, renewable generation technologies according to [56,57,58,59,60,61,62].
An overview of the energetic aspects of the analyzed decentralized generation technologies is illustrated in Figure 6. The maximum output power of renewable generators depends either on meteorological conditions (weather dependent generators) or on the supply of renewable fuels (controllable generators). Their useful energy is electrical power or electrical and thermal power (Figure 6a). The volatility in supply is an important factor, especially in the case of self-consumption (Figure 6b). Photovoltaic electricity generation in Germany is very volatile throughout the year, as solar radiation varies between summer and winter months. In contrast, wind power generation shows the highest output in autumn and spring. Hydroelectric power generation peaks in spring when the discharge from rivers fed by the German low mountain ranges is high [58]. On a daily or hourly scale, the differences in electricity generation from wind power are higher than from PV plants, particularly during gusty wind conditions. The reason is the cubically proportional relationship between wind speed and output power. Consequently, slight changes in wind will have a strong influence on the power output [63]. Fluctuations in electricity generation can have an influence on the voltage quality of the industrial or public grid. The grid concerning properties are shown in Figure 6c. Schael et al. [64] introduced four different grid irregularities. Weather-dependent changes in the output power of renewable generators may thereby lead to overvoltages and undervoltages in the grid. Successive short-term voltage fluctuations are highly dependent on the grid impedance and may occur in the event of supply by non-regulated generators. Short-term environmental changes, e.g., during cloudy days or gusty wind conditions, are barely predictable and ultimately cause voltage fluctuations. Speed-controlled wind turbines, PV systems, and gas turbines with power electronic interface to the grid cause harmonics. When operating PV systems or wind turbines, supply interruptions must be expected. In conclusion, hydropower plants, CHP systems, fuel cells, or gas turbines exhibit fewer supply problems than PV plants and wind power plants. Industrial grids require a high level of supply quality so that they neither endanger the production process within the factory nor damage electronic components. Additional elements such as storage and control systems may eliminate large parts of the disturbances [65]. The distinct technology efficiencies is illustrated in Figure 6d. Gas turbines and hydropower plants show the highest efficiencies, while PV efficiency is the lowest one. Thermal efficiencies of fuel cells were not considered due to lacking database.
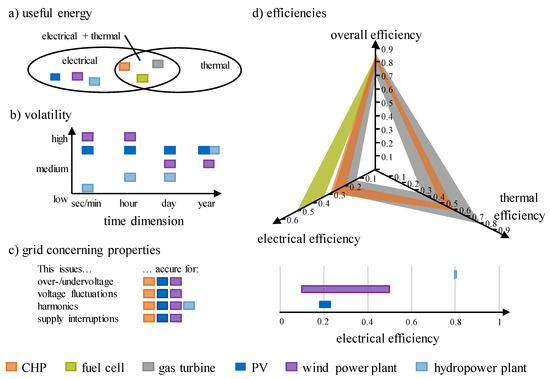
Figure 6.
Energetic aspects of specific decentralized, renewable generation technologies according to [58,66,67,68,69,70,71].
Figure 7 shows the economic and ecological aspects of decentralized, renewable generation technologies. The investment costs reflect the total costs for the acquisition and installation of a generation system. Whereas hydropower plants bear comparably high investment costs, the investment costs of the other technologies are all in a similarly low range. The levelized costs of electricity (LCOE) overall cover appearing investment and operating costs according a calculation from Fraunhofer ISE [72]. The LCOE in literature ranges from ca. 5 to 23 cent per kWh for the technologies analyzed. The energy amortization describes the time that is required to recover the energy consumed in the construction and installation of the plant. The payback period (amortization time) indicates the timespan during which revenues generated within the energy system cover the acquisition costs [73]. The building regulations strongly differ between the technologies. While PV systems are subject to low levels of restriction, the installation of a hydropower or a wind power plant is more complex and needs expertise in construction law.
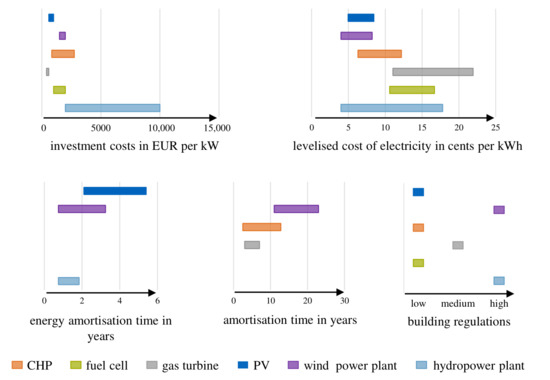
Figure 7.
Economic and ecological aspects of specific decentralized, renewable generation technologies according to [9,57,58,72,74,75,76,77,78,79,80].
4.2. Modeling of Generation Behavior
To analyze both the technical and energetic aspects of a generation technology at a detailed level, a simulation-driven model is selected (Section 2.2). The load profile of several generation technologies is built up using historical weather data in combination with physical correlations of the specific technologies. Generation technologies like CPH, gas turbines, or fuel cells are demand-driven. Therefore, the power output results from the electricity demand and must not be determined with a simulation-based model.
4.2.1. Data Collection and Pre-Processing
The power output of photovoltaics, wind turbines, and hydropower plants is highly dependent on local weather conditions and seasons. Therefore, data on wind speed, solar radiation, temperature, and river drain are necessary. Free-to-access meteorological databases are collected in distributed weather stations. The data differ in update frequency and sample period. Both are two decisive parameters considering model precision [18].
To achieve a higher accuracy, the weather data samples must be adapted to the location of the generation technology. For this purpose, the weather parameters of the closest weather stations are adjusted to the company’s coordinates by a distance-weighted sum of the weather parameters of each weather station. Preliminary calculations showed that the weather conditions at the company’s location could be determined accurately enough using the three closest weather stations. Before the weather data are integrated into the calculation, missing or outlining entries are replaced by the mean value of the two neighboring entries.
4.2.2. Model Setup
To model the generation behavior of PV systems, Equation (1) is applied with as nominal power and as the power under standard test conditions. The actual solar irradiance in kW/m2 is related to the solar irradiance under standard test conditions in kW/m2. The efficiency of PV systems is decreasing by the temperature loss , the wire loss , the dirt loss and losses due to production tolerances . The formula and values are based on Quaschning [9], Reich & Reppich [54], Synwoldt [67], and Zainuddin et al. [81].
Equation (2) describes the power output of a wind turbine considering as the Betz factor, as the rotor area in m2, and as the density of air in kg/m³ according to Quaschning [9] and Carillo et al. [82]. The wind speed is denoted in m/s and is limited by the cut-in wind speed and the cut-out wind speed .
Hydropower turbines are modeled considering Equation (3) with the hydropower plant output , the turbine’s efficiency , the gravity , the density of water the flow rate and the drop height of the turbine [9].
Generation technologies like CPH, gas turbines, or fuel cells are demand-driven. Therefore, the power output results from the electricity demand and must not be determined with a simulation-based model.
4.3. Dimensioning of Generation Technologies
Following the description (Section 4.1) and the modeling (Section 4.2), the next step is the dimensioning of decentralized, renewable power generation technologies.
4.3.1. Requirements for Dimensioning Generation Technologies with Regard to On-Site Generation
The following requirements must be fulfilled selecting a suitable method (Section 2.3) for dimensioning the generation technologies integrated in manufacturing systems:
- The generation technologies must be modeled with highly accurate optimization results and with reasonable computational effort.
- The optimization method must be able to represent long-term periods (up to one year) with short time intervals (in the range of minutes).
- The implementation of technological restrictions in the dimensioning and the operation of the generation technologies should include economic correlations (including scaling effects).
- It must be possible to implement interfaces to an existing program for operation strategies.
Table 3 summarizes the properties of the methods based on the in Section 2.3 mentioned literature. The technical depth indicates the potential complexity of the energy system that can be mapped with this methodology. The computational effort is used to evaluate how long the solution calculation would take. The complexity of implementation compares the difficulty of building a simulation with using this method. The final aspect shows whether a method achieves the global optimum in the solution space or whether it is limited to identifying local optima.
Table 3.
Properties of the optimization methods (+ high, o medium, - low).
In the evaluation, hybrid methods are not listed separately, as their properties depend on a combination of the single optimization methods. In principle, they are technically more complex, but may therefore compensate for the weaknesses of individual methods and thus achieve better results.
After the careful evaluation of these optimization methods, none of the methods met all the requirements for the design of decentralized generation plants. Applying iterative methods, the disadvantage of computing a local optimum instead of a global optimum is given, reducing the significance of the results. In contrast, analytical methods show the advantage of systematically proceeding and sequentially exploring the solution space, which lead to global optima. Using analytical methods, the high computing time for many variables that are necessary for dimensioning is an obstacle.
Therefore, a hybrid method is used to optimize decentralized generation technologies. Advantages of both linear and mixed-integer programming are therefore exploited to better meet the simulation requirements. The optimization problem is divided into sub-problems to benefit from the strengths of each technique: LP allows a large time to be considered at a low computational cost and the global optimum to be identified. The use of MILP allows the system to be technically mapped to important constraints and relationships.
4.3.2. Dimensioning On-Site Power Generation Using Linear Programming and Mixed-Integer Linear Programming
To dimension the decentralized generation plants, the optimization problem is split into three sub-problems, thereby reducing the complexity and thus the computing time. In the first step, the size of the plants is determined followed by a plausibility check. Secondly, electricity purchases and sales are screened in detail and their total costs are calculated. Thirdly, the use of the storage facilities is improved without causing any additional costs, making storage processes realistically possible. The introduce optimization procedure was derived from literature approaches (for example [45,83,84]) and further adapted and extended considering manufacturing-specific circumstances. MathWorks MATLAB R2020b was used for the implementation of the optimization problem.
In the first step, the generating units are optimized using MILP. Several objectives are relevant regarding a companies’ electricity procurement:
- reduction of peak loads to cut the demand rate
- reducing the total amount of purchased electricity to lower the energy unit price
- ensuring a highly reliable electricity supply to permit the uninterrupted operation of production facilities
- collecting additional revenues by participating in the energy market and selling electricity or providing energy system services (balancing power)
- lessening greenhouse gas emissions
- further company-specific targets
The focus of this dimensioning methodology lies on the economic dimension, as most corporate decisions are based on the economic viability of investment projects. Due to the consideration over a long-term period, statements about the short-term quality of the supply are impossible and are therefore not included in the objective. Greenhouse gas emissions are also not included in the cost functions, but can be calculated subsequently using the optimized parameters. Under these conditions, the following objective function results, which needs to be minimized.
where describes the objective function to be minimized for the MILP problem in €, denotes the cost of the electricity generation in €, the fuel costs in €, the costs of the electricity purchase in the first optimization step in €, the cost of the grid connection in the first optimization step, and the burden due to the Erneuerbare-Energien-Gesetz (EEG)-surcharge in €. describes the revenue from the sale of electricity in € in the first optimization step.
When inspecting the generation costs, the capacity of each generation technology and the cost of production need to be considered:
with denoting the installed capacity per technology and development stage in kW and the cost per capacity per technology and development stage .
When looking at the fuel costs, the power supplied for fuel-based generation technologies, the specific fuel costs, and the duration of each time step are considered:
Note that denotes the power supplied by a fuel-based generation technology at the timestep in kW. The factor describes the duration of a time step in h and is used for the following costs, while are the specific fuel costs in €/kWh.
The costs for purchasing of electricity power can be calculated as follows
describes the power purchased on the electricity market at the time step for the first optimization step in kW, whereas is the working price of the electricity tariff in €/kWh.
When considering grid costs, the relation between purchased power and electricity power of the supplier is used
where denotes the electricity price of the supplier in €/kW.
The EEG surcharge costs consist of the normed power of a generation technology and the specific costs of EEG-surcharge [85]:
with denoting the normalized power of the generation technology at time step and the specific costs of the EEG surcharge in €/kWh.
The last part of the objective function consists of the revenue streams from electricity sales, which can be expressed as:
where is the electricity feed-in tariff in €/kWh, and the power sold on the electricity market at the time step in the first optimization step in kW.
The fixed electricity generation costs are composed of the additional capacity of generating plants and their specific costs per installed capacity. These two values are multiplied for all the technologies. In the formula, the indices and denote the different types of technologies and expansion stages of the plant. The fuel costs for operating a CHP, a gas turbine, or a fuel cell are considered as variable parts of the electricity generation costs that must be added to the objective function. One component of the electricity costs is the energy unit price, which is contractually agreed by the electricity supplier and the consumer and relates to the amount of energy drawn from the electricity grid. Another component is the company’s expenditure on the grid connection. This depends on the purchase peak and the demand rate. Surplus electricity produced by the generating plants can be sold on the electricity market and thus reduces the total costs of the system. In Germany, the EEG fee must be paid proportionately to the self-generated electricity.
In order to define the solution area of the optimization problem, the individual parameters must be limited by conditions.
The generation technologies are categorized into different expansion stages, since costs depend largely on size. The value of a technology’s installed capacity must lie between the upper and lower limits. Moreover, only one expansion stage is possible for each technology. At any given time, the fuel-supplied technologies can only provide as much power as their installation limits allow.
At any time t, the energy flow into the system must correspond to the energy flow out of the system. The following equation results:
The characteristics of the company’s storages with their efficiency and during charging and discharging respectively must be taken into consideration. At any given time , the state of charge (SOC) must lie between the upper and the lower limit. In addition, the difference between two consecutive SOCs divided the duration of a time step must be between the maximum charging and discharging capacity of the storage multiplied by their according efficiency. These values can be constant or time-dependent.
The optimization problem is partially addressed by using a MILP algorithm. However, the results, especially the integers, are always an approximation. After the first optimization step, the optimization variables are therefore checked for plausibility and purged of unrealizable values by an implemented smoothing algorithm. The plausibility check is particularly relevant for the fuel-supplied technologies. Such technologies are usually designed for continuous operation. In practice, a sudden drop or increase in output is technically restricted. Therefore, the resulting power output of these technologies from the first optimization step is smoothed to avoid any unrealistic operations. This step of data correction in terms of plausibility has been separated intentionally from the MILP problem to significantly reduce the computation time.
The costs of electricity purchases and the revenues from electricity sales need to be calculated in the second step of the optimization. Specifically, the sum of the electricity purchases and the electricity sales, as well as the electricity purchase peak, need to be calculated. Since no decision variables are needed in this part of the optimization, a timesaving linear programming (LP) formulation can be used.
The following objective function was formulated for the second step in the optimization:
The boundary conditions of the second optimization problem change only slightly compared to the MILP problem. The power equation (Equation (14)) and the storage constraint (Equations (15) and (16)) must still be fulfilled for each time point.
The third step of the simulation is carried out to depict a realistic scenario in terms of storage utilization. The storage operation costs have not been considered yet, resulting in unrealistic (dis-)charging behavior. To prevent this, imputed costs for the storage are introduced without changing the actual total costs for the company. The goal is to achieve the lowest possible injections and withdrawals from the storage facilities and to smooth the course of the load drawn from the storage facilities over time. This is to avoid any unnecessary charging and discharging of the storage facilities.
5. Exemplary Application
5.1. Description of the Use Case
An exemplary manufacturing company located in the central part of Germany is considered for the application of the methodology. Nevertheless, all the information is based on data from different real manufacturing sites. The model company is located in the metalworking sector and has the following production segments: primary forming (forge, deep drawing), machining, welding, hardening, and austenitizing processes as well as assembly. The annual electricity demand of the manufacturing site is 19,379 MWh. The employees work in a two-shift model from 6 a.m. to 10 p.m. (six days a week) with a capacity utilization of 80%. Presumably, 20% of the power can be considered as flexible energy demand. The integration of CHP, PV, wind, or hydropower plants is of great interest to the company. A space of approximately 25,000 m2 is available for on-site power generation in total using roof top areas as well as free areas on the company site. The company’s electricity unit price is 0.15 €/kWh and the demand rate is 100 €/kW/a.
5.2. Model Parametrization
The available area as well as the location of the manufacturing site are decisive for the generation technologies’ parametrization. Table 4 gives an overview of the literature-based assumptions used in the model.
Table 4.
Assumptions for the generation technologies considered.
Based on data from the German Federal Network Agency, the remuneration for supplying to the grid is assumed to be 8 cents per kWh as an average of technology-specific supply remunerations. The EEG supplement is assumed to be 2.7 cents per kWh.
In order to carry out the simulation, the period and the resolution must be determined. A longer observation period or a higher frequency of time steps within the simulation significantly increases the computing time. In contrast, a longer time horizon and a higher resolution allow the system behavior to be mapped more accurately. These values must therefore be chosen carefully to represent all the properties of the energy system without disproportionately increasing the complexity of the calculation and thus the computing time.
A period of one year is considered for dimensioning the generation technologies for this exemplary use case to take the volatility of renewable power generation into account. Choosing this period means that any irregularities in energy demand may be included, e.g., public holidays or other production downtimes.
In the energy industry, a quarter-hourly basis is the usual billing period for balancing groups [90]. Therefore, the quarter-hourly basis is used to perform a fine-grained analysis. However, applying this step size leads to the exclusion of small storage capacities within the manufacturing system.
5.3. Results for the Exemplary Use Case
The optimization results in an optimal solution (minimum) that satisfy the constraints of absolute gap tolerance (between upper and lower bound) of 0 and an integer tolerance of .
For the exemplary manufacturing company, the dimensioning of the generation technologies shown in Figure 8 is cost minimizing according to the optimization method (Section 4.3). PV is being expanded to 5 MW that corresponds to the maximum of installation capacity limited by the available area. When wind power plants are considered, the optimization results in approximately 4.2 MW. The expansion is not maximized (as for PV system), but is designed specifically for the location and the company. Hydropower should not be installed under the considered conditions. The costs for this technology are comparatively high, and the load profile is not demand-driven. Since a CHP unit has a controllable power output, no general generator load profile can be assumed, though it must be optimized. The CHP unit is dimensioned in a size of approximately 1.2 MW.
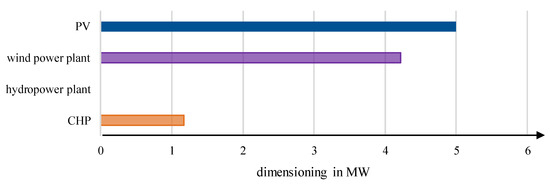
Figure 8.
Dimensioning results for the manufacturing company optimized.
Figure 9 shows the power profiles of a representative summer week (Figure 9a) and winter week (Figure 9b).
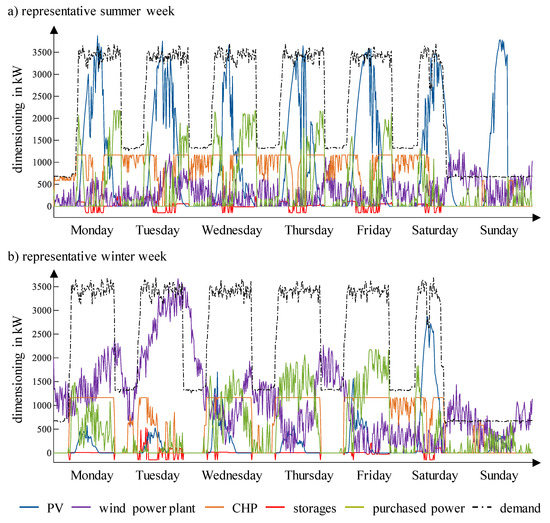
Figure 9.
Power profile of a representative (a) summer week and (b) winter week.
Over the whole year, the demand is at high level during the working hours and days of the manufacturing company. Outside working hours, a base load remains, which is higher during the night than during the weekend. In summer, the expected course of the PV system with a high noon peak and no generation during the night appears, whereas the noon peaks in winter are very low. The wind power generation is much higher in winter than in summer. Comparing the CHP load curves, the operation in winter is clearly more constant in the range of the installed power. In summer, the CHP is operated more variably. The storages are charged during the midday in summer, whereas in winter, the storage behavior is less regular. The company needs to purchase electricity from the grid during the working hours that are not within the PV noon peak in summer. In winter, purchasing is mainly dependent on the wind power generation.
To evaluate the self-supply of the designed system, two different indicators were calculated. The self-consumption (Figure 10b) indicates how much of the self-generated electricity is self-consumed, while self-covering (Figure 10a) indicates what proportion of the power demand is covered by own electricity generation. In case of the exemplary manufacturing company, the self-covering amounts to 93.7%, whereas the self-consumption results in 86.4%.

Figure 10.
(a) self-covering and (b) self-consumption of the optimal designed system.
Overall, the use of generator plants for electricity self-supply can reduce the average electricity costs and considerably save a company’s expenditure. When using data acquired for an exemplary manufacturing company, it could be shown that the average electricity costs are 13.5 cent per kWh. This reflects a reduction of up to 20% compared to the optimized systems’ electricity cost with the current grid supply.
5.4. Conculsion Regrading the Exemplary Use Case
The dimensioning results obtained for the exemplary manufacturing company can be interpreted regarding the different technologies.
The results underline that photovoltaics are very well suited for the self-generation of electricity due to the specific load profile and the relatively low costs. The generation load peak is around midday and usually coincides with the company’s consumption load peak. In larger plants, a further increase in economic efficiency is expected due to economies of scale. Even if the resulting expansion of the wind turbine is high, in practice, the potential of wind power plants for self-generation can only be realized with a significantly higher effort than photovoltaics due to the higher requirements. The numbers for installed capacity in Germany between 2018 and 2019, with 3835 MW of photovoltaics and only 886 MW of onshore wind power, reflect this difficulty [91]. The hydropower plant is not useful for the exemplary company. In this work, the annual costs per installed unit capacity are calculated based on the electricity production costs and used for the design. Hydropower plants are investment projects for long-term periods of up to 60 years [92]. In the studies cited above, a project duration of 20 years is used to ensure comparability with photovoltaic and wind power projects. At the end of the observation period, a low residual value of the plant is assumed. The high initial investment is related to less electricity generated, and thus the electricity production costs are assumed very high. As new constructions, hydropower plants are therefore not considered suitable for self-generation. The expansion of CHP as a baseload power plant is recommended. Nevertheless, a high level of abstraction is used to include this type of generator in the simulation. Individual technological limitations, such as start-up time, are not considered in this work. The real load profile of the CHP is therefore not represented and is instead approximated.
In addition to the conclusions regarding the technologies, the results for the exemplary manufacturing company can be compared with results from the literature. In general, the combination of a baseload generation technology and a variable power generator is represented in many publications (e.g., Ani [93], Malheiro et al. [94], Mandal et al. [95], and Zhao et al. [96]). However, in most publications, a diesel generator is used and not a renewable generator.
Regarding the cost reductions compared to a system without self-generation comparatively higher savings could be achieved, applying the introduced dimensioning approach. Ani [93] presented a much smaller energy system for non-residual use. The results show a reduction of approximately 15% comparing the proposed hybrid PV-wind-diesel system with an existing “diesel-only” system. Gonzales et al. [97] show very high cost reductions with 34.5%. The higher reduction can be explained due to the longer optimization period of 20 years and the assumed 3% annual increase in electricity prices. Scheubel et al. [45] addressed an industrial use case. On average, the optimization results show a cost reduction of 8.3%. Compared to the approach introduced here, their calculations are not based on LCOE but on own assumptions and projections. Furthermore, they do not gradually adjust the generation costs and thus do not consider economies of scale as it is applied in this approach (Table 4, Equation (11)).
In most cases, the comparison of results has only low informative value, because the cost reduction as well as other evaluating parameters strongly depend on the used optimization method in combination with the application example and assumptions made.
6. Summary and Outlook
Energy supply and electricity generation have recently changed significantly, thereby increasing the share of renewable energies in the overall energy mix. As a direct consequence, fluctuating inputs from photovoltaics and wind power generator multiply the system’s complexity. Economies of scale and technological progress resulted in falling electricity production costs for decentralized, renewable technologies. Given this developments, the focus will transfer towards the self-generation of electricity with decentralized power plants.
This paper investigated combinations of generation plants and their suitability for industrial companies. For this purpose, the characteristics of the different technologies and their potential modeling were described. To solve the dimensioning problem, different optimization approaches were analyzed in order to select one based on their adaptability to system requirements. The use of a mixed integer linear programming optimization enabled the interplay between production, generation plants, and the grid to be mapped using a mathematical model. An exemplary application of the optimization model highlighted a remarkable potential cost reduction of up to 20%.
The model developed can be used for further analyses, e.g., to analyze the company’s participation in the balancing energy market. A new field of activity arises for companies to increase their profit due to high electricity purchase costs. If they can flexibly switch on and off loads, they technically can participate in the balancing energy market. In Germany, aggregators bundle the flexibility of individual consumers or generators to create a virtual power plant and trade on the energy market [98]. This work has not considered these additional revenue opportunities. They can be added in a later stage to provide a holistic view of the energy system.
Author Contributions
Conceptualization: J.S.; formal analysis: J.S. and D.L.; investigation: D.L. and A.M.; data curation: J.S.; Writing—Original draft preparation: J.S., D.L., and A.M.; Writing—Review and editing: J.S., D.L., A.M., and M.F.Z.; visualization: J.S.; supervision: M.F.Z.; project administration: J.S. All authors have read and agreed to the published version of the manuscript.
Funding
This research was funded by the German Federal Ministry of Education and Research (BMBF), grant number 03SFK3E1-2. The APC was funded by the Technical University of Munich.
Institutional Review Board Statement
Not applicable.
Informed Consent Statement
Not applicable.
Data Availability Statement
Not applicable.
Acknowledgments
The authors gratefully acknowledge the financial support of the Kopernikus-project SynErgie by the Federal Ministry of Education and Research (BMBF) and the project supervision by the project management organization Projektträger Jülich.
Conflicts of Interest
The authors declare no conflict of interest.
References
- European Commission. Communication from the Commission to the European Parliament, the European Council, the Council, the European Economic and Social Committee and the Committee of the Regions: The European Green Deal. 2019. Available online: https://eur-lex.europa.eu/legal-content/EN/TXT/HTML/?uri=CELEX:52019DC0640&from=EN (accessed on 23 December 2020).
- AGORA Energiewende. Die Energiewende im Stromsektor: Stand der Dinge 2019: Rückblick auf die Wesentlichen Entwicklungen sowie Ausblick auf 2020. 2020. Available online: https://static.agora-energiewende.de/fileadmin/Projekte/2019/Jahresauswertung_2019/171_A-EW_Jahresauswertung_2019_WEB.pdf (accessed on 23 December 2020).
- Buhl, H.U.; Fridgen, G.; Körner, M.-F.; Michaelis, A.; Rägo, V.; Schöpf, M.; Schott, P.; Sitzmann, A. Ausgangsbedingungen für die Vermarktung von Nachfrageflexibilität: Status-quo-Analyse und Metastudie. 2019. Available online: https://www.econstor.eu/bitstream/10419/203143/1/1672807395.pdf (accessed on 23 December 2020). [CrossRef]
- Deutsches Bundesministerium für Wirtschaft und Energie. Internationaler Energiepreisvergleich für Industrie: Erdgas und Elektrizität. 2020. Available online: https://www.bmwi.de/Redaktion/DE/Binaer/Energiedaten/Energiepreise-und-Energiekosten/energiedaten-energiepreise-4-xls.xlsx?__blob=publicationFile&v=33 (accessed on 23 December 2020).
- Umweltbundesamt. “Grüne” Produkte: Marktzahlen. 2020. Available online: https://www.umweltbundesamt.de/daten/private-haushalte-konsum/konsum-produkte/gruene-produkte-marktzahlen#umsatz-mit-grunen-produkten (accessed on 23 December 2020).
- Gerlach, A.; Werner, C.; Breyer, C. Impact of Financing Cost on Global Grid-Parity Dynamics till 2030. In Proceedings of the 29th EU PVSEC, Amsterdam, The Netherlands, 22–26 September 2014. [Google Scholar]
- Schulz, J.; Scharmer, V.M.; Zaeh, M.F. Energy self-sufficient manufacturing systems—Integration of renewable and decentralized energy generation systems. Procedia Manuf. 2020, 43, 40–47. [Google Scholar] [CrossRef]
- Schulz, J.; Rosenberg, F.; Scharmer, V.M.; Zaeh, M.F. Characterization of Energy Consumers in Production Systems with Renewable On-Site Power Generation. IFIP Adv. Inf. Commun. Technol. 2020, 591, 19–27. [Google Scholar] [CrossRef]
- Quaschning, V. Regenerative Energiesysteme: Technologie—Berechnung—Klimaschutz; 10., Aktualisierte und Erweiterte Auflage; Hanser: München, Germany, 2019; ISBN 9783446461130. [Google Scholar]
- International Renewable Energy Agency. Tranforming the Energy System: And Holding the Line on Rising Global Temperatures. 2019. Available online: https://www.irena.org/-/media/Files/IRENA/Agency/Publication/2019/Sep/IRENA_Transforming_the_energy_system_2019.pdf (accessed on 23 December 2020).
- Patrao, I.; Figueres, E.; Garcerá, G.; González-Medina, R. Microgrid architectures for low voltage distributed generation. Renew. Sustain. Energy Rev. 2015, 43, 415–424. [Google Scholar] [CrossRef]
- Energietechnische Gesellschaft im VDE. VDE-Studie: Dezentrale Energieversorgung 2020. 2007. Available online: https://www.vde.com/resource/blob/792808/db366b86af491989fcd2c6ba6c6f21ad/etg-studie-dezentrale-energieversorgung2020-komplette-studie-data.pdf (accessed on 23 December 2020).
- Deutscher Industrie- und Handelskammertag. IHK-Energiewende-Barometer 2018—Fakten, Trends, Forderungen; IHK: Berlin, Brüssel, 2018; ISBN 2196-9876. [Google Scholar]
- Bons, M.; Creutzburg, P.; Schlemme, J. Energiewende in der Industrie: Potentiale und Wechselwirkungen mit dem Energiesektor; Navigant Energy Germany GmbH: Berlin, Germany, 2020. [Google Scholar]
- Waldmann, K.-H.; Stocker, U.M. Stochastische Modelle; Springer: Berlin/Heidelberg, Germany, 2004. [Google Scholar]
- Talari, S.; Shafie-khah, M.; Osório, G.J.; Aghaei, J.; Catalão, J.P.S. Stochastic modelling of renewable energy sources from operators’ point-of-view: A survey. Renew. Sustain. Energy Rev. 2018, 81, 1953–1965. [Google Scholar] [CrossRef]
- Chiacchio, F.; D’Urso, D.; Famoso, F.; Brusca, S.; Aizpurua, J.I.; Catterson, V.M. On the use of dynamic reliability for an accurate modelling of renewable power plants. Energy 2018, 151, 605–621. [Google Scholar] [CrossRef]
- Mehrjerdi, H.; Rakhshani, E. Correlation of multiple time-scale and uncertainty modelling for renewable energy-load profiles in wind powered system. J. Clean. Prod. 2019, 236, 117644. [Google Scholar] [CrossRef]
- Würth, I.; Valldecabres, L.; Simon, E.; Möhrlen, C.; Uzunoğlu, B.; Gilbert, C.; Giebel, G.; Schlipf, D.; Kaifel, A. Minute-Scale Forecasting of Wind Power—Results from the Collaborative Workshop of IEA Wind Task 32 and 36. Energies 2019, 12, 712. [Google Scholar] [CrossRef]
- Kim, S.-G.; Jung, J.-Y.; Sim, M. A Two-Step Approach to Solar Power Generation Prediction Based on Weather Data Using Machine Learning. Sustainability 2019, 11, 1501. [Google Scholar] [CrossRef]
- Sheng, H.; Xiao, J.; Cheng, Y.; Ni, Q.; Wang, S. Short-Term Solar Power Forecasting Based on Weighted Gaussian Process Regression. IEEE Trans. Ind. Electron. 2018, 65, 300–308. [Google Scholar] [CrossRef]
- Meschede, H.; Hesselbach, J.; Child, M.; Breyer, C. On the impact of probabilistic weather data on the economically optimal design of renewable energy systems—A case study on La Gomera island. International Journal of Sustainable Energy Planning and Management. Int. J. Sustain. Energy Plan. Manag. 2019, 23. [Google Scholar] [CrossRef]
- Chirapongsananurak, P.; Santoso, S. Multi-Time-Scale Simulation Tool for Renewable Energy Integration Analysis in Distribution Circuits. Inventions 2017, 2, 7. [Google Scholar] [CrossRef]
- Huber, M.; Dimkova, D.; Hamacher, T. Integration of wind and solar power in Europe: Assessment of flexibility requirements. Energy 2014, 69, 236–246. [Google Scholar] [CrossRef]
- Luna-Rubio, R.; Trejo-Perea, M.; Vargas-Vázquez, D.; Ríos-Moreno, G.J. Optimal sizing of renewable hybrids energy systems: A review of methodologies. Sol. Energy 2012, 86, 1077–1088. [Google Scholar] [CrossRef]
- Faccio, M.; Gamberi, M.; Bortolini, M.; Nedaei, M. State-of-art review of the optimization methods to design the configuration of hybrid renewable energy systems (HRESs). Front. Energy 2018, 12, 591–622. [Google Scholar] [CrossRef]
- Lian, J.; Zhang, Y.; Ma, C.; Yang, Y.; Chaima, E. A review on recent sizing methodologies of hybrid renewable energy systems. Energy Convers. Manag. 2019, 199, 112027. [Google Scholar] [CrossRef]
- Sinha, S.; Chandel, S.S. Review of recent trends in optimization techniques for solar photovoltaic–wind based hybrid energy systems. Renew. Sustain. Energy Rev. 2015, 50, 755–769. [Google Scholar] [CrossRef]
- Abdmouleh, Z.; Gastli, A.; Ben-Brahim, L.; Haouari, M.; Al-Emadi, N.A. Review of optimization techniques applied for the integration of distributed generation from renewable energy sources. Renew. Energy 2017, 113, 266–280. [Google Scholar] [CrossRef]
- Anoune, K.; Bouya, M.; Astito, A.; Abdellah, A.B. Sizing methods and optimization techniques for PV-wind based hybrid renewable energy system: A review. Renew. Sustain. Energy Rev. 2018, 93, 652–673. [Google Scholar] [CrossRef]
- Al-falahi, M.D.A.; Jayasinghe, S.D.G.; Enshaei, H. A review on recent size optimization methodologies for standalone solar and wind hybrid renewable energy system. Energy Convers. Manag. 2017, 143, 252–274. [Google Scholar] [CrossRef]
- Jacob, A.S.; Banerjee, R.; Ghosh, P.C. Sizing of hybrid energy storage system for a PV based microgrid through design space approach. Appl. Energy 2018, 212, 640–653. [Google Scholar] [CrossRef]
- Tina, G.M.; Gagliano, S. Probabilistic modelling of hybrid solar/wind power system with solar tracking system. Renew. Energy 2011, 36, 1719–1727. [Google Scholar] [CrossRef]
- Chauhan, A.; Saini, R.P. A review on Integrated Renewable Energy System based power generation for stand-alone applications: Configurations, storage options, sizing methodologies and control. Renew. Sustain. Energy Rev. 2014, 38, 99–120. [Google Scholar] [CrossRef]
- Bradley, S.P.; Hax, A.C.; Magnanti, T.L. Applied Mathematical Programming; Addison-Wesley: Reading, MA, USA, 1977; ISBN 978-0201004649. [Google Scholar]
- Thiem, S. Multi-Modal On-Site Energy Systems: Development and Application of a Superstructure-Based Optimization Method for Energy System Design under Consideration of Part-Load Efficiencies; Technical University of Munich: Munich, Germany, 2017. [Google Scholar]
- Biethahn, J.; Hönerloh, A.; Kuhl, J.; Leisewitz, M.-C.; Nissen, V.; Tietze, M. Betriebswirtschaftliche Anwendungen des Soft Computing; Vieweg+Teubner Verlag: Wiesbaden, Germany, 1998. [Google Scholar]
- Kennedy, J.; Eberhart, R. Particle Swarm Optimization. In Proceedings of the ICNN’95-international conference on neural networks, Toronto, ON, Canada, 14–17 May 1995; pp. 1942–1948. [Google Scholar]
- Dorigo, M.; Maniezzo, V.; Colorni, A. The ant system: Optimization by a colony of cooperating agents. IEEE Trans. Syst. Man Cybern. Part B 1996, 26, 29–41. [Google Scholar] [CrossRef]
- Kirkpatrick, S.; Gelatt, C.D.; Vecchi, M.P. Optimization by simulated annealing. Science 1983, 220, 671–680. [Google Scholar] [CrossRef]
- Nowicki, E.; Smutnicki, C. A Fast Taboo Search Algorithm for the Job Shop Problem. Manag. Sci. 1996, 42, 797–813. [Google Scholar] [CrossRef]
- Rao, S.S. Engineering Optimization: Theory and Practice, 5th ed.; Wiley: Hoboken, NJ, USA, 2020; ISBN 9781119454793. [Google Scholar]
- Lämmel, U.; Cleve, J. Künstliche Intelligenz: Wissensverarbeitung—Neuronale Netze, 5.; überarbeitete Auflage; Carl Hanser Verlag: München, Germany, 2020; ISBN 978-3-446-46363-9. [Google Scholar]
- Ming, B.; Liu, P.; Guo, S.; Zhang, X.; Feng, M.; Wang, X. Optimizing utility-scale photovoltaic power generation for integration into a hydropower reservoir by incorporating long- and short-term operational decisions. Appl. Energy 2017, 204, 432–445. [Google Scholar] [CrossRef]
- Scheubel, C.; Zipperle, T.; Tzscheutschler, P. Modeling of industrial-scale hybrid renewable energy systems (HRES)—The profitability of decentralized supply for industry. Renew. Energy 2017, 108, 52–63. [Google Scholar] [CrossRef]
- Atwa, Y.M.; El-Saadany, E.F.; Salama, M.M.A.; Seethapathy, R. Optimal Renewable Resources Mix for Distribution System Energy Loss Minimization. IEEE Trans. Power Syst. 2010, 25, 360–370. [Google Scholar] [CrossRef]
- Upadhyay, S.; Sharma, M.P. Development of hybrid energy system with cycle charging strategy using particle swarm optimization for a remote area in India. Renew. Energy 2015, 77, 586–598. [Google Scholar] [CrossRef]
- Ma, T.; Yang, H.; Lu, L.; Peng, J. Pumped storage-based standalone photovoltaic power generation system: Modeling and techno-economic optimization. Appl. Energy 2015, 137, 649–659. [Google Scholar] [CrossRef]
- Zhang, W.; Maleki, A.; Rosen, M.A.; Liu, J. Sizing a stand-alone solar-wind-hydrogen energy system using weather forecasting and a hybrid search optimization algorithm. Energy Convers. Manag. 2019, 180, 609–621. [Google Scholar] [CrossRef]
- Lan, H.; Wen, S.; Hong, Y.-Y.; Yu, D.C.; Zhang, L. Optimal sizing of hybrid PV/diesel/battery in ship power system. Appl. Energy 2015, 158, 26–34. [Google Scholar] [CrossRef]
- Li, B.; Roche, R.; Miraoui, A. Microgrid sizing with combined evolutionary algorithm and MILP unit commitment. Appl. Energy 2017, 188, 547–562. [Google Scholar] [CrossRef]
- Zhang, W.; Maleki, A.; Rosen, M.A.; Liu, J. Optimization with a simulated annealing algorithm of a hybrid system for renewable energy including battery and hydrogen storage. Energy 2018, 163, 191–207. [Google Scholar] [CrossRef]
- Friedemann, C. Umweltorientierte Investitionsplanung; Gabler Verlag: Wiesbaden, Germany, 1998; ISBN 978-3-322-99167-6. [Google Scholar]
- Reich, G.; Reppich, M. Regenerative Energietechnik: Überblick über Ausgewählte Technologien zur Nachhaltigen Energieversorgung, 2nd ed.; Springer Vieweg: Wiesbaden, Germany, 2018; ISBN 978-3-658-20607-9. [Google Scholar]
- Grundig, C.-G. Fabrikplanung: Planungssystematik—Methoden—Anwendungen, 5th ed.; Hanser: München, Germany, 2015; ISBN 978-3-446-44215-3. [Google Scholar]
- Eiselt, J. Dezentrale Energiewende: Chancen und Herausforderungen; Springer Vieweg: Wiesbaden, Germany, 2012; ISBN 978-3-8348-2461-5. [Google Scholar]
- Hau, E. Windkraftanlagen: Grundlagen, Technik, Einsatz, Wirtschaftlichkeit, 5th ed.; Springer Vieweg: Berlin, Germany, 2014; ISBN 978-3-642-28876-0. [Google Scholar]
- Kaltschmitt, M.; Streicher, W.; Wiese, A. Erneuerbare Energien: Systemtechnik, Wirtschaftlichkeit, Umweltaspekte, 5th ed.; Springer Vieweg: Berlin, Germany, 2013; ISBN 978-3-642-03248-6. [Google Scholar]
- Sterner, M.; Stadler, I. Energiespeicher: Bedarf, Technologien, Integration; Springer Vieweg: Berlin, Germany, 2014; ISBN 978-3-642-37380-0. [Google Scholar]
- Karl, J. Dezentrale Energiesysteme: Neue Technologien im Liberalisierten Energiemarkt, 3rd ed.; Oldenbourg: München, Germany, 2012; ISBN 978-3-486-70885-1. [Google Scholar]
- Blum, L. Technologiebericht 2.2a Dezentrale Kraftwerke (Brennstoffzellen) Innerhalb des Forschungsprojekts TF_Energiewende. 2017. Available online: https://epub.wupperinst.org/frontdoor/deliver/index/docId/7049/file/7049_Dezentrale_Kraftwerke.pdf (accessed on 23 December 2020).
- Bitterlich, W.; Lohmann, U. Gasturbinenanlagen: Komponenten, Betriebsverhalten, Auslegung, Berechnung: Mit Ausführlichen Berechnungsbeispielen, 2nd ed.; Springer Vieweg: Wiesbaden, Germany, 2018; ISBN 978-3-658-15067-9. [Google Scholar]
- Tu, K.; Xiong, H.; Chen, F. Comprehensive Prediction of Generation Power in Photovoltaic Microgrid. In Proceedings of the 2019 IEEE 8th Joint International Information Technology and Artificial Intelligence Conference (ITAIC 2019), Chongqing, China, 24–26 May 2019; pp. 1116–1120. [Google Scholar] [CrossRef]
- Schael, M.; Neumann, C.; Richmann, S.; Rogat, A.; Sourkounis, C. Risk evaluation of a chemical production system regarding power quality implications. In Proceedings of the IET (Hrsg.): Mediterranean Conference on Power Generation, Transmission Distribution and Energy Conversion (MedPower 2016), Belgrade, Serbia, 6–9 November 2016. [Google Scholar] [CrossRef]
- Mariam, L.; Basu, M.; Conlon, M.F. Microgrid: Architecture, policy and future trends. Renew. Sustain. Energy Rev. 2016, 64, 477–489. [Google Scholar] [CrossRef]
- Praiselin, W.J.; Edward, J.B. A Review on Impacts of Power Quality, Control and Optimization Strategies of Integration of Renewable Energy Based Microgrid Operation. IJISA 2018, 10, 67–81. [Google Scholar] [CrossRef]
- Synwoldt, C. Dezentrale Energieversorgung mit Regenerativen Energien: Technik, Märkte, Kommunale Perspektiven; Springer Vieweg: Wiesbaden, Germany, 2016; ISBN 978-3-658-13046-6. [Google Scholar]
- Wesselak, V.; Schabbach, T.; Fischer, J.; Link, T. Handbuch Regenerative Energietechnik, 3rd ed.; Springer Vieweg: Berlin, Germany, 2017; ISBN 978-3-662-53072-6. [Google Scholar]
- Günther, M. Energieeffizienz durch Erneuerbare Energien: Möglichkeiten, Potenziale, Systeme; Springer Vieweg: Wiesbaden, Germany, 2015; ISBN 978-3-658-06752-6. [Google Scholar]
- Umweltbundesamt. Kennzahlen von Anlagen mit Kraft-Wärme-Kopplung (KWK). Available online: https://www.umweltbundesamt.de/bild/tab-kennzahlen-von-anlagen-kraft-waerme-kopplung (accessed on 23 December 2020).
- Lechner, C.; Seume, J. Stationäre Gasturbinen, 3rd ed.; Springer: Berlin/Heidelberg, Germany, 2019; ISBN 978-3-662-56133-1. [Google Scholar]
- Fraunhofer ISE. Stromgestehungskosten Erneuerbare Energien. 2018. Available online: https://www.ise.fraunhofer.de/content/dam/ise/de/documents/publications/studies/DE2018_ISE_Studie_Stromgestehungskosten_Erneuerbare_Energien.pdf (accessed on 23 December 2020).
- Schuster, T.; Rüdt von Collenberg, L. Investitionsrechnung: Kapitalwert, Zinsfuß, Annuität, Amortisation; Springer Gabler: Berlin, Germany, 2017; ISBN 978-3-662-47799-1. [Google Scholar]
- Heier, S. Windkraftanlagen: Systemauslegung, Netzintegration und Regelung, 6th ed.; Springer Vieweg: Wiesbaden, Germany, 2018; ISBN 978-3-8348-1426-5. [Google Scholar]
- Droste-Franke, B. Brennstoffzellen und Virtuelle Kraftwerke: Energie-, Umwelt- und Technologiepolitische Aspekte Einer Effizienten Hausenergieversorgung; Springer: Berlin, Germany, 2009; ISBN 978-3-540-85796-9. [Google Scholar]
- ASUE. Über die Wirtschaftlichkeit von Blockheizkraftwerken in Hotels. 2018. Available online: https://www.asue.de/sites/default/files/asue/themen/blockheizkraftwerke/2018/broschueren/510034_asue_bhkw_in_hotels.pdf (accessed on 23 December 2020).
- BHKW Infozentrum. Veränderung der Wirtschaftlichkeit einer KWK-Anlage bei Wegfall der Eigenstromprivilegierung. 2014. Available online: https://www.bhkw-infozentrum.de/aktuelle-bhkw-statements/kwk-wirtschaftlichkeitsvergleich-ohne-und-mit-eeg-umlage-eigenstromprivilegierung.html (accessed on 23 December 2020).
- Prognose, A.G.; Fraunhofer, I.F.A.M.; Öko-Institut, E.V. BHKW Consult; Stiftung Umweltenergierecht. Evaluierung der Kraft-Wärme-Kopplung: Analysen der Entwicklung der Kraft-Wärme-Kopplung in einem Energiesystem mit Hohem Anteil erneuerbarer Energien. 2019. Available online: https://www.bmwi.de/Redaktion/DE/Publikationen/Studien/evaluierung-der-kraft-waerme-kopplung.pdf?__blob=publicationFile&v=6 (accessed on 23 December 2020).
- BMWi. Marktanalyse Wasserkraft. 2015. Available online: https://www.bmwi.de/Redaktion/DE/Downloads/M-O/marktanalyse-freiflaeche-photovoltaik-wasserkraft.pdf?__blob=publicationFile&v=1 (accessed on 23 December 2020).
- Umweltbundesamt. Erneuerbare Energien—Innovationen für die Zukunft. 2004. Available online: https://www.dlr.de/tt/Portaldata/41/Resources/dokumente/institut/system/publications/broschuere_ee_innov_zukunft.pdf (accessed on 23 December 2020).
- Zainuddin, H.; Shaari, S.; Omar, A.M.; Sulaiman, S.I. Power prediction for grid-connected photovoltaic system in Malaysia. In Proceedings of the IEEE, 3rd International Symposium & Exhibition in Sustainable Energy & Environment, Melaka, Malaysia, 1–3 June 2011; pp. 110–113. [Google Scholar] [CrossRef]
- Carrillo, C.; Obando Montaño, A.F.; Cidrás, J.; Díaz-Dorado, E. Review of power curve modelling for wind turbines. Renew. Sustain. Energy Rev. 2013, 21, 572–581. [Google Scholar] [CrossRef]
- Bruno, S.; Dicorato, M.; La Scala, M.; Sbrizzai, R.; Lombardi, P.A.; Arendarski, B. Optimal Sizing and Operation of Electric and Thermal Storage in a Net Zero Multi Energy System. Energies 2019, 12, 3389. [Google Scholar] [CrossRef]
- Atia, R.; Yamada, N. Sizing and Analysis of Renewable Energy and Battery Systems in Residential Microgrids. IEEE Trans. Smart Grid 2016, 7, 1204–1213. [Google Scholar] [CrossRef]
- Ohlhorst, D. Akteursvielfalt und Bürgerbeteiligung im Kontext der Energiewende in Deutschland: Das EEG und seine Reform. In Handbuch Energiewende und Partizipation; Holstenkamp, L., Radtke, J., Eds.; Springer Fachmedien Wiesbaden GmbH: Wiesbaden, Germany, 2018; pp. 101–124. [Google Scholar] [CrossRef]
- BMWi. Marktanalyse 2016: Stand und Entwicklung der weiltweiten Erneuerbare-Energien-Märkte. 2016. Available online: https://www.bmwi.de/EEE/Redaktion/DE/DENA/Downloads/Publikationen/Marktanalysen/20161212_marktanalyse_2016.pdf?__blob=publicationFile&v=4 (accessed on 23 December 2020).
- BDEW. Erneuerbare Energien und das EEG: Zahlen, Fakten, Grafiken: Anlagen, installierte Leistung, Stromerzeugung, EEG-Auszahlungen, Marktintegration der Erneuerbaren Energien und regionale Verteilung der EEG-Anlagen. 2016. Available online: https://www.bdew.de/media/documents/20160218_Energie-Info-Erneuerbare-Energien-und-das-EEG-2016.pdf (accessed on 23 December 2020).
- StMWi Bayern. Kleinwindkraftanlagen: Hintergrundinformtationen und Handlungsempfehlungen. 2018. Available online: https://www.stmwi.bayern.de/fileadmin/user_upload/stmwi/Publikationen/2018/2018-06-28_2018_Kleinwindkraftanlagen.pdf orientiert (accessed on 23 December 2020).
- Ingenierubüro Floecksmuehle. Vorbereitung und Begleitung bei der Erstellung eines Erfahrungsberuchts gemäßg § 97 Erneuerbare-Energien-Gesetz: Teilvorhaben II d: Wasserkraft. 2018. Available online: https://www.erneuerbare-energien.de/EE/Redaktion/DE/Downloads/bmwi_de/bericht-eeg-5-wasserkraft.pdf?__blob=publicationFile&v=4 (accessed on 23 December 2020).
- Bundesnetzargentur. Abrechnungsrelevante REgelungen des Standrad-Bilanzkreisvertrags. 2007. Available online: https://www.bundesnetzagentur.de/DE/Service-Funktionen/Beschlusskammern/1_GZ/BK6-GZ/2007/BK6-07-002/Abrechnungsrelevante%20Regelungen%20des%20Standard-Bilanzkreisvertrages.pdf?__blob=publicationFile&v=2 (accessed on 23 December 2020).
- BMWi. Zeitreihen zur Entwicklung der Erneuerbaren Energien in Deutschland. 2020. Available online: https://www.erneuerbare-energien.de/EE/Redaktion/DE/Downloads/zeitreihen-zur-entwicklung-der-erneuerbaren-energien-in-deutschland-1990-2019.pdf?__blob=publicationFile&v=26 (accessed on 23 December 2020).
- Konstantin, P. Praxisbuch Energiewirtschaft: Energieumwandlung, -Transport und -Beschaffung, Übertragungsnetzausbau und Kernenergieausstieg, 4th ed.; Springer Vieweg: Berlin, Germany, 2017; ISBN 978-3-662-49822-4. [Google Scholar]
- Ani, V.A. Optimal Operational Strategy for PV/Wind-Diesel Hybrid Power Generation System with Energy Storage. Int. J. Energy Optim. Eng. 2014, 3, 101–120. [Google Scholar] [CrossRef]
- Malheiro, A.; Castro, P.M.; Lima, R.M.; Estanqueiro, A. Integrated sizing and scheduling of wind/PV/diesel/battery isolated systems. Renew. Energy 2015, 83, 646–657. [Google Scholar] [CrossRef]
- Mandal, S.; Das, B.K.; Hoque, N. Optimum sizing of a stand-alone hybrid energy system for rural electrification in Bangladesh. J. Clean. Prod. 2018, 200, 12–27. [Google Scholar] [CrossRef]
- Zhao, B.; Zhang, X.; Li, P.; Wang, K.; Xue, M.; Wang, C. Optimal sizing, operating strategy and operational experience of a stand-alone microgrid on Dongfushan Island. Appl. Energy 2014, 113, 1656–1666. [Google Scholar] [CrossRef]
- González, A.; Riba, J.-R.; Rius, A.; Puig, R. Optimal sizing of a hybrid grid-connected photovoltaic and wind power system. Appl. Energy 2015, 154, 752–762. [Google Scholar] [CrossRef]
- Doleski, O.D. Herausforderung Utility 4.0: Wie sich die Energiewirtschaft im Zeitalter der Digitalisierung verändert; Springer Vieweg: Wiesbaden, Germany, 2017; ISBN 978-3-658-15736-4. [Google Scholar]
Publisher’s Note: MDPI stays neutral with regard to jurisdictional claims in published maps and institutional affiliations. |
© 2021 by the authors. Licensee MDPI, Basel, Switzerland. This article is an open access article distributed under the terms and conditions of the Creative Commons Attribution (CC BY) license (https://creativecommons.org/licenses/by/4.0/).