Abstract
The present study aims to present, evaluate and identify the factors required to measure the prosperity and sustainability of Romania’s economy over the specific period 2000–2020 in light of sustainable regional development assessments, and examines how the main factors—as considered by the authors—may be integrated into regional development policies. The focus throughout the study is on the need to permanently support the development of Romanian regions in direct relation to the sustainable indicators presented within the model—through the use of data from empirical analysis—which are measures of Romania’s economic prosperity and long-term economic growth. Therefore, the study intends to assess the progress of each region of the country, showing the evolution and selection of factors that are related to sustainability, namely, child survival, poverty and education, with implications for regional development strategies and local initiatives that must promote wider sustainable regional development. Furthermore, the aim of the study is to analyse the influence of sustainable inflows on economic prosperity, reflected in the Gross Domestic Product (GDP) per capita for each region in Romania, considering factors related to sustainability and the major differences between the regions, depending on the effectiveness of these public policy applications. With this approach, our goal—considering all the macroregions of the country—is to emphasize the significance of two main aims in sustainable regional development: a better allocation of the means which actively aim to decrease the unemployment rate and a better infrastructure for public services. National, regional and local administrations play important roles in promoting coherent sustainability in economic, social and environmental activities. Regardless of the level at which development policies are devised—local, county or regional—they must take into consideration and monitor the determinants of sustainable development in cases where development is the ultimate goal.
1. Introduction
The present study intends to investigate where all the regions within Romania are positioned on a scale measuring the prosperity and sustainability of the economy and what is required to achieve this goal, leading to important implications for regional development.
In order to support our research, indicators such as mortality rate, poverty or education have been evaluated as explanatory variables to assess the prosperity of a region or a country with beneficial effects on sustainable development.
Population survival rates may also be an important variable in assessing the evolution of Gross Domestic Product (GDP) as a measure of economic growth, as well as aspects also deriving from studies concluding that higher GDP is associated with lower child death rates as a result of the sustainable development of society, or studies analysing the relationship between GDP and poverty. Therefore, economic growth must be the central element for decreasing poverty in Romania, measured via the annual GDP growth per capita on a constant basis.
The present study is structured into the following sections. Section 1 is the introduction, highlighting the relevance of the subject-matter of our research and the core purpose. Section 2 presents the main theories regarding sustainable development, sustainable regional development, and development at European, national and regional levels, focusing on the most relevant studies in Romania analysed from the perspective of factors considered suitable for measuring Romania’s economic prosperity. Section 3 presents an overview of the data and methodology, outlining the main techniques used in this analysis. The following section is dedicated to empirical results and discussion. Finally, the main conclusions and political implications are presented together with a brief review of initiatives that encourage sustainable regional development.
In this study, panel data from empirical analysis were used as working assumptions—i.e., stationary and nonstationary data ranges supporting the measures for economic prosperity and sustainable and financial contributions at the macroeconomic level. Hence, we consider GDP per capita in the country’s eight development regions as dependent variables and infant mortality rate by urban/rural areas—macroregions—reflecting the survival of children (deaths under 1 year per 1000 live births), social exclusion rate, number of educational units, net turnover, the ratio between the number of unemployed and employed citizens, and the number of companies active in the regions of the country as independent variants.
The study aims to assess economic prosperity, reflected in GDP per capita, within the period analysed by considering the sustainability factors that contribute to the economic growth of each region compared to the evolution of the panel tested for stationarity, thus demonstrating that their evolution is independent over time, as presented in the econometric model which used the Pearson correlation coefficient, linear regression function, analysis of variance (ANOVA, with 136 observations), Welch and Brown–Forsythe tests, post hoc LSD test, and Hausman test as investigation methods in order to reflect the major differences between the average GDP per capita in the macroregions, which have emerged from the appropriate implementation of public policies regarding education, poverty eradication and improvement of the health system.
As regards the estimation of current economic prosperity and the influence of the global economy, we may say that Romania—akin to many other economies worldwide—has already been in a severe technical recession since 2020, with a marked economic downturn. This time, the cause is not linked to global economic cyclicality—although there were some trends in this respect toward the end of 2019, which were more clearly reflected in Italy—nor to financial aspects, as was the case in 2008, nor to purely economic trends in general, but was generated by the COVID-19 pandemic due to the emergence of the SARs-CoV-2 virus in the fourth quarter of 2019 in Wuhan (China).
In fact, given that the pandemic started in the first quarter of 2020, there is significant uncertainty related to actual economic sustainable growth in Romania. Macroeconomic management has to encourage investment, so that the business environment can turn into a significantly better one, as the unattractive investment climate in Romania’s regions and the lack of viable projects have a major influence on the poor population, lowering their chances of acquiring work, increasing the unemployment rate and, implicitly, generating negative consequences for the development of the economic prosperity of the country.
These aspects have profoundly altered global policies, and also Romania’s macroeconomic policies, weakening its continued effort to join the Euro Area and to achieve natural convergence in relation to the average development of EU States. Within the economic image of the Romanian economy, its status in 2020 is hard to represent, even by a relevant graphic representation, revealing, even in the most optimistic perspective, a technical recession during the first and second quarters, according to the expected statistical indicators, and, from a pessimistic standpoint assuming successive waves of the COVID-19 pandemic, an inertial recession of over two more years after 2020 and 2021.
Our research analyses the measures to be applied to increase Romania’s economic prosperity such as:
- debates on the opinions of experts belonging to professional bodies, government, local authorities from all regions of Romania on administrative burdens applied to private companies in order to develop a proposal for simplified procedures to decrease administrative burdens on business environment, respectively, and economic operators’ various activities, including research and development, innovation, and Research, Development and Innovation (RDI) activity, which represent a strategic pillar to ensure economic growth;
- inventory of existing administrative procedures that have a negative impact on the business environment in terms of excessive bureaucracy;
- discussing the existing fiscal measures and their permanent adaptation for private companies, respectively, innovative small- and medium-sized microenterprises (SMEs) (which can bring significant benefits for any region of our country as they are more productive and sometimes more technologically advanced than those on the market, and directly contribute to improving the competitiveness of the region);
- understanding and agreeing on the evolution of the legal framework, respectively, progressively legislating with regard to the number and volume of major regions in order to obtain an active systematized and simplified legal framework;
- grouping and merging the proposals regarding the removal of bureaucracy surrounding procedures, which burdens the operators’ activities within the business environment;
- framework development to support the decision to decrease the administrative burden of business environment, including companies carrying out RDI activities.
During these difficult times, we deem that European funds are the strong point of our country, assuming the state manages to attract them, in terms of ensuring economic growth. Consequently, 2021 will register an economic growth of between 3% and 4.2%, but it will not manage to compensate for the drop of 2020. Even if there are growth forecasts of more than 4% in an optimistic scenario, the evolution of the medical situation within the current pandemic context shall have a strong influence on the economic development in our country.
The main goal that may contribute to Romania’s regional development strategy is tax policy—i.e., fiscal consolidation. If this does not occur, serious consequences in terms of rating, exchange rate and inflation will be triggered. Even if the economy is to grow as foreseen by the national Strategy and Forecast Commission for some areas, the crisis in 2021 will still represent a powerful setback. The forecasts are fluid due to the situation that is still uncertain. The recovery will be differentiated and some sectors tend to develop well, sometimes even above expectations. Sectors such as transport, logistics, IT, and communications are very much in demand because of the change in lifestyles, consumption patterns, production patterns and demand. Some sectors will continue to suffer—for example, Hotels, Restaurants and Catering (HoReCa) and tourism.
A weak point of Romania’s economy is the budgetary deficit. Romania started with a budgetary deficit of 7% GDP in 2021, after it increased up to 9% GDP in 2020; as the economic growth returns, it shall automatically have a strong deficit adjustment, as in most European countries. Another weak point in the economy in 2021 is the low added value of Romania, as our economy still contributes very little. Another strong point is represented by the certain degree of maturity which has occurred in the private sector and there are some notable entrepreneurs who are willing to take greater risks in order to produce added value.
The amounts provided as support by the European Recovery Facility are substantial, but in order to attract these funds, Romania has to develop and propose viable projects. It should be mentioned that that, although the benefits, including budgetary benefits, of these investments are clear and tangible (the working population is increasing and the pressure on welfare payments is decreasing, higher taxes collected by the budget), and at a global level there is fierce competition to attract foreign investments, Romania must consolidate its fiscal legislation as soon as possible to ensure a more predictable fiscal environment, better infrastructure and clear legislation. These issues are elements that can encourage such investments and, therefore, decrease the pressure on budget and taxation. The Fiscal Code’s new form, which came into force on 1 January 2021, adapts Romanian legislation to the new reality by eliminating discrimination, simplifying the complexity of fiscal compliance and aligning it with international norms within the globalized economy context.
We believe that the present pandemic underlines the weaknesses in each area of the economy and the fiscal framework is essentially beneficial and necessary, even more so during such times of instability in society and profound business transformation, in order to decrease unemployment, eradicate poverty and constantly increase GDP per capita for each region of our country.
The predictability of the legal framework remains crucial for any business strategy, but the ability of entrepreneurs to adapt through innovation, technology and resilience to the challenges of this new reality is essential.
We specified in our study that the beneficiaries of statistical information on health, education, and poverty are mainly the policy-makers, who have roles in implementing public policies in health, education and social fields, the members of academia and the general public [1].
We emphasize herein that the European Commission has invested time and resources to research the idea that GDP growth does not necessarily translate into improving the quality of life in society. In 2009, a reference document, entitled “GDP and beyond: measuring progress in a changing world” [2], was drafted in this regard. This specific document acknowledges that GDP does not measure the degree of environmental sustainability or social inclusion and calls for action on the production and improvement of data and indicators to complement GDP, as well as extending the coverage of national accounts to include environmental and social aspects.
Many families face problems in terms of meeting their needs, which makes their vulnerability to the risk of losing or lowering their income and greater decline of their purchasing power to be significantly increased than in case of people with a higher level of income. The risk of degradation of living conditions below an acceptable standard is also amplified by the fact that low-income levels have not allowed savings to be used in crisis situations (unemployment, retirement, illness).
The population groups at the utmost risk of poverty in Romania are children, the elderly, retired farmers, farmers and the unemployed. By type of households, the risk of poverty is higher for single persons or single-parent households and large households, consisting of two adults with three or more children and three or more adults with children. According to residence and development regions, the risk of poverty is higher among the rural population and the population of the north-east and south-east regions.
A social policy focused on protecting children and supporting families with children also needs to be seen in the light of the fact that there is no individual responsibility in the case of children, and do not have the ability to opt for different life strategies, to act or to exercise any type of pressure for the right to a better life or to enforce the rights granted by law. Such a policy is also important for birth rate recovery, as well as because investing in children is the most important and profitable for the future development of the economy and society.
Fighting poverty, as a major and continuing goal of social policy, must aim at promoting employment measures, ensuring a sufficient minimum wage, in line with the need to ensure a decent living, upgrading the agriculture domain, developing the rural economy and regional development, increasing education and training, and developing the social protection system and adapting it to economic and social developments and the demands and risks arising from demographic aging.
The role of the social protection system is to prevent poverty by providing replacement income (pensions, unemployment benefits and temporary incapacity benefits) and by supporting the income of families with children and people with disabilities, and also by supporting the population affected by poverty, at a sufficiently high level with the resources available, in order not to allow high discrepancies between the recipients of social benefits and the employed population regarding their living standard.
Labour market policies must be considered as priorities and, in addition to education and health policies, they may be seen as the core of development policies, as they directly lead to social inclusion, rural development, regional development and decreases in poverty. If the budgeting of these policies is seen in an integrated way, then the chances to identify financing sources shall increase considerably.
The intention of this study is to highlight the major necessity and the existence of a permanent concern on the part of Romanian state authorities and government to implement and improve public policies in the field of study that would generate long-term sustainable growth in Romania.
While Romania’s latest targets were set in relation to the evolution of the world economy and to be in line with EU policies, currently, both Romania and the EU need to focus on their medium- and long-term priorities in order to achieve the targets of the 2030 Agenda for Sustainable Development, passed by the United Nations Summit as of September 2015 [3] as a means of achieving a better future for the generations to come.
The abovementioned 2030 Agenda requires action by all countries, poor, rich and middle-income, in order to end poverty. This target must be accompanied by a plan for economic growth addressing social needs, including education, health, social protection and jobs, and the challenges of fighting climate change and protecting the environment, as well as decreasing inequalities between men and women and urban and rural areas, leading to the promotion of an open society in which citizens can feel appreciated and supported.
2. Literature Review
The prosperity and sustainability of the economy are among the most important aspects to be supervised both from national and global perspectives, considering that recession and prosperity periods occur regularly with some amplitudes [4]. However, beyond these fluctuations and their effects, the most important outcomes are performance and economic growth. Currently, the relevant literature provides many benchmarks for shaping economic growth without distinguishing between prosperity and support issues [5]. From economic prosperity perspective, emphasis may be put on the occurrence of differential power at the regional level primarily due to uneven economic growth, but certain factors may be considered to accelerate this process, so the differences may also change [6].
The implications of living standard differences in periods of economy prosperity over time are major. These differences are associated with nutrition, education, infant mortality, life expectancy and other measures of prosperity. Given the significant impact that the growth process has on the economy prosperity and sustainability, it is surprising that the effort in this area has cyclically evolved [7].
The COVID-19 pandemic highlighted the importance of a prosperous and sustainable economy as an effective tool for mitigating the effects of the pandemic. The fact that some economies are likely to recover better is not a coincidence; rather, it is the effect of sustainable development on all dimensions.
According to the authors Kluge J., Lappöhn, S. and Plank, K., economic prosperity is measured by gross domestic product (GDP) per capita, the value of all goods and services produced by a country in one year, divided by the country’s population [8]. In the same context, economic growth represents a measure of the change in GDP on year-to-year basis. By marking this entry, Blum, J.; Gründler, K. (2020) show that the current experience of economic growth is an absolute exception in the long-term perspective of social history [5].
A problematic issue in the conceptualization of economic growth is given by its connections with other areas. Consequently, Boar, A., Bastida, R., and Marimon, F. A consider the economic growth process, a macroeconomic phenomenon, to be closely linked to other major macroeconomic problems [7]:
- economic balance—an economic growth without ensuring a macroeconomic balance will lead to an increase in national tensions and imbalances;
- cyclicality—marks the process of economic growth against the background of a long-term upward trend;
- economic development—there are significant differences between economic growth and economic development. Economic growth refers to the increase in various aggregate macroeconomic indicators. Economic development must be regarded as a multidimensional process involving major changes in social structures, popular attitudes and national institutions, with the aim of accelerating economic growth, reducing inequality and eradicating poverty.
The studies of some researchers claim that there is no strong correlation between these three areas, which are individually studied [9]. Most of the literature on economic balance and growth simultaneously analyses the two fiscal policy instruments such as public expenditure and taxation [10], economic growth measured by the growth rate of actual GDP and public expenditure and fiscal revenue.
There have been numerous attempts to project alternative, nonmonetary indices of economic prosperity by combining a variety of different factors, which are deemed to influence economic growth, in a single statistic [11]. According to Murga-Menoyo, M.Á, GDP has the advantage of providing a relatively simple, solid and objective measure of the propriety of an economy and is computed by summing up the value of all goods and services produced and consumed over a period of time [12]. Nonetheless, there are many shortcomings of this indicator: from the fact that it does not consider important areas of the economy, to its inability to reflect the structural, qualitative changes that occur in production and consumption over time [13].
Most economists believe that the era of globalization must be based on the prosperity of an economy, including lasting integration in the global economic circuit, sustainable stability of the economic system, and sustainable competitiveness [12,14]. Sustainable stability implies the acceptance of economic growth as an engine of development, without neglecting the conditions of balance. An economic system is considered stable if it can functionally dissipate any shock without radically affecting the characteristics of its state [15]. This stability presumes the existence of a time interval ensured by adequate structural policies, ongoing government programs, long-term macroeconomic projections, etc., which is an interval that is meant to prevent disturbances and dysfunctions of the system [5,16].
Naturally, questions about the conditions of their stability, legitimacy, sustainability and efficiency arise. In addition to internal, traditional factors, in the age of globalization the external economic environment the dynamics of development and the fierce competitiveness of economic openness can force additional instabilities of the system. Thus, stability nowadays must be seen exclusively in terms of sustainability which, in modern terms, implies the acceptance of economic growth as an engine of development, but without giving up the balance [17].
Hence, in the long run, sustainability is to be perceived as a balanced economic growth, and the macroeconomic balance must be dynamic and favour the qualitative changes of the system [18,19]. As regards the concept of economic system stability, it does not aim at excessive rigidity which excludes vulnerabilities from the outset, but also does not deny the existence of possible risks related to the implementation of reforms [20]. Economic stability, as a matter of priority, means the functional dependency on fiscal stability, which must not be treated per se, but in terms of guaranteeing a sustainable and socially oriented development dynamic [21,22].
Currently, regional development is affected by the COVID 19 pandemic and it is characterized by multiple crises. Under these circumstances, there is a need to re-evaluate the principles of employment, social aspects, and quality of life, as well as the institutions reporting on these imbalances. The integration of the three pillars of sustainable development at the regional level requires economic growth, but without jeopardizing the limited resources of the planet [23,24].
According to analysts, global GDP is projected to shrink by 5.2% in 2021, using the market ratio of the exchange rate. We are witnessing the most complex global recession in decades, despite governments’ extraordinary efforts to tackle this phenomenon through various fiscal and monetary policies. In the coming years, this phenomenon will leave long-lasting marks through lower investment, an erosion of human capital due to working and schooling issues and the fragmentation of global trade and supply links.
The European Commission has approved the reallocation of nearly EUR 1.8 billion to mitigate the negative effects of Coronavirus crisis on Romania’s economy, directing financial support amounting to EUR 800 million to over 121,000 small- and medium-sized microenterprises (SMEs), out of which EUR 300 million are grants. Furthermore, additional funds have been made available for the purchase of IT equipment to support education. Romania has mobilized EUR 350 million from EU funds to support health workers at the forefront of the fight against the pandemic by purchasing emergency healthcare provisions and protective equipment supplies since February 2020. From an economic wellbeing perspective, sustainable regional development involves ensuring that the regional population can reach an acceptable level of wellbeing now and in the future [25].
Using sustainable competitiveness, Bercu, A.M [26] analysed the impact of sustainable development on regional prosperity when elements defining quality of life have economic and social impacts. Based on the analyses, the author pointed out that minimum wage increases would generate a positive outcome with social implications also at the regional level.
The economical specificity of many regions is given by the integration, and in this regard it requires continuous analysis of dynamics of real convergence to reach a sustainable perspective. In different economic systems, these principles are implemented through national strategies and policies which generate sustainable competitiveness [27]. According to the studies of Linkov, I. and Palma-Oliveira, J.M., there is a relationship between competitiveness and sustainability and that this is crucial, but the relationship itself is not yet well-established in the literature [16,28].
Therefore, competitiveness represents the set of institutions, policies and factors that determine a country’s level of productivity in the short term, but not in the long term, which would be crucial for the sustainability and systemic image of development [20].
In this regard, the problem of integrating the two concepts is logically required. It is known that when resources decrease, they are always limited, and economic agents automatically adjust their consumption and production patterns in response to a change in social policies within the entity, as well as the increase/decrease in prices [29,30]. Additionally, some market resources are not substitutable—human capital, individual factors—whereas others are vulnerable, which are never sustainable because of prices and elements of the environment, but altogether measure sustainable competitiveness [23,31]. Thus, unlike competitiveness in the traditional sense, sustainable competitiveness is defined as a set of institutions, policies and factors that determine a country’s level of productivity, while ensuring the ability of future generations to meet their own needs [32,33].
For Romania, the development of a monitoring system for the economic and social dynamics at the regional level in line with the evolution of the welfare degree and the quality-of-life indicator [34] is required.
This is necessary at national and regional levels, and more as solutions are being sought in the context of the pandemic in order to find new roles for decision-makers that maintain the path toward sustainable development goals and to overcome the economicac deadlock generated by COVID-19 crisis at economic and social levels. The EU report shows that COVID-19 pandemic’s impact affects 13 of the 17 Sustainable Development Goals, and more will generate a period of setback in the fight against poverty, exacerbating high levels of inequality at the regional level [24].
3. Data Source and Methods for Data Analysis
Hypotheses Development
Economic prosperity in the postcommunist countries has been a subject of interest: Cirkvenčič et al. (2011) [35] discussed dissatisfaction with the economic status and development, the low approvement of the government, and existing standards of living and life expectancy in these countries and their influence on the matter. One year later, Abbott and Wallace (2012) [36] assessed the influence of a number of work conditions on economic prosperity, considering the life satisfaction and the quality of society, and they reached the conclusion that accession to the EU was reflected in a better quality of life. The influences of a series of sustainable factors on Romania’s economic growth were analysed by Emir and Bekun (2019) [37], who acknowledge the success story of our country in implementing sustainable measures. Considering the importance of economic prosperity and having in mind the possible imbalances between Romanian macroregions (knowing that three of these are among EU’s poorest regions) [38], the authors of this study suggest testing and validating two hypotheses which are related to the economic prosperity and its influence factors, split into two categories (sustainable and, respectively, financial and structural,), as follows:
Hypothesis 1 (H1).
The economic prosperity of Romania is significantly influenced by sustainable factors related to child survival, poverty and education.
Hypothesis 2 (H2).
The economic prosperity of Romania is significantly influenced by financial and structural factors related to profitability, the dynamics of the business environment, and employment.
The hypotheses will be tested using SPSS 25.0 and Eviews 10.
The data used in the empirical analysis, specifically the measure for economic prosperity, the sustainable and financial inputs, at the macroeconomic level, are presented in Table 1.

Table 1.
Summary description of variable used.
The study analyses the influence of sustainable inputs on economic prosperity, reflected in GDP per capita. In this case, we will consider factors that are related to sustainability—namely, child survival, poverty, and education. The model is presented in Equation (1):
〖GDP〗_it = α + β_1∙〖IMR〗_it + β_2∙〖RPSE〗_it + β_3∙NEU\ + ε_it
Indicators such as mortality, poverty or education are explanatory variables for the health of a community or a country and a sign of their sustainable development [39,40]. The survival rates of the population are an interesting variable in assessing the evolution of GDP as a measure for economic growth [41,42]. In context, there are also studies which show that higher GDP is associated with low child death rates, a sign of the sustainable development of the society [43,44]. There are also studies that analyse the relationship between GDP and poverty. On one side, there are authors who assert that an increase in GDP is the result on an increase in the income of the poor [45,46]. Beck et al. (2005) found a negative relationship between economic growth and the poverty rate [47]. Zhang et al. (2017) analysed the influence of higher education institutions on GDP, considering them to be an advantage in terms of research and development [48]. In context, we analysed the influence of child survival, poverty rate and number of education units on economic prosperity.
In the following step of our analysis, we want to assess the influence of the financial inputs on the GDP growth—namely, the number of companies, the turnover, and the employment, according to the model presented in Equation (2):
〖GDP〗_it = α + β_1∙〖Pr_margin〗_it + β_2∙〖Employ〗_it + β_3∙〖No_comp〗_it + ε_it
Given that the data are presented in a panel structure, they must be tested for stationarity, thus demonstrating that their evolution is independent of time. In this sense, we will consider the following two hypotheses [49]:
Hypothesis 0 (H0).
The data series has a unit root (the series is nonstationary).
Hypothesis 1 (H1).
The data series does not have a unit root (the series is stationary).
In our study, we consider the analysis of the means by macroregions of GDP per capita (the dependent variable) in order to identify which is the macroregion with the highest economic growth, but also if there are notable differences between Romania’s regions. Thus, the hypotheses are:
Hypothesis 0 (H0).
µM1 = µM2 = µM3 = µM4 = µM5 = µM6 = µM7 = µM8
Hypothesis 1 (H1).
µi ≠ µj,∀i ≠ j, i,j = (1.8)−
The results of the analysis will be presented in the next section.
4. Results
The study will present a series of descriptive statistics for the analysed variables, the values of the Pearson correlation coefficients and the estimations of the parameters of the proposed regression models. The descriptive statistics for the interest variables are presented in Table 2.
Table 2.
Summary statistics for the interest variables.
As can be seen in Table 2 and from analysing the data for 2000–2016, the highest value of GDP per capita belongs to macroregion 8 in the year 2016 (207,575.2 RON/capita). Actually, macroregion 8 takes the leading position of all the indicators, as it includes the capital of Romania, Bucharest, and it is a well-known fact that this is the most developed region of the country.
The lowest values for GDP are reported in the year 2000 for the macroregion SW—Oltenia for number of companies, as well as in 2000 for the west macroregion (4) for unemployment rate, and in 2000 for the NE macroregion (1). The higher value for the profit margin of the private companies is reported for the NW macroregion which has indeed reported an unprecedented development in recent years, but the lowest value is actually characterized by mainly losses, which resulted in a negative ratio for the year 2009 in macroregion 2. Any negative results in the financial crisis period (2008–2010) are explainable. Considering the sustainable indicators, we noticed that the poorest region in Romania was NW Oltenia in 2007 with a ratio of 57, while the least affected by poverty is macroregion 8 with a ratio of 20.5. Considering child survival, the worst situation is reported for NE macroregion where the infantile mortality rate was of 23 in 2000, while the best situation was reported for macroregion 8, with a score of 4 deaths/1000 living births.
The graphical representation for the dependent variable in the 2000–2016 period is presented in Figure 1.
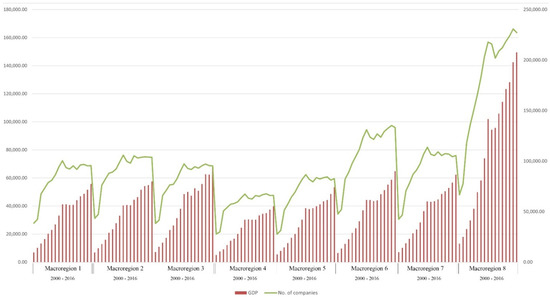
Figure 1.
Economic growth and number of companies by macroregions.
Figure 1 shows that, in Romania, the highest and most sustainable economic growth is specific to macroregion 8, which is the one where the capital, Bucharest, is located. Second is macroregion 3 (south Muntenia), with an average GDP per capita in 2000–2016 period of RON 54,327.15, as the region presents an average number of companies of 59,116 and an average number of employees of 421,262 persons, which are less those for than macroregions 6 and 7, which cover Transylvania, and are considered to be the development areas of Romania. In the case of macroregion 3, the explanation of its situation is related to agriculture, which has a huge exploitation potential, with 80.2% arable land, and to Danube and the southern part of the Carpathian Mountains, the region accounting for nearly 33% of Romania’s touristic potential. The situations of macroregions 6 and 7 are derived from proper application of public policies, which is reflected in a dynamic labour market, private business environment and market competition, but a moderate foreign investment attractiveness, ranking fifth in the country in 2019 and making up 5.8% of national FDI inflow [50]. This situation is due to proper application of public policies in terms of education, the eradication of poverty and the improvement of the medical system.
An ANOVA on the data recorded at the sample level (136 observations) helped us find significant differences between the average GDP per capita by macroregions. The analysis is significant (F = 10.098, sig. = 0.000) with a mean square between groups of 9,638,352,340.18 and within groups of 954,452,640.89. Testing for homogeneity of variances revealed a sig. value of 0.000, which shows the fact that the groups have significantly different variances. As a consequence, to test the equality of means between groups we used the Welch and Brown–Forsythe test.
As can be seen in Table 3, the GDP per capita values in seven out of eight macroregions are comparable. The exception is macroregion 8, with a GDP per capita of more than double compared with the rest of the country, which shows an imbalance between the capital region and other counties. The results are confirmed by the LSD post hoc test, presented in Table 4, which shows significant differences (at the 1% level) between macroregion 8 and the other seven.
Table 3.
Analysis of variance (ANOVA)—mean stake and the audit status of the targets.
Table 4.
LSD test—mean gross domestic product (GDP) per capita by macroregions.
The post hoc test results are presented in Table 4.
The correlation between the numeric variables is presented in Table 5.
Table 5.
Pearson correlation between numeric variables.
The results show that all variables are correlated and they reflect normal relationships. The economic growth is negatively and significantly correlated with unemployment rate, poverty rate and with child survival. As for education, there is a clear decreasing trend of the indicator due to restructuring over the years. Thus, the correlation was expected. Additionally, the economic growth is positively correlated with the number of active companies from the macroregion. The relationships between the indicators for sustainability at macroeconomic level were also as expected.
For our sample of countries, the time series properties of the data were examined using the unit root tests. The results of testing for stationarity are presented in Table 6.
Table 6.
The testing for stationarity of the numeric variables.
The level of significance of less than 5% means that hypothesis H0 is rejected in the case of stationarity; models can be built with undifferentiated series (with level values). Only for the variable Pr_margin was the series not stationary (sig. = 0.132), so we used the differences between consecutive observations. The estimation of the regression parameters is presented in Table 7.
Table 7.
The estimation of the regression parameters for testing H1 and H2.
In order to present the results and discuss them, we tested the panel model with random effects compared to the panel model with fixed effects using the Hausman test. As a result, for both models, the level of significance was less than 5% (sig. = 0.013, for model 1 and sig. = 0.000 for model 2). Therefore, given p < 0.050, the fixed effects model was accepted in both cases.
Considering the objectives of the paper, the two models showed expected results. Child survival and poverty rate have significant and negative influence on economic prosperity, which is the normal way a sustainable economy should react. The decrease in the mortality rates of infants is a sign of progress, at community and society levels, and a continuous preoccupation of all the nations [51,52]. As a consequence, we noticed the positive and significant impact of the decreasing rate on the national prosperity (sig. = 0.000). In the same line, a decrease in poverty and social exclusion, through an increase in the income of the poor, will lead to an increase in GDP, which reflects the prosperity of the nation. The results are consistent with the ones presented by Dollar and Kraay (2002) [53]. The first hypothesis was validated.
Considering the financial inputs at the macroregional level, the significant factors were the employment and the number of active companies, considering the negative correlation between the two variables (r = −0.630, significant at 1% level). Thus, the larger the number of companies, the lower the number of unemployed persons.
The results show that the financial inputs do not have a significant influence on economic prosperity, while the structural factors do, which means that the second hypothesis is partially validated.
The recent decreases in child mortality rates in the developing world were due to modern health interventions [54], but, in Romania, there is room for improving life quality and children’s situations, despite the continuous economic growth. This is directly related to the reduction in poverty rate, although there is no official measurement of poverty in our country [25]. According to Bodea and Herman [55], there is possibilities of increases in labour productivity, a lower level of self-employment, and a high rate of employed population with tertiary education, which would decrease employment vulnerability in Romania.
5. Discussion and Conclusions
The interest and the novelty of the present scientific research, as well as the decisive premises established when choosing the subject, come from the increased interest in choosing and analysing the evolution of factors in order to evaluate the economic and sustainable prosperity of Romania for all regions in the country, using a wide data range for a large period of time. From the results of our research, we consider this study useful for ensuring sustainable and economic prosperity of the analysed regions to adapt to the future challenges regarding growth and innovation and to improve the administrative capacity of institutions to ensure future sustainability.
Our research aims to find policies that must be implemented in order to increase the economic prosperity of all regions in Romania, such as permanent meetings regarding the opinions of professional organizations experts and the central and the regional authorities, concerning the administrative burden on private companies.
The inventory on the existing administrative procedures that have a negative impact on the business environment through excessive bureaucracy are:
- discussing the existing fiscal policies and their permanent actualization for private companies, respectively, for innovative SMEs (which could bring significant advantages to any region in our country, as they are more productive and sometimes more technologically advanced compared to the ones on the market, and make a direct contribution to the improvement of regional competitiveness);
- understanding and agreeing on the evolution of the regulatory forms, respectively—i.e., the number, the volume and the major fields that are progressively regulated in order to reach a systematized and simplified active regulatory form;
- grouping and merging the proposals regarding the removal of bureaucratic procedures that alter the activity of operators in the business environment;
- developing a working frame designed to assist the decision of reducing the administrative burden on the business environment, including on the companies that activate in the RDI field.
During these difficult times, we deem that European funds are the strong point of our country, assuming the state manages to attract them, and are necessary to ensure economic growth. Therefore, 2021 will register an economic growth between 3% and 4.2%, but it will not manage to compensate for the drop of 2020. Even if there are growth forecasts of more than 4% in an optimistic scenario, the evolution of the medical situation within the current pandemic context shall have a strong influence on the economic development in our country.
For the purposes of our research, various econometric models and procedures were used: Pearson’s correlation coefficient, linear regression, analysis of variance (ANOVA with 136 observations), Welch and Brown–Forsythe test, post hoc LSD test, and Hausman’s test. A descriptive statistical analysis setting the mean, the standard deviation (SD), and the minimum (min) and maximum (max) values of each variable used in the model was also performed.
As working assumptions, two hypotheses were used related to prosperity and its determining factors, grouped into two categories (sustainable, financial and structural, respectively) as follows: H1: Romania’s economic prosperity is significantly influenced by the sustainability factors related to children’s survival rates, poverty and education and H2: Romania’s economic prosperity is significantly influenced by financial and structural factors related to profitableness, the dynamic of the business environment and the occupation of the workforce. Hypotheses shall be tested using SPSS 25.0 and Eviews 10.
This study identifies several macroeconomic factors influencing GDP per capita and sustainable economic growth in the country.
In this study, we applied an econometric model which helped us to identify the factors influencing sustainable economic growth in Romania and the evolution of GDP per capita in the eight macroregions and we identified strong relationships between education, poverty eradication and improvement of the health system.
We have noticed, subsequent to the use of the macroeconometric models, that, at national and regional levels, with data panel and GDP per capita, seven out of eight macroregions are comparable. The exception is macroregion 8, with a GDP per capita value more than double those of rest of the country, which shows a misbalance between the capital region and other counties. The results are confirmed by the post hoc LSD test which presents significant differences (1% level) between macroregion 8 and the other seven. The displayed outcomes emphasize that the economic growth is negatively and significantly correlated to unemployment rate, poverty rate and child survival rate, but positively related to the number of active companies in each region of the country.
The used econometric procedures underline the desired outcomes: child survival rate and poverty rate have a significant and negative influence on the economic prosperity of one region, respectively, and a positive influence of a sustainable economy is represented by the decrease in mortality rate of new-borns as a sign of progress, at regional and social levels, which must be a permanent goal for Romania. Additionally, a decrease in poverty rate and social exclusion, the increase in income of the poor population, and the increasing number of companies determining a lower unemployment rate are aspects that determine an increase in GDP, respectively, which ensures the economic prosperity of a country.
Our results generally agree with those of Oestergaard et al. (2011) [44] and Noel and Koyama [45] as, from a macroeconomic perspective, unemployment rate and infant mortality rate of urban and rural areas, risk of poverty, number of educational units, net profit-to-turnover ratio, the ratio between the number of unemployed and employed persons, the number of companies active in macroregions and sustainable economic growth show us the situation of the Romanian economy, where the GDP per capita is clearly linked to the evolution of these socio-economic factors. In accordance with the research of Jovovic et al. [54] and Andrei et al. [25], we can conclude that sustainable economic growth depends on the effective application of public policies, which are linked to the evolution of these factors. We cannot list all the causes leading to the aforementioned evolution as they depend on macrofactors and the specific features of each macroregion.
There is a strong need for infrastructure and human capital in all macroregions. Over the last decade, all macroregions continue to face socio-economic challenges. Large areas of the country lack the conditions for the transition to a dynamic, high added value and knowledge-oriented economy.
The research in the present study shows that Romania reported, for the analysed time (2000–2016) and according to the data provided by the National Institute of Statistics (henceforth NIS), the highest infant mortality in the European Union of 7.6 deaths per 1000 live births, more than twice higher than EU average of 3.6/1000 live births, followed by Bulgaria (6.6) and Malta (5.8). Additionally, the data show that Romania spent the least on health and education, ranking in 2016 as the second poorest state in the EU.
On the other hand, Romania slightly exceeded Croatia by GDP per capita in purchasing power parity, a key indicator measuring the real level of development of nations, reaching 59% of the EU average. NIS data show that in 2016 Romania reached a GDP per capita level at purchasing power parity of EUR 17,200, compared to EUR 17,100 for Croatia and EUR 13,900 for Bulgaria [38].
Three of the eight Romanian macroregions are among the 20 poorest regions in the EU [38]. The macroregion which includes the capital of Romania, Bucharest, is experiencing the most important economic development, followed by the west, centre and north-west regions, while the regions of south-west Oltenia (with a GDP of 42% of the EU average) and north-east (with a GDP of 36% of the EU average) are lagging behind.
At the national level, GDP represents around 60% of the EU average [55]. The Bucharest–Ilfov region recorded one of the highest rates of GDP growth per capita in the EU in 2007–2015 (Regional Year-Book, Eurostat 2017).
Different development patterns require tailored investment priorities. Rapidly growing metropolitan areas increasingly face development challenges related to suburbanization, congestion and pollution. Smaller cities and surrounding areas, however, face challenges related to access to the labour market, education, healthcare and other social services. As a result, the rural–urban gap is increasingly evident. Poverty is a common phenomenon in rural areas where skills and employability are low and connectivity to centres of economic opportunity is weak. Improving connectivity for less developed rural communities requires significant additional investment. The low administrative capacity of municipalities is restricting development opportunities. The capacity of urban authorities for strategic planning as well as for effective coordination and cooperation is limited, which does not allow them to make full use of development and funding opportunities. For smaller municipalities, the scale is an additional challenge, both in terms of administrative capacity and the potential for efficient delivery of public services.
The biggest challenge in achieving sustainable development goals through the implementation of effective public policies in the field of research lies with the government through its institutions that aim to introduce measures to combat poverty at the national level by 2030. Some of the key measures, related to increasing employment rates, reducing early school leaving, extending national health programs and others, will help to diminish the urban–rural poverty gap: minimum inclusion income, family support allowance, heat aid, and guaranteed minimum income.
We believe that legislation will be an operational tool that will identify and assess poor people and intervene with benefits, services and other targeted and personalized measures.
Further efforts are needed to ensure that measures on poverty reduction and social inclusion are sustainable and irreversible in Romania. Three major policy areas are particularly critical to address social inclusion: access to education is a pillar of poverty eradication and has the potential to be one of the most important “equalizers” in society; access to equal employment opportunities is essential for all, especially in rural areas; as well as equal access to public services, such as healthcare, adequate housing, running water and sanitation; these have the potential to break the cycle of exclusion and limited access to opportunities for the analysed macroregions.
Our future research intends to identify new proprieties of sustainable development, select new indicators, and set innovative standards for the indicators of economic prosperity and sustainable development; determine mathematic models that shall quantify the particular results for various activity fields; use statistical analysis to examine the values of sustainable development functions and of different indicators, together with the interpretation of results and subsequent solution proposals. The awareness and solving of new optimization issues requires identification of the components of sustainable development. The approach to achieve sustainable development should use comparative analyses at the SME level in the eight regions of the country.
In conclusion, a management approach is required to focus on policies that need to be targeted at helping the poor, vulnerable and most marginalized members of the community. There is a broad spectrum of sectorial policies, programs and interventions meant to decrease poverty and social exclusion that require, in our opinion, better and effective coordination. Given the strong correlation between poverty and social exclusion, progress on both fronts will require more and better social and quality interventions, connecting people with jobs, financial support and services. Another essential element is to improve capacity to properly assess the need at all levels and coordinate social services, employment services and health services, so that those who are not working but are able to work return to work. Consequently, this approach concerning fighting poverty and social exclusion relies on the concept of integrated service provision and on ensuring that different programs and interventions are harmonized and aligned.
Author Contributions
Conceptualization, I.O.M.C., C.N. and D.R.C.; Investigation, I.O.M.C.; Methodology, I.O.M.C., C.N. and D.R.C.; Resources, F.M.; Software, D.R.C. and F.M.; Supervision, F.M.; Validation, D.R.C.; Writing—original draft, D.R.C.; Writing—review and editing, C.N. and F.M. All authors have read and agreed to the published version of the manuscript.
Funding
This work was funded by the project “Excellence, Performance and Competitiveness in Research, Development and Innovation Activities at ‘Dunarea de Jos’ University of Galati” (“EXPERT”), financed by the Romanian Ministry of Research and Innovation in the framework of Programme 1—Development of the National Research and Development System, subprogramme 1.2—Institutional Performance—Projects for Financing Excellence in Research, Development and Innovation, Contract no. 14PFE/17.10.2018.
Institutional Review Board Statement
Not applicable.
Informed Consent Statement
Not applicable.
Data Availability Statement
Not applicable.
Conflicts of Interest
The authors declare no conflict of interest.
References
- National Institute of Statistics, Social Tendencies, 2019. Available online: https://insse.ro/cms/sites/default/files/field/publicatii/tendinte_sociale.pdf (accessed on 15 December 2020).
- EU Commission. GDP and beyond: Measuring Progress in a Changing World. Available online: https://ec.europa.eu/eurostat/cros/content/gdp-and-beyond-measuring-progress-changing-world_en (accessed on 12 March 2021).
- Resolution adopted by the General Assembly on 25 September 2015. Transforming Our World: The 2030 Agenda for Sustainable Development. Available online: https://www.un.org/en/development/desa/population/migration/generalassembly/docs/globalcompact/A_RES_70_1_E.pdf (accessed on 25 November 2020).
- Stefko, R.; Gavurova, B.; Ivankova, V.; Rigelsky, M. Gender Inequalities in Health and Their Effect on the Economic Prosperity Represented by the GDP of Selected Developed Countries—Empirical Study. Int. J. Environ. Res. Public Health 2020, 17, 3555. [Google Scholar] [CrossRef]
- Blum, J.; Gründler, K. Political Stability and Economic Prosperity: Are Coups Bad for Growth? CESifo Working Paper No. 8317. 2020. Available online: https://ssrn.com/abstract=3618841 (accessed on 10 March 2021).
- Dinçer, H.; Yüksel, S.; Şenel, S. Analyzing the Global Risks for the Financial Crisis after the Great Depression Using Comparative Hybrid Hesitant Fuzzy Decision-Making Models: Policy Recommendations for Sustainable Economic Growth. Sustainability 2018, 10, 3126. [Google Scholar] [CrossRef]
- Boar, A.; Bastida, R.; Marimon, F. A Systematic Literature Review. Relationships between the Sharing Economy, Sustainability and Sustainable Development Goals. Sustainability 2020, 12, 6744. [Google Scholar] [CrossRef]
- Kluge, T.; Cowan, T.E.; Debus, A.; Schramm, U.; Zeil, K.; Bussmann, M. Kluge et al. Repl. Phys. Rev. Lett. 2013, 111, 219502. [Google Scholar] [CrossRef] [PubMed]
- Aevoae, G.M.; Dicu, R.; Mardiros, D. How do the foreign direct investments flow? The case of the cross-border M&As in the European Union. Account. Manag. Inf. Syst. 2018, 17, 641–662. [Google Scholar]
- Bhargava, A.; Jamison, D.T.; Lau, L.J.; Murray, C.J. Modeling the effects of health on economic growth. J. Health Econ. 2001, 20, 423–440. [Google Scholar] [CrossRef]
- Geloso, V.J.; Alexander, W. Salter, State capacity and economic development: Causal mechanism or correlative filter? J. Econ. Behav. Organ. 2020, 170, 372–385. [Google Scholar] [CrossRef]
- Murga-Menoyo, M.Á. Learning for a Sustainable Economy: Teaching of Green Competencies in the University. Sustainability 2014, 6, 2974–2992. [Google Scholar] [CrossRef]
- Cheba, K.; Bąk, I.; Szopik-Depczyńska, K. Sustainable competitiveness as a new economic category—definition and measurement assessment. Technol. Econ. Dev. Econ. 2020, 26, 1399–1421. [Google Scholar] [CrossRef]
- Armeanu, D.S.; Vintila, G.; Gherghina, S.C. Empirical study towards the drivers of sustainable economic growth in EU-28 Countries. Sustainability 2018, 10, 4. [Google Scholar] [CrossRef]
- Linkov, I.; Trump, B.D.; Poinsatte-Jones, K.; Florin, M.-V. Governance Strategies for a Sustainable Digital World. Sustainability 2018, 10, 440. [Google Scholar] [CrossRef]
- Gabor, M.R.; Blaga, P.; Matis, C. Supporting Employability by a Skills Assessment Innovative Tool—Sustainable Transnational Insights from Employers. Sustainability 2019, 11, 3360. [Google Scholar] [CrossRef]
- Agapie, A.; Vizitiu, C.; Cristache, S.E.; Năstase, M.; Crăciun, L.; Molănescu, A.G. Analysis of Corporate Entrepreneurship in Public R&D Institutions. Sustainability 2018, 10, 2297. [Google Scholar]
- Acs, Z.J.; Estrin, S.; Mickiewicz, T.; Szerb, L. Entrepreneurship, institutional economics, and economic growth: An ecosystem perspective. Small Bus. Econ. 2018, 51, 501–514. [Google Scholar] [CrossRef]
- Meyer, D.; Shera, A. The impact of remittances on economic growth: An econometric model. EconomiA 2017, 18, 147–155. [Google Scholar] [CrossRef]
- Popkova, E.G.; Aleksei, V.B.; Ragulina, Y.V. Perspective Model of Activation of Economic Growth in Modern Russia. In Management of Changes in Socio-Economic Systems; Springer: Cham, Switzerland, 2018; Volume 135, ISBN 978-3-319-72612-0. [Google Scholar]
- Camera, G.; Deck, C.; Porter, D. Do economic inequalities affect long-run cooperation and prosperity? Exp. Econ. 2020, 23, 53–83. [Google Scholar] [CrossRef]
- Na, Y.K.; Kang, S. Effects of core resource and competence characteristics of sharing economy business on shared value, distinctive competitive advantage, and behavior intention. Sustainability 2018, 10, 3416. [Google Scholar] [CrossRef]
- Dicu, R.M.; Toma, C.; Aevoae, G.M.; Mardiros, D.N. The Influence of Deal Value’s Determinants in Mergers and Acquisitions with Community Dimension: Some Empirical Evidence from the European Union. Transform. Bus. Econ. 2019, 18, 42–59. [Google Scholar]
- Al-Ghobashi, M. UN Report Monitors the Future of the Global Aims of Sustainable Development in Light of the Outbreak of the Corona Virus. 2020. Available online: https://www.csregypt.com/%d8%aa%d9%82%d8%b1%d9 (accessed on 10 March 2021).
- Andrei, J.V.; Gogonea, R.M.; Zaharia, M.; Patrascu, A.; Bălăcescu, A.; Ladaru, R.G. A Critical ApproachonUsingTotalWaterFootprintofAgriculturalProductsasaPotentialSustainableDevelopmentIndicator. Teh. Vjesn. 2020, 27, 671–679. [Google Scholar]
- Bercu, A.M. The Sustainable Local Development in Romania—Key Issues for Heritage Sector. Procedia Soc. Behav. Sci. 2015, 188, 144–150. [Google Scholar] [CrossRef][Green Version]
- Doyle, E.; Perez Alaniz, M. Dichotomous impacts on social and environmental sustainability: Competitiveness and development levels matter. Compet. Rev. 2020. [Google Scholar] [CrossRef]
- Linkov, I.; Palma-Oliveira, J.M. (Eds.) Resilience and Risk; Springer: Amsterdam, The Netherland, 2017. [Google Scholar]
- Retamal, M. Product-service systems in Southeast Asia: Business practices and factors influencing environmental sustainability. J. Clean. Prod. 2017, 143, 894–903. [Google Scholar] [CrossRef]
- Dagilienė, L.; Bruneckienė, J.; Jucevičius, R.; Lukauskas, M. Exploring smart economic development and competitiveness in Central and Eastern European countries. Compet. Rev. 2020, 30, 485–505. [Google Scholar] [CrossRef]
- Krishnan, S.; Teo, T.S.; Lim, V.K. Examining the relationships among e-government maturity, corruption, economic prosperity and environmental degradation: A cross-country analysis. Inf. Manag. 2013, 50, 638–649. [Google Scholar] [CrossRef]
- Bosma, N.; Content, J.; Sanders, M. Institutions, entrepreneurship, and economic growth in Europe. Small Bus. Econ. 2018, 51, 483–499. [Google Scholar] [CrossRef]
- Tranfield, D.; Denyer, D.; Smart, P. Towards a Methodology for Developing Evidence-Informed Management Knowledge by Means of Systematic Review. Br. J. Manag. 2003, 14, 207–222. [Google Scholar] [CrossRef]
- Fistung, F.D.; Antonescu, D.; Popescu, T.; Miroiu, R. Sustainable regional development, an ew concept or a necessity? In OECONOMICA; Chapter: Regional development; Romanian Society of Economy SOREC: Bucharest, Romania, 2015. [Google Scholar]
- Cirkvenčič, F.; Bertoncel, T.; Bertoncelj, A.; Meško, M. Analysis of relative prosperity in Romania and Slovenia using the being-loving-having model. Amfiteatru Econ. 2017, 19, 822–835. [Google Scholar]
- Abbott, P.; Wallace, C. Rising economic prosperity and social quality the case of New Member States of the European Union. Soc. Indic. Res. 2014, 115, 419–439. [Google Scholar] [CrossRef]
- Emir, F.; Bekun, F.V. Energy intensity, carbon emissions, renewable energy, and economic growth nexus: New insights from Romania. Energy Environ. 2019, 30, 427–443. [Google Scholar] [CrossRef]
- National Institute of Statistics, Statistical Yearbook of Romania, 2016. Available online: https://ec.europa.eu/eurostat/statistics-explained/index.php?title=Main_Page (accessed on 10 December 2020).
- Asumadu-Sarkodie, S.; Owusu, P.A. The casual nexus between child mortality rate, fertility rate, GDP, household final consumption expenditure, and food production index. Cogent Econ. Financ. 2016, 4, 1191985. [Google Scholar] [CrossRef]
- Martines, J.; Paul, V.K.; Bhutta, Z.A.; Koblinsky, M.; Soucat, A.; Walker, N. Lancet Neonatal Survival Steering Team. Neonatal survival: A call for action. Lancet 2005, 365, 1189–1197. [Google Scholar] [CrossRef]
- Collier, P.; Dollar, D. Aid allocation and poverty reduction. Eur. Econ. Rev. 2002, 46, 1475–1500. [Google Scholar] [CrossRef]
- Beck, T.; Demirguc-Kunt, A.; Levine, R. SMEs, growth, and poverty: Cross-country evidence. J. Econ. Growth 2005, 10, 199–229. [Google Scholar] [CrossRef]
- Hadri, K.; Larsson, R. Testing for stationarity in heterogeneous panel data where the time dimension is finite. Econom. J. 2005, 8, 55–69. [Google Scholar] [CrossRef]
- Oestergaard, M.Z.; Inoue, M.; Yoshida, S.; Mahanani, W.R.; Gore, F.M.; Cousens, S.; Mathers, C.D. Neonatal mortality levels for 193 countries in 2009 with trends since 1990: A systematic analysis of progress, projections, and priorities. PLoS Med. 2011, 8, e1001080. [Google Scholar] [CrossRef]
- Noel, D.J.; Koyama, M. States and economic growth: Capacity and constraints. Explor. Econ. Hist. 2017, 64, 1–20. [Google Scholar]
- Mulholland, E.K.; Smith, L.; Carneiro, I.; Becher, H.; Lehmann, D. Equity and child-survival strategies. Bull. World Health Organ. 2008, 86, 399–407. [Google Scholar] [CrossRef]
- Zamfir, C. Poverty in Romania; CASPIS: Bucharest, Romania, 2001. [Google Scholar]
- Zhang, Q.; Larkin, C.; Lucey, B.M. The economic impact of higher education institutions in Ireland: Evidence from disaggregated input–output tables. Stud. High. Educ. 2017, 42, 1601–1623. [Google Scholar] [CrossRef]
- Europen Commission. Available online: https://ec.europa.eu/regional_policy/en/newsroom/coronavirus-response/#23 (accessed on 10 March 2021).
- ROMÂNIA—Internal Market, Industry, Entrepreneurship And Smes—European Commission, Uniunea Europeana, Romania. Available online: https://ec.europa.eu/growth/tools-databases/regional-innovation-monitor/region/rom%C3%A2nia (accessed on 11 March 2021).
- Anastassiou, T.; Dritsaki, C. Tax revenues and economic growth: An empirical investigation for greece using causality analysis. J. Soc. Sci. 2018, 1, 99–104. [Google Scholar] [CrossRef]
- Saqib, S.; Ali, T.; Riaz, M.F.; Anwar, S.; Aslam, A. Taxation Effects on Economic Activity in Pakistan. J. Financ. Econ. 2014, 2, 215–219. [Google Scholar] [CrossRef]
- Dollar, D.; Kraay, A. Growth is Good for the Poor. J. Econ. Growth 2002, 7, 195–225. [Google Scholar] [CrossRef]
- Jovvic, R.; Draskovic, M.; Delibasic, M.; Jovovic, M. Theconcept of sustainable regional development—Institution alaspects, policiesand prospects. J. Int. Stud. 2017, 10, 255–266. [Google Scholar] [CrossRef] [PubMed]
- Bodea, G.; Herman, E. Factors behind working poverty in Romania. Procedia Econ. Financ. 2014, 15, 711–720. [Google Scholar] [CrossRef]
Publisher’s Note: MDPI stays neutral with regard to jurisdictional claims in published maps and institutional affiliations. |
© 2021 by the authors. Licensee MDPI, Basel, Switzerland. This article is an open access article distributed under the terms and conditions of the Creative Commons Attribution (CC BY) license (https://creativecommons.org/licenses/by/4.0/).