Abstract
As an essential component for the development of the Xiong’an New Area, China’s second capital, groundwater in the area has been overexploited, resulting in ecological and environmental geological problems. Therefore, artificial groundwater replenishment measures are urgently required, for which the evaluation of the recharge potential is an important prerequisite. In this study, a GIS (Geographic Information System)-based multi-criteria evaluation system was constructed, considering the source water conditions, recharge infiltration conditions, aquifer storage conditions, and environmental conditions. In addition, factors such as the distance to a canal, source water quality, slope, vadose zone infiltration rate, drainage density, groundwater depth, aquifer hydraulic conductivity, aquifer thickness, groundwater quality, soil quality, and distance to sensitive areas were also analyzed. GIS was used to draw and calculate potential artificial recharge sites. The results showed that the potential recharge sites in the study area are mainly distributed in the alluvial plains on both sides of the river, with a total area of 2103.9 km2, accounting for 15.8% of the total study area. In the Xiong’an New Area, the potential sites are mainly distributed in the alluvial–proluvial plains on both sides of the Baigou River in the north-central area, with a total area of 39.4 km2, accounting for approximately 2.2% of the total area of the Xiong’an New Area.
1. Introduction
Groundwater is an extremely valuable and highly important resource with multiple uses [1]. Owing to its wide global demand [2], groundwater has been overexploited in many areas around the world, leading to ecological and environmental problems. Therefore, groundwater recharge is an important factor for sustainable groundwater management. The recharge of natural and artificial aquifers has gradually become a potential mechanism for managing groundwater resources [3,4]. The ecological and environmental problems associated with the overexploitation of groundwater can be overcome using artificial groundwater recharge technology [5,6,7]. An important prerequisite for artificial groundwater recharge is the evaluation of recharge potential, in which the suitability of sites for groundwater artificial recharge is assessed. The evaluation results are closely related to the effectiveness of the artificial recharge.
In artificial groundwater recharge, a preliminary concern is the existence of a rechargeable water source [8]. Groundwater recharge from the unsaturated zone into the saturated zone [9] occurs only when water flows and seeps into the saturation zone [10]. The vadose zone serves as a recharge channel [11], and its storage capacity depends on the aquifer’s storage space [12]. Environmental pollution conditions are also an important factor affecting the quality of replenishment water [13]. Therefore, while evaluating recharge potential, the following four aspects should be considered: source water conditions, recharge infiltration conditions, aquifer storage conditions, and environmental conditions. According to the specific site characteristics, the key factors and indicators affecting the artificial recharge of groundwater can be screened considering the abovementioned aspects. Thereby, a more comprehensive, systematic, and scientific evaluation of the potential of artificial groundwater recharge can be achieved.
Suitable sites for artificial replenishment can be identified using multi-criteria methods, in which a number of influencing factors are considered, and each evaluation indicator is screened out with combinations of indicators. Subsequently, the suitability of the artificial groundwater recharge of each unit in the target area can be evaluated according to the combination of the indicator weights. Multi-criteria evaluation methods are preferred over other methods—such as single-criteria evaluation methods, experimental methods, and numerical simulation methods [14,15,16,17,18,19]—because they can gather information on several impact indicators, and are simple and intuitive to use [20,21]. In previous weight determination methods, some subjective weighting evaluation methods—such as the expert consultation weighting method (Delphi method), analytic hierarchy process, and fuzzy comprehensive evaluation methods [22,23,24]—have generally been used. However, subjective weighting methods are dependent on the experience or preference of the decision maker. In contrast, objective weighting methods—such as the entropy weight method and Technique for Order of Preference by Similarity to Ideal Solution [25,26]—determine the weight according to the amount of information provided by each criterion, facilitating accurate evaluation results. A powerful tool for multi-criteria comprehensive evaluation is Geographic Information System (GIS) technology [14]. It has the functions of the input, storage, management, retrieval, processing, and comprehensive analysis of geospatial data and information. GIS can also be used to draw various indicators related to groundwater recharge [27,28]. The final graph is obtained by multiplying and combining each criterion by its weight.
The plain area of the Daqing river catchment is one of the areas in the North China Plain experiencing the most severe water shortage. In this area, groundwater resources account for only 24% of the total water resources, and groundwater supply accounts for approximately 85% of the total water supply. The excessive exploitation of groundwater over a long period of time has caused a series of geo-environmental problems in the area, such as the decline of the regional groundwater level, the drainage of aquifers, and land subsidence. As the second capital of China—the Xiong’an New Area—is located in this area, water resources are highly important. However, the shortage of water resources and over-exploitation of groundwater restrict the development of the Xiong’an New Area. Therefore, artificial groundwater recharge has become a crucial consideration for the area.
This study aimed to develop a GIS-based multi-criteria evaluation method to map potential groundwater recharge sites in the plain area of the Daqing River catchment. The multi-criteria evaluation method considers source water conditions, recharge infiltration conditions, aquifer storage conditions, environmental conditions, and factors such as the distance to a canal, source water quality, slope, vadose zone infiltration rate, drainage density, depth to groundwater, hydraulic conductivity of the aquifer, aquifer thickness, groundwater quality, soil quality, and distance to sensitive areas. The entropy weight method was used to calculate the indicator weight, and GIS was used to draw indicators and determine the potential recharge sites in the study area.
2. Study Area
The plain area of the Daqing River catchment is located in the middle North China Plain, and includes six districts: four in Hebei Province and two in Beijing (Figure 1). The Xiong’an New Area, also known as China’s ‘second capital’, lies in the east, with a total area of approximately 13,338 km2.
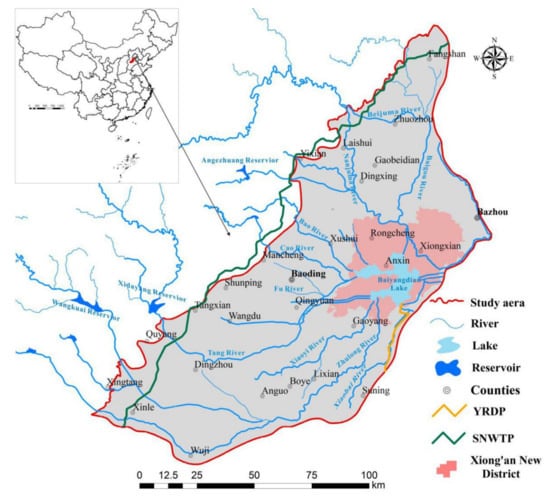
Figure 1.
Location map of the study area.
There are many rivers in the plain area of the Daqing river catchment, originating from the eastern part of the Taihang Mountains in the west. They are mainly divided into northern and southern branches. The northern branch includes the Juma River and its tributaries. The southern branch consists of the Ping River, Bao River, Cao River, Jie River, Fu River, Qingshui River, Tang River, Dasha River, Xiaoyi River, and Zhulong River. All the rivers merge into Baiyangdian, which is the largest lake on the Haihe Plain. The rivers in the study area are regulated by upstream reservoirs, such as the Wangkuai Reservoir, Xidayang Reservoir, Angezhuang Reservoir, and Longmen Reservoir. These reservoirs were constructed for flood control, comprehensively considering urban and industrial water supply, irrigation, and power generation. In addition, large-scale water transfer projects, including the Yellow River Diversion Project (YRDP) into Hebei and the Middle Route Project of the South-to-North Water Diversion Project (SNWDP) cover the study area.
The groundwater system consists of four different aquifer groups. The groundwater of the first and second aquifer groups is called shallow groundwater. The lithology of the aquifers is mainly medium and fine silt, and fine sand. The aquifers have a thickness of generally less than 40 m, and a bottom boundary depth of generally 150–180 m. The groundwater of the third and the fourth aquifer groups is called deep groundwater. The lithology is mainly coarse, medium, and fine sand. The aquifers have a thickness of generally 100–180 m, and a bottom boundary depth of generally 350–600 m. In the study area, the shallow aquifers are the main target for exploitation. This study also focused on shallow layers for artificial replenishment.
3. Materials and Methods
3.1. Data Acquisition
The data on the rivers were obtained from remote sensing images of the four-dimensional earth (https://siweiearth.com/) (1 December 2019). The spatial coordinate reference system is the World Geodetic System 1984 (WGS 84) (EPSG: 4326), with a resolution of 2 m. The distance to a canal was extracted and analyzed by spatial distance calculation with ArcGIS software [29]. The Drainage Density was derived through hydrological analysis with ArcGIS. The slope data were derived from a Digital Elevation Model (DEM) obtained from http://www.gscloud.cn/ (1 December 2019), at a spatial resolution of 30 m. All these data were prepared as shapefiles which were compatible for integration within a GIS environment.
3.2. Sampling and Investigation
The source water quality, groundwater quality, and soil quality data were obtained through field sampling. The vadose zone infiltration rate and depth to groundwater data were obtained from field testing. The distance to sensitive areas data were obtained through field investigation. The aquifer hydraulic conductivity and thickness data were derived from hydrogeological survey data. The sampling and investigation information are specified in Figure 2 and Table 1.
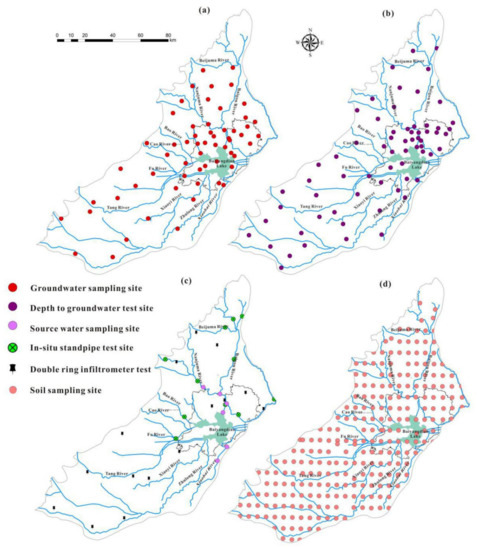
Figure 2.
Location of the sampling sites. (a) Groundwater sampling site. (b) Groundwater depth measurement site. (c) Source water sampling site, in-situ standpipe test, and double ring infiltrometer test site. (d) Soil sampling site.

Table 1.
Sampling and investigation (2019.4).
3.3. Methodological Framework
Figure 3 illustrates the method of identifying potential artificial groundwater recharge sites. Data from different sources and several field experiments were used to create thematic maps of the distance to a canal, source water quality, slope, vadose zone infiltration rate, drainage density, depth to groundwater, aquifer hydraulic conductivity, aquifer thickness, groundwater quality, soil quality, and distance to sensitive areas. After the data preparation and processing, each factor was reclassified according to its importance to artificial groundwater recharge. The weight was calculated using the entropy method in order to provide a fair and comprehensive weight to the factors used. Subsequently, the reclassified theme maps and their corresponding weights were integrated through GIS overlay analysis.
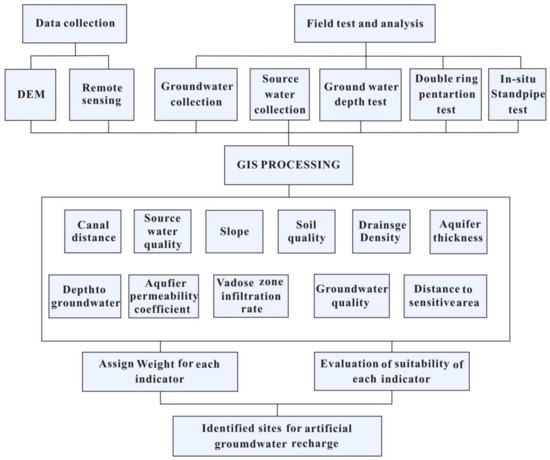
Figure 3.
Methodology adopted for the identification of potential suitable areas for artificial recharge.
3.4. Multi-Criteria Evaluation Method
The procedure of the proposed GIS-based multi-criteria evaluation method is as follows. First, the multi-criteria method was used to select the evaluation indicators. Then the weight of each indicator was calculated using the entropy weight method. Finally, GIS was used to map all of the indicators, and the weighted linear combination method was applied. In this manner, potential recharge sites in the study area can be determined. The specific evaluation model is as follows.
We divided the study area into i evaluation units, A1, A2, ..., Ai, and used j indicators, C1, C2, ..., Cj, to evaluate the suitability of these evaluation units to obtain an i × j order matrix (Equation (1)):
where xij is a real number, representing the score of the j-th indicator Cj of the i-th unit Ai, assuming that the weight of the indicator Cj is wj (j = 1, 2, ..., m).
We standardized the data of each indicator, assuming that the standardized value of each indicator is Yij (i = 1,2, ..., i; j = 1,2, ..., j). Then,
Equation (2) was used as standardized calculation formula for the indicator:
where Yij is the value of the standardized indicator; is the original value of the indicator; and and are the maximum and minimum values of the j indicator in each area.
Equation (3) was used to calculate the information entropy:
where , if .
Then, define .
Equation (4) was used as the calculation formula for the weight:
Equation (5) was used to calculate the comprehensive score Si of the suitability of the artificial recharge of groundwater. Si was determined using the weighted linear combination method, which is the most widely used GIS-based approach for multi-criteria evaluation [30].
3.5. Evaluation Indicator System
The evaluation of the suitability of artificial groundwater recharge involves numerous and complex indicators. Therefore, they must be first organized, structured, and hierarchically arranged. Then, a model with a hierarchical analysis function should be built. Complex issues should be simplified in the form of constituent elements, and should then be combined according to attributes in order to form different levels. In the multi-criteria evaluation model, each indicator can generally be divided into the following three levels:
- The target layer: there is only one element in this layer, which is the preset goal or expected result of complex problems.
- The criterion layer: this is the middle level for achieving the goal and the criteria to be considered, and it can be composed of several levels.
- The indicator layer: this layer includes the specific indicators selected to support the elements of the criterion layer, and to achieve the ultimate goal of the target layer.
In this indicator system, the target layer is the suitability of artificial groundwater recharge. The criterion layer is composed of the source water conditions, recharge infiltration conditions, aquifer storage conditions, and environmental conditions. The indicator layer is an important supporting part of each criterion layer, and it is a key element which affects the effect of artificial groundwater recharge. Each indicator is determined on the basis of the full analysis of the actual conditions of the study area, and the comprehensive results of previous research and consulting experts. The indicator system and its attributes are shown in Table 2.
Table 2.
Evaluation indicator system for the suitability of artificial groundwater recharge.
4. Results and Discussion
4.1. Water Source Conditions
4.1.1. Distance to a Canal
When the distance between the recharge project and the canal exceeds 3 km, the construction cost and the risk of the contamination of the recharge water will greatly increase [31]. The distance was divided into five grades: very good (<0.5 km), good (0.5–1.0 km), moderate (1.0–2.0 km), poor (2.0–3.0 km), and very poor (>3.0 km) [8]. Very good areas for artificial recharge are distributed on both sides of the river channel (Figure 4a).
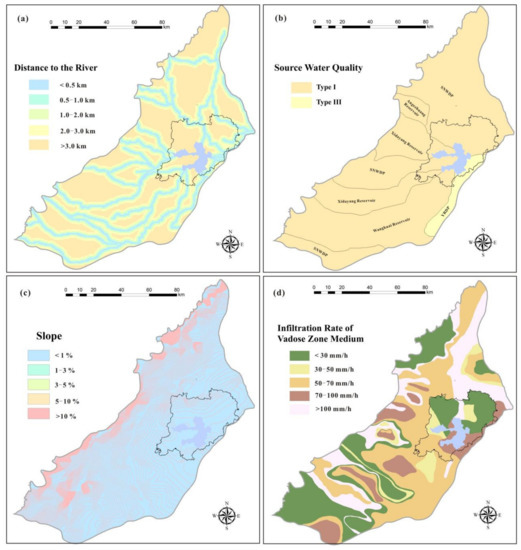
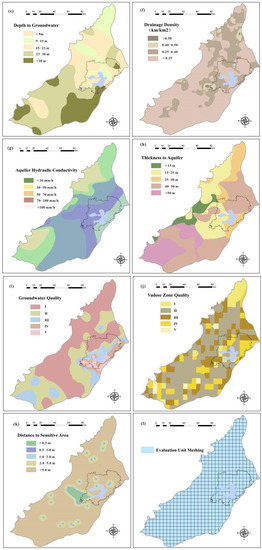
Figure 4.
Potential sites for artificial recharge: (a) distance to a canal, (b) source water quality, (c) slope, (d) vadose zone infiltration rate, (e) depth to groundwater, (f) drainage density, (g) aquifer hydraulic conductivity, (h) aquifer thickness, (i) groundwater quality, (j) soil quality, (k) distance to a sensitive area, and (l) evaluation unit meshing.
4.1.2. Source Water Quality
Limited by data availability, some studies use source water electrical conductance (EC) to determine source water quality [32]. In order to analyze the groundwater quality as comprehensively as possible, the water quality of the source water was classified into five grades based on the Standards of Groundwater Quality [33]: Class I (very good), Class II (good), Class III (moderate), Class IV (poor), and Class V (very poor). The possible supply water sources in the study area are the Wangkuai Reservoir, Xidayang Reservoir, and Angezhuang Reservoir. According to the location of the water source and the river channel, referring to the results of the spatial distance analysis in ArcGIS, the study area was divided into several small areas controlled by water sources (Figure 4b). The water quality of 95.9% of the source water in the study area is generally good.
4.2. Infiltration Conditions
4.2.1. Slope
The slope directly affects the process of runoff and infiltration [34]; higher slopes lead to more rapid runoff and less recharge [35]. According to the results of many studies [36,37,38,39,40], the most suitable slope range for artificial groundwater recharge is less than 1%. In contrast, a slope greater than 10% is not suitable for artificial groundwater recharge. The slope was divided into five grades [41]: very good (<1%), good (1 to 3%), moderate (3 to 5%), poor (5 to 10%), and very poor (>10%) (Figure 4c). In the study area, the slope gradually decreases from the northwest to the southeast, with very good to good slopes accounting for 84.01% of the total area (Figure 4c).
4.2.2. Vadose Zone Infiltration Rate
The soil texture determines the infiltration rate of the unsaturated zone. The main soil types in the study area are sand, sandy soil, fine sand, clay, and various sandwiches. Data on the infiltration rate of all types of vadose zones in the study area were obtained through different soil seepage tests. According to the infiltration rate of the unsaturated zone, the suitability of groundwater artificial recharge in the study area was divided into five grades [38]: very good (>100 mm/h), good (70–100 mm/h), moderate (50–70 mm/h), poor (30–50 mm/h), and very poor (<30 mm/h) (Figure 4d).
4.2.3. Drainage Density
Drainage density is a measure of the total length of all of the streams per unit area [42], and it is not related to the stream sequence [35]. Drainage density is related to the total length of all of the basins on the total area of the basin. Several studies have linked drainage density to the permeability of land areas [43,44,45,46]. Areas with low drainage density have high vegetation, and high porosity and permeability. Hence, areas with low drainage density have a high infiltration capacity. The drainage density of the study area was divided into four levels: good (<0.25 km/km2), moderate (0.25–0.4 km/km2), poor (0.4–0.5 km/km2), and very poor (0.5–0.75 km/km2) [47] (Figure 4e). Among them, moderate and good areas accounted for 87.1% of the total area.
4.3. Storage Conditions
4.3.1. Depth to Groundwater
Groundwater depth is the distance from the ground to the groundwater table [48]. Many scholars use the depth of the groundwater as an indicator to evaluate the groundwater storage capacity [49,50]. Based on the actual situation of the study area, the shallow groundwater depth of the study area was divided into five levels: very good (>30 m), good (23–30 m), moderate (15–23 m), poor (9–15 m), and very poor (<9 m) [51] (Figure 4f). Areas with very good and good depths in the study area accounted for 56.0% of the total area.
4.3.2. Aquifer Hydraulic Conductivity
The permeability coefficient of the aquifer indicates the permeability and water conductivity of the aquifer in the study area [12]. Areas with high aquifer hydraulic conductivity are considered favorable for recharge [52]. Considering the findings of previous studies and the actual situation of the study area, the hydraulic conductivity of the shallow aquifers in the study area was divided into five levels: very good (40–80 m/d), good (28–40 m/d), moderate (12–28 m/d), poor (4–12 m/d), and very poor (0–4 m/d) (Figure 4g). In the study area, areas with very good and good hydraulic conductivity accounted for 35.5% of the total area.
4.3.3. Aquifer Thickness
The thickness of the aquifer reflects the water storage space and water conductivity of aquifers. Considering the actual situation of the study area, the thickness of the shallow aquifers in the study area was divided into five levels: very good (>50 m), good (40–50 m), moderate (25–40 m), poor (15–25 m), and very poor (<15 m) [53,54] (Figure 4h). Areas with very good and good thickness accounted for 57.6% of the total area.
4.4. Environmental Conditions
4.4.1. Groundwater Quality
Groundwater quality is an important factor affecting the artificial recharge of groundwater. In order to determine the water quality status of groundwater in the study area, the fuzzy mathematics method was applied to more than 20 preliminarily-tested components. According to the Standards of Groundwater Quality [33], the water quality of shallow groundwater in the study area was divided into five grades: Class I (very Good), Class II (good), Class III (moderate), Class IV (poor), and Class V (very poor), as shown in Figure 4i. The better the water quality category, the higher the suitability [8]. The water quality of 80.3% of the supplementary water sources in the study area is generally good.
4.4.2. Soil Quality
The soil quality also affects the process of artificial replenishment. According to the Soil Environmental Quality Risk control standards for the Soil Pollution of Agricultural Land [55], the soil quality in the study area was divided into five levels: Class I (very good), Class II (good), Class III (moderate), Class IV (poor), and Class V (very poor) (Figure 4j). The better the soil quality, the higher the suitability. Areas with high suitability and high levels of artificial recharge of groundwater in the study area accounted for 60.3% of the total area.
4.4.3. Distance to Sensitive Areas
The distance from environmentally-sensitive areas reflects the advantages and disadvantages of artificial recharge to the environmental conditions in the study area. In general, the distance between artificial groundwater replenishment projects and environmentally-sensitive areas, such as landfills, must be greater than 500 m. With a distance of more than 5 km, environmentally-sensitive areas will not affect the artificial recharge of groundwater [56]. The distance between the recharge site and environmentally-sensitive areas can be divided into five levels: very good (>5 km), good (2–5 km), moderate (1–2 km), poor (0.5–1 km), and very poor (<1 km) (Figure 4k). Areas with very good and good distance accounted for approximately 94.5% of the total area.
4.5. Weight Calculation
In the entropy method, each evaluation unit is first divided in order to count the score value of each evaluation unit. The division of each evaluation unit is mainly based on the accuracy of the data, and follows the principle that only one score value appears in each evaluation unit. According to the above principles, the plain area of the Daqing River Basin was divided into 3 km × 3 km evaluation units, resulting in a total of 1604 evaluation units, as shown in Figure 4l.
The weights of the source water conditions, recharge infiltration conditions, aquifer storage conditions, and environmental conditions were 0.294, 0.262, 0.320, and 0.124, respectively (Table 3).
Table 3.
Evaluation indicator weights.
4.6. Identification of Suitable Sites for Artificial Recharge
In order to create the map of potential artificial recharge sites, each indicator map was given values from 1 to 5, with 5 being the best. The Weighted Sum tool in ArcGIS facilitates the combination of different maps corresponding to indicators into one integrated map by the weighted linear combination method [2]. In the resulting map, a continuous value ranging from 1.69 to 4.70 was generated. According to the classification of natural discontinuities, the suitability of artificial groundwater recharge in the study area can be divided into four grades: 3.64–4.70, suitable; 3.13–3.64, relatively suitable; 2.67–3.13, moderately suitable; and 1.69–2.67, unsuitable. The distribution of each suitability level is shown in Figure 5.
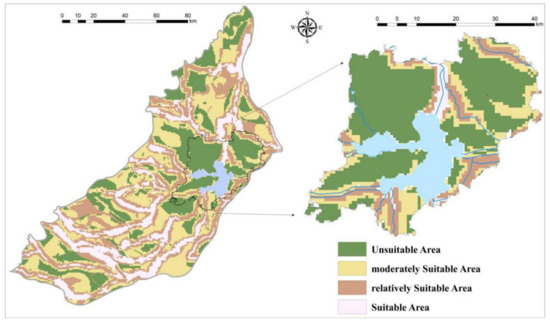
Figure 5.
Potential sites for artificial groundwater recharge in the plain area of the Daqing River Basin and Xiong’an New Area.
According to the evaluation results, the highly suitable areas are mainly distributed in alluvial–proluvial plains on both sides of the river, with a total area of 2103.9 km2, accounting for 15.8% of the total area of the study area. Specifically, relatively suitable areas cover approximately 3661.6 km2, accounting for approximately 27.5% of the total area; moderately suitable areas cover approximately 4071.0 km2, accounting for approximately 30.5% of the total area; unsuitable areas cover approximately 3127.6 km2, accounting for approximately 23.4% of the total area.
In particular, the highly suitable areas in the Xiong’an New Area are mainly located in the alluvial–proluvial plains on both sides of the Baigou River in the north-central part, with a total area of 39.4 km2, accounting for approximately 2.2% of the total area.
5. Discussion and Conclusions
In this study, 11 indicators reflecting source water conditions, recharge infiltration conditions, aquifer storage conditions, and environmental conditions were selected in order to identify potential sites for artificial groundwater recharge using a GIS-based multi-criteria method.
The entropy weight method was used to determine the weight of each criterion. The weights of the source water conditions, recharge infiltration conditions, aquifer storage conditions, and environmental conditions were 0.294, 0.262, 0.320, and 0.124, respectively.
According to the evaluation results, the highly suitable areas in the plain area of the Daqing River Basin are mainly distributed in the alluvial–proluvial plains on both sides of the river, with a total area of 2103.9 km2, accounting for 15.8% of the total area. The highly suitable areas in the Xiong’an New Area are mainly located in the alluvial-proluvial plains on both sides of the Baigou River in the north-central part, with a total area of 39.4 km2, accounting for approximately 2.2% of the total area.
The suitability was evaluated mainly considering the use of natural source water in the study area, the potential of artificial replenishment under natural infiltration conditions, and highly-maneuverable and economical artificial replenishment. The main purpose of artificial groundwater recharge is to solve the problem of water shortage and ensure a sustainable water supply in the study area. The results of this research will help managers effectively plan and execute replenishment plans to improve and sustainably supply water. The evaluation framework proposed in this study is general, and it can thus be easily replicated in the developing world and other regions of the developed world in order to evaluate the potential sites for artificial replenishment. This will help solve environmental geological problems related to groundwater, and will realize the optimized use of surface water and groundwater. Specifically, the findings of this study have important theoretical significance for guiding the construction of underground space and the restoration of the groundwater level in the Xiong’an New Area.
Author Contributions
G.X., X.S., Y.Z. and B.Y. participated in the writing of this manuscript, including the preparation of the original manuscript and the editing that followed. All authors have read and agreed to the published version of the manuscript.
Funding
This work was supported by the National Key R&D Program of China, grant number 2018YFC0406503.
Data Availability Statement
Data sharing not applicable.
Conflicts of Interest
The authors declare no conflict of interest.
References
- Todd, D.K.; Mays, L.W. Groundwater Hydrology, 3rd ed.; John Wiley & Sons: Hoboken, NJ, USA, 2005; Available online: https://www.wiley.com/en-us/GroundwaterþHydrology%2Cþ3rdþEdition-p-9780471059370 (accessed on 1 January 2020).
- Sandoval, J.A.; Tiburan, C.L., Jr. Identification of potential artificial groundwater recharge sites in mount makiling forest reserve, Philippines using GIS and analytical hierarchy process. Appl. Geogr. 2019, 105, 73–85. [Google Scholar] [CrossRef]
- Bouwer, H. Artificial recharge of groundwater: Hydrogeology and engineering. Hydrogeol. J. 2002, 10, 121–142. [Google Scholar] [CrossRef]
- Singh, S.K.; Zeddies, M.; Shankar, U.; Griffiths, G.A. Potential groundwater recharge zones within New Zealand. Geosci. Front. 2019, 10, 1065–1072. [Google Scholar] [CrossRef]
- Asano, T. Artificial Recharge of Groundwater; Butterworth Publishers: Oxford, UK; United Nations Environment Programme: Nairobi, Kenya, 1985. [Google Scholar]
- Oaksford, E. Artificial recharge: Methods, hydraulics, and monitoring. In Artificial Recharge of Groundwater; Asano, T., Ed.; Butterworth Publishers: Oxford, UK, 1985; pp. 69–127. [Google Scholar] [CrossRef]
- United Nation Environment Programme (UNEP). Artificial Recharge of Groundwater. Alternative Technologies for Freshwater Augmentation in Some Countries in Asia. 2011. Available online: http://www.unep.or.jp/ietc/publications/techpublications/techpub-8e/artificial.asp (accessed on 18 October 2017).
- Luo, F. Research on Site Suitability Evaluation of Reclaimed Water Well Irrigation and River Infiltration to Recharge Groundwater. Master’s Thesis, China University of Geosciences, Beijing, China, 2014. (In Chinese). [Google Scholar]
- Freeze, R.A.; Cherry, J.A. Groundwater; Prentice-Hall: Englewood Cliffs, NJ, USA, 1979; p. 604. [Google Scholar]
- Yeh, H.F.; Cheng, Y.S.; Lin, H.I.; Lee, C.H. Mapping groundwater recharge potential zone using a GIS approach in Hualian River, Taiwan. Sustain. Environ. Res. 2016, 26, 33–43. [Google Scholar] [CrossRef]
- Abdalla, F. Mapping of groundwater prospective zones using remote sensing and GIS techniques: A case study from the Central Eastern Desert, Egypt. J. Afr. Earth Sci. 2012, 70, 8–17. [Google Scholar] [CrossRef]
- Hantush, M. Aquifer transmissivity. In Encyclopedia of Water Science; Stewart, A.B., Howell, T., Eds.; CRC Press: New York, NY, USA, 2003; pp. 25–29. Available online: https://cfpub.epa.gov/si/si_public_record_report.cfm?dirEntryId=100243 (accessed on 23 October 2017).
- Gemitzi, A.; Tsihrintzis, V.A.; Christou, O.; Petalas, C. Use of GIS in siting stabilization pond facilities for domestic wastewater treatment. J. Environ. Manag. 2007, 82, 155–166. [Google Scholar] [CrossRef]
- Chenini, I.; Mammou, A.B.; May, M.E. Groundwater recharge zone mapping using GIS-based multi-criteria analysis: A case study in Central Tunisia (Maknassy Basin). Water Resour. Manag. 2010, 24, 921–939. [Google Scholar] [CrossRef]
- Da Costa, A.M.; de Salis, H.H.C.; Viana, J.H.M.; Leal Pacheco, F.A. Groundwater recharge potential for sustainable water use in urban areas of the jequitiba river basin, Brazil. Sustainability 2019, 11, 2955. [Google Scholar] [CrossRef]
- Jang, C.S.; Chen, S.K.; Kuo, Y.M. Applying indicator-based geostatistical approaches to determine potential zones of groundwater recharge based on borehole data. Catena 2013, 101, 178–187. [Google Scholar] [CrossRef]
- Mogaji, K.A.; Omosuyi, G.O.; Adelusi, A.O.; Lim, H.S. Application of GIS-based evidential belief function model to regional groundwater recharge potential zones mapping in hardrock geologic terrain. Environ. Process. 2016, 3, 93–123. [Google Scholar] [CrossRef]
- Rahimi, S.; Roodposhti, M.S.; Abbaspour, R.A. Using combined AHP–genetic algorithm in artificial groundwater recharge site selection of Gareh Bygone Plain, Iran. Environ. Earth Sci. 2014, 72, 1979–1992. [Google Scholar] [CrossRef]
- Wang, P. Application of GIS Multi-Criteria Decision Analysis for Managed Aquifer Suitability Mapping in China. Master’s Thesis, Institutfür Hydrologie und Meteorologie, Nanjing, China, 2017. [Google Scholar]
- Aydi, A.; Abichou, T.; Nasr, I.H.; Louati, M.; Zairi, M. Assessment of land suitability for olive mill wastewater disposal site selection by integrating fuzzy logic, AHP, and WLC in a GIS. Environ. Monit. Assess. 2016, 188, 59. [Google Scholar] [CrossRef] [PubMed]
- Duarte, L.; Teodoro, A.C.; Maia, D.; Barbosa, D. Radio Astronomy Demonstrator: Assessment of the Appropriate Sites through a GIS OpenSource Application. ISPRS Int. J. Geo-Inf. 2016, 5, 209. [Google Scholar] [CrossRef]
- Gdoura, K.; Anane, M.; Jellali, S. Geospatial and AHP-multicriteria analyses to locate and rank suitable sites for groundwater recharge with reclaimed water. Resour. Conserv. Recy. 2015, 104, 19–30. [Google Scholar] [CrossRef]
- Senanayake, I.P.; Dissanayake, D.M.; Mayadunna, B.B.; Weerasekera, W.L. An approach to delineate groundwater recharge potential sites in Ambalantota, Sri Lanka using GIS techniques. Geosci. Front. 2016, 7, 115–124. [Google Scholar] [CrossRef]
- Mahmoud, S.H.; Alazba, A.A. Identification of potential sites for groundwater recharge using a GIS-based decision support system in Jazan region-Saudi Arabia. Water Resour. Manag. 2014, 28, 3319–3340. [Google Scholar] [CrossRef]
- Chen, P. Effects of the entropy weight on TOPSIS. Expert Syst. Appl. 2021, 168, 114186. [Google Scholar] [CrossRef]
- Zhang, Y. Evaluation of Groundwater Artificial Recharge Suitability in plain area of Daqing River Basin based on GIS-EWM. Master’s Thesis, Jilin University, Changchun, China, 2020. (In Chinese). [Google Scholar]
- Thapa, R.; Gupta, S.; Guin, S.; Kaur, H. Assessment of groundwater potential zones using multi-influencing factor (MIF) and GIS: A case study from Birbhum district, West Bengal. Appl. Water Sci. 2017, 7, 4117–4131. [Google Scholar] [CrossRef]
- Kaliraj, S.; Chandrasekar, N.; Magesh, N. Identification of potential groundwater recharge zones in Vaigai upper basin, Tamil Nadu, using GIS-based analytical hierarchical process (AHP) technique. Arab. J. Geosci. 2014, 7, 1385–1401. [Google Scholar] [CrossRef]
- Navane, V.S.; Sahoo, S.N. Identification of groundwater recharge sites in Latur district of Maharashtra in India based on remote sensing, GIS and multi-criteria decision tools. Water Environ. J. 2020. [Google Scholar] [CrossRef]
- Malczewski, J. A GIS-based approach to multiple criteria group decision-making. Int. J. Geogr. Inf. Syst. 1996, 10, 955–971. [Google Scholar] [CrossRef]
- Brema, J.; Arulraj, G. Identification of sites suitable for artificial recharging and groundwater flow modeling in Noyyal river basin, Tamilnadu, India. OIDA Int. J. Sustain. Dev. 2012, 3, 45–58. [Google Scholar]
- Fondriest Environmental, Inc. Conductivity, Salinity and Total Dissolved Solids. Fundamentals of Environmental Measurements. 2014. Available online: http://www.fondriest.com/environmental-measurements/parameters/water-quality/conductivity-salinity-tds/ (accessed on 1 January 2020).
- Standards of Groundwater Quality (GB/T14848-2017). National Standards of People’s Republic of China. 2017. Available online: https://huanbao.bjx.com.cn/news/20171102/858959.shtml. (accessed on 1 January 2020).
- Gogate, N.G.; Rawal, P.M. Identification of potential stormwater recharge zones in dense urban context: A case study from Pune city. Int. J. Environ. Res. 2015, 9, 1259–1268. [Google Scholar] [CrossRef]
- Magesh, N.S.; Chandrasekar, N.; Soundranayagam, J.P. Delineation of groundwater potential zones in Theni district, Tamil Nadu, using remote sensing, GIS and MIF techniques. Geosci. Front. 2012, 3, 189–196. [Google Scholar] [CrossRef]
- Gesim, N.A.; Okazaki, T. Identification of groundwater artificial recharge sites in Herat city, Afghanistan, using Fuzzy logic. Int. J. Eng. Tech. Res. 2018, 8, 40–45. [Google Scholar]
- Ghayoumian, J.; Saravi, M.M.; Feiznia, S.; Nouri, B.; Malekian, A. Application of GIS techniques to determine areas most suitable for artificial groundwater recharge in a coastal aquifer in southern Iran. J. Asian Earth Sci. 2007, 30, 364–374. [Google Scholar] [CrossRef]
- Jasrotia, A.S.; Kumar, R.; Saraf, A.K. Delineation of groundwater recharge sites using integrated remote sensing and GIS in Jammu district, India. Int. J. Remote Sens. 2007, 28, 5019–5036. [Google Scholar] [CrossRef]
- Prabhu, M.V.; Venkateswaran, S. Delineation of artificial recharge zones using geospatial techniques in Sarabanga Sub Basin Cauvery River, Tamil Nadu. Aquat. Procedia 2015, 4, 1265–1274. [Google Scholar] [CrossRef]
- Salar, S.G.; Othman, A.A.; Hasan, S.E. Identification of suitable sites for groundwater recharge in Awaspi watershed using GIS and remote sensing techniques. Environ. Earth Sci. 2018, 77, 701. [Google Scholar] [CrossRef]
- Ghayoumian, J.; Ghermezcheshme, B.; Feiznia, S.; Noroozi, A.A. Integrating GIS and DSS for identification of suitable areas for artificial recharge, case study Meimeh Basin, Isfahan, Iran. Environ. Geol. 2005, 47, 493–500. [Google Scholar] [CrossRef]
- AgriInfo. Factors Affecting Run off. 2003. Available online: http://www.agriinfo.in/?page=topic&superid=8&topicid=60 (accessed on 12 January 2018).
- Das, D. Drainage and lineament analysis towards artificial recharge of groundwater. In Advances in the Research of Aquatic Environment; Lambrakis, N., Stournaras, G., Katsanou, K., Eds.; Springer: Berlin/Heidelberg, Germany, 2011; pp. 37–44. [Google Scholar]
- Sedhuraman, M.; Revathy, S.S.; Babu, S.S. Integration of geology and geomorphology for groundwater assessment using remote sensing and GIS techniques. Int. J. Innov. Res. Sci. Eng. Technol. 2014, 3, 71–85. [Google Scholar]
- Sener, E.; Davraz, A.; Ozcelik, M. An integration of GIS and remote sensing in groundwater investigations: A case study in Burdur, Turkey. Hydrogeol. J. 2005, 13, 826–834. [Google Scholar] [CrossRef]
- Waikar, M.L.; Nilawar, A.P. Identification of groundwater potential zone using remote sensing and GIS technique. Int. J. Innov. Res. Sci. Eng. Technol. 2014, 3, 12163–12174. [Google Scholar]
- Agarwal, R.; Garg, P.K. Remote sensing and GIS based groundwater potential & recharge zones mapping using multi-criteria decision making technique. Water Resour. Manag. 2016, 30, 243–260. [Google Scholar] [CrossRef]
- Chitsazan, M.; Akhtari, Y. A GIS-based DRASTIC model for assessing aquifer vulnerability in Kherran Plain, Khuzestan, Iran. Water Resour. Manag. 2009, 23, 1137–1155. [Google Scholar] [CrossRef]
- Blancada, S. Identifying Potential Artificial Groundwater Recharge Sites in Metro Manila for Stormwater Disposal Using GIS Techniques. Bachelor’s Thesis, University of the Philippines Diliman, Quezon City, Philippines, 2014. [Google Scholar]
- Hammouri, N.; Al-Amoush, H.; Al-Raggad, M.; Harahsheh, S. Groundwater recharge zones mapping using GIS: A case study in Southern part of Jordan Valley, Jordan. Arab. J. Geosci. 2014, 7, 2815–2829. [Google Scholar] [CrossRef]
- Singh, L.K.; Jha, M.K.; Chowdary, V.M. Multi-criteria analysis and GIS modeling for identifying prospective water harvesting and artificial recharge sites for sustainable water supply. J. Clean. Prod. 2017, 142, 1436–1456. [Google Scholar] [CrossRef]
- Singh, A.; Panda, S.N.; Kumar, K.S.; Sharma, C.S. Artificial groundwater recharge zones mapping using remote sensing and GIS: A case study in Indian Punjab. Environ. Manag. 2013, 52, 61–71. [Google Scholar] [CrossRef]
- Krishnamurthy, J.; Mani, A.; Jayaraman, V.; Manivel, M. Groundwater resources development in hard rock terrain-an approach using remote sensing and GIS techniques. Int. J. Appl. Earth Obs. Geoinf. 2000, 2, 204–215. [Google Scholar] [CrossRef]
- Riad, P.H.; Billib, M.H.; Hassan, A.A.; Omar, M.A. Overlay weighted model and fuzzy logic to determine the best locations for artificial recharge of groundwater in a semi-arid area in Egypt. Nile Basin Water Sci. Eng. J. 2011, 4, 24–35. [Google Scholar]
- Soil Environmental Quality Risk Control Standards for Soil Pollution of Agricultural Land (GB15618-2018), National Standards of People’s Republic of China. 2018. Available online: http://www.mee.gov.cn/xxgk2018/xxgk/xxgk01/201807/t20180703_629589.html. (accessed on 1 January 2020).
- Li, H. Establishment and Application Research on Suitability Evaluation System of Reclaimed Water Surface Infiltration Site. Master’s Thesis, China University of Geosciences, Beijing, China, 2013. (In Chinese). [Google Scholar]


Publisher’s Note: MDPI stays neutral with regard to jurisdictional claims in published maps and institutional affiliations. |
© 2021 by the authors. Licensee MDPI, Basel, Switzerland. This article is an open access article distributed under the terms and conditions of the Creative Commons Attribution (CC BY) license (https://creativecommons.org/licenses/by/4.0/).