Abstract
Evaluation of river basins requires land-use and land-cover (LULC) change detection to determine hydrological and ecological conditions for sustainable use of their resources. This study assessed LULC changes over 28 years (1990–2018) in the Wami–Ruvu Basin, located in Tanzania, Africa. Six pairs of images acquired using Landsat 5 TM and 8 OLI sensors in 1990 and 2018, respectively, were mosaicked into a single composite image of the basin. A supervised classification using the Neural Network classifier and training data was used to create LULC maps for 1990 and 2018, and targeted the following eight classes of agriculture, forest, grassland, bushland, built-up, bare soil, water, and wetland. The results show that over the past three decades, water and wetland areas have decreased by 0.3%, forest areas by 15.4%, and grassland by 6.7%, while agricultural, bushland, bare soil, and the built-up areas have increased by 11.6%, 8.2%, 1.6%, and 0.8%, respectively. LULC transformations were assessed with water discharge, precipitation, and temperature, and the population from 1990 to 2018. The results revealed decreases in precipitation, water discharge by 4130 m3, temperature rise by 1 °C, and an increase in population from 5.4 to 10 million. For proper management of water-resources, we propose three strategies for water-use efficiency-techniques, a review legal frameworks, and time-based LULC monitoring. This study provides a reference for water resources sustainability for other countries with basins threatened by LULC changes.
1. Introduction
Concerns regarding the impacts of changing patterns of land-use and land-cover (LULC) on watersheds connecting upland areas and coastal zones have resulted in social, economic, political, and environmental problems at local, regional, and national levels in many countries globally [1,2,3,4,5]. These concerns have made detection of LULC changes (LULCCs) a fundamental component for an improved understanding of land-use dynamics, monitoring environmental changes, and natural resources management [6,7,8,9]. Worldwide, LULCCs have been triggered by natural and anthropogenic factors [10,11]. The increasing pressure of anthropogenic factors has substantially altered numerous watersheds connected to coasts [12,13], particularly in developing countries due to population growth and development activities [14,15].
Many scholars worldwide have researched this area. For example, Ervinia [16] assessed the associated impacts of climate and land-use changes in China′s coastal watershed using the Integrated Nitrogen CAtchments (INCA-N) model. Similarly, Tang et al. [17] evaluated land-use changes by linking ecosystem services values (ESVs) between the estuary and non-estuary zones of the coastal watershed in south-eastern China. Bosch [18] combined Landsat images, spanning 28 years (1975–2003) and hydrologic data to detect the hydrologic impacts of land-use changes in a coastal plain watershed in South-central Georgia in the US and employed historical land-cover data from field surveys acquired using global positioning satellite (GPS), and a reference map for post-classification corrections. Other studies such as those conducted by Langat et al. [19] in Kenya and Rimal et al. [20] in Nepal also detected LULCC in watersheds. Langat et al. [19] assessed the spatial-temporal dynamics of LULC in the Tana River basin from 1987 to 2015, which flows 780 km from its headwaters in the Aberdare mountain range to the Indian Ocean. In their study, Rimal et al. [20] detected the effects of LULCC on ecosystem services using the Integrated Valuation of Ecosystem Services and Trade-offs (InVEST) model from 1996 to 2016 in the Koshi River which drains a large part of the East-central Himalayas and flows to the Bay of Bengal. However, despite their significant contributions for the sustainability in watersheds, such studies are limited to provide more abstractions of the hydro-climatic information in relation to LULC. In such circumstances, they lack to provide better understanding of the general impacts of LULCCs, particularly on the reduction of water resources in watersheds.
In Tanzania, there are significant watersheds for which information on LULCC is uncertain. Therefore, accurate spatial-temporal LULCC studies on these watersheds are necessary to understand the cause of such changes and devise remedial measures to ensure water resources sustainability. Notwithstanding the existing and increasing LULCC impacts, few such studies have been conducted [21] and also have similar limitations as other described above. Moreover, they did not cover the entire basins to understand the cumulative effects of LULCCs [22,23]. In this study, the Wami–Ruvu Basin (WRB), one of the nine watersheds connecting the coast of the Indian Ocean, was chosen as the case study (Figure 1). In this basin, demands for freshwater for socio-economic purposes are increasing daily due to the expansion of agriculture for food and economic growth, primarily the rapid growth of the human population, especially in the coastal regions including Dar es Salaam [24,25]. The demand for water in Dar es Salaam exceeds the supply [26]. Furthermore, LULCC is an additional complex source of pressure for water resource availability and management [23].
Thus, this study aims to detect the magnitude and dynamics of the LULCC from 1990 to 2018 and the implications for coastal water resource management. We focus on this direction due to the preliminary indicators of the rapid increase in population with higher water demands in the coastal areas. The selection of the time series has considered the availability and quality of data. The data that we consider to attain our objectives, include the satellite imageries for assessing LULC variations, hydro climatic data to correlate with the LULC and the population data to determine their influence on LULCC. We further consider using artificial neural networks (ANNs) for LULC classification due to its high ability to produce more accurate results than others, such as the maximum likelihood and Mahalanobis classifiers [27]. The results are expected to assist land-use planners, resource managers, and policy-makers for sustainable use of resources, particularly water, in the river basins connecting to coastal areas.
2. Materials and Methods
2.1. Study Area
The study area is located between 5–7° S and 36–39° E and encompasses a total area of approximately 61,000 km2 in Tanzania, Africa (Figure 1). It consists of the Wami and Ruvu Rivers and seven sub-catchments of Kinyasungwe, Mkondoa, Ngerengere, Wami, Upper Ruvu, Lower Ruvu, and the Coast. Starting in the Eastern Arc mountain range in central Tanzania, it flows eastwards across fertile agricultural plains and grassland savannah to the Indian Ocean coastline. The WRB climate is diverse, consisting of a semi-arid climate in Dodoma and further west areas, and a humid, high rainfall climate along the Uluguru Mountains in Morogoro through the plains of the coastal regions to the Indian Ocean. The average rainfall is approximately 500–780 mm per year in the western semi-arid highlands near Dodoma, and 900–1300 mm in the central areas near Morogoro and the estuarine and coastal regions. Most of the rain in the basin falls between March and May with a shorter rainy season in October–December [24]. The annual mean temperature ranges from 12 to 32 °C [28].
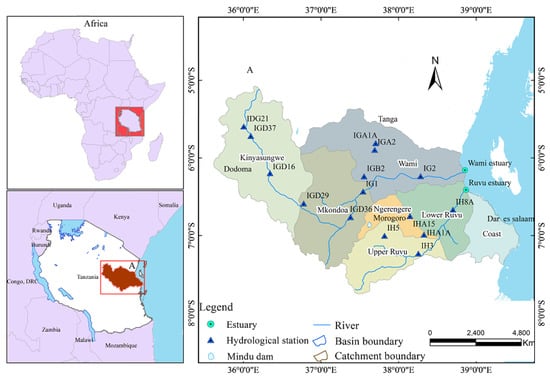
Figure 1.
Location of the study area, Wami–Ruvu Basin (WRB), Tanzania.
2.2. Land-Use and Land-Cover Data
2.2.1. Landsat Satellite Imagery Acquisitions and Pre-Processing
Landsat satellite imagery were used to determine the LULCC between 1990 and 2018 in the WRB. The images were analyzed over 28 years at a spatial resolution of 30 m and were evaluated in the same season of the year (July–September) with minimal cloud cover (<10%). The datasets included Landsat 5 TM images acquired in 1990 and Landsat 8 OLI images acquired in 2018. These Landsat images were acquired along WRS-2 paths 166 to 168 and rows 64 and 65, downloaded from the United States Geological Survey (USGS)-Global Visualization Viewer https://glovis.usgs.gov (accessed on 17 April 2020) [29]. A total of 12 Landsat scenes covering the study area were collected. Then, each scene was atmospherically corrected by FLAASH implemented in ENVI 5.3 software (manufactured by Harris Geospatial solutions in Broomfield, Colorado, United States), consisting of radiometric calibration and dark subtraction. The Landsat digital numbers (DNs) were converted into the top of atmosphere (TOA) reflectance. Thereafter, the corrected Landsat images were mosaicked into a single composite image and subset to study area boundary. Detailed information on the Landsat images is presented in Table 1.

Table 1.
Landsat satellite imagery used in the study.
2.2.2. LULC Classification
The LULC types were determined using three steps: a collection of training datasets, classifiers selection, and manual classification refinements. Each training dataset for the study area was marked on a sample of 1000 permanent pixels for the 1990 and 5000 for 2018 collected from the Sentinel-2 and Google Earth images. Thereafter, the training datasets were randomly divided into two subsets; 60% were used for training the classifier, and 40% were used for the accuracy assessment. Artificial neural networks (ANNs) classification technique was adopted to digitally categorize Landsat images in ENVI 5.3. ANN classification is a supervised classification method, consisting of several small processing units built with artificial neurons, which are widely used in recognition and classification [30]. The details of the delineated land-cover types are given in Table 2.
Table 2.
Land-Use and Land-Cover (LULC) classes targeted for mapping.
Because the supervised technique is prone to errors during classification related to orientations and generalization, post-classification corrections are prerequisites for improving the LULC images [31,32]. Thus, accuracy assessments of both images (1990 and 2018) were conducted for the simplicity and efficiency of the supervised technique.
2.2.3. Accuracy Assessment of LULCCs Classification
To determine how the LULCC results align with reality, we used more accurate maps of the Sentinel-2 (10 m) and Google Earth images. For this course, we used pixels information explained above to extract comparable values from the sentinel-2 and google earth images with the classified LULC. The LULC map accuracy assisted by applying a confusion matrix to each of the classified images showed, our approach had correctly modeled the reality. The results of 80% and 86% for the 1990 and 2018 images, as demonstrated in Table 3, respectively, also comply with others in literature such as by [33,34].
Table 3.
Overall accuracy results of LULC classification for image of (a) 1990 and (b) 2018.
Although both images produced reliable results, the 2018 image exceeded 1990. This difference may be attributed to the sensitivity performance of the satellite detectors and enhanced signal-to-noise ratio. These results allowed us to continue with change detection analysis to determine the basin alterations for 1990 and 2018. Despite the promising results, it is noteworthy that there was uncertainty in the satellite images obtained from two sensors, i.e., TM and OLI with 5 and 8 bands, respectively. These sensors were used due to the absence of a consistent imaging system covering the study period. However, both provided standard images with the same spatial resolution (30 m) and common Red-Green-Blue bands, enhancing visual interpretation during classification. To further provide transparency of the detected changes, an accuracy assessment was performed as shown in Table 3.
2.3. Hydro-Climatic Data
Hydro-climatic data obtained on monthly basis, include water discharge, precipitation, and temperature from three main stations in Dodoma, Morogoro, and Dar es Salaam were collected from the Tanzania Metrological Authority (TMA) and WRB office, Morogoro-Tanzania. Water discharge data was gathered for the two epochs between 1990–2009 and 2010–2018. Precipitation and temperature data also were obtained between 1990 and 2018. These station′s data are well distributed to geographically represent the entire area of the basin from the west to the coastal areas in the east (See some 15 in the Figure 1). After being collected, we sorted and computed their trends using Origin Lab software developed by the OriginLab Corporation, Massachusetts in the US. Finally, we correlated the obtained information with the LULC transformations.
2.4. Population Data
Population data were obtained in shapefiles from the National Bureau of Statistics (NBS), Tanzania, and processed using the ArcGIS software. Population census data were available for the years 1988, 2002, and 2012. Thus, to obtain suitable results for consistent analysis with LULC data spanning 1990–2018, we used the following exponential population projection formula to project the 2012 population for 2018. These data were gathered to determine their influence on LULCC.
where
- refers to the projected number of people in the future.
- refers to the number of people at the initial year (i.e., 2012).
- is the base of the natural logarithms (i.e., 2.71828).
- is the rate of increase in population (i.e., natural increase divided by 100).
- is the time difference from the beginning to the projected year.
3. Results
3.1. LULC Types
Eight types of LULC were targeted for mapping in the WRB between 1990 and 2018. These were agriculture, bare soil, bushland, forest, grassland, built-up, water, and wetland. Forest, agriculture, bushland, and grassland were the largest and most common LULC types in the WRB during the study period (Figure 2). Over the past three decades, the forest was mainly in the north-central part of the WRB, and agriculture was primarily in the western areas of the WRB. Bushland was mostly found in the south-eastern and the estuarine environment. Furthermore, grassland was mainly in the western and some of the central areas of the river basin. Water and wetlands were mainly in the central and far-eastern areas, and built-up areas were congested in the far east around the coastal areas. In 1990, LULC types were dominated by forest, bushland, and grassland. Conversely, in 2018, a large part of the river basin was converted to agricultural land, with an increase in built-up land in the basin coastal areas (Figure 2).
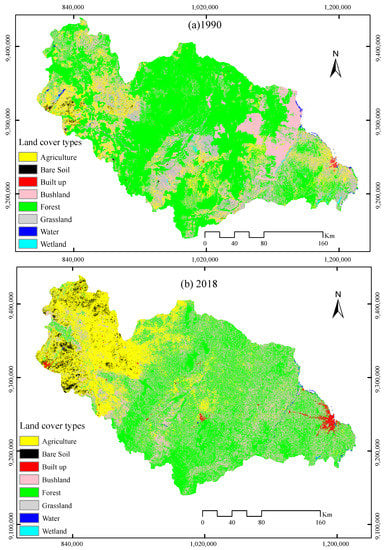
Figure 2.
Classified LULC types of the WRB for (a) 1990 and (b) 2018.
3.2. Temporal Change and Spatial Distribution of LULC
Temporally, considerable changes occurred in LULC in the WRB from 1990 to 2018 (Table 4, see Figure A1 in the Appendix A). The main change was a significant 11.6% increase in the land area covered by agriculture, followed by bushland, bare soil, and the built-up areas which increased by approximately 8.2%, 1.6%, and 0.8%, respectively.
Table 4.
Overall area of LULC (+Gain and -Loss) in hectares (ha) and percentage (%) in the WRB.
Meanwhile, forest, grassland, water, and wetland decreased by 15.4%, 6.7%, 0.1%, and 0.2%, respectively. The total area covered by water and wetlands decreased by 18,100 ha, equivalent to 0.3% of the total area, from 1990 to 2018.
As shown in Figure 2, there was a notable spatial pattern of LULCC in the basin, particularly for the upstream and downstream areas, which provided a foundation for the division of the most spatially dynamic zones. The zone division (A–F) considered the sub-catchment types of the river basin (Figure 3, see Figure A2 in the Appendix A). The main LULC characteristics and quantitative information regarding changes in each zone are shown in Table 5(a,b), respectively.
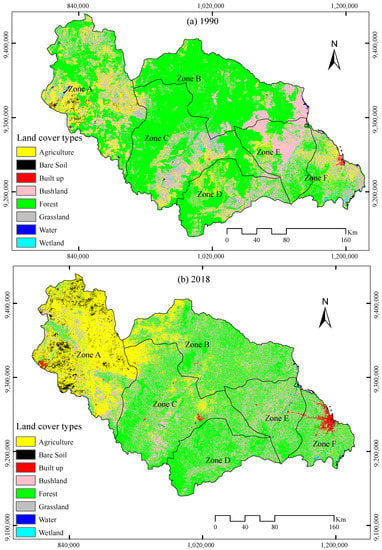
Figure 3.
Major zones of LULC changes (LULCC) within the WRB for (a) 1990 and (b) 2018.
Table 5.
Quantitative information on major LULCC zones (a) in 1990 and (b) in 2018.
Zone A, located on the western area of the WRB, covers the entire area of the Kinyasungwe sub-catchment (Figure 1 and Figure 3). Its spatial LULC pattern in 1990 indicated this zone was mainly characterized by forest, agriculture, grassland, and bushland, which covered 43.69%, 22.12%, 18.36%, and 14.09%, respectively (Table 5). Conversely, in 2018 the zone was converted to mainly agriculture, which had increased by 42.53%. There was a notable increase in the spatial percentages of bare soil and built-up areas and reduced water areas (Figure 3; Table 5). Zone B, located in the north-center, covers the Wami sub-catchment (Figure 1 and Figure 3). The notable change between 1990 and 2018 was the reduction in forest cover by 28.89% and the expansion of agriculture to approximately 11.74% (Table 5).
Zone C, located in the center, covers the Mkondoa and Ngerengere sub-catchments and experienced a significant reduction of forest (15.12%), grassland (8.32%), and water and wetland (by 0.27%), with a 16.89%, 6.42%, and 0.43% increase in bushland, agriculture, and built-up area, respectively. Zones D and E, covering the upper and lower Ruvu sub-catchments and F of the Coastal sub-catchment, experienced significant reductions in the areas of agriculture, bare soil, and grassland and increases in forest, bushland, and built-up land (Figure 3; Table 5). The forest increased by 10.83%, 10.96%, and 13.19%, while bushland increased by 16.02%, 3.53%, and 13.29% in zones D, E, and F, respectively, between 1990 and 2018. Additionally, it is evident that the built-up areas increased significantly in zone F compared to all classified zones over the study period (Figure 3; Table 5). It should be noted that the increase in built-up areas in zones F resulted from the urbanization of the coastal regions of the WRB, including Dar es Salaam (i.e., the largest coastal city in terms of population).
3.3. Water Discharge Trends in the Basin
The average flows of the basin water in the two epochs of 1990–2009 and 2010–2018 show their discharge trends have decreased by 2029 m3 and 1753 m3 for the long rainy (March–May) and short rainy (October–December), respectively, and 348 m3 for the dry (January–February) seasons (Table 6). Significant decreasing trends are positively depicted in the basin sub-catchments of the Upper-Ruvu, Mkondoa, Wami, and Coast that in the first epoch recorded an average discharge of up to 1000 m3 during the long rainy seasons (Figure 4). In the second epoch, only one sub-catchment of the Upper-Ruvu maintained an average water discharge above 1000 m3, with the remaining sub-catchments recording less. For the short rainy seasons, the Upper-Ruvu had an average water flow >1000 m3; however, it recently failed to receive the same quantity as other sub-catchments of the basin. This linear decrease observed during the short rainy seasons is also depicted in both epochs during the dry seasons for all sub-catchments. In general, the decreased flow of water is cumulatively found in the upper and lower streams of the WRB.
Table 6.
Water discharge trends in the basin.
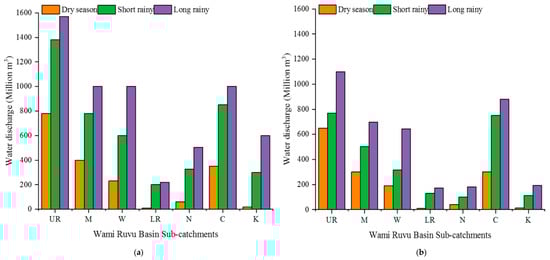
Figure 4.
Variation in basin annual averaged discharge for the periods; (a) 1900–2009 and (b) 2010–2018. UR—Upper Ruvu, M—Mkondoa, W—Wami, LR—Lower Ruvu, N—Ngerengere, C—Coast, K—Kinyasungwe.
3.4. Precipitation and Temperature Trends
The climatic data (i.e., precipitation and temperature) studied in clusters of the west-highlands areas (Kinyasungwe and Mkondoa sub-catchments), central (Wami, Ngerengere, and Upper Ruvu), and eastern zones (the Lower Ruvu and Coast) showed an increase in basin temperature as precipitation decreased (Figure 5). The western zone temperature varied between 29 and 30.25 °C from the 1990s to 2018. The temperature of the central zones increased from 29.9 to 31.3 °C. The remaining areas in the eastern zone showed a temperature variation from 30.5 to 31.9 °C. Generally, the temperature variations clustered in these zones demonstrate that the basin temperature increased by 1 °C from the 1990s to 2018. However, there were decreases in precipitation of 360, 361, and 101 mm in the west-highlands areas, central zone, and coastal zone, respectively. Despite its second rank in the 1990s, the coastal areas were receiving more rain than other sub-catchments. Generally, the decreasing precipitation trend observed from 1990 to 2018 is characterized by notable features, such as in 2006 and 1995 where the basin recorded the highest and lowest precipitation over the entire studied period.
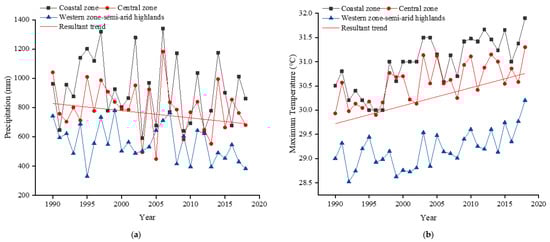
Figure 5.
(a) Annual precipitation and (b) Annual maximum temperature within the WRB. Western zone (covering Kinyasungwe and Mkondoa sub-catchments), Central zone (Wami, Ngerengere and Upper Ruvu sub-catchments) and Eastern zone (covering Lower Ruvu and coastal sub-catchments).
3.5. Population Trends
The population of the WRB in 1988, 2002, and 2012 was 3.5, 5.4, and 8.2 million, respectively. For additional population information corresponding to other data used in this study, we predicted a population of approximately 10 million people in 2018 using the exponential formula presented in Section 2.4 with 2012 as the initial year. To enhance visual interpretation and determine their spatial distribution, we mapped the population for 1988, 2002, and 2012. The maps show the population of the coastal regions is higher compared with other areas in the basin (Figure 6, see Figure A4 in the Appendix A).
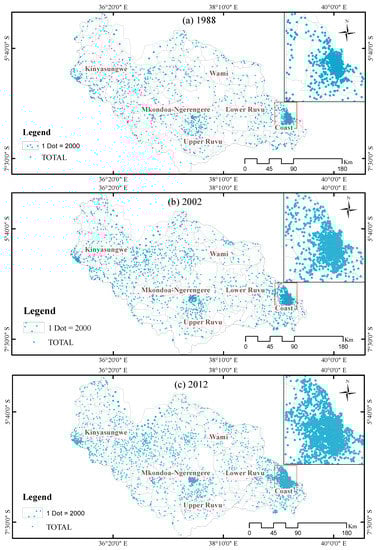
Figure 6.
Spatial distribution of population changes in the WRB based on the census data for the years (a) 1998, (b) 2000 and (c) 2012.
4. Discussion
4.1. Key Issues Identified from LULCC over the Past 28 Years (1990–2018)
The results for the study period (1990–2018) on eight types of LULC in the basin indicate that water and wetland and the forest areas have decreased, while the agricultural and built-up areas have increased significantly, especially in the upstream and downstream areas of the WRB (see Figure 3). The detected LULC changes marked the influence of population increase in the study area. Based on the identified populations of 3.5, 5.4, 8.2, and 10 million people in 1988, 2002, 2012, and 2018, respectively, the yearly population growth was estimated as 0.135, 0.28, and 0.3 million for the intervals of 1988–2002, 2002–2012, and 2012–2018, respectively. This significant growth rate is linked with the detected LULCC, and could largely be attributed to four major factors: high birth rate, improvement in health care and disease control, decline in death rate, and rural-to-urban migration [35]. The influence of population on LULC change was also noted by a study conducted by Twisa and Buchroithner [21] who used a part of the basin to study LULCCs. Areas with the highest population in our study were the Coast, Mkondoa-Ngerengere, and Kinyasungwe catchments. In relation to LULCC, the Coast′s population was affected more by built areas; meanwhile, Mkondoa-Ngerengere and Kinyasungwe were affected more by agricultural and forest areas (Figure 7).
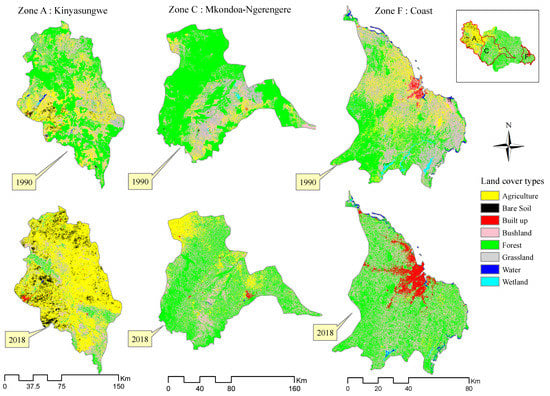
Figure 7.
Zones of attention for built-up growth and agriculture expansion within the WRB.
The results of the land-use pattern found in this study follow other basins in Tanzania and East Africa, such as Malagarasi, Uasin Gishu, and Trans-Nzoia where a decrease in the forest resulted in the increase in agricultural and built-up areas [36,37]. These reasons were also observed in our study, and our findings showed a decrease in grassland and wetland areas was also due to the extension of cultivated land, as seen in dynamic zones (Figure 3). For example, in zone A (upstream of the WRB), the increase of agriculture by 42.53% from 1990 to 2018 converted the largest area of grassland and wetland to agricultural area (Table 5). This conversion had also been noted by Nobert and Jeremiah [22]. These scholars determined that most wetlands in some areas of the basin were converted into agricultural areas for rice and maize. Generally, this change highlights the universal influence of economic forces in motivating the anthropogenic alteration of land-cover [38] and the increasing demand for food production resulting from the increasing population pressure.
Parallel to the population rise and LULC variations and its impacts, this work also identified a decline in water flow in the basin by 4130 m3 from (1990–2009) to (2010–2018). A comparison of sub-catchments for this decrease showed Kinyasungwe, Ngerengere, Lower Ruvu, and Coast sub-catchments had more significant changes (Figure 4), and primarily, anthropogenic activities, such as the expansion of agricultural areas, and fundamental social processes, such as population growth, are highly linked with these changes as also noted by Twisa and Buchroithner [21]. Further, the slight increase in the average temperature (i.e., 1 °C) observed in the basin and the decrease in rainfall for the present years (see Figure 5) also contribute to the total decrease of water discharge. The observed changes in precipitation and temperature trends have also been reported in previous studies to cause a transition pattern of intra-annual flow variation between bi-modal (two peak) and unimodal (single peak) periods and with the low flow to some sub-catchments such as Kinyasungwe [28]. However, the temperature was reported to increase evaporative water loss [24], particularly in the coastal zone. Over the 28 years, the basin land-use pattern puts pressure on water use resources. Further, the patterns associated with agricultural activities which doubled from 705,416 to 1,482,554 ha (see Table 4) had more impact on water resources in the basin, and this seems to be valid based on the statistical water use in the basin and the demand projected by Japan International Cooperation Agency (JICA, Tokyo, Japan) [39] (see Table 7). Domestic water use in the basin ranks second, and according to the recent data computed from the WRB water authorities, approximately half of the total domestic use per year is found in coastal regions, with Dar es Salaam being dominant (Table 8). This could be attributed to many factors, including the harbor, industries, and many business operations drawing rural to urban migration. It is noteworthy that all the freshwater supply for the coastal regions, which currently lacks 83 million m3/year, is fed by the Wami and Ruvu rivers, tributaries, and reservoirs.
Table 7.
Water demand for major sectors use in the WRB.
Table 8.
Water supply and demand in downstream/coastal zone of the WRB.
The current and future high water demands and its decreasing trend due to LULCC required this study to explore other land-use and legal factors to determine their likely influence and contribution to the sustainability of water resources. From a legal perspective, we studied land and resource policies and management acts. We found the National Land Policy (NLP) of 1995, National Agriculture and Livestock Policy (NALP) of 1997, and National Water Policy (NAWAPO) of 2002, to be relevant to this study. The NLP provides general land security through its land and village acts, both enacted in 1999. Consistent with NLP, the NAWAPO and its Water Resource Management Act (WRM Act) of 2009 have strong legal frameworks regarding water resource management administered by the government to the Water Users Association, who provide a platform for public participation in water resource management at a smaller geographic scale [40]. Conversely, the NALP and its development strategies which draw substantial land for agricultural activities are identified along with their weaknesses. This is best revealed by the 2009 Kilimo Kwanza (Agricultural First) strategy aimed to modernize the agricultural sector, commercialize farming, increase productivity, and attract private investment in agriculture [41]. This strategy initiated big substantial agricultural projects, mostly found in arable lands of the river basins such as the Southern Agricultural Corridor of Tanzania (SAGCOT) that stretches in to Rukwa and Rufiji and includes the WRB [42]. Despite its aims to improve Tanzania′s economy by 2025 to $2.1B in private investments and $1.3B in public investments [43], such projects lack strong implementation strategies for land-use and water resources management. This is because most implementing areas do not have sustainable land-use plans. This is well-linked with the land-use practices of the WRB where a large portion of its area is planned for extreme agricultural uses as indicated in its existing Land Use Plan (LUP) (Figure 8a) adopted from the national land use framework plan of the basin. Therefore, we connected the detected LULC dynamics in the study period with the existing LUP. Previous studies on LULC by Alfasi et al., Loh., and Enoguanbhor et al. [44,45,46] have noted similar findings.
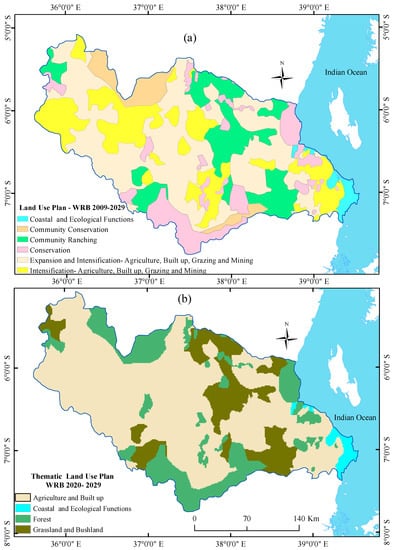
Figure 8.
Land use plans of the WRB (a) in the existing project 2009–2029 (b) new-projecting for 2020–2029.
As derived from Figure 8a, we produced a new LUP in Figure 8b which combined the conservation (i.e., coastal and ecological functions, forest, bushland, and grassland) against the non-conservation uses (i.e., agriculture and built-up) for a strong understanding of the LULC pattern [47] and enabled decision-makers to directly compare the actual land-use condition and their land-use plans [46]. The new LUP in Figure 8b indicates that if the sustainable measures are not considered by 2029, 63.2% of the WRB will be for non-conservation uses, while only 36.8% will be for conservation uses. Furthermore, this observation also corresponds to the new LUP with the 2018 LULCC imagery (see Figure 2b), indicating an uncontrolled agricultural expansion, particularly in the upstream area of the WRB. Therefore, our study advocates that addressing LULCC, the LUP, and the agriculture development strategies are critical issues of concern in Tanzania. The Kilimo Kwanza and the development of the SAGCOT best reveal this. The primary concern is that the influx of large-scale commercial development projects, such as SAGCOT, will continue to increase in Tanzania with the ineffectiveness of the existing LUP and impact the arable land of the river basins and their resources, particularly water, as detected in the WRB.
4.2. Implication of LULCC for Water Resource Management
The decrease in water resources is the key issue identified by the LULCC and is mainly caused by the increasing agricultural and built-up areas, particularly in the downstream and coastal zone. Furthermore, agriculture is the backbone to the Tanzanian economy Kimaro [48] and is projected by JICA [39] to be the largest water-consuming sector in the WRB up to 2035. This implies that a decrease in water will continue if sustainable measures are not considered due to the increasing population which depends on agriculture for food and economic purposes. However, existing agricultural development strategies and the LUP appear to expose more use of the basin for agricultural and built-up areas, while the sustainability of such activities remains questionable. If the situation continues without remedial measures, the decrease of water resources will increase considerably in the entire basin, and more impacts are expected downstream and along the coastal zone with higher domestic and industrial water demands.
Additionally, as we have found, in Tanzania, LUP has close supervision by the town planning offices in most towns. However, this differs in most outskirt areas where villagers conventionally interact with land-use resources due to lack of a sustainable LUP. Our observation is also well noted in the studies conducted by Qian and Wong and Lusugga Kironde [49,50] who argued that LUP focused less on most areas beyond the urban boundaries in developing countries. Considering this viewpoint, a significant proportion of the WRB is also found in outskirt areas with agricultural activities, which has implications for the future of the water resources in the basin. Therefore, immediate interventions are urgently needed since the daily benefits of most livelihoods in the basin, especially in the rural areas, depend on agricultural activities for food and economic improvement. Further, to reverse this situation, we proposed three strategies for sustaining WRB resources, which will be discussed in the subsequent sections, with particular attention to the coastal zone water resource.
4.3. Strategies for Sustaining Water Resource in the Basin
4.3.1. Strengthening Management of Water and Adopting Efficient Water Uses
Water resources reduction is evident in the WRB, as supported by the general trend of annual water flows for the periods of 1990–2009 and 2010–2018, which impacted all seven sub-catchments within the river basin (see Figure 4). Similar results are found in other studies, including the study by Miraji et al. [51]. Among the factors that were detected in our study that alter the basin hydrology, and hence reduction of water flow, is the LULC impact on climate change which resulted in the decrease in rainfall and increase in temperatures in recent years, particularly in the downstream sub-catchments including the Coast. For example, the Coastal sub-catchment had the highest average water flow of 1000 m3 during the first epoch (1990–2009). Conversely, in the second epoch (2010–2018), the Coast failed to maintain the same trend as the rest of the downstream sub-catchments (see Figure 4). In our observation, the reduction of water flow with the increasing rate of water withdrawals due to the rapid rise in population caused the coastal regions to experience a shortage in fresh-water supply of approximately 83 million m3/year. The deficiency in freshwater supply is also well linked to the increase in groundwater use for the Coastal sub-catchments, compared to other sub-catchments in the WRB (Figure 9). Due to these aforementioned reasons and anticipated impacts of LULCC mainly due to agricultural expansion, which is a primary water-consuming sector in the basin, strengthening water resources management by adopting water-saving technologies such as reservoirs and dams is an irrefutable strategic plan in the basin both overall and zonally, including the coastal regions. Furthermore, respective authorities encouraging water efficiency techniques is necessary to sustain basin water. This includes crop per drop for agricultural areas, such as in Kinyasungwe sub-catchment (upstream of the basin) and to all existing agricultural projects in the basin including Mtibwa Sugar plantations and Dakawa Rice Fields [24]. For example in 2010, irrigation activities in the Wami River, part of the basin, accounted for 96% of the total extracted water [52,53]. Therefore, adopting water efficiency techniques for agricultural activities is vital in the entire basin for sustaining water resources, particularly downstream (i.e., Coast).
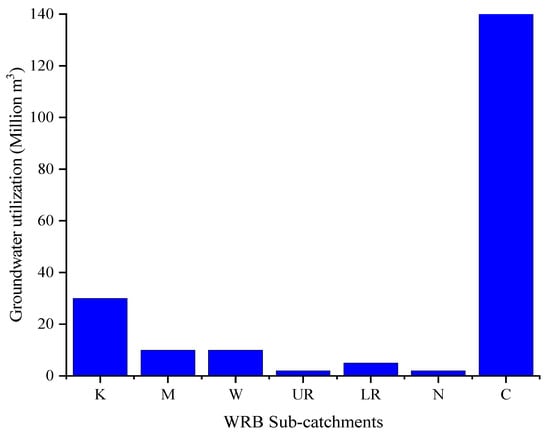
Figure 9.
Water utilization by sub-catchment in the WRB. K—Kinyasungwe, M—Mkondoa, W—Wami, UR—Upper Ruvu, LR—Lower Ruvu, N—Ngerengere, C—Coast.
4.3.2. Considering Reviews and Effective Implementation of the Legal Frameworks for Water Resource Management
Based on the changes in LULC detected over 28 y which reduced water and wetland areas of the WRB by 0.3%, recent projections suggest that human demand for freshwater will substantially increase in the next decades due to human population growth, agricultural expansion, industrialization, and climate change [42]. These challenges are likely to be most acute for water resource management in the WRB. The rise in population and impacts of LULCC of the Wami–Ruvu basin are linked to the ineffective legal frameworks that support agricultural areas expansion. Further LULCC effects, particularly on water resources, are anticipated because the WRB is among the river basins that contain <20 to 25% of protected areas with close supervision [54]. Approximately 75% of the basin contains prime water areas which require extra efforts for sustainability. It is necessary to review existing legal and institutional frameworks, such as the LUP, to meet the future unfavorable consequences of LULCC.
4.3.3. Periodic LULCC Monitoring
River basin evaluation and development of management strategies require current and past change detection of LULC parameters to determine their hydrological and ecological condition [38]. This contradicts WRB because resource bases, such as forests and water, are declining rapidly due rapid expansion of agricultural activities. Meanwhile, periodic evaluation of the rate of reduction is lacking for proper understanding of their impacts, particularly on basin hydrology. Therefore, observations from recent studies have shown that the expansion of agricultural activities contributed to the modification in land and water uses in the Wami River and will continue to contribute to further changes in the future [52,55]. Therefore, time-based studies for the prediction of LULCC consequences on water resources are vital for decision-making towards the sustainability of water resources and filling the time-based gap of LULCC information, especially in more threatened zones such as the Coast. Further to the specific strategies, there is a need also to build broad and increased public awareness on the impact of LULCC due to the increase of anthropogenic alteration on the basin land. This strategy can be applied to other basins globally.
5. Conclusions
Increasing LULCCs has been detected in the WRB over the past 28 years (1990–2018) because of several factors including population growth, legal, and institutional frameworks for land, water, agriculture, and inefficient LUPs. While investigating these long-term LULCCs, this study integrated data from different sources, including satellite data, population census data, and other ancillary datasets, and used different approaches including integrated techniques of remote sensing and GIS. This study revealed that substantial LULCC in the basin has been mainly due to conversion of forest areas to agricultural areas in the upstream river basin, and built-up activities downstream, with a reduction of water resources, especially in the coastal zone.
For developing countries whose economies rely on agriculture, such as Tanzania, LULCCs associated with agriculture are inevitable because most of her arable land is in large lakes and river basin areas. Internal policies which provide high priority for agricultural activities, such as the Kilimo Kwanza (Agriculture First), have substantial implications, and the most affected areas are the downstream zones of these river basins. Thus, considering the Sustainable Development Goals in 2030, this study highlights the need for immediate interventions to assess sustainability indicators regarding water and land resources for the entire WRB, particularly the coastal zone. For long-term planning, information regarding LULC and the drivers influencing changes are crucial since they provide more information on LULCC. More promising results on LULCC and their impacts could be well achieved using the data covering the long periods, and such data should be observed at the same time for the years of study. There was a slight departure of time for the population data in our study and the lack that led the researchers to project for the year 2018. Future studies should consider detecting LULCC of the basin by involving multi-criteria analyses to further understand how climate and population changes affect river basin water, flora, fauna, and ichthyofauna. Findings from such studies would help to identify strong practices for basin enhancement, as well as threats requiring immediate interventions for the sustainability of the basin resources.
Author Contributions
Conceptualization, J.N. (Jamila Ngondo), J.M. and H.C.; investigation, J.N. (Jamila Ngondo), J.N. (Joel Nobert) and A.D.; software, R.L., J.N. (Jamila Ngondo) and J.M.; validation, J.M., J.N. (Jamila Ngondo) and H.C.; methodology, J.M., R.L. and J.N. (Jamila Ngondo); data curation, J.N. (Jamila Ngondo), A.D. and J.M.; formal analysis, J.N. (Jamila Ngondo), J.M. and R.L.; writing—original draft preparation, J.N. (Jamila Ngondo) and J.M.; writing—review and editing, J.N. (Jamila Ngondo), J.M., H.C. and J.N. (Joel Nobert); visualization, J.N. (Joel Nobert), A.D. and H.C.; supervision, H.C., A.D. and J.N. (Joel Nobert); funding acquisition, A.D., H.C. and J.N. (Jamila Ngondo); All authors have read and agreed to the published version of the manuscript.
Funding
This research was funded by the State Key Laboratory of Estuarine and Coastal Research (SKLEC) of East China Normal University [project number SKLEC-KF201810].
Institutional Review Board Statement
Not applicable/study not involving humans or animals.
Informed Consent Statement
Not applicable/study not involving humans.
Data Availability Statement
Not applicable.
Acknowledgments
The authors would like to thank anonymous reviewers for their valuable comments and language editing which have greatly improved the quality of this manuscript.
Conflicts of Interest
The authors declare no conflict of interest.
Appendix A

Figure A1.
The area extent of the eight aggregated LULC types based on Table 1990, and 2018 in the WRB. A—Agriculture, BS—Bare soil, BL—Bushland, FR—Forest, GL—Grassland, BU—Built-up, W—Water, WT—Wetland.
Figure A1.
The area extent of the eight aggregated LULC types based on Table 1990, and 2018 in the WRB. A—Agriculture, BS—Bare soil, BL—Bushland, FR—Forest, GL—Grassland, BU—Built-up, W—Water, WT—Wetland.


Figure A2.
Sub-catchemnts divisions resource map in the WRB [24].
Figure A2.
Sub-catchemnts divisions resource map in the WRB [24].


Figure A3.
Reference map for land cover classification in the WRB [24].
Figure A3.
Reference map for land cover classification in the WRB [24].


Figure A4.
The population resource map in the WRB [24].
Figure A4.
The population resource map in the WRB [24].

References
- Zhou, P.; Huang, J.; Pontius, R.G.; Hong, H. Land classification and change intensity analysis in a coastal watershed of Southeast China. Sensors 2014, 14, 11640–11658. [Google Scholar] [CrossRef]
- Yang, X.; Liu, Z. Using satellite imagery and GIS for land-use and land-cover change mapping in an estuarine watershed. Int. J. Remote Sens. 2005, 26, 5275–5296. [Google Scholar] [CrossRef]
- Castillo, C.R.; Güneralp, İ.; Güneralp, B. Influence of changes in developed land and precipitation on hydrology of a coastal Texas watershed. Appl. Geogr. 2014, 47, 154–167. [Google Scholar] [CrossRef]
- Sugimoto, R.; Kasai, A.; Tait, D.R.; Rihei, T.; Hirai, T.; Asai, K.; Tamura, Y.; Yamashita, Y. Traditional land use effects on nutrient export from watersheds to coastal seas. Nutr. Cycl. Agroecosyst. 2021, 119, 7–21. [Google Scholar] [CrossRef]
- Huang, J.; Pontius, R.G.; Li, Q.; Zhang, Y. Use of intensity analysis to link patterns with processes of land change from 1986 to 2007 in a coastal watershed of southeast China. Appl. Geogr. 2012, 34, 371–384. [Google Scholar] [CrossRef]
- Rawat, J.S.; Biswas, V.; Kumar, M. Changes in land use/cover using geospatial techniques: A case study of Ramnagar town area, district Nainital, Uttarakhand, India. Egypt. J. Remote Sens. Space Sci. 2013, 16, 111–117. [Google Scholar] [CrossRef]
- Kumari, M.; Das, A.; Sharma, R.; Saikia, S. Change detection analysis using multi temporal satellite data of Poba reserve forest, Assam and Arunachal Pradesh. Int. J. Geomat. Geosci. 2014, 4, 517–527. [Google Scholar]
- Rawat, J.S.; Kumar, M. Monitoring land use/cover change using remote sensing and GIS techniques: A case study of Hawalbagh block, district Almora, Uttarakhand, India. Egypt. J. Remote Sens. Space Sci. 2015, 18, 77–84. [Google Scholar] [CrossRef]
- Wang, S.; Gebru, B.; Lamchin, M.; Kayastha, R.; Lee, W.-K. Land Use and Land Cover Change Detection and Prediction in the Kathmandu District of Nepal Using Remote Sensing and GIS. Sustainability 2020, 12, 3925. [Google Scholar] [CrossRef]
- Zhao, R.; Chen, Y.; Shi, P.; Zhang, L.; Pan, J.; Zhao, H. Land use and land cover change and driving mechanism in the arid inland river basin: A case study of Tarim River, Xinjiang, China. Environ. Earth Sci. 2013, 68, 591–604. [Google Scholar] [CrossRef]
- Munoth, P.; Goyal, R. Impacts of land use land cover change on runoff and sediment yield of Upper Tapi River Sub-Basin, India. Int. J. River Basin Manag. 2020, 18, 177–189. [Google Scholar] [CrossRef]
- Huang, J.; Huang, Y.; Zhang, Z. Coupled effects of natural and anthropogenic controls on seasonal and spatial variations of river water quality during baseflow in a coastal watershed of Southeast China. PLoS ONE 2014, 9, e91528. [Google Scholar] [CrossRef] [PubMed]
- Fan, D.; Dac Ve, N.; Su, J.; Vuong, B.; Tran Dinh, L. Coastal morphological changes in the Red River Delta under increasing natural and anthropic stresses. Anthr. Coasts 2019, 2, 51–71. [Google Scholar] [CrossRef]
- Dada, O.A.; Agbaje, A.O.; Adesina, R.B.; Asiwaju-Bello, Y.A. Effect of coastal land use change on coastline dynamics along the Nigerian Transgressive Mahin mud coast. Ocean Coast. Manag. 2019, 168, 251–264. [Google Scholar] [CrossRef]
- Barnieh, B.; Jia, L.; Menenti, M.; Zhou, J. Mapping Land Use Land Cover Transitions at Different Spatiotemporal Scales in West Africa. Sustainability 2020, 12, 8565. [Google Scholar] [CrossRef]
- Ervinia, A.; Huang, J.; Zhang, Z. Nitrogen sources, processes, and associated impacts of climate and land-use changes in a coastal China watershed: Insights from the INCA-N model. Mar. Pollut. Bull. 2020, 159, 111502. [Google Scholar] [CrossRef]
- Tang, J.; Li, Y.; Cui, S.; Xu, L.; Ding, S.; Nie, W. Linking land-use change, landscape patterns, and ecosystem services in a coastal watershed of southeastern China. Glob. Ecol. Conserv. 2020, 23, e01177. [Google Scholar] [CrossRef]
- Bosch, D.D.; Sullivan, D.G.; Sheridan, J.M. Hydrologic Impacts of Land-Use Changes in Coastal Plain Watersheds. Trans. ASABE 2006, 49, 423–432. [Google Scholar] [CrossRef]
- Langat, P.K.; Kumar, L.; Koech, R.; Ghosh, M.K. Monitoring of land use/land-cover dynamics using remote sensing: A case of Tana River Basin, Kenya. Geocarto Int. 2019, 1–19. [Google Scholar] [CrossRef]
- Rimal, B.; Sharma, R.; Kunwar, R.; Keshtkar, H.; Stork, N.E.; Rijal, S.; Rahman, S.A.; Baral, H. Effects of land use and land cover change on ecosystem services in the Koshi River Basin, Eastern Nepal. Ecosyst. Serv. 2019, 38, 100963. [Google Scholar] [CrossRef]
- Twisa, S.; Buchroithner, M. Land-Use and Land-Cover (LULC) Change Detection in Wami River Basin, Tanzania. Land 2019, 8, 136. [Google Scholar] [CrossRef]
- Nobert, J.; Jeremiah, J. Hydrological response of watershed systems to land use/cover change. A case of Wami River Basin. Open Hydrol. J. 2012, 6, 78–87. [Google Scholar] [CrossRef]
- Twisa, S.; Mwabumba, M.; Kurian, M.; Buchroithner, M.F. Impact of Land-Use/Land-Cover Change on Drinking Water Ecosystem Services in Wami River Basin, Tanzania. Resources 2020, 9, 37. [Google Scholar] [CrossRef]
- FIU-GLOWS. Water Atlas of the Wami/Ruvu Basin. Available online: http://dpanther.fiu.edu/sobek/FIGW000010/00001 (accessed on 18 May 2020).
- Ngondo, J.M.; Cheng, H.; Dubi, A.M.; Norbet, J. Sustainable adaption strategies for freshwater supply-related challenges in coastal cities, Tanzania. J. East China Norm. Univ. 2020, 2020, 114–119. [Google Scholar]
- Nobert, J.; Skinner, J. Meeting Future Demand for Drinking Water Supply in Dar es Salaam: Hydrological Modelling of the Ruvu River and Assessment of Flows; IIED Working Paper; IIED: London, UK, 2016. [Google Scholar]
- Aziz, N.; Minallah, N.; Junaid, A.; Gul, K. Performance analysis of artificial neural network based land cover classification. Int. J. Mar. Environ. Sci. 2017, 11, 422–426. [Google Scholar]
- WRBWO. Wami/Ruvu Basin Annual Hydrological Report; WRBWO: Morogoro, Tanzania, 2008. [Google Scholar]
- USGS. Global Visualization Viewer 2020. Available online: https://glovis.usgs.gov/app?fullscreen=1 (accessed on 17 April 2020).
- Bishop, C.M. Neural Networks for Pattern Recognition; Oxford University Press, Inc.: New York, NY, USA, 1995; p. 482. [Google Scholar]
- Thakkar, A.K.; Desai, V.R.; Patel, A.; Potdar, M.B. Post-classification corrections in improving the classification of Land Use/Land Cover of arid region using RS and GIS: The case of Arjuni watershed, Gujarat, India. Egypt. J. Remote Sens. Space Sci. 2017, 20, 79–89. [Google Scholar] [CrossRef]
- Harris, P.M.; Ventura, S.J. The integration of geographic data with remotely sensed imagery to improve classification in an urban area. Photogramm. Eng. Remote Sens. 1995, 61, 993–998. [Google Scholar]
- Rwanga, S.S.; Ndambuki, J.M. Accuracy assessment of land use/land cover classification using remote sensing and GIS. Int. J. Geosci. 2017, 8, 611. [Google Scholar] [CrossRef]
- Tilahun, A.; Teferie, B. Accuracy assessment of land use land cover classification using Google Earth. Am. J. Environ. Prot. 2015, 4, 193–198. [Google Scholar] [CrossRef]
- UNDESA-PD. Population Division. In World Population Prospects: The 2015 Revision, Key Findings and Advance Tables; Working Paper No. ESA/P/WP.241; Available online: https://www.un.org/en/development/desa/publications/world-population-prospects-2015-revision.html (accessed on 12 January 2021).
- Kashaigili, J.; Majaliwa, A. Integrated assessment of land use and cover changes in the Malagarasi River Catchment in Tanzania. Phys. Chem. Earth Parts A B C 2010, 35, 730–741. [Google Scholar] [CrossRef]
- Kogo, B.K.; Kumar, L.; Koech, R. Analysis of spatio-temporal dynamics of land use and cover changes in Western Kenya. Geocarto Int. 2021, 36, 376–391. [Google Scholar] [CrossRef]
- Butt, A.; Shabbir, R.; Ahmad, S.S.; Aziz, N. Land use change mapping and analysis using Remote Sensing and GIS: A case study of Simly watershed, Islamabad, Pakistan. Egypt. J. Remote Sens. Space Sci. 2015, 18, 251–259. [Google Scholar] [CrossRef]
- JICA. The Study on Water Resources Management and Development in Wami/Ruvu Basin in the United Republic of Tanzania. Available online: https://www.jica.go.jp/tanzania/english/index.html (accessed on 22 April 2020).
- Kabogo, J.E.; Anderson, E.P.; Hyera, P.; Kajanja, G. Facilitating public participation in water resources management: Reflections from Tanzania. Ecol. Soc. 2017, 22, 26. [Google Scholar] [CrossRef]
- URT. The Kilimo Kwanza Resolution; URT: Dar es Salaam, Tanzania, 2009. [Google Scholar]
- Seeteram, A.N.; Hyera, T.P.; Kaaya, T.L.; Lalika, C.S.M.; Anderson, P.E. Conserving Rivers and Their Biodiversity in Tanzania. Water 2019, 11, 2612. [Google Scholar] [CrossRef]
- Cooksey, B. What Difference Has CAADP Made to Tanzanian Agriculture? Available online: https://assets.publishing.service.gov.uk/media/57a08a45ed915d3cfd00069c/FAC_Working_Paper_074.pdf (accessed on 23 September 2020).
- Alfasi, N.; Benenson, I.; Almagor, J. The actual impact of comprehensive land-use plans: Insights from high resolution observations. Land Use Policy 2012, 29, 862–877. [Google Scholar] [CrossRef]
- Loh, C.G. Assessing and Interpreting Non-conformance in Land-use Planning Implementation. Plan. Pract. Res. 2011, 26, 271–287. [Google Scholar] [CrossRef]
- Enoguanbhor, E.; Gollnow, F.; Nielsen, J.; Lakes, T.; Walker, B. Land Cover Change in the Abuja City-Region, Nigeria: Integrating GIS and Remotely Sensed Data to Support Land Use Planning. Sustainability 2019, 11, 1313. [Google Scholar] [CrossRef]
- Mohamed, A.; Worku, H. Quantification of the land use/land cover dynamics and the degree of urban growth goodness for sustainable urban land use planning in Addis Ababa and the surrounding Oromia special zone. J. Urban Manag. 2019, 8, 145–158. [Google Scholar] [CrossRef]
- Kimaro, D. Land for Agriculture in Tanzania: Challenges and Opportunities. J. Land Soc. 2014, 1, 91–102. [Google Scholar]
- Qian, H.; Wong, C. Master Planning under Urban–Rural Integration: The Case of Nanjing, China. Urban Policy Res. 2012, 30, 403–421. [Google Scholar] [CrossRef]
- Lusugga Kironde, J.M. The regulatory framework, unplanned development and urban poverty: Findings from Dar es Salaam, Tanzania. Land Use Policy 2006, 23, 460–472. [Google Scholar] [CrossRef]
- Miraji, M.; Liu, J.; Zheng, C. The Impacts of Water Demand and Its Implications for Future Surface Water Resource Management: The Case of Tanzania’s Wami Ruvu Basin (WRB). Water 2019, 11, 1280. [Google Scholar] [CrossRef]
- Wambura, F. Stream Flow Response to Skilled and Non-linear Bias Corrected GCM Precipitation Change in the Wami River sub-basin, Tanzania. Br. J. Environ. Clim. Chang. 2014, 4, 389–408. [Google Scholar] [CrossRef]
- Wambura, F.J.; Ndomba, P.M.; Kongo, V.; Tumbo, S.D. Uncertainty of runoff projections under changing climate in Wami River sub-basin. J. Hydrol. Reg. Stud. 2015, 4, 333–348. [Google Scholar] [CrossRef]
- Darwall, W.; Smith, K.; Lowe, T.; Vié, J.-C. The Status and Distribution of Freshwater Biodiversity in Eastern Africa. In IUCN SSC Freshwater Biodiversity Assessment Programme; IUCN: Gland, Switzerland; Cambridge, UK, 2009. [Google Scholar]
- Wambura, F.J.; Dietrich, O.; Lischeid, G. Improving a distributed hydrological model using evapotranspiration-related boundary conditions as additional constraints in a data-scarce river basin. Hydrol. Process. 2018, 32, 759–775. [Google Scholar] [CrossRef]


Publisher’s Note: MDPI stays neutral with regard to jurisdictional claims in published maps and institutional affiliations. |
© 2021 by the authors. Licensee MDPI, Basel, Switzerland. This article is an open access article distributed under the terms and conditions of the Creative Commons Attribution (CC BY) license (https://creativecommons.org/licenses/by/4.0/).