Abstract
The water management of cities and villages faces many challenges. Aging infrastructure systems operate for many years after their theoretical lifetime (operation) with a very high need for reconstruction and repair. The solution is proper rainwater management. The investigated area is part of the cadastral area of the Nitra city. This article is based on the use of geographic information systems (GIS) as tools in proposing water retention measures that are needed to improve the microenvironment of the city. We proceeded in several steps, which consisted of area analysis, survey, surface runoff calculations in urbanized areas, proposal of a suitable solution for given location. For real possibilities of rainwater management procedures, a new site on the outskirts of the city was selected. In the given locality, it was possible to use water infiltration as a solution. The locality has suitable conditions of land ownership, pedological conditions, the slope of the area and also the interest of the inhabitants in the ecological solution. The outlined study indicates the need to continue research on the reliability of rainwater management practices.
1. Introduction
Rainwater management is a fundamental task in urban areas of city infrastructure. Since ancient times, the water management infrastructure solution of urban settlements [1] has been a fundamental role in planning the structure of the city. In addition to street and road solutions, the most important task was to propose a system of drinking water distribution and drainage of wastewater [2,3]. Water supply has already been recognized in historic cities as one of the greatest challenges for the creation of major cities and administrative centers [4]. The basic tasks of urban planning have been solved since ancient times, such as the ancient cities of Rome, Pompeii, Mesopotamia, ancient India [4,5,6,7]. Sewerage networks were addressed at the same time [8,9,10]. There were two reasons—to prevent the spread of water-related diseases and also to divert excess rainwater from streets and other public open spaces [9]. There was no other solution for rainwater or wetlands during this period—just drainage as soon as possible. Gradually the basic practical approaches of antiquity began to be implemented in the late 19th century and early 20th century, when the needs of rapidly developing cities addressed the issues of water transport in pipelines, their use and wastewater treatment [11]. Methodologies for building water supply networks with the required parameters for their solution in terms of supplying the population with drinking water [12]. Methodologies for rainwater management were developed much later—at the end of the 20th and the beginning of 21st century. The progressive increase of theories, such as blue, green and gray water and their use in urban areas and the accumulation of excess water in the urban area is mentioned nowadays. Spatial planning addresses proposals for areas designed to deal with extreme rainfall events, without endangering urban areas and reducing the share of cities on causing floods in watersheds [13]. The development of urbanized water-sensitive areas takes into account the city’s principle as a sponge and uses methods that open up decentralized rainwater management, greening cities. This method has so far gained attention, especially in Chinese cities [14,15,16], but growing cities in Europe are also becoming vulnerable to floods. Aging infrastructure systems operated for many years after their theoretical lifetime (operation) with a very high need for reconstruction and repair [17,18,19]. At the same time, the effects of climate change are facing increasingly tense socio-economic divisions between societies, pressures due to demographic change or growing doubts about new pollutant threats [18]. According to the current climatic situation, cities should be more inclined to increase local retention and infiltration of rainwater and to apply new knowledge, technologies to the construction and renewal of sewerage networks [20]. It is necessary to address the generation of groundwater resources and the evaporation of retained rainwater with positive effects on the urban microclimate [21,22,23]. Great attention is paid to what is manifesting itself as an increase in extreme weather events within Europe. From, for example, the “polar vortex” [24] in the winter of 2017–2018 or the “Beast from the East” with the cold Arctic winds that occurred in different parts of Europe to the “Lucifer” [25] heat wave, [26,27]. The people of European countries can expect even more unusual extreme weather events in the future [28,29].
Precipitation is in principle recorded where it occurs [30] and brought back into the natural water cycle on site by appropriate systems, if possible [31]. This can be achieved by storage, evaporation, drainage and infiltration, creation of seepage pits, rain gardens, application of green roofs or water-permeable areas [32,33,34]. The main tasks of decentralized rainwater management are evaporation, infiltration, retention, runoff, storage, use, runoff retardation, cleaning and maintenance [32].
It should be emphasized at the outset that there is currently no generally binding legal framework for the application of blue-green infrastructure [35,36] in cities and villages in Slovakia. The implementation of these ecosystem-oriented measures is entirely within the competence of individual local governments and thus depends on their proactive approach in this area.
The aim of the study is mainly focused on the proposal process of rainwater management facilities using geographic information systems (GIS) in new built-up development areas but also on their possible integration into existing urban development with examples of possible blue-green infrastructure implementation in the city structure. The authors try to point out the simplicity and efficiency of rainwater retention where it hits the earth’s surface and its positive effect. Blue-green infrastructure [37] is an environmental urban infrastructure that combines a vegetation component (green infrastructure) and hydrological elements (blue infrastructure), which are represented by rainwater management facilities (RMF). Proposals for rainwater management in the conditions of Slovakia have not been implemented yet and therefore the whole procedure is described in detail in the submitted paper. Implementation to such an extent is basically the introduction of a new way of solving rainwater management.
2. Materials and Methods
2.1. Characteristics and Geographical Location of the Region
A part of the Nitra city cadastral territory was determined as the investigated area. The solved area is delimited by the border of the Nitra city (Figure 1). It is one self-governing region belonging to the Nitra city. For the direct application of water retention measures or blue-green infrastructure, the Chrenová part of Novosady was chosen. This is a newly created district, where water retention measures have been proposed instead of inefficient rainwater drainage, which is not one of the appropriate adaptation measures.
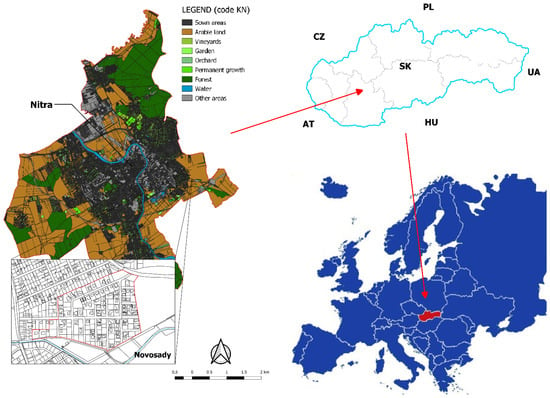
Figure 1.
Area of interest of the city of Nitra with a marked location of a specific design.
Nitra is one of the oldest and most important cities in Slovakia, spread on the Danube Uplands [38]. The city’s sewer network has been under construction since about 1950 until today. Most of the sewer network was built between 1965 and 1985. The pipelines as well as the components on the sewer network are older than 40 years [39,40].
During this time, the population has almost doubled, and the importance and production of industry has multiplied. Climatic conditions have also changed, especially the intensity of precipitation and temperature. Additionally, the area of built-up zones, which increases the runoff from Nitra during the rain [41] has grown. It makes the sewer network hydraulically overloaded [42].
The landscape of the city of Nitra and the surrounding area are much diversified, which results from its location at the border of the cologne and submontane stage. Carpathian and Pannonian biogeographical elements are represented. The diversity of landscape components is also reflected in the great diversity of habitats and the overall biodiversity of the studied area [43].
Nitra lies on an area stretching between the Zobor massif (587 m) and the hills (Kalvária 215 m, Šibeničný vrch 218.5 m), which can be considered part of the Tribeč Mountains separated by the Nitra river from the main massif. The city cadaster measures 4083 ha, of which the built-up area is 194 ha. Altitude ranges from 138 to 587 m above sea level [42].
In 2001, there were 87,285 inhabitants in the Nitra settlement. The city of Nitra is the fourth largest city in Slovakia, with a population density of 810 per square kilometer [39].
The soil cover of the Nitra is conditioned by the properties of abiotic natural factors, but it is modified by human activity. The forest soils in the Zoborské vrchy area are dominated by cambizems and rendzinas (mostly shallow to medium deep, sandy-clayey, with a higher skeleton content). In the agriculturally utilized hilly area, high-quality deep clay brown soils modal to pseudogley and also partly black earth models predominate, modus fluvizems dominate on the Nitra floodplain and gley, deep, clay-aluminous fluviums dominate. The soils of the built-up area of the city belong to the anti-lands (areas without continuous soil cover) and cultures (garden, viticultural and regulated lands). A more detailed description of soil properties is given in the documentation of [43].
The area of interest of the city belongs to the climatic region (Table 1) in the vast majority of the area from warm to very dry with a mild winter.

Table 1.
Climate region code.
We have to consider about the addressed area to solve the proposal of blue-green infrastructure. Different conditions for the proposal are for a detached house, a group of houses and different conditions are for the solution of a larger group of houses and for industrial buildings. Then we have to approach the solution of blue-green infrastructure [44,45] in urban areas [46].
2.2. Proposal Principles
Already in the first phase of planning the infiltration device, it is necessary to make sure that there are no sources of possible pollution in the area of the device hydraulic range, e.g., old landscape loads [47]. In case of doubt, it is necessary to prove by a preliminary investigation that there is no anthropogenic or geological burden with a high ability to release pollution in the area of the planned measure. Furthermore, it is necessary to prove by appropriate surveys or quality analyses that all materials of the infiltration device which come into contact with the seepage water cannot negatively affect the seepage and groundwater during continuous action.
The material load of the rainwater runoff consists of the primary precipitation pollution and the secondary load arising during the runoff process [48]. Drains from paved areas are broken down for the purpose of deliberate infiltration in terms of the pollutants concentration and the possible impact on groundwater [49].
2.3. Hydrogeological Survey
A detailed hydrogeological survey of the area is necessary for the proper functioning of rainwater management facilities. It is also necessary to carry out a probe survey due to the change of layers caused by construction activities in the urbanized area. Old environmental burdens are also an important parameter in the survey. The necessary research also requires the impact of infiltration on the geological stability of the area. It is necessary to pay close attention to the possible case of soils in certain localities, which become unstable after soaking in water.
2.3.1. Permeability of Infiltration Space
An essential condition for infiltration of precipitation runoff is sufficient permeability of soil and underground rock layers (Table 2). The permeability of soils depends mainly on the grain size, the curve of their grain size and ease. The soil structure and water temperature are equally decisive. The permeability of the rocks is expressed by the permeability coefficient kf.
Table 2.
Rock permeability classification and filtration coefficient kf [50].
In the case of incoherent rocks, the value of the coefficient is generally between 1.10−2 and 1.10−10 m.s−1. Kf values lower than 1.10−6 can only be used for infiltration with accumulation (controlled retention), so it is necessary to supplement the proposal by draining the flow. With a permeability coefficient greater than 1.10−3 m.s−1, in small thicknesses of the overburden, rainwater seeps so fast up to the groundwater level that it is not possible to achieve a residence time enough for sufficient purification by chemical and biological processes.
If the kf values are lower than 1.10−6 m.s−1, the swelling time in the infiltration device is long. This can trigger anaerobic processes in the unsaturated zone that could adversely affect its ability to capture and transform pollution. It must be taken into account that any artificial topsoil has a lower permeability than the subsoil and that its kf value is therefore decisive.
The hydraulic properties of the selected location must be sufficiently demonstrated by probes or boreholes to the extent corresponding to the size of the equipment and the considered infiltration flow.
Hydropedological Survey
Hydropedological survey carried out in this area found relatively low values of infiltration (infiltration) capacity of soils. The survey was performed at two localities with the number of 2 probes at individual depths (Table 3 and Table 4).
Table 3.
Hydropedological survey at locality 1.
Table 4.
Hydropedological survey at locality 2.
The value at a depth of 0.75 m is important for us. After conversion to units used in m.s−1, it is 3.920.10−5 and this is almost the limit value for infiltration and in the lower layer at a depth of 100 cm it is 9.676.10−6 and this is already the limit value for infiltration.
There is a second locality of the connection of Žitná, Repková and Želiarska streets (Table 4) and there are the survey values similar.
After conversion to the units used in m.s−1, it is 1.251.10−5 and this is almost the limit value for infiltration and in the lower layer at a depth of 100 cm it is 1,484.10−5, a similar value as in the previous depth.
Therefore, it is necessary to create in the solution:
- Conditions for infiltration from the surface into the infiltration device by replacing the original soil with well-permeable soil or mixing the original soil with fine sand or other well-permeable material.
- Conditions for the accumulation of water volume from design rainfall for longer-term infiltration.
- Protection of the device against the ingress of unsuitable particles that would compromise the retention space, e.g., using geotextiles.
Water retention in the soil environment before infiltration will be solved by retention in the porosity of the aggregate-we consider about 30% of the aggregate volume and in the full volume of the inserted pipes internal environment—100% of the volume.
2.3.2. Surface Runoff Volume
It expresses the amount of water for which retention measures need to be proposed. The intermediate step is to calculate the largest discharge of rainwater from the surface runoff, assuming a constant value of the design rainfall [50]. It is given by the equation:
where: Q—discharge of precipitation water from surface runoff [l.s−1], Ψ—runoff factor, q—rainfall yield (l.s−1.ha−1), S—area receiving rain (ha).
2.4. Infiltration Space Volume
The thickness of the infiltration area, relating to the average annual maximum groundwater level, should always be at least 1.0 m to ensure a sufficient seepage path for the supplied drains. With a high load of precipitation runoff and high permeability of the infiltration space, its thickness should be as high as possible [50].
In the case of harmless drains and low material loads, a volume of infiltration space of less than 1.0 m may be permitted for surface and overtaking infiltration in justified cases. It must be taken into account that in such a case it is possible to capture practically only solid particles and substances adsorbed thereon. Precipitation drains can enter directly into groundwater at thicknesses less than 0.5 m [51].
Even when designing infiltration devices, care must be taken to ensure that the unsaturated zone required for the cleaning process is preserved as much as possible.
2.5. Design Rainfall
For the design of a rainwater infiltration device, it is usually necessary to use design rainfalls [52] with a lower frequency of occurrence—0.2 or 0.1 year−1. No flooding of the device must occur during the selected design rainfall. For the indicative duration of the design rainfall, it proposes [51] to propose a surface infiltration based on a duration of T = 10 min (it is recommended that for a drainage system that drains [38] through flat parts and areas where water can be retained, this time was increased to 15 min). When calculating the overhang, groove and shaft infiltration, it is recommended to take into account the different durations. If we find the most unfavorable condition, we will suggest the system. In connection with the considerations of the overflows frequency, it is necessary to consider the situation when the infiltration object would fail, e.g., as well as after the freezing period.
2.6. Infiltration Devices Proposal
The derivation of the following dimensioned algorithms is based on the assumption of homogeneous soil conditions.
The permeability of unsaturated soil is less than the permeability of saturated soil. In simple terms, the permeability coefficient for the unsaturated zone was expressed as [51]:
Darcy’s law is taken as the hydraulic basis to determine the infiltration intensity:
where: vf—filtration rate in the saturated zone (m.s−1), kf—saturation zone permeability coefficient (m.s−1), J—hydraulic gradient (m.m−1).
The accumulation volume must be chosen depending on the intensity and duration of the precipitation so that it is maximal according to [50,51,53]. This guarantees the required operational reliability.
2.7. Use of GIS in Territorial Analysis
Geographic information systems GIS make it easier to collect all information related to the area [54] and even process a big part of the information and provide us with direct outputs. The investigated locality was processed using QGIS 3.16.3. Data from aerial laser scanning products in Slovakia [55] „Source of Aerial Laser Scanning (ALS) products: Geodesy, Cartography and Cadaster Authority of the Slovak Republic (GCCA SR) were used in the process of the maps creation. Figure 2 summarizes the key steps in the main methods used to create the proposal. We started with two basics, the digital elevation model (DEM 5.0) and the digital surface model (DSM 1.0). These are two very similar models. The same methodology was applied for both substrates.
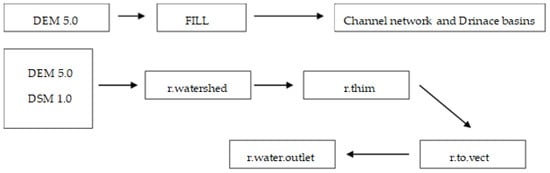
Figure 2.
Main steps in creating a proposal.
2.8. Precipitation and Air Temperature Analysis of the Area of Interest
For the analysis of air temperature and precipitation development, we used data from meteorological stations in Nitra and the surrounding rural landscape for the last 5 years (Figure 3). These are average values over the last five years and as we can see, temperatures in the city and the volume of precipitation are visibly influenced by the intensity of the urban landscape. The average total precipitation in Nitra for the years 2015–2019 is around 467.6 mm and the average temperature is 10.6 °C. In the peripheral rural landscape of the city of Nitra, precipitation is higher and the temperature lower. In rural areas, the total precipitation for the average of 2015–2019 is 507.5 mm and the temperature is 8.6 °C.
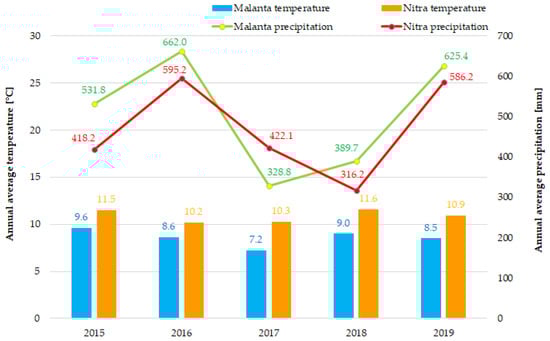
Figure 3.
Comparison of precipitation and temperatures in the city of Nitra and the Malanta (located 7 km from the city of Nitra) for the years 2015–2019.
3. Results
3.1. Surface Runoff of the city
Most of the rainwater volume flows down the paved surface of the river basin into the rain gutters and is drained from the urbanized river basins through the sewer network. In addition to volume, the surface runoff rate is also important [56], which is manifested by a reduced ability to transform the peak flow [57]. Therefore, when proposing water retention measures, it is necessary to take into account the surface runoff, in our case the value of 0.9, which represents paved areas. It was calculated as the runoff coefficient.
The results of runoff routes (Figure 4) are expressed by a comparison of two data DEM 5 and DSM 1, which we used for the same area with the same methodology and visible result. In several cases, the drainage routes at DEM 5 pass through buildings. Drainage routes DSM 1 are more accurate and counts with objects.
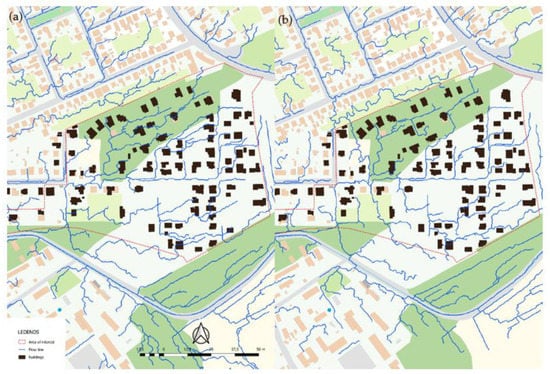
Figure 4.
Runoff routes result using (a) digital elevation model (DEM) 5 and (b) digital surface model (DSM) 1.
Accumulation of runoff (Figure 4a) is expressed on a scale from low to very strong. It is a low accumulation in our case. The length of the runoff in the urbanized area (Figure 4b) in the area of interest represents the interface from 25 to 100 m.
It is necessary to find out the runoff accumulation (Figure 5a) and runoff length in an urbanised area (Figure 5b) by GIS software to calculate the rainwater flow from the urbanised area.
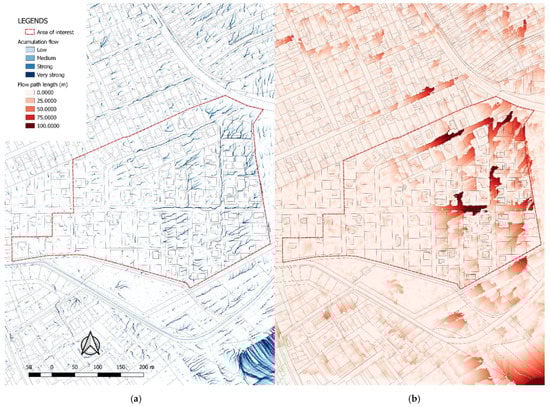
Figure 5.
Runoff accumulation (a) and runoff length in an urbanized area (b).
In order to confirm the suitability of the proposed measures, we calculated the flow of rainwater from the surface runoff (Table 5), at different intensities of rainfall yield. In our case, we calculated rainfall yield q5, q10 and q30 with the runoff coefficient for impermeable surfaces. This is the intensity of the rain in l.s−1.ha−1 for 5 min, 10 min and 30 min.
Table 5.
Rainwater flow from surface runoff at different variations of the design rainfall.
3.2. Locality proposal for the Application of Measures
We propose measures marked as measures A to D to capture outflow water from surface runoff. If we take the street link Pod Novosadmi and Tormošská (Figure 6) as the highest point of the area, then surface runoff drains into both streets and their capture is possible at the intersection of streets Pod Novosadmi and Sadová and then at the end of Pod Novosadmi street. Part of the water flows west along Tormošská Street, but it continues at the end to the territory administered by the city itself. Therefore, it is necessary to build measures to capture the drained water on the border. Here we propose measure D.
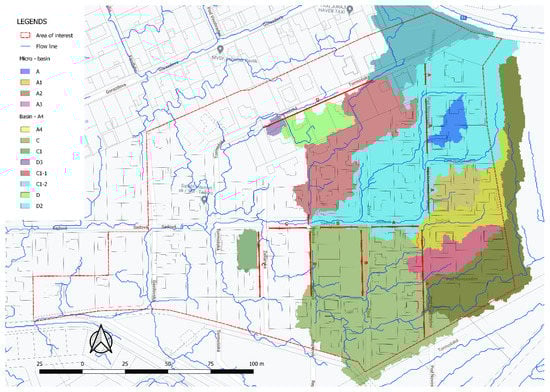
Figure 6.
Micro basins of the area with drawn water retention measures and streets of the area of interest.
Water from streets between Pod Novosadmi Street and the edge of the built-up area are addressed as part of a measure for the upper part of the street. Water from the streets—the upper part of Žitná Street and the second part of Sadova Street—are addressed in joint measure B.
The third part of Sadova Street, together with the waters from the upper part of Repkova Street, is solved by capturing the waters in measure C.
At the end of Pod Novosadmi Street at its lowest part, a small wetland infiltration evaporation area could be built on unused land to drain water from the lower part of the street. This element is not in the plan due to its location in the public area of the city but would create the necessary change of the unused area.
3.3. Proposed Measure
Infiltration and retention groove is one of the possible solutions for the rainwater in the Novosady area, given that most engineering networks and house connections have already been built and currently all existing lines, including energy and notification networks, need to be addressed by crossing.
The infiltration groove is a deep line infiltration device filled with a permeable gravel material with a grain size of 8/16/32 mm, with a retention created by inserting drainage pipes (Figure 7; Figure 8), which create a free retention space with infiltration into more permeable soil layers. The water supply is secured over the surface and the enter or end shaft. The surface water supply will be carried out through a grassy lane with partitions at a distance of about 10 m, which will reduce the speed of the drained water and create a very short water retention for soaking during rain. The enter and end shafts allow the inflow of water from the connected streets and at the same time create conditions for the capture of the introduced impurities, which improves the pre-treatment of the rainwater flowing into the infiltration device, thus preventing the infiltration spaces from clogging.
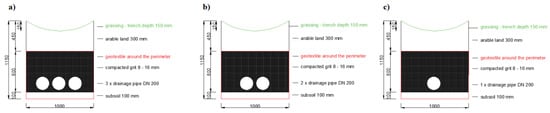
Figure 7.
Cross-sections of the drainage pipe bearing–(a) installation of three drainage pipes (DN 200)–(b) installation of two drainage pipes (DN 200)–(c) installation of only one drainage pipe (DN 200).
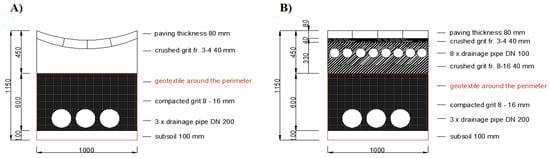
Figure 8.
Proposal of the solution of crossings through the infiltration groove before entering the estate—(A) copying the terrain overlay—(B) In the flat but using additional drainage and permeable material.
It is necessary to combine infiltration with sufficient accumulation capacity for a longer infiltration period in case of insufficient infiltration capacity of the soil environment (approximately K < 1.10−6 m.s−1) and infiltration equipment, proven by geological survey.
The proposed installation of infiltration grooves is shown in the situation of the area (Figure 6). Each street is marked whether it is infiltration with one, two or three drainage pipes with a diameter of DN 200. In the situation is drawn a system for slowing down the so-called water. partitions, every 10 m. The material used for the partition system is a pavement concrete curb with dimensions of 1000 × 50 × 200 mm. The entire system of infiltration grooves is connected under the communication into an unified network with a final spillway. Cross-section of the infiltration groove with the fitting of flexible drainage pipes PVC-U DN 200, with perforation (Figure 7). The section also shows the basic parameters for backfill and backfill fractions, geotextile placement, infiltration groove shape.
Proposal for the solution of passages through the infiltration groove was also created for the needs of access to the houses (Figure 8). Two variants were proposed, the first copying the terrain overlay (Figure 8A) and the second in the flat (Figure 8B) but using additional drainage and permeable material.
4. Discussion
Interest in water retention [58] in urban areas has been growing in the last decade. New legislation is being prepared, technical standards in several countries are being adapted to specific localities by proposing blue-green infrastructure, which includes major rainwater problems [53]. The disadvantage of cities is that they have a long-term approval of spatial planning documentation. Therefore, the promotion of new ways of rainwater management [59] is slowly getting into practice. It is similar in the solved area of the city of Nitra. Finding places to solve encounters many problems-land ownership, soil conditions, slope of the area, protection zones of other above-ground and underground objects or contamination of the area in recent years.
The city of Nitra solves all the above problems in finding suitable sites for rainwater management. The problem is simple. The city as the owner of a sewer network, which is due to new construction, population growth and paved areas very hydraulically and materially overloaded and needs a significant reconstruction or water retention in the area to reduce the hydraulic load. Both methods are costly and time consuming. Therefore, during the construction of new residential zones, the city allows the inhabitants only the statutory safe drainage of wastewater. The solution of rainwater management is therefore up to the inhabitants of the new localities and this is the solution that we presented and prepared for this locality.
In the given locality, it was possible to use water infiltration as a solution. At the locality [60] there are suitable conditions of land ownership, pedological conditions, the slope of the territory and also the interest of the inhabitants in the ecological solution. Soil for infiltration has borderline properties for infiltration, but as a detention-infiltration solution, rainwater management is possible. However, there are many localities in the city with a high level of groundwater, areas with a great slope, where there is a risk of landslides when getting wet. There are also several localities in the city after previous industrial companies, which have already disappeared but dangerous substances for groundwater were used on their premises.
The decision on suitable sites therefore needs a detailed knowledge of current and historical conditions. Urban areas are characterized by a high proportion of impermeable areas (e.g., roads, roofs of buildings), which in urban centers reaches 70% or more [61]. Water raining on the surface of a river basin during precipitation cannot naturally infiltrate the groundwater collector. The level of evapotranspiration (evaporation) is also reduced compared to natural conditions [62].
5. Conclusions
This study is based on the use of QGIS tools in proposing water retention measures that are needed to improve the city’s microenvironment. We use two variants for surface runoff determination using QGIS. The first variant, based on the DEM 5 model, evaluates the area of interest without any obstacles, which means that it does not take into account obstacles in the form of buildings, roads and others. The second variant is processed using DSM 1, which evaluates the area of interest with obstacles in the form of trees, buildings and evaluates the bypass around these areas. The underlying model DSM 1 is more suitable for the use and rapid analysis of the area, but if it is an open space territory, DEM 5 is more suitable. In an urbanized area, the first variant is more suitable for the application of water retention measures, as a basis for the specific location of the measure, which support the collection of rainwater in the area. This causes an improvement in the microenvironment of the area and saves the city’s budget in building a heavy rainwater drainage system, which has no positive effect on the microclimate. The results of the study presented in this document have a practical possibility of application and can be used as a guide for potential investors because it is necessary to take into account the application of rainwater management during the initial planning of the area. This will simplify processes and reduce errors when crossing with engineering networks. The outlined study indicates the need to continue research on the reliability of rainwater management practices. It is necessary to adapt the application of similar proposals in practice.
The city of Nitra was selected as a representative city, which will be used as a model city for Slovakia in creating a methodology for the application of blue-green infrastructure (BGI). At present, the territory of Slovakia is dealing with the issue of heavy rains and the changing climate. Therefore, it was necessary to start steps for the application of BGI in an urbanized country in Slovakia. The city of Nitra is a model area for the application of BGI, because we obtained our own and comprehensive data from the city, soil and climatic conditions. Basic monitoring will be performed, which will help other cities in the country.
Author Contributions
Conceptualization, J.P.; data curation, J.P. and Ľ.J.; investigation, J.P. and K.H.; methodology, J.P. and Ľ.J. and L.L.; writing—original draft, J.P. and Ľ.J.; writing—review and editing, J.P., Ľ.J., M.E.B. and R.H. All authors have read and agreed to the published version of the manuscript.
Funding
This research was funded by the Slovak Research and Development Agency (APVV), grant number 16-0278.
Institutional Review Board Statement
Not applicable.
Informed Consent Statement
Not applicable.
Data Availability Statement
Not applicable.
Acknowledgments
"This publication is the result of the project implementation: Scientific support of climate change adaptation in agriculture and mitigation of soil degradation (ITMS2014+ 313011W580) supported by the Integrated Infrastructure Operational Programme funded by the ERDF.
Conflicts of Interest
The authors declare no conflict of interest. The funder had no role in the design of the study; in the collection, analyses, or interpretation of data; in the writing of the manuscript, or in the decision to publish the results.
References
- Lewis, D.M. The Hellenistic Period. In Handbook of Ancient Water Technology; Wikander, Ö., Ed.; Brill: Leiden, The Netherlands; Boston, MA, USA, 2000; pp. 631–648. [Google Scholar]
- Evans, H.B. Water Distribution in Ancient Rome: The Evidence of Frontius; University of Michigan Press: Ann Arbor, MI, USA, 1994; ISBN -0-472-08446-3. [Google Scholar] [CrossRef]
- Koutsoyiannis, D.; Zarkadoulas, N.; Angelakis, A.N.; Tchobanoglous, G. Urban water management in Ancient Greece: Legacies and lessons. ASCE J. Water Resour. Plan. Manag. 2007. [Google Scholar] [CrossRef]
- Jansen, M. Water supply and sewage disposal at Mohenjo-Daro. World Archaeol. 1989, 177–192, online 2010. [Google Scholar] [CrossRef]
- Sulas, F.; French, K.; Scarborough, V.L. Water and ancient cities: Urban supply systems. WIREs Water 2020, 7. [Google Scholar] [CrossRef]
- Altaweel, M. Southern Mesopotamia: Water and the rise of urbanism. WIREs Water 2019, 6, e1362. [Google Scholar] [CrossRef]
- Singh, P.K.; Dey, P.; Jaina, S.K.; Pradeep, P.; Mujumdar, P.P. Hydrology and water resources management in ancient India. Hydrol. Earth Syst. Sci. 2020, 24, 4691–4707. [Google Scholar] [CrossRef]
- De Feo, G.; Antoniou, G.; Fardin, H.F.; El-Gohary, F.; Zheng, X.Y.; Reklaityte, I.; Butler, D.; Yannopoulos, S.; Angelakis, A.N. The Historical Development of Sewers Worldwide. Sustainability 2014, 6, 3936–3974. [Google Scholar] [CrossRef]
- Rogers, D.K. Water culture in Roman society. Brill Res. Perspect. Anc. Hist. 2018, 1, 1–118. [Google Scholar] [CrossRef]
- Scobie, A. Slums, sanitation, and mortality in the Roman world. Klio 1986, 68, 399–433. [Google Scholar] [CrossRef]
- Angelakis, A.N.; Wilderer, P.A.; Rose, J.B.; Hunter, M. Sanitation and wastewater technologies in ancient Roman cities. In Evolution of Sanitation and Wastewater Technologies through the Centuries; IWA Publishing: London, UK, 2014; Volume 13, ISBN 9781780404844. [Google Scholar] [CrossRef]
- Spellman, F.R. Handbook of Water and Wastewater Treatment Plant Operations; CRC Press: Boca Raton, FL, USA, 2013; ISBN 1-56670-627-0. [Google Scholar] [CrossRef]
- Staddon, C.; Ward, S.; DeVito, L.; Zuniga-Teran, A.; Gerlak, A.; Schoeman, Y.; Hart, A.; Booth, G. Contributions of green infrastructure to enhancing urban resilience. Environ. Syst. Decis. 2018, 38, 330–338. [Google Scholar] [CrossRef]
- Wong, H.F.T.; Wang, J.B. Ecological landscapes, water sensitive urban design and green infrastructure. Chin. Landscp. Archit. 2014, 4, 20–24. [Google Scholar]
- Liu, H.; Jia, Y.; Niu, C. “Sponge city” concept helps solve China’s urban water problems. Environ. Earth Sci. 2017, 76, 473–479. [Google Scholar] [CrossRef]
- Chan, F.K.S.; Griths, J.A.; Higgitt, D.; Xu, S.; Zhu, F.; Tang, Y.-T.; Thorne, C.R. 2018 “Sponge City” in China—A breakthrough of planning and flood risk management in the urban context. Land Use Policy 2018, 76, 772–778. [Google Scholar] [CrossRef]
- Charlesworth, S.M. A review of the adaptation and mitigation of global climate change using sustainable drainage in cities. J. Water Clim. Chang. 2010, 1, 165–180. [Google Scholar] [CrossRef]
- Mark, O.; Svensson, G.; König, A.; Linde, J.J. Analyses and Adaptation of Climate Change Impacts on Urban Drainage Systems. In Proceedings of the 11th International Conference on Urban Drainage, Edinburgh, Scotland, 31 August–5 September 2008; Available online: https://www.researchgate.net/publication/257343295_Analyses_and_Adaptation_of_Climate_Change_Impacts_on_Urban_Drainage_Systems (accessed on 27 July 2020).
- Grum, M.; Jørgensen, A.T.; Johansen, R.M.; Linde, J.J. The effect of climate change on urban drainage: An evaluation based on regional climate model simulation. Water Sci. Technol. 2006, 54, 9–15. [Google Scholar] [CrossRef]
- Kleidorfer, M.; Möderl, M.; Sitzenfrei, R.; Urich, C.; Rauch, W. A case independent approach on the impact of climate change effects on combined sewer system performance. Water Sci. Technol. 2009, 60, 1555–1564. [Google Scholar] [CrossRef] [PubMed]
- Berggren, K.; Olofsson, M.; Viklander, M.; Svensson, G.; Gustafsson, A.-M. Hydraulic Impacts on Urban Drainage Systems due to Changes in Rainfall Caused by Climatic Change. J. Hydrol. Eng. 2012, 17, 92–98. [Google Scholar] [CrossRef]
- Shahrestani, M.; Yao, R.; Luo, Z.; Turkbeyler, E.; Davies, H. A field study of urban microclimates in London. Renew. Energy 2015, 73, 3–9. [Google Scholar] [CrossRef]
- Yao, R.; Luo, Q.; Li, B. A simplified mathematical model for urban microclimate simulation. Build. Environ. 2011, 46, 253–265. [Google Scholar] [CrossRef]
- Overland, J.; Hall, R.; Hanna, E.; Karpechko, A.; Vihma, T.; Wang, M.; Zhang, X. The Polar Vortex and Extreme Weather: The Beast from the East in Winter 2018. Atmosphere 2020, 11, 664. [Google Scholar] [CrossRef]
- Kew, S.F.; Philip, S.Y.; Jan van Oldenborgh, G.; van der Schrier, G.; Otto, F.E.; Vautard, R. The exceptional summer heat wave in southern Europe 2017. Bull. Am. Meteorol. Soc. 2019, 100, S1–S4. [Google Scholar] [CrossRef]
- Overland, J.E.; Wang, M. Impact of the winter polar vortex on greater North America. 1096. Int. J. Climatol. 2019, 39, 5815–5821. [Google Scholar] [CrossRef]
- Overland, J.; Ballinger, T.J.; Cohen, J.; Francis, J.; Hanna, E.; Jaiser, R.; Kim, B.M.; Kim, S.-J.; Ukita, J.; Vihma, T.; et al. How do intermittency and simultaneous processes obfuscate the Arctic influence on midlatitude winter extreme weather events? Environ. Res. Lett. 2021, in press. [Google Scholar] [CrossRef]
- Akbari, H.; Cartalis, C.; Kolokotsa, D.; Muscio, A.; Pisello, A.L.; Rossi, F.; Santamouris, M.; Synnef, A.; Wong, N.H.; Zinzi, M. Local climate change and urban heat island mitigation techniques—The state of the art. J. Civ. Eng. Manag. 2015, 22, 1–16. [Google Scholar] [CrossRef]
- Aflaki, A.; Mirnezhad, M.; Ghaffarianhoseini, A.; Ghaffarianhoseini, A.; Omrany, H.; Wang, Z.-H.; Akbari, H. Urban heat island mitigation strategies: A state-of-the-art review on Kuala Lumpur, Singapore and Hong Kong. Cities 2017, 62, 131–145. [Google Scholar] [CrossRef]
- Pokrývková, J.; Jurík, Ľ. Water Retention in Urban Areas in the Danube Region: Study on Facts, Activities, Measures and Their Financial Assessment; Slovak University of Agriculture: Nitra, Slovkia, 2020; ISBN 9788055222998. [Google Scholar] [CrossRef]
- FHH (Freieund Hansestadt Hamburg, Behördefür Umweltund Energie). Leitfadenzur Versickerungspotenzialkarte. ErstelltimRahmendes Projekts RISA—Regen Infra Struktur Anpassung, AK Kartenwerkder AG Siedlungswasserwirtschaft/QTTechnische Grundlagen. Hamburg. Available online: http://www.hamburg.de/contentblob/4305390/057e02747c2f0446eae94721c5e6ab28/data/leitfaden-versickerungspotentialkarte.pdf (accessed on 10 June 2020).
- Wang, R.; Eckelman, M.J.; Zimmerman, J.B. Consequential environmental and economic life cycle assessment of green and gray stormwater infrastructures for combined sewer systems. Environ. Sci. Technol. 2013, 47, 11189–11198. [Google Scholar] [CrossRef] [PubMed]
- Mahabadi, M. Regenwasserversickerung, Regenwassernutzung. Plan. Bauweisen 2012, 255 S. [Google Scholar]
- Strukturplan Regenwasser 2030. Zukunftsfähiger Umgang mit Regenwasser in Hamburg. Available online: https://www.hamburg.de/contentblob/5052102/ce82e43a889d30427957ce0311f78b9d/data/d-risa-strukturplan-regenwasser-2030.pdf (accessed on 10 June 2020).
- Kabelková, I. Dešťovou vodu ve městě chceme, ale neumíme ji tam udržet. In Proceedings of the Konference Počítáme s Vodou, Hospodaření s Vodou Jako Nástroj k Rozvoji Měst, Prague, Check Republic, 23 October 2018; Available online: https://www.pocitamesvodou.cz/konference-pocitame-s-vodou-2018/ (accessed on 10 June 2020).
- Liu, L.; Fryd, O.; Zhang, S. Blue-Green Infrastructure for Sustainable Urban Stormwater Management—Lessons from Six Municipality-Led Pilot Projects in Beijing and Copenhagen. Water 2019, 11, 2024. [Google Scholar] [CrossRef]
- Fenner, R. Spatial Evaluation of Multiple Benefits to Encourage Multi-Functional Design of Sustainable Drainage in Blue-Green Cities. Water 2017, 9, 953. [Google Scholar] [CrossRef]
- Grežo, H.; Močko, M.; Izsóff, M.; Vrbičanová, G.; Petrovič, F.; Straňák, J.; Muchová, Z.; Slámová, M.; Olah, B.; Machar, I. Flood Risk Assessment for the Long-Term Strategic Planning Considering the Placement of Industrial Parks in Slovakia. Sustainability 2020, 12, 4144. [Google Scholar] [CrossRef]
- Hreško, J.; Pucherová, Z.; Baláž, I.; Ambros, M.; Bezák, P.; Bírová, L.; Boltižiar, M.; Bridišová, Z.; Bugár, G.; Ceľuch, M.; et al. Krajina Nitry a Jej Okolia—Úvodná Etapa Výskumu; Fakulta Prírodných Vied, Univerzita Konštantína Filozofa: Nitra, Slovakia, 2006; p. 183. ISBN 80-8094-066-5. [Google Scholar]
- Mišovičová, R. Classification and evaluation of town Nitra’s contact area. Probl. Landsc. Ecol. Four Dimens. Landsc. 2012, 15, 1899–3850. [Google Scholar]
- EEA Europa. 2021. Available online: https://www.eea.europa.eu/sk/signaly-eea/signaly-2018/clanky/klimaticka-zmena-a-voda-2013 (accessed on 10 June 2020).
- Jarabica, V.; Kuruc, M. Územný Plán Mesta Nitra, Aktualizácia 2018, San-Huma ‘90 s.r.o., Nitra. Available online: https://www.google.com/url?sa=t&rct=j&q=&esrc=s&source=web&cd=&cad=rja&uact=8&ved=2ahUKEwjy5_Gjs9vuAhVEyxoKHUxXAHgQFjABegQIAhAC&url=https%3A%2F%2Fwww.nitra.sk%2FFiles%2FShowFile%2F70102&usg=AOvVaw0ffbhPSQmar6nfDDivBaOO (accessed on 27 July 2020).
- Rózová, Z. Miestny Územný Systém Ekologickej Stability Mesta Nitry, San-Huma ‘90 s.r.o. a; Regioplán: Nitra, Slovakia, 1997. [Google Scholar]
- Ahmed, S.; Meenar, M.; Alam, A. Designing a Blue-Green Infrastructure (BGI) Network: Toward Water-Sensitive Urban Growth Planning in Dhaka, Bangladesh. Land 2019, 8, 138. [Google Scholar] [CrossRef]
- Versini, P.A.; Kotelnikova, N.; Poulhes, A.; Tchiguirinskaia, I.; Schertzer, D.; Leurent, F. A distributed modelling approach to assess the use of Blue and Green Infrastructures to fulfil stormwater management requirements. Land. Urban Plan. 2018, 173, 60–63. [Google Scholar] [CrossRef]
- Jurík, L.; Pokrývková, J. Urban Water retention—Theoretical Aspects and Practical Measures Zadržiavanie vody v mestách—Teória a praktické riešenia. Zivotn. Prostr. 2018, 52, 42–48. [Google Scholar]
- Chahar, B.R.; Graillot, D.; Gaur, S. Storm-water management through infiltration trenches. J. Irrig. Drain. Eng. 2012, 138, 274–281. [Google Scholar] [CrossRef]
- Ngamalieu-Nengoue, U.A.; Martínez-Solano, F.J.; Iglesias-Rey, P.L.; Mora-Meliá, D. Multi-Objective Optimization for Urban Drainage or Sewer Networks Rehabilitation through Pipes Substitution and Storage Tanks Installation. Water 2019, 11, 935. [Google Scholar] [CrossRef]
- Zeleňáková, M.; Diaconu, D.C.; Haarstad, K. Urban Water Retention Measures. Procedia Eng. 2017, 190, 419–426. [Google Scholar] [CrossRef]
- DWA-A 138-Planung, Bau und Betrieb von Anlagen zur Versickerung von Niederschlagswasser, Regelwerk Abwasser-Abfall der Abwassertechnischen Vereini¬gung, Gesellschaft, 2008. Available online: https://webshop.dwa.de/de/kommentar-dwa-a-138-8-2008.html (accessed on 15 July 2020).
- Výleta, R.; Kohnová, S.; Valent, P. Riešené Úlohy z Hydrológie I.—Povodie, Zrážky, Prietok a Hydrologická Bilancia; Slovenská Technická Univerzita v Bratislave vo Vydavateľstve SPEKTRUM STU: Bratislava, Slovakia, 2018; ISBN 978-80-227-4887-2. [Google Scholar]
- Zelenakova, M.; Alkhalaf, I.; Harbulakova, V.O. Applying of dimensional analysis in rainwater management systems design. In Advances and Trends in Engineering Sciences and Technologies—Proceedings of the International Conference on Engineering Sciences and Technologies; Tatranská Štrba, High Tatras mountains, Slovakia, 27–29 May 2015; 2016; pp. 443–448. Available online: https://books.google.sk/books?hl=sk&lr=&id=2HW9CgAAQBAJ&oi=fnd&pg=PA443&ots=UVCj9fN-Gj&sig=V3zzW6wBlczmS0DaKEWFRyoXsH0&redir_esc=y#v=onepage&q&f=false (accessed on 27 July 2020).
- Vitek, J.; Stránsky, D.; Kabelková, I.; Bereš, V.; Vitek, R. Hospodaření s Dešťovou Vodou v ČR; 01/71 ZO ČSOP Koniklec: Prague, Chech Republic, 2015; ISBN 978-80-260-7815-9. [Google Scholar]
- Abedin, S.J.H.; Stephen, H. GIS Framework for Spatiotemporal Mapping of Urban Flooding. Geosciences 2019, 9, 77. [Google Scholar] [CrossRef]
- Zdroj Produktov LLS. ÚGKK SR. Available online: https://www.geoportal.sk/sk/udaje/lls-dmr/ (accessed on 15 July 2020).
- Taleb, D.; Abu-Hijleh, B. Urban heat islands: Potential effect of organic and structured urban configurations on temperature variations in Dubai, UAE. Renew. Energy 2013, 50, 747–762. [Google Scholar] [CrossRef]
- Hurlimann, A.; Wilson, E. Sustainable urban water management under a changing climate: The role of spatial planning. Water 2018, 10, 546. [Google Scholar] [CrossRef]
- Starzec, M.; Dziopak, J.; Słyś, D. An Analysis of Stormwater Management Variants in Urban Catchments. Resources 2020, 9, 19. [Google Scholar] [CrossRef]
- Kruize, H.; van der Vliet, N.; Staatsen, B.; Bell, R.; Chiabai, A.; Muiños, G.; Higgins, S.; Quiroga, S.; Martinez-Juarez, P.; Aberg Yngwe, M.; et al. Urban Green Space: Creating a Triple Win for Environmental Sustainability, Health, and Health Equity through Behavior Change. Int. J. Environ. Res. Public Health 2019, 16, 4403. [Google Scholar] [CrossRef] [PubMed]
- Szomorová, L.; Halaj, P.; Čimo, J. Analýza Zrážkových Zmien v Lokalite; Slovenská Poľnohospodárska Univerzita v Nitre; Veda Mladých: Nitra, Slovakia, 2013; pp. 285–294. [Google Scholar]
- Guo, C.; Li, J.; Li, H.; Zhang, B.; Ma, M.; Li, F. Seven-Year Running Effect Evaluation and Fate Analysis of Rain Gardens in Xi’an, Northwest China. Water 2018, 10, 944. [Google Scholar] [CrossRef]
- O’Donnell, E.C.; Netusil, N.R.; Chan, F.K.S.; Dolman, N.J.; Gosling, S.N. International Perceptions of Urban Blue-Green Infrastructure: A Comparison across Four Cities. Water 2021, 13, 544. [Google Scholar] [CrossRef]


Publisher’s Note: MDPI stays neutral with regard to jurisdictional claims in published maps and institutional affiliations. |
© 2021 by the authors. Licensee MDPI, Basel, Switzerland. This article is an open access article distributed under the terms and conditions of the Creative Commons Attribution (CC BY) license (https://creativecommons.org/licenses/by/4.0/).