Abstract
The development of China’s resource industry is facing great pressures from industrial structure adjustment and environmental restraints, and the sustainable risk of the provincial resource industry is different. Considering the development of the resource industry and environmental pressure, this article selects the panel data of 31 provinces from 2015 to 2019 to construct an index evaluation system with six dimensions: influence, induction, supply and demand safety, regional pollution emission, environment quality, and pollution control. The results showed that Shanxi, Anhui, Jiangsu, and Shanghai had the highest sustainable risk in the resource industry, while Heilongjiang, Jilin, Tianjin, Fujian, Jiangxi, Hunan, Guizhou, Sichuan, and Qinghai had the lowest sustainable risk. The resource industry model of all the provinces is divided into sustainable, industrial, ecological, and unsustainable. Finally, this article puts forward reasonable suggestions for the four scenarios and argues that the balanced development of the resource industry sector and environmental protection is conducive to reducing the sustainable risks of the resource industry.
1. Introduction
The development of China’s resource industry presents provincial differences, and there are outstanding contradictions between the development of the resource industry sector and environmental protection. As an important foundation of the regional economy and people’s livelihoods, its sustainable development is also necessary to guarantee regional sustainable development, and a two-way drive in the resource industry sector and environmental protection must be maintained [1,2,3]. An assessment of the sustainable risks of China’s provincial resource industries is conducive to the analysis of the resource industry sector’s development and environmental pressure problems in 31 provinces, providing reasonable suggestions for the regional differences in the sustainable development of the resource industry based on the analysis results, as well as means to avoid the sustainable risks of the resource industry so that the sustainable development of the resource industry nationwide can be realized.
Different fields are paying more and more attention to sustainable development, and the results of sustainable risk assessments affect the trends of economic development. Carrying out sustainable risk assessments on specific regions or industries can help find problems in a timely manner, and the government can propose sustainable development plans based on the results to promote the continued development of regions or industries [4,5,6,7,8]. As a developing country with a good development trend, China is facing an important node of economic transformation, and the middle-income trap is the primary problem it faces. Once China enters the middle-income trap, its economic development will face huge challenges, and there will also be the possibility of social disorder [9,10,11]. At the same time, the Dutch disease is an economic problem closely related to the resource industry. In the process of social and economic development, if a primary production sector makes an exceptionally outstanding contribution to the economic structure, it may lead to the decline of other industrial sectors. This affects the extreme development of the economic structure, and this phenomenon has begun to appear in some cities in China [12,13]. Whether it is the middle-income trap or the Dutch disease, both are important macroeconomic issues that developing countries may face in the process of economic growth, and they have the unsustainable risks of some industrial development in common. Therefore, the sustainable risk assessment of China’s resource industry can promptly discover the inhibitory factors restricting its development [14,15,16,17,18]. From the perspective of the industrial structure, the primary processing and extended industry sectors of minerals and oil and gas resource products constitute the main body of the resource industry. There are eight sectors that are often used to measure the development of regional resource industries, such as coal mining products, oil and gas extraction products, metal ore mining products, non-metallic minerals and other mining and beneficiation products, petroleum, coking products and nuclear fuel processing products, non-metallic mineral products, metal smelting and rolled products, and metal products [19,20]. The construction of an ecological civilization is an important part of China’s current sustainable economic development. The sustainable development of the regional economy must adhere to the two-way drive of ecological protection and industrial optimization. The resource industry sector, especially, needs to pay attention to the environmental problems it causes. Improving the environmental response capacity of the resource industry can effectively avoid the loss of benefits caused by environmental pressures. In the long run, the eco-friendly resource industry is an effective way to break the “resource curse” and “intergenerational risk” [21,22,23,24,25].
Sustainable risk is a key factor that affects the green and stable development of a sector or regional economy. From a spatial perspective, it mainly includes the sustainable development of a specific industry or region. At present, environmental protection sectors and policy protection sectors have low sustainable risks, and resource-consuming sectors have higher sustainable risks. The sustainable risk of economically developed areas is lower than that of areas with low and medium levels of development [26,27]. The sustainable risk assessment of different regions or industries requires a comprehensive assessment from multiple dimensions such as economy, society, and ecological environment. Evaluating economic development issues in a certain field from a single dimension may cause problems that are inconsistent with the actual situation. At the same time, the lack of reference to necessary indicators will have a greater impact on the accuracy of economic evaluation [28,29]. At present, macroeconomic analysis and micro-observation calculations are mostly used to analyze social and economic issues. Among them, risk assessment, fuzzy comprehensive evaluation, goal planning, neural networks, and econometric methods are primarily used to analyze matters of sustainable economic development [30,31,32,33,34,35]. Research on the sustainable development of the regional resource industry has gradually become a hotspot in industrial economic research. Many scholars in economics and interdisciplinary fields have begun to propose solutions to the bottleneck of the development of the resource industry, but most scholars only focus on a unilateral discussion [36,37,38]. When reviewing the sustainable development of the resource industry, we found that their main focus is on the improvement of industrial capacity and the improvement of the regional environment, and the two studies are independent of each other. Those scholars mostly use mature methods or quantitative analysis software to analyze certain economic issues, and the results lack a suitable quantitative model to support the sustainable risk assessment of the resource industry [39,40].
As a supplementary study to related research results, this article proposes to take China’s provincial-level resource industry as the research object and build a comprehensive evaluation system of the two dimensions of resource industry sector development and environmental pressure. A total of 23 indicators—such as the influence coefficient of the resource industry sector, the sensitivity coefficient, the trade situation of the resource industry sector, and environmental quality—were selected to support the quantitative model so as to realize the quantitative evaluation of China’s provincial-level resource industry. In response to the evaluation results, we put forward rationalized sustainable development ideas based on the actual economic development of the region.
2. Framework, Model, and Methods
2.1. The Framework
On the basis of literature review, this article constructs a quantitative evaluation model, selects evaluation indicators, and evaluates the sustainable risks of the resource industry in 31 provinces in China. The main content of the research includes model design, method introduction, data processing, result analysis, and recommendations (Figure 1).
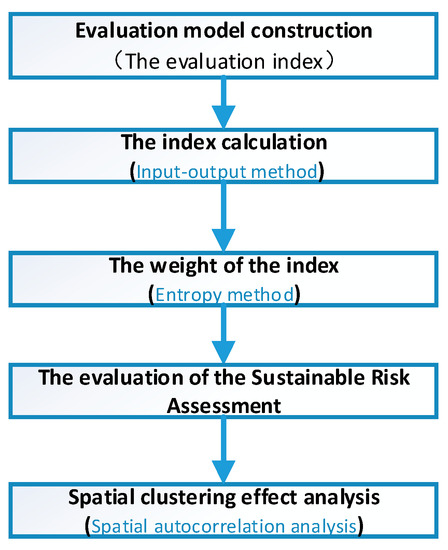
Figure 1.
The overall framework.
2.2. The Model
2.2.1. The Assessment Index System
There are large spatial differences in the sustainable risks of China’s resource industry. In the provincial region, indicators such as resource endowment, industrial foundation, industrial structure, and environmental pressure have varying degrees of impact on the sustainability of the regional resource industry [41,42,43,44]. Therefore, while assessing the sustainable risks of China’s provincial regions, it is necessary to choose appropriate methods to reasonably assign weights to various indicators. This article uses comprehensive evaluation methods to achieve quantitative analysis and guide the sustainable development of China’s provincial resource industries.
The sustainable development of China’s provincial-level resource industry is mainly constrained by the development of the resource industry sector and environmental pressures. Based on previous research foundations [45,46,47], it is believed that simply considering sectoral trade conditions cannot fully reflect the interaction between industries. This article uses the input-output method to analyze the interaction between the resource industry sector and other industry sectors, and comprehensively analyzes the development of the regional resource industry sector in combination with the trade situation of the sector. At the same time, it considers the indicators of regional pollution emissions, regional environmental quality, and pollution control investment, and a comprehensive and objective evaluation of the sustainable risks of China’s provincial-level resource industry has been made (Figure 2).
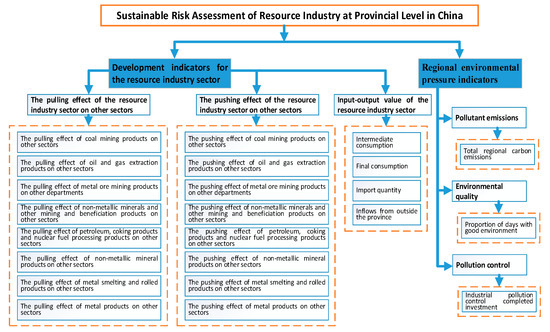
Figure 2.
Sustainable risk assessment system of China’s provincial resource industry.
In the assessment system, the main body of the resource industry primarily consists of eight sectors: coal mining products, oil and gas extraction products, metal ore mining products, non-metallic minerals and other mining and beneficiation products, petroleum, coking products and nuclear fuel processing products, non-metallic mineral products, metal smelting and rolled products, metal products. We used their pushing and pulling effects on other sectors as single indicators. The intermediate use, final use, import, and domestic inflows from other provinces in the resource industry jointly support the supply security system. Among the regional environmental pressure indicators, indicators such as regional carbon emissions, the percentage of days with good environmental conditions, and the amount of investment in industrial pollution control determine the environmental quality.
2.2.2. The Sustainable Risks Assessment Model
In order to assess the sustainable risks of China’s provincial-level resource industry, this article constructs comprehensive evaluation indicators from the two dimensions of resource industry sector development and regional environmental pressure. The development of the resource industry sector is greatly affected by the industrial structure and the safety of the supply and demand of the sector. Therefore, it is necessary to consider the influence and sensitivity of the resource industry sector on other sectors, as well as the output difference of the industrial sector. Regional environmental pressure must be comprehensively considered from the perspective of regional pollution emissions, the overall environment, and pollution control.
The development of the resource industry sector is positively affected by its influence and sensitivity on other sectors—that is, the greater the influence and sensitivity coefficients of the resource industry sector are, the stronger the pulling or pushing effect of the resource industry sector on other sectors will be. It is positively affected by the output of the resource industry sector—that is, the greater the output is, the more prosperous the industrial sector will be.
is the economic added value of the resource industry sector through the integration of production factors in the accounting year, is the resource industry sector invests part of its output in other sectors, is the capital consumption paid by the resource industry sector to maintain production activities, is the amount of foreign production materials invested in the resource industry sector, and is the amount of production materials outside the province invested in the resource industry sector.
is the economic development level of the resource industry sector without considered other factors; , , and are the weights of each indicator; is the influence coefficient; and is the inductance coefficient.
Regional environmental pressure indicators are subject to regional pollution emissions, the overall environment, and pollution control conditions. Only the overall environmental conditions are selected as negative indicators—that is, the greater the regional pollution emissions are, the lower the proportion of days with good environmental conditions is, and the higher the pollution investment is, the greater the regional environment pressure will be.
is the regional environmental pressure; , , and are the weights of each indicator; is the total carbon emissions; is the percentage of the region’s annual environmentally good days; and is the total pollution control investment.
The sustainable risk of the regional resource industry is constrained by the development of the resource industry sector and environmental pressure. Therefore, when considering the sustainable risk of the provincial resource industry in China, it is necessary to comprehensively evaluate the development of the regional resource industry sector and the environmental pressure subdivision indicators. The development of the regional resource industry sector is a negative indicator, and the environmental pressure is a positive indicator—that is, the smaller and the larger are, the greater the sustainable risk of the regional resource industry will be.
is the sustainable risk of the regional resource industry, and and are the weights of the indicators.
2.3. The Methods
2.3.1. The Calculation of the Index
In order to analyze the impact of the interaction between the resource industry sectors on the sustainability of the regional resource industry, the article introduces the pulling and pushing influence indicators of the resource industry sector on other sectors. Here we mainly use the input-output table to calculate the influence coefficient and the inductance coefficient of the resource industry sector [48,49]. The main indicators and accounting steps are as follows.
(1) The direct consumption coefficient, also known as the input coefficient, refers to the quantity of the sector directly consumed by the unit’s total output of the sector in the production and operation process.
is the direct consumption coefficient, is the quantity of products or services of sector directly consumed in the production and operation of sector , and is the total input of sector .
(2) is the Leontief inverse matrix.
is the identity matrix, and is the direct consumption coefficient matrix.
(3) The inductance coefficient refers to the degree of demand sensitivity that a certain sector receives when each additional unit of the national economy is finally used—that is, the amount of output that the sector needs to provide for the production of other sectors. The larger the coefficient is, the stronger the pushing effect towards economic development will be.
is the inductance coefficient, is the sum of the rows of the Leontief inverse matrix, and is the average of the row sums of the Leontief inverse matrix.
The influence coefficient refers to the extent to which the production demand of each department is affected when a certain product sector of the national economy increases by a unit of final product. The larger the influence coefficient is, the stronger the pulling effect towards economic development will be.
is the influence coefficient, is the sum of columns of Leontief’s inverse matrix, and is the average value of column sums of Leontief’s inverse matrix.
2.3.2. The Weight
The different dimensional indicators need to be reasonably weighted for each indicator. In order to comprehensively evaluate the impact of the 23 indicators on the sustainable risk of the regional resource industry, the entropy weight method is selected to objectively weight each indicator. The entropy method determines the weight of the indicator according to the difference in the degree of data confusion. If the information entropy of the indicator is smaller, it means that the degree of disorder of the indicator is higher, and when the range of change is larger, the impact on the comprehensive evaluation is also greater [50,51,52]. The main indicators and accounting steps are as follows.
(1) Data standardization processing.
Positive index,
Negative index,
Assuming that there are cities and indicators, represents the original value of the index of city , and and represent the maximum and minimum values of the index in all cities. represents the value of the index of city after dimensionless standardization. , and the larger the is, the greater the contribution to the target value will be.
(2) Determine the index weight.
In Formulas (12)–(14), is the proportion of the index value of the city under the index, is the information entropy of the index, and is the weight of the index.
2.3.3. Spatial Autocorrelation Analysis
Spatial autocorrelation analysis can reflect the potential interdependence of the target value in the study area [53,54]. This article uses to measure the development of the resource industry sector, the environmental pressure situation, and the sustainable level of the regional resource industry sector, and then analyzes the spatial correlation characteristics of the sustainable risks of the resource industry in 31 provinces.
In Formula (15), is the value of the spatial weight matrix. When the unit is adjacent to , it is set to 1; otherwise, it is set to 0. is the calculation result of regional index, is the calculation result of index, and is the average value of . The value range of is . When its value is greater than 0, it is a positive correlation. The larger the value is, the stronger the spatial aggregation will be. When its value is less than 0, it is a negative correlation. The smaller the value is, the stronger the spatial difference will be, and when its value is equal to 0, it means that the space is not correlated and the space presents a random distribution.
3. Sustainable Risk Evaluation of China’s Provincial-Level Resource Industry
3.1. Data Sources
The data mainly relates to China’s provincial-level industrial development and environmental protection-related content from 2015 to 2019. Among them, the relevant data of the industry association measurement mainly come from the input-output table of 31 provinces in China (except Hong Kong, Macao, and Taiwan) in 2017, and the input-output method is used to measure the inductance coefficient and influence coefficient of the resource industry sector (Appendix A). The output and environmental pressure data of the resource industry come from the World Bank, the China Statistical Yearbook, the Ecological Environment Bulletin, and reports from related industries and environmental sectors. For some missing parts of the data, the article adopts statistical methods such as data fitting and forecasting to supplement.
In Appendix A, are the inductance coefficients and influence coefficients of the eight resource industry sectors in different provinces; and refer to coal mining products; and refer to petroleum and natural gas mining products; and refer to metal mining and processing products; and refer to non-metallic minerals and other mining and processing products; and refer to petroleum, coking products, and nuclear fuel processing products; and refer to non-metallic mineral products; and refer to metal smelting and rolling processing products; and and refer to metal products.
3.2. Development of the Resource Industry Sector and Environmental Pressure
The entropy method is used to weight the development of China’s provincial resource industry sector and the environmental pressure. This article comprehensively considers the actual data of the selected indicators for evaluation, and uses natural breaks (Jenks) based on ArcGIS 10.2 to distinguish the degree of the evaluation results [55,56,57]. The natural breaks (Jenks) method is a special cluster analysis method, and ArcGIS 10.2 can classify regions according to the similarity of the index weighting results (Figure 3). In order to comprehensively consider the resource industry sector and environmental pressure indicators, we chose to divide the weighting results into two dimensions, high and low, to form a combination of .
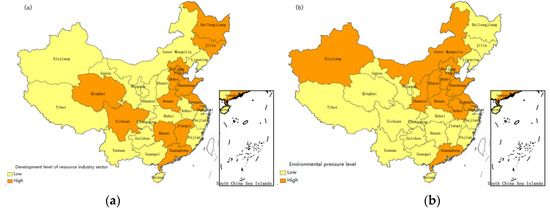
Figure 3.
The status quo of China’s regional differences in different dimensions. (a) resource industry sector, (b) environmental pressure. This respectively shows the regional differences in the sector and the environment.
According to Figure 3, there has been a large spatial difference between the development of China’s resource industry sector and environmental pressure in recent years. The development of the resource industry sector is dotted, and environmental pressure constraints still exist. The regions with a relatively high degree of development in China’s resource industry sector are mainly Central China and East China, and the environmental pressure in North China is relatively high.
In order to analyze the results of the natural breaks (Jenks) under the two dimensions of resource industry sector development and regional environmental pressure, we have defined four scenarios on the basis of previous studies (Table 1): 1. When the development level of the regional resource industry sector is high and the regional environmental pressure is low, we call this area a sustainable resource industry area; 2. when the development level of the regional resource industry sector is high, but there is greater environmental pressure, the area is a pure resource industry-rich area—that is, an industrial area; 3. when the development level of the regional resource industry sector is low, but the environmental pressure is relatively small, we consider the region to be a resource-poor region—that is, an ecological region; and 4. when the development of the regional resource industry sector is low, and there is greater environmental pressure, the regional resource industry presents unsustainable development. We will continue to conduct a comprehensive assessment of the overall sustainable risk in the following sections and combine the four scenarios to further analyze the factors that lead to regional sustainable risks.

Table 1.
China’s provincial-level classification based on the resource industry sectors and the environmental pressure.
It can be seen that based on the sustainable perspective of the resource industry, China has the highest proportion of ecological regions, while the proportions of sustainable, industrial, and unsustainable provincial regions are roughly the same. Among them, the resource industries and environmental protection in sustainable areas can develop in a balanced manner, and the unsustainable regions are mainly the extensive production areas of traditional resource industries, while the regional environmental pressure has still been relatively high in recent years. The main reason for the formation of industrial areas is that the development of the resource industry is relatively good but the environmental problems cannot be properly resolved, while the ecological areas are due to their weak resource industry foundation and can maintain good environmental quality.
3.3. Sustainable Risk of Regional Resource Industry
The sustainable risk of the regional resource industry is based on the comprehensive consideration of the two dimensions of the development of the resource industry sector and the environmental pressure. In order to further evaluate the sustainable risks of the resource industry in China’s 31 provinces, this article comprehensively assigns weights to 23 sub-indexes, excludes the interaction between some indicators, uses entropy method to calculate the secondary weighting, and comprehensively evaluates the provinces in China. The sustainable development of regional resources and the calculation results are divided into three levels to achieve objective evaluation (Figure 4). Here we also use ArcGIS 10.2 to achieve the purpose of clustering. According to the significance of multiple classification results and the needs of subsequent analysis, the three dimensions of high, medium, and low are most suitable for assessing the sustainable risks of the regional resource industry.
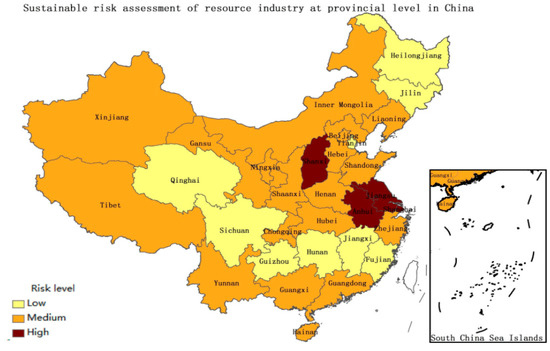
Figure 4.
Distribution of sustainable risks in the resource industries of China’s 31 provinces.
According to Figure 4, it can be seen that the four provinces of Shanxi, Anhui, Jiangsu, and Shanghai have the highest sustainable risks in the resource industry. Further comparison of the classification results in Table 1 shows that the development of the resource industry and environmental pressures in Shanxi and Anhui are severe. Among them, the main reason for the sustainable risk of Jiangsu’s resource industry is the pressure of environmental constraints. Shanghai’s resource industry has a weak foundation, but the environmental quality is relatively good. The nine provinces of Heilongjiang, Jilin, Tianjin, Fujian, Jiangxi, Hunan, Guizhou, Sichuan, and Qinghai have the lowest sustainable risks. Among them, the indicators of the resource industry sector and environmental pressure constraints in Tianjin, Fujian, and Guizhou show a positive offset, leading to a reduction in sustainable risks, and Beijing has a weak offsetting effect for these two indicators. The sustainable risk of the remaining 18 provinces’ resource industry sectors is at a medium level.
3.4. Spatial Autocorrelation Analysis
This article uses ArcGIS 10.2 to measure the indicators of the spatial autocorrelation of sustainable risks, resource industry sector development, and environmental pressure in China’s provincial regions and uses global autocorrelation (Moran I) to analyze and characterize spatial correlation characteristics of different dimensions (Table 2).
Table 2.
Global spatial autocorrelation analysis results in all dimensions.
According to the results of the spatial autocorrelation analysis, there is no significant spatial correlation in the development of the resource industry sector, but both regional environmental pressures and the sustainable risks of the resource industry have significant spatial clustering characteristics. The reason for this phenomenon is that the regional environmental pressure presents a certain regular regional difference, and the development of the resource industry sector is not exactly the same in each province. Regional resource endowments, industrial foundation, industrial structure, and trade conditions are all important factors that lead to differences in the development of the resource industry sector. The sustainability of the resource industry is subject to the dual constraints of industrial sector development and environmental pressure, so there is a certain degree of spatial agglomeration characteristics.
4. Scenario Discussion and Suggestions
Based on the results of the comprehensive analysis, this article believes that the sustainable risks of China’s provincial-level resource industries are still severe, with industrial and ecological provinces accounting for a relatively high proportion. In light of the actual development of the regional economy, it is necessary to further strengthen the development status of the resource industry sector and improve the quality of the regional environment. By improving the sustainability of different types of regional resource industries, the government exerts the driving effect of the resource industry on the basis of reducing environmental pressure and ensuring the supply of resources. Finally, the following specific planning suggestions are put forward for the four types of those provinces.
Scenario 1: Sustainable areas. The sustainable provinces of China’s resource industry are mainly regions with better economic foundations, where the resource industry sector and regional environmental protection can achieve coupled development, and in some provinces, the resource industry sector and regional environmental protection are positively canceled. The former areas should continue to strengthen the dual development of the industrial sector and the regional environment, and further consolidate the sustainability of the resource industry, while the latter areas should focus on promoting the development of the resource industry sector or regional environmental protection according to the actual situation of the region, and achieve the balanced promotion of the two dimensions. At the same time, based on the perspective of circular economy, the local government should give full play to the radiation driving effect of the resource industry on the basis of ensuring the sustainability of the resource industry in the region, and help the sustainable development of the resource industry in the surrounding area.
Scenario 2: Industrial areas. China’s industrial areas are mainly traditional industrial bases. The development of the resource industry in the region has a certain historical basis, the infrastructure of the resource industry is complete, and the industrial chain is perfect. In the process of national economic development, the resource industry played an effective promoting role, but it also caused greater environmental damage—its annual industrial pollution investment accounted for more than the national average, resulting in poor sustainability of the regional resource industry. For industrial areas, the government should give priority to environmental protection elements, actively adjust the regional industrial structure, optimize the resource industry chain, and realize clean production of the resource industry. At the same time, energy conservation and environmental protection industries should be further cultivated to build new regional economic growth poles and reduce regional development bottlenecks caused by regional environmental risks.
Scenario 3: Ecological areas. According to the results of the comprehensive evaluation, nearly 50% of the provinces in China’s provincial regions are ecologically developed, and the vast majority of regions have medium-level sustainable risks in the resource industry. It shows that China’s regional environmental protection work has achieved great results in recent years. Affected by the structural adjustments on the supply side, some regional resource industries have begun to dissolve into resource-based cities, and the main purpose of resource industry development has gradually developed to ensure domestic demand. In order to stimulate the vitality of resource-based industries in ecological regions, it is possible to appropriately develop a clean resource industry chain on the basis of ensuring the supply of basic resources. By leveraging the advantages of the development of the resource industry in the surrounding regions, the economic driving effect of the resource industry can be realized, so as to avoid the shortcomings of the regional economic development caused by the lack of industrial structure.
Scenario 4: Unsustainable areas. The unsustainable areas are mainly remote areas or traditional resource-based areas with a weak economic foundation in China, which are the bottleneck of China’s economic development. Affected by historical development factors, the resource industry chain in some provinces is not yet perfect. At the same time, some provinces have gradually weakened the influence of the resource industry due to industrial structural adjustments in recent years, the positive role of the resource industry sector in promoting regional economic development in the overall industrial layout has decreased, and unsustainable regions are facing greater environmental pressure. For the unsustainable regions, the government should give priority to ensuring the supply of regional resource industries and actively repair the environmental quality. At the same time, the regional industrial structure should be accelerated to promote the sustainable development of the regional resource industry sector, and avoid the sustainable risk of the resource industry caused by the rapid or slow development of the resource industry sector.
5. Conclusions
On the basis of a large number of literature reviews, we selected multiple indicators to construct an evaluation system, and used input-output, entropy method, and comprehensive evaluation methods to evaluate the sustainable risks of the resource industry in 31 provinces in China. This article mainly achieves the following purposes.
(1) We evaded the problems in sustainability assessment, proposed a correlation measurement of the interaction between the resource industry sector and other sectors, combined with indicators such as industrial sector trade volume, environmental pressure, etc., to build a quantitative evaluation model for sustainable risks.
(2) By analyzing the sustainable risk assessment results of the resource industry in 31 provinces, we found that there are significant differences in the sustainable risk of the resource industry in China’s provincial regions. The development of the resource industry sector and environmental pressure are important factors affecting its sustainability, and promoting the development of the resource industry sector and environmental protection in a balanced way can effectively reduce sustainable risks.
(3) In view of the four scenarios, we put forward reasonable ideas and believe that differentiated regional resource industry development paths can effectively enhance its competitive advantage, thereby avoiding regional economic risks caused by the resource industry.
The research results of this article will provide a theoretical reference for the development of China’s resource industry, and the research ideas will also provide a certain reference for sustainable risk assessment in other fields. At the same time, it is necessary for scholars to further improve related research on the actual impact of regional resource industry departments on the regional economy and the development direction of the resource industry under the background of industrial structure adjustment.
Author Contributions
Conceptualization, C.L., S.Z. and Y.L.; software, X.P.; investigation, X.G. and H.Z.; data curation, Y.L.; writing—original draft preparation, M.L.; writing—review and editing, M.L. All authors have read and agreed to the published version of the manuscript.
Funding
This research was funded by NSTL (National Science and Technology Library) Construction and Service of Information Portal in Key Areas (E01Z1107).
Institutional Review Board Statement
Not applicable.
Informed Consent Statement
Not applicable.
Data Availability Statement
Data recorded in the current study are available in all Tables and Figures of the manuscript.
Conflicts of Interest
The authors declare no conflict of interest.
Appendix A
Table A1.
The inductance and influence coefficient of China’s resource industry sectors in 31 provinces in 2017.
Table A1.
The inductance and influence coefficient of China’s resource industry sectors in 31 provinces in 2017.
| X1 | X2 | X3 | X4 | X5 | X6 | X7 | X8 | Y1 | Y2 | Y3 | Y4 | Y5 | Y6 | Y7 | Y8 | |
|---|---|---|---|---|---|---|---|---|---|---|---|---|---|---|---|---|
| Beijing | 0.32 | 1.34 | 0.46 | 0.38 | 0.87 | 0.56 | 5.16 | 0.84 | 0.93 | 0.96 | 1.11 | 0.88 | 1.22 | 1.20 | 2.00 | 1.49 |
| Tianjin | 1.04 | 1.50 | 1.41 | 0.56 | 1.76 | 0.76 | 3.20 | 0.92 | 0.95 | 0.60 | 1.24 | 1.14 | 0.85 | 1.17 | 1.42 | 1.45 |
| Hebei | 3.50 | 0.69 | 1.38 | 0.82 | 1.51 | 0.69 | 3.02 | 1.22 | 0.80 | 0.77 | 1.18 | 1.06 | 1.06 | 1.12 | 1.16 | 1.25 |
| Shanxi | 1.98 | 0.56 | 1.01 | 0.53 | 1.06 | 0.72 | 2.94 | 0.83 | 1.01 | 1.06 | 1.27 | 1.15 | 1.06 | 1.07 | 1.22 | 1.10 |
| Inner Mongolia | 1.68 | 0.85 | 0.96 | 0.73 | 1.27 | 0.72 | 2.08 | 0.99 | 0.86 | 0.77 | 0.87 | 1.04 | 0.99 | 1.11 | 1.21 | 1.23 |
| Liaoning | 1.04 | 1.36 | 1.27 | 0.75 | 1.43 | 0.74 | 2.63 | 1.00 | 0.60 | 0.83 | 0.91 | 0.78 | 0.98 | 1.10 | 1.20 | 1.32 |
| Jilin | 0.98 | 1.13 | 1.21 | 0.56 | 0.92 | 0.83 | 3.56 | 0.88 | 1.08 | 0.77 | 1.15 | 1.09 | 1.08 | 1.22 | 1.20 | 1.22 |
| Heilongjiang | 1.88 | 1.50 | 0.81 | 0.58 | 1.89 | 0.75 | 2.01 | 0.69 | 0.77 | 0.65 | 1.02 | 1.06 | 1.03 | 1.25 | 1.34 | 1.36 |
| Shanghai | 1.13 | 1.41 | 0.56 | 0.43 | 1.58 | 0.79 | 1.96 | 0.81 | 0.34 | 0.91 | 0.34 | 0.34 | 0.94 | 1.14 | 0.98 | 1.18 |
| Jiangsu | 1.41 | 1.25 | 0.99 | 0.64 | 1.18 | 0.83 | 2.81 | 1.10 | 0.88 | 0.51 | 0.79 | 1.16 | 0.86 | 1.23 | 1.20 | 1.30 |
| Zhejiang | 2.41 | 1.16 | 1.25 | 0.68 | 0.96 | 0.73 | 3.21 | 0.86 | 0.92 | 0.37 | 0.93 | 1.01 | 0.76 | 1.15 | 1.35 | 1.30 |
| Anhui | 2.14 | 0.32 | 1.16 | 0.46 | 1.17 | 0.76 | 3.19 | 1.00 | 0.77 | 0.32 | 1.04 | 1.13 | 0.95 | 1.14 | 1.37 | 1.37 |
| Fujian | 0.90 | 1.03 | 2.25 | 1.21 | 1.13 | 0.84 | 2.98 | 0.83 | 1.02 | 0.93 | 0.82 | 1.03 | 1.23 | 0.96 | 1.00 | 1.03 |
| Jiangxi | 1.81 | 0.92 | 1.54 | 0.78 | 1.21 | 0.88 | 2.83 | 1.22 | 1.09 | 0.35 | 1.30 | 1.26 | 0.92 | 1.26 | 1.35 | 1.48 |
| Shandong | 0.74 | 0.76 | 0.93 | 0.41 | 2.00 | 0.94 | 2.41 | 1.17 | 0.97 | 0.84 | 1.10 | 1.26 | 1.17 | 1.15 | 1.26 | 1.31 |
| Henan | 1.62 | 1.17 | 1.04 | 0.64 | 1.02 | 0.92 | 2.42 | 1.01 | 0.88 | 0.70 | 1.01 | 1.00 | 0.96 | 1.14 | 1.20 | 1.28 |
| Hubei | 0.71 | 0.71 | 0.79 | 0.74 | 0.90 | 0.94 | 1.56 | 1.07 | 0.97 | 0.79 | 0.96 | 1.04 | 0.98 | 1.09 | 1.20 | 1.22 |
| Hunan | 2.37 | 1.05 | 0.94 | 0.53 | 1.11 | 0.91 | 2.26 | 1.01 | 1.16 | 0.41 | 1.09 | 1.13 | 0.85 | 1.20 | 1.22 | 1.29 |
| Guangdong | 0.83 | 0.98 | 0.65 | 0.67 | 1.04 | 1.02 | 4.04 | 0.97 | 0.81 | 0.64 | 0.97 | 0.96 | 0.88 | 1.21 | 1.36 | 1.36 |
| Guangxi | 0.91 | 1.10 | 0.89 | 0.65 | 1.29 | 0.76 | 2.42 | 0.74 | 0.81 | 0.75 | 0.95 | 1.01 | 1.00 | 1.12 | 1.18 | 1.19 |
| Hainan | 1.06 | 0.97 | 0.59 | 0.51 | 2.30 | 0.85 | 1.62 | 0.79 | 0.37 | 0.86 | 1.02 | 1.18 | 1.18 | 1.05 | 0.78 | 0.95 |
| Chongqing | 1.29 | 0.83 | 0.71 | 0.65 | 1.28 | 0.91 | 2.99 | 0.83 | 0.89 | 0.79 | 0.96 | 1.19 | 1.10 | 1.06 | 1.24 | 1.18 |
| Sichuan | 1.04 | 1.16 | 1.15 | 0.88 | 1.08 | 0.91 | 2.35 | 1.01 | 1.06 | 0.82 | 0.99 | 1.13 | 1.05 | 1.19 | 1.20 | 1.21 |
| Guizhou | 2.65 | 0.41 | 0.74 | 0.60 | 1.67 | 0.82 | 2.45 | 0.77 | 0.91 | 0.39 | 0.94 | 1.05 | 1.14 | 1.25 | 1.29 | 1.29 |
| Yunnan | 0.98 | 0.85 | 1.43 | 0.70 | 1.12 | 0.83 | 2.53 | 0.84 | 1.00 | 0.43 | 1.07 | 1.06 | 0.98 | 1.13 | 1.28 | 1.31 |
| Shanxi | 2.51 | 1.12 | 1.54 | 0.66 | 1.33 | 0.86 | 2.82 | 1.04 | 0.80 | 0.65 | 1.16 | 1.16 | 1.01 | 0.90 | 1.18 | 1.34 |
| Gansu | 1.21 | 1.29 | 1.20 | 0.67 | 1.21 | 0.79 | 2.21 | 1.01 | 0.82 | 0.76 | 1.01 | 0.93 | 0.96 | 1.09 | 1.28 | 1.28 |
| Qinghai | 0.84 | 1.20 | 0.81 | 0.92 | 1.36 | 0.75 | 3.51 | 1.30 | 1.03 | 0.75 | 1.01 | 1.04 | 0.88 | 1.22 | 1.36 | 1.58 |
| Ningxia | 1.23 | 1.25 | 0.83 | 0.55 | 1.21 | 0.68 | 1.88 | 0.85 | 0.85 | 0.73 | 0.98 | 0.96 | 1.03 | 1.20 | 1.26 | 1.35 |
| Xinjiang | 0.94 | 1.60 | 0.99 | 0.77 | 1.71 | 0.79 | 1.93 | 0.89 | 0.78 | 0.69 | 0.87 | 1.06 | 0.86 | 1.17 | 1.22 | 1.35 |
| Tibet | 1.50 | 1.00 | 0.65 | 0.68 | 1.48 | 1.21 | 1.86 | 1.27 | 0.57 | 0.57 | 0.89 | 0.89 | 0.57 | 1.13 | 1.37 | 1.61 |
References
- Wu, J.; Dai, X.; Yan, L. Influence of the Industry Scale on the Mineral Resource Intensive Areas Sustainable Development. China Population. Resour. Environ. 2015, 25, 136–142. [Google Scholar]
- Lu, C.P.; Xue, B.; Lu, C.Y.; Wang, T.; Jiang, L.; Zhang, Z.L.; Ren, W.X. Sustainability Investigation of Resource-Based Cities in Northeastern China. Sustainability 2016, 8, 1058. [Google Scholar] [CrossRef]
- Li, X.T.; Bao, J.L.; Sun, J.G.; Wang, J. Circular Economy of Resource-Based Industries in Coastal Cities and the Influence on Sustainable Development. J. Coast. Res. 2019, 98, 96–99. [Google Scholar] [CrossRef]
- Nikolic, J.M.; Vasovic, D. Improving the management system of mining and energy complexes based on risk assessment, environmental law and principles of sustainable development. J. Environ. Prot. Ecol. 2016, 17, 1066–1075. [Google Scholar]
- Li, Q.; Yu, Y.; Jiang, X.Q.; Guan, Y.T. Multifactor-based environmental risk assessment for sustainable land-use planning in Shenzhen, China. Sci. Total Environ. 2019, 657, 1051–1063. [Google Scholar] [CrossRef]
- Bahaloo-Horeh, N.; Mousavi, S.M. Comprehensive characterization and environmental risk assessment of end-of-life automotive catalytic converters to arrange a sustainable roadmap for future recycling practices. J. Hazard. Mater. 2020, 400, 123186. [Google Scholar] [CrossRef] [PubMed]
- Santos, R.; Abreu, A.; Dias, A.; Calado, J.M.F.; Anes, V.; Soares, J. A Framework for Risk Assessment in Collaborative Networks to Promote Sustainable Systems in Innovation Ecosystems. Sustainability 2020, 12, 6218. [Google Scholar] [CrossRef]
- Gandini, A.; Quesada, L.; Prieto, I.; Garmendia, L. Climate change risk assessment: A holistic multi-stakeholder methodology for the sustainable development of cities. Sustain. Cities Soc. 2021, 65, 102641. [Google Scholar] [CrossRef]
- Cherif, R.; Hasanov, F. The Leap of the Tiger: Escaping the Middle-income Trap to the Technological Frontier. Glob. Policy 2019, 10, 497–511. [Google Scholar] [CrossRef]
- Glawe, L.; Wagner, H. China in the middle-income trap? China Econ. Rev. 2020, 60, 101264. [Google Scholar] [CrossRef]
- Kou, H.W.; Chen, Z. The discussion of the existence of the middle-income trap and the analysis of the spanning mechanism. Stud. Sci. Sci. 2020, 38, 1579–1586, 1705. [Google Scholar]
- Ge, W.; Kinnucan, H.W. The effects of Mongolia’s booming mining industry on its agricultural sector: A test for Dutch disease. Agric. Econ. 2017, 48, 781–791. [Google Scholar] [CrossRef]
- Hien, N.P.; Vinh, C.T.H.; Mai, V.T.P.; Xuyen, L.T.K. Remittances, real exchange rate and the Dutch disease in Asian developing countries. Q. Rev. Econ. Financ. 2020, 77, 131–143. [Google Scholar] [CrossRef]
- Allcott, H.; Keniston, D. Dutch Disease or Agglomeration? The Local Economic Effects of Natural Resource Booms in Modern America. Rev. Econ. Stud. 2018, 85, 695–731. [Google Scholar] [CrossRef]
- Ma, D.B. Comments on The Middle-Income Trap 2.0: The Increasing Role of Human Capital in the Age of Automation and Implications for Developing Asia. Asian Econ. Pap. 2020, 19, 59. [Google Scholar]
- Lee, K.; Wong, C.Y.; Intarakumnerd, P.; Limapornvanich, C. Is the Fourth Industrial Revolution a window of opportunity for upgrading or reinforcing the middle-income trap? Asian model of development in Southeast Asia. J. Econ. Policy Reform 2020, 23, 408–425. [Google Scholar] [CrossRef]
- Nair, M.; Arvin, M.B.; Pradhan, R.P.; Bahmani, S. Is higher economic growth possible through better institutional quality and a lower carbon footprint? Evidence from developing countries. Renew. Energy 2021, 167, 132–145. [Google Scholar] [CrossRef]
- Yue, W.Z.; Chen, Y.; Thy, P.T.M.; Fan, P.L.; Liu, Y.; Zhang, W. Identifying urban vitality in metropolitan areas of developing countries from a comparative perspective: Ho Chi Minh City versus Shanghai. Sustain. Cities Soc. 2021, 65, 102609. [Google Scholar] [CrossRef]
- Xue, Y.W.; Zhang, Z.X.; Li, H.X.; Luan, J.Y. Spatial agglomeration of resource industry and regional economic growth: An empirical study of ‘resource curse’. China Popul. Resour. Environ. 2016, 26, 25–33. [Google Scholar]
- Wei, W.D.; Cai, W.Q.; Guo, Y.; Bai, C.Q.; Yang, L.Z. Decoupling relationship between energy consumption and economic growth in China’s provinces from the perspective of resource security. Resour. Policy 2020, 68, 101693. [Google Scholar] [CrossRef]
- Liu, C.; Chen, L.; Vanderbeck, R.M.; Valentine, G.; Zhang, M.; Diprose, K.; McQuaid, K. A Chinese route to sustainability: Postsocialist transitions and the construction of ecological civilization. Sustain. Dev. 2018, 26, 741–748. [Google Scholar] [CrossRef]
- Wang, X.Y.; Xie, Z.Y.; Ma, Y. Estimation of county ecological civilization construction level in sichuan province based on improved ecological footprint model. Appl. Ecol. Environ. Res. 2019, 17, 12959–12971. [Google Scholar] [CrossRef]
- Huang, C.; Wu, C.Q. Study on the Major Function Oriented Zone and Construction of Ecological Civilization in Western China. China Soft Sci. 2019, 11, 166–175. [Google Scholar]
- Zuo, N.; Zhong, H. Can resource policy reverse the resource curse? Evidence from China. Resour. Policy 2020, 68, 101733. [Google Scholar] [CrossRef]
- Zhang, L.H.; Chai, J.X.; Xin, H.; Zhao, Z.L. Evaluating the comprehensive benefit of hybrid energy system for ecological civilization construction in China. J. Clean. Prod. 2021, 278, 123769. [Google Scholar] [CrossRef]
- Kul, C.; Zhang, L.; Solangi, Y.A. Assessing the renewable energy investment risk factors for sustainable development in Turkey. J. Clean. Prod. 2020, 276, 124164. [Google Scholar] [CrossRef]
- Folque, M.; Escrig-Olmedo, E.; Santamaria, T.C. Sustainable development and financial system: Integrating ESG risks through sustainable investment strategies in a climate change context. Sustain. Dev. 2021. [Google Scholar] [CrossRef]
- Cai, K.; Li, C.; Na, S.Y. Spatial Distribution, Pollution Source, and Health Risk Assessment of Heavy Metals in Atmospheric Depositions: A Case Study from the Sustainable City of Shijiazhuang, China. Atmosphere 2019, 10, 222. [Google Scholar] [CrossRef]
- Khan, R.U.; Yin, J.B.; Mustafa, F.S. Risk Assessment and Decision Support for Sustainable Traffic Safety in Hong Kong Waters. IEEE Access 2020, 8, 72893–72909. [Google Scholar] [CrossRef]
- Luo, F.Z.; Chen, L. Dynamic econometric analysis on the relation between the real estate industry and leading industry in resource-based cities. J. Xi’an Univ. Archit. Technol. Nat. Sci. Ed. 2016, 48, 443–447. [Google Scholar]
- Jiang, S.; Lu, C.W.; Zhang, S.; Lu, X.; Tsai, S.B.; Wang, C.K.; Gao, Y.; Shi, Y.F.; Lee, C.H. Prediction of Ecological Pressure on Resource-Based Cities Based on an RBF Neural Network Optimized by an Improved ABC Algorithm. IEEE Access 2019, 7, 47423–47436. [Google Scholar] [CrossRef]
- Liu, M.K.; Zhang, H.Y.; Wang, X.Y. Research on the Correlation Measurement and Development Path Planning of Non-ferrous Metals Industry Chain in Guangxi. Nat. Resour. Econ. China 2020, 33, 65–74. [Google Scholar]
- Liu, B.; Wang, J.M.; Jing, Z.R.; Tang, Q. Measurement of sustainable transformation capability of resource-based cities based on fuzzy membership function: A case study of Shanxi Province, China. Resour. Policy 2020, 68, 101739. [Google Scholar] [CrossRef]
- Zhu, C.; Li, Y.P.; Zhang, L.X.; Wang, Y.C. Evaluation and diagnosis of obstacles to land-based ecological security in resource-based cities: A case study of Xingtai city. PLoS ONE 2020, 15, e0241618. [Google Scholar] [CrossRef]
- Fernando, G.; Francisco, G.; Javier, O. A Multicriteria Goal Programming Model for Ranking Universities. Mathematics 2021, 9, 459. [Google Scholar]
- Baglioni, E.; Campling, L. Natural resource industries as global value chains: Frontiers, fetishism, labour and the state. Environ. Plan. A 2017, 49, 2437–2456. [Google Scholar] [CrossRef]
- Arbatli, E. Resource nationalism revisited: A new conceptualization in light of changing actors and strategies in the oil industry. Energy Res. Soc. Sci. 2018, 40, 101–108. [Google Scholar] [CrossRef]
- Cheng, Z.H.; Li, L.S.; Liu, J. Natural resource abundance, resource industry dependence and economic green growth in China. Resour. Policy 2020, 68, 101736. [Google Scholar] [CrossRef]
- Lebre, E.; Corder, G.; Golev, A. The Role of the Mining Industry in a Circular Economy A Framework for Resource Management at the Mine Site Level. J. Ind. Ecol. 2017, 21, 662–672. [Google Scholar] [CrossRef]
- Tsang, C.K.; Li, S.K. Allocation of resources within subgroups of an industry: A case study in the Chinese industrial sector. J. Product. Anal. 2020, 53, 125–139. [Google Scholar] [CrossRef]
- Yan, L.; Hong, W.Z. Reach on the Sustainable Development of Industry in the Western Resources. Chin. J. Manag. 2008, 5, 692–695. [Google Scholar]
- Zhai, G.M.; Wang, S.H. The challenges and potentialities of Chinese oil&gas resources’ sustainable development. Eng. Sci. 2010, 12, 4–10. [Google Scholar]
- Chen, J.; Wu, N. Analysis of Status Quo of Global Rare Earth Resources and Chinas Sustainable Development Countermeasures. Res. Agric. Mod. 2012, 33, 74–77. [Google Scholar]
- Liu, L.Y.; Cheng, M. Safety Evaluation of Sustainable Uranium Development in China Combined with an Analytical GAN Framework. J. Resour. Ecol. 2020, 11, 394–404. [Google Scholar]
- Kono, J.; Ostermeyer, Y.; Wallbaum, H. Investigation of regional conditions and sustainability indicators for sustainable product development of building materials. J. Clean. Prod. 2018, 196, 1356–1364. [Google Scholar] [CrossRef]
- Sisto, R.; Lopez, J.G.; Quintanilla, A.; de Juanes, A.; Mendoza, D.; Lumbreras, J.; Mataix, C. Quantitative Analysis of the Impact of Public Policies on the Sustainable Development Goals through Budget Allocation and Indicators. Sustainability 2020, 12, 10583. [Google Scholar] [CrossRef]
- Zhang, S.; Zhu, D.J. Have countries moved towards sustainable development or not? Definition, criteria, indicators and empirical analysis. J. Clean. Prod. 2020, 267, 121929. [Google Scholar] [CrossRef]
- Yang, F.; Huang, Z.G.; Yuan, H.Z.; Wang, J.J.; Li, W.J.; Wang, S. Passenger Volume Prediction by a Combined Input-Output and Distributed Lag Model and Data Analytics of Industrial Investment. J. Adv. Transp. 2020, 2020, 6675042. [Google Scholar] [CrossRef]
- Rama, M.; Entrena-Barbero, E.; Dias, A.C.; Moreira, M.T.; Feijoo, G.; Gonzalez-Garcia, S. Evaluating the carbon footprint of a Spanish city through environmentally extended input output analysis and comparison with life cycle assessment. Sci. Total Environ. 2021, 762, 143133. [Google Scholar] [CrossRef]
- Liu, H.H.; Wang, N.; Xie, J.C.; Jiang, R.G. Fuzzy assessment of city ecosystem health based on entropy weight method. Eng. J. Wuhan Univ. 2014, 47, 755–759. [Google Scholar]
- Haghani, A.; Khoobdel, M.; Dehghani, R.; Adibzadeh, A.; Sobati, H.; Aliabadian, M. Ecological modeling and distribution analysis of digger scorpions: Odontobuthus doriae, Odonthubutus bidentatus (Scorpiones: Buthidae) and Scorpio maurus (Scorpiones: Scorpionidae) in Iran using the maximum entropy method. Appl. Entomol. Zool. 2020, 55, 17–24. [Google Scholar] [CrossRef]
- Cui, X.Y.; Zhao, T.; Wang, J. Allocation of carbon emission quotas in China’s provincial power sector based on entropy method and ZSG-DEA. J. Clean. Prod. 2021, 284, 124683. [Google Scholar] [CrossRef]
- Balducci, F.; Ferrara, A. Using urban environmental policy data to understand, the domains of smartness: An analysis of spatial autocorrelation for all the Italian chief towns. Ecol. Indic. 2018, 89, 386–396. [Google Scholar] [CrossRef]
- Hu, L.; Chun, Y.W.; Griffith, D.A. Uncovering a positive and negative spatial autocorrelation mixture pattern: A spatial analysis of breast cancer incidences in Broward County, Florida, 2000–2010. J. Geogr. Syst. 2020, 22, 291–308. [Google Scholar] [CrossRef]
- Lee, K.M.; Lim, H.S.; Cho, J.W.; Lee, S.K.; Min, S.H.; Min, J.K. Fire Risk Assessment of Building Use Types Using Natural Breaks (Jenks). Fire Sci. Eng. 2019, 33, 63–71. [Google Scholar] [CrossRef]
- Li, N.Q.; Xu, G.Y. Grid analysis of land use based on natural breaks (jenks) classification. Bull. Surv. Mapp. 2020, 4, 106–110. [Google Scholar]
- Wanghe, K.Y.; Guo, X.L.; Wang, M.; Zhuang, H.F.; Ahmad, S.; Khan, T.U.; Xiao, Y.Q.; Luan, X.F.; Li, K. Gravity model toolbox: An automated and open-source ArcGIS tool to build and prioritize ecological corridors in urban landscapes. Glob. Ecol. Conserv. 2020, 22, e01012. [Google Scholar] [CrossRef]


Publisher’s Note: MDPI stays neutral with regard to jurisdictional claims in published maps and institutional affiliations. |
© 2021 by the authors. Licensee MDPI, Basel, Switzerland. This article is an open access article distributed under the terms and conditions of the Creative Commons Attribution (CC BY) license (https://creativecommons.org/licenses/by/4.0/).