Article

Developing Generalised Equation for the Calculation of PayBack Period for Rainwater Harvesting Systems

by
Monzur A. Imteaz
1,*,
Maryam Bayatvarkeshi
2 and
Md. Rezaul Karim
3
1
Department of Civil and Construction Engineering, Swinburne University of Technology, Melbourne, VIC 3122, Australia
2
Department of Soil Science, Malayer University, Malayer 65719-95863, Iran
3
Department of Civil and Environmental Engineering, Islamic University of Technology (IUT), Board Bazar, Gazipur 1700, Bangladesh
*
Author to whom correspondence should be addressed.
Sustainability 2021, 13(8), 4266; https://doi.org/10.3390/su13084266
Submission received: 11 March 2021 / Revised: 9 April 2021 / Accepted: 9 April 2021 / Published: 12 April 2021
(This article belongs to the Special Issue Sustainable Water Use)

Abstract

:
Many end-users for the stormwater harvesting systems are reluctant in implementing the system due to uncertainties of the potential returns for their investment for such system. A common practice of presenting potential benefit of a certain investment is through calculation of payback period using net annual benefit from the system. Traditional practice of doing such payback period analysis for rainwater tanks was considering individual building/roof, system volume, and specific investment cost. It is not feasible to conduct such analysis for each and every rainwater harvesting system installed in different buildings. To overcome this tedious practice, this study presents development of a generalised equation for the estimation of payback period for rainwater tanks based on roof area, initial cost, and rate of return. Based on an earlier study, several payback periods were calculated for different roof sizes, initial costs, and rate of return. It was found that all these variables can be correlated and embedded into a base equation of power function. Final developed equation results were compared with the payback periods calculated through traditional practice considering net annual savings and net present value of cumulative savings. It is found that the developed equation can estimate payback periods with very good accuracies; for all the selected internal rates of return correlation values ranging from 0.99 to 1.0 were achieved. Corresponding coefficient of determinations varied from 0.988 to 0.993. Furthermore, it is found that for a fixed roof area and rate of return, the payback period is having a power relationship (having an exponent less than 1.0) with the initial cost.

1. Introduction

In the recent years, rainwater harvesting systems (RWHS) are accepted as the most functional methods for offsetting and managing the water shortage in many parts of the world. The rainwater harvesting is considered as an alternative source of water, which can reduce the devastating implications of drought and assist to derive great benefit from runoff caused by precipitation. In the normal weather, it is likely to provide significant augmentation in the supply of water, especially through non-potable uses [1]. Furthermore, ease of installation and maintenance might be other grounds for its popularity [2]. Rahman et al. [3] assessed the sustainability of RWH system for Dhaka city and found that 11% water can be saved annually from a building having a roof area of 170 m2. Study by Karim et al. [4] showed that a potable water saving potential for residential buildings in Dhaka city varies from 10 to 24% for a roof size of 140 m2. Basher et al. [5] studied the reliability and economic analysis of urban rainwater harvesting in the major cities in Bangladesh and found the annual potable water saving potentials for the residential buildings in the two major cities varies from 30 to 40%. There are many investigations in regard to rainwater harvesting in distinct regions with different climates. For instance, the study of Lade and Oloke [6] in Nigeria, Monjaiang et al. [7] in Thailand, Lawrence and Lopes [8] in the USA, Lani et al. [9] in Malaysia, Sakson [10] in Poland, Zhang and Jing [11] in China, Matos et al. [12] in Portugal, and Moniruzzaman and Imteaz [13], Rahman et al. [14] in Australia imply the importance and significance of the rainwater harvesting study in each area.
However, a common reluctance against the rainwater saving is undeniable in some countries. One of the strong grounds behind it might be the investment cost [1]. This issue is considered as an important obstacle for most nations to the extent that many leading experts and researchers are of the belief that there is a strong link between sustainability of the RHSs and financial aspects of their construction [15,16]. The study of economic aspect of the RHSs by Dijk et al. [17] indicated that strategically designed, financed, and implemented rooftop RHSs meet large-scale urban water infrastructure needs. Evaluating over 45 investigations on optimizing size of the RHSs by Semaan et al. [18] depicted that the cost of the system is the most common optimised variable. Furthermore, the payback period was identified as the most used financial method to determine the economic possibility of the optimized sizing in compared to other financial indicators. Therefore, considering the cost/payback for the optimized design of rainwater reservoirs can increase reliability and satisfaction of the users. Following this look, the recent investigations focused more attention on the evaluation and assessment of the effective economical parameters on this practice for making more confidence and contentment. Regarding this fact, modelling and numerical calculations could address the associated issues. The economical sustainability of the RHSs designs for assessment of the affordability and profitability of the investment in the RHSs was studied by Musz-Pomorska et al. [15] in Poland. In this survey the significance of the governmental financial support and restricted profitability of the RHSs were revealed. Moreover, it was found that the shortest time of payback period corresponded to the maximum reuse of rainwater. Sangave et al. [19] considered distinct scenarios for optimizing the financial efficiency of the RHSs and the payback period. Strelets et al. [20] applied the distinct scenarios for calculating the payback period by initial const and end use in Russia. Galal [21] examined the payback period of the total cost for testing the financial efficiency of the RHS in the Lebanese Coastal zone by experimental studies. Bashar et al. [5] scrutinised reliabilities and economic benefits of the RHSs based on analysis of the payback periods. Their results showed that a period of 2–6 years would make up the cost of installation and maintenance. Numerous calculations under different scenarios of supplied non-potable uses for rainwater storage tank sizing was carried out by Matos et al. [1]. The results of modelling of RHS by Lade and Oloke [6] revealed that a payback period of 8 years would be typical for a commercial system. Imteaz and Moniruzzaman [22] through doing numerous analysis for the largest Australian city (Sydney) have presented that payback periods for residential rainwater tanks can vary from 20 to 101 years depending on the location, tank size, roof area and rainwater demand. Farreny et al. [23] considered two scenarios of water prices for evaluating the cost-efficiency of the RHSs within a Life Cycle Costing approach. Imteaz et al. [24] through a case study of commercial buildings having large roof have presented that payback periods varies exponentially (negative) with the price of water. The financial payback analyses of the RHSs in Malaysia under diversified scenarios indicated that full usage is the only solution to shorten payback period [25]. Stec and Słyś [26] through assessing the financial efficiency of the RHSs utilisation in Poland demonstrated that the present systems would reduce water requirement for toilet flushing only. Domínguez et al. [27] exploited benefit/cost ratios for investigating the efficiency of the RHSs in Colombia. Abdullah [28] demonstrated that a rainwater tank would be economically feasible in all rainfall zones of Jordan, provided the price of water is 1 US$/m3. Abdullah [28] also demonstrated that a period of 5–45 years is likely to require equalizing the costs associated with the installation of the RHSs. Gato-Trinidad and Gan [29] through quantifying the cost effectiveness of rainwater tanks rebate scheme in Australia displayed that payback period in rainwater tanks with indoor plumbing is longer than that of outdoor due to higher investment for the installation of indoor plumbing systems. Zhang and Jing [11] through using a daily water balance model for multi-storey buildings in Shanghai (China) demonstrated that benefit–cost ratio initially increases with the increase of tank size; however, with further increase (>25 m3) of tank size, the benefit–cost ratio decreases drastically. Nagaraj et al. [30] have presented that creation of irrigation water harvesting structures for the augmentation of groundwater recharge with rainwater is cost-effective and financially-viable.
The previous investigations confirm the necessity for more evaluation and analysis of the cost/payback in the RHSs. It can be seen that even for the same city, cost implications and payback periods vary significantly, and which are likely to be more prominent for different geographical locations. All the above-mentioned studies on benefit–cost ratio and payback period are for particular rainfall regime, storage volume, catchment size, and rainwater demand. Furthermore, the estimation of the cost/payback depends on a broad range of variables in term of social and economic, which causes a complexity of economic sustainability of the RHSs. Therefore, this is not an efficient approach to perform such payback period analysis for each and every condition. Rather, through proper computational technique there should be an efficient way of performing such vital analysis. As such it is highly recommended to have a generalised equation, which can calculate payback period for any input parameters, especially for a particular location/city. This paper presents development of generalised equation for the calculation of payback period for the city of Dhaka (Bangladesh) for any initial investment for the rainwater tanks, catchment/roof size and rate of return. Although the developed equations are valid only for the city of Dhaka, this is a pioneer attempt of deriving such generalised equation and the same methodology can be used for other geographical locations as well.

2. Materials and Methods

2.1. Materials

Karim et al. [31] conducted detailed calculations of economic benefits including payback periods of installing rainwater tanks in commercial buildings for the city of Dhaka, Bangladesh. Calculations were performed for five different buildings within the city having different roof areas and rainwater tank sizes. The selected roof and tank sizes are representative for the commercial buildings in the city. The study calculated potential potable water savings through rainwater tank using daily water balance model applying daily rainfall data for three distinct weather scenarios; dry year, average year, and wet year based on historical rainfall data for the city. Eventually, total monetary savings per year were calculated considering consecutive dry, average, and wet years, and making an average of the outcomes calculated for these three years. The details of the RWH system schematic and mathematical modelling algorithm of calculating potential potable water savings are provided in Karim et al. [31]. Table 1 shows the details of the five buildings for which payback periods were calculated using traditional method of economic analysis described in the following section.

2.2. Payback Period Calculation

Payback periods (in years) were calculated through comparing the cumulative annual monetary savings in successive years with the total investment (initial installation cost + cumulative operation and maintenance costs in successive years) of the RWH system. Net savings for a year is the annual monetary savings subtracted by the annual operation and maintenance costs. Net savings under different scenarios for the successive years were converted to equivalent net present value (NPV) as per the following equation:
NPV   of   Savings =   n = 1 n AS   ( 1   +   r )   n
where “AS” is the net annual savings for a year, “r” is the rate of return and “n” is the number of years since installation. As the calculated return periods were quite low, for the development of generalised equation with higher accuracy, payback periods were recalculated for an increment of 0.1 year. Considering on current “rate of return” investors usually decide on whether or not to invest on a particular system.

2.3. Methodology

Based on the results presented by Karim et al. [31], it is observed that calculated payback periods can be correlated with the roof area as per the Equation (2). As for a particular location, the roof area is directly related with the amount of potable water savings (i.e., larger the roof area, higher the amount of rainwater diverted to the tank), with the increase of roof area payback period decreases following a power function as follows:
P B P = a × R A b
where “RA” is the roof area, “PBP” is the payback period, “a” is the constant, and “b” is the exponent.
Again, PBP is significantly dominated by initial cost of the tank installation. For a series of PBP curves for different initial costs, it was found that “a” and “b” in the above-equation can be correlated with the initial cost. As for example, considering three different initial costs, the Equation (2) can be expressed as per the following equations:
P B P 1 = a 1 × R A b 1
P B P 2 = a 2 × R A b 2
P B P 3 = a 3 × R A b 3
It is found that the set of “a” (a1, a2, a3) values can be correlated with the initial cost as per the Equation (6) and the set of “b” (b1, b2, b3) can be correlated with the initial cost as per the Equation (7) presented below:
a = c × I C d
            b = e × ln ( I C ) f
where “IC” is the initial cost, “c” and “e” are the coefficients, “d” is the exponent, and “f” is the intercept.
Equations (3)–(7) are based on a particular value of rate of return. Similar sets of equations can be derived for different values of rate of return. As for example, for three values of the rate of return, each of the above-mentioned parameters (c, d, e, and f) will have three different values, i.e., c ⇒ {c1, c2, c3}, d ⇒ {d1, d2, d3}, e ⇒ {e1, e2, e3} and f ⇒ {f1, f2, f3}. It is found that the sets of “c”, “d”, “e” and “f” can be expressed as per following equations:
c = g × e h I R
d = i × ( I R ) + j
          e = k × ( I R ) + l
        f = m × ( I R ) + n
where “g”, “I”, “k” and “m” are the coefficients and “j”, “l”, and “n” are the intercepts of the equations. “h” is the coefficient of the exponent for “c” and “IR” relationship. “IR” is the rate of return, which is usually set by the government central bank. Replacing all the above-mentioned expressions of the parameters into relevant parent equations will yield a single generalised equation for the “PBP” as per the following format:
P B P = ( g × e h × I R ) × I C ( i × ( I R ) + j ) × R A ( ( k × I R + l ) × ln ( I C ) ( m × I R + n ) )  
The following section derives each of the above-mentioned parameters based on the calculated results of the payback periods (PBP) from the study of Karim et al. [31] and subsequent analysis. All the mentioned parameters were derived from the best-fit equations, which were plotted against interrelated parameters. Finally, the results calculated through the derived equation were compared with the original calculated PBPs. Payback periods were calculated for three internal rates of return (3%, 8%, and 12.5%), and for three initial costs (30 K, 50 K, and 60 K) and five roof sizes (315, 452, 532, 562, and 727 m2).

3. Results

3.1. Derivation of the Equation

Following sections describe derivation of the generalised equation for the city of Dhaka, Bangladesh, which is applicable for any commercial building in the same city. Residential buildings will have different PBP, as the city authority charges different water prices for the commercial and residential sectors; commercial sector has to pay higher price.
Figure 1 presents the set of graphs showing relationships between payback periods and corresponding roof areas for three different initial costs considering 8% as rate of return. Costs were calculated based on Bangladesh currency, BDT. Three best-fit lines were drawn for all the three initial costs (i.e., 30 K, 50 K, and 60 K). The best-fit equations corresponding to the Equations (3)–(5) are as follows:
For   30   K ,   P B P 1 = 306.1 × R A 0.793
For   50   K ,   P B P 2 = 1696.4 × R A 1.016
For   60   K ,   P B P 3 = 2789.7 × R A 1.071
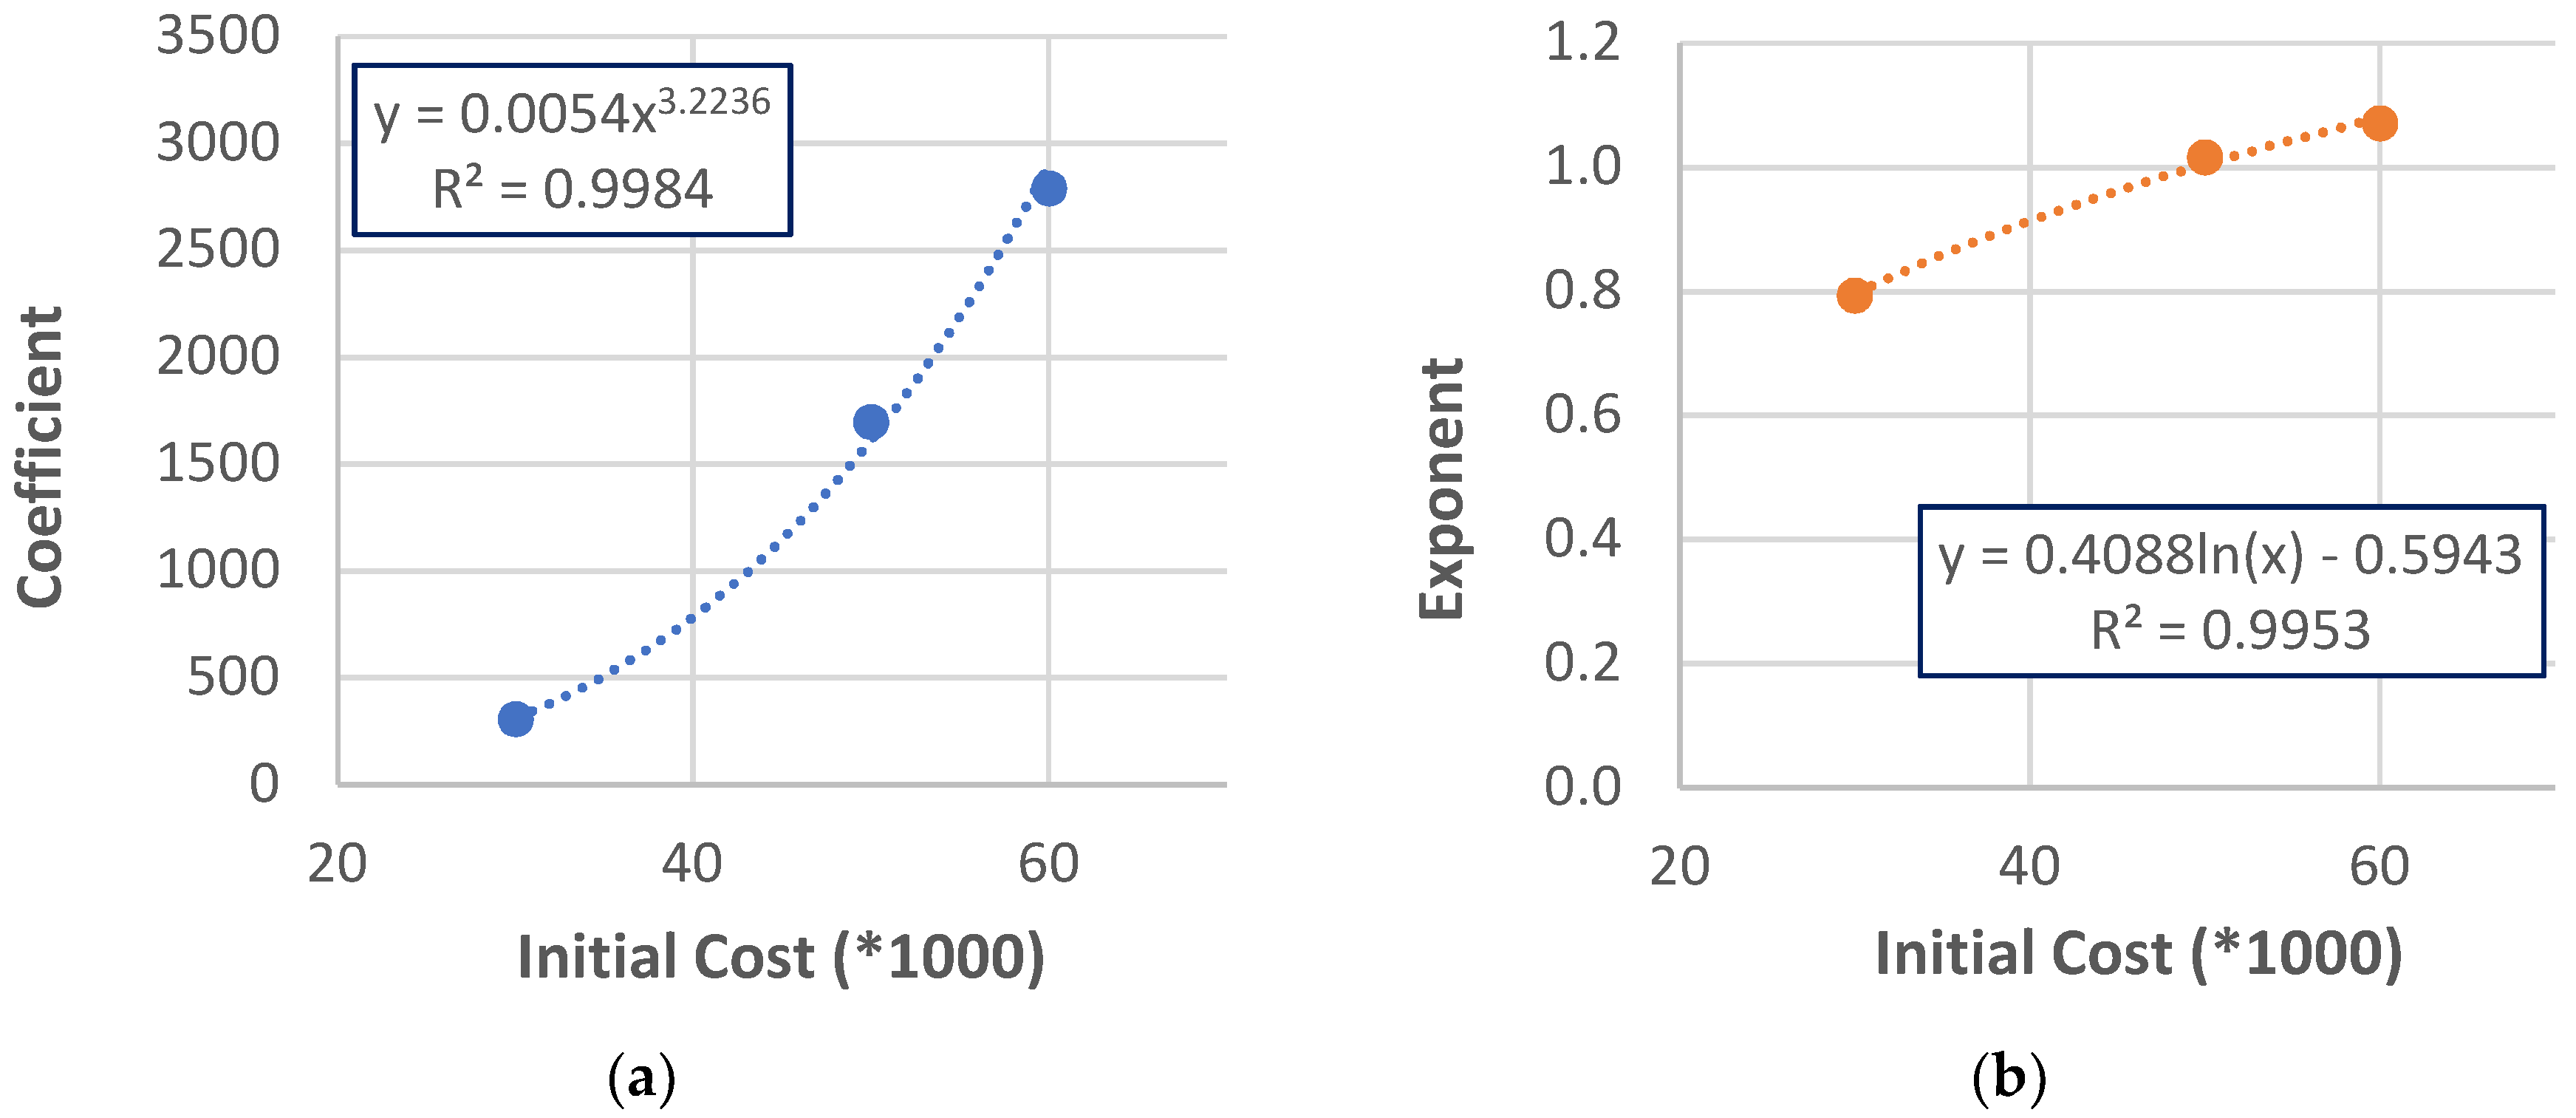
Coefficients (306.1, 1696.4, and 2789.7) and exponents (0.793, 1.016, and 1.071) of these equations are drawn with initial cost as an independent variable and the plotted graphs are shown in Figure 2a,b. For the current study, the initial cost values were taken from the earlier study [31], which were collected from individual building’s developer. From the best-fit lines of these graphs, it is found that the coefficients follow a power-function pattern with initial cost, whereas the exponents follow a logarithmic pattern with initial cost. The best-fit equations are as follows:
C o e f f i c i e n t =   0.0054 × I C 3.2236  
E x p o n e n t = 0.4088 × l n ( I C )     0.5943  
where “IC” is the initial cost. The values 0.0054, 3.2236, 0.4088, and 0.5943 are the values of “c”, “d”, “e”, and “f” as defined in the Equations (6) and (7).
Similarly, for two other internal rates of return (i.e., 3% and 12.5%), similar equations were derived. Table 2 shows all the values of the “c”, “d”, “e”, and “f” for all the considered rates of return. Values from the table were plotted against corresponding rates of return. It is to be noted that the usual range of rate of returns are considered here. As the payback periods do not significantly vary with more smaller variations of rate of return, only the mentioned three rates are considered for the subsequent analysis.
Figure 3a–d show the relationships between each parameter and rate of return along with the best-fit line and equation for each parameter. Derived best-fit equations are as follows:
c   =   0.1383 × e 0.439 × I R
d =   0.1387 × I R   +   2.1777
e =   0.0205 × I R   +   0.2544
f =   0.0633 × I R   +   0.123  
Substituting Equations (18)–(21) into the Equations (6) and (7) and eventually into the Equation (2), the final equation for the calculation of payback period:
P B P = ( 0.1383 × e 0.439 × I R ) × I C ( 0.1387 × I R   +   2.1777 ) × R A ( ( 0.0205 × I R   +   0.2544 ) × ln ( I C ) ( 0.0633 × I R   +   0.123 ) )
It is to be noted that in the final equation Equation (22), the effect of operational cost and rainwater demand is not included, whereas a study [15] in Poland found that both the operational cost and rainwater demand affect the payback period. In the current study the operational cost was insignificant and was proportional to the initial cost, as such consideration of initical cost in the generalised equation sufficed. The same study [15] concluded that maximum reuse of rainwater reduces the payback period. This was the case for the current study; for all the buildings, as those are multi-storied buildings having many occupants, rainwater use is always maximum, which yielded shorter payback periods.

3.2. Comparison with the Equation Results

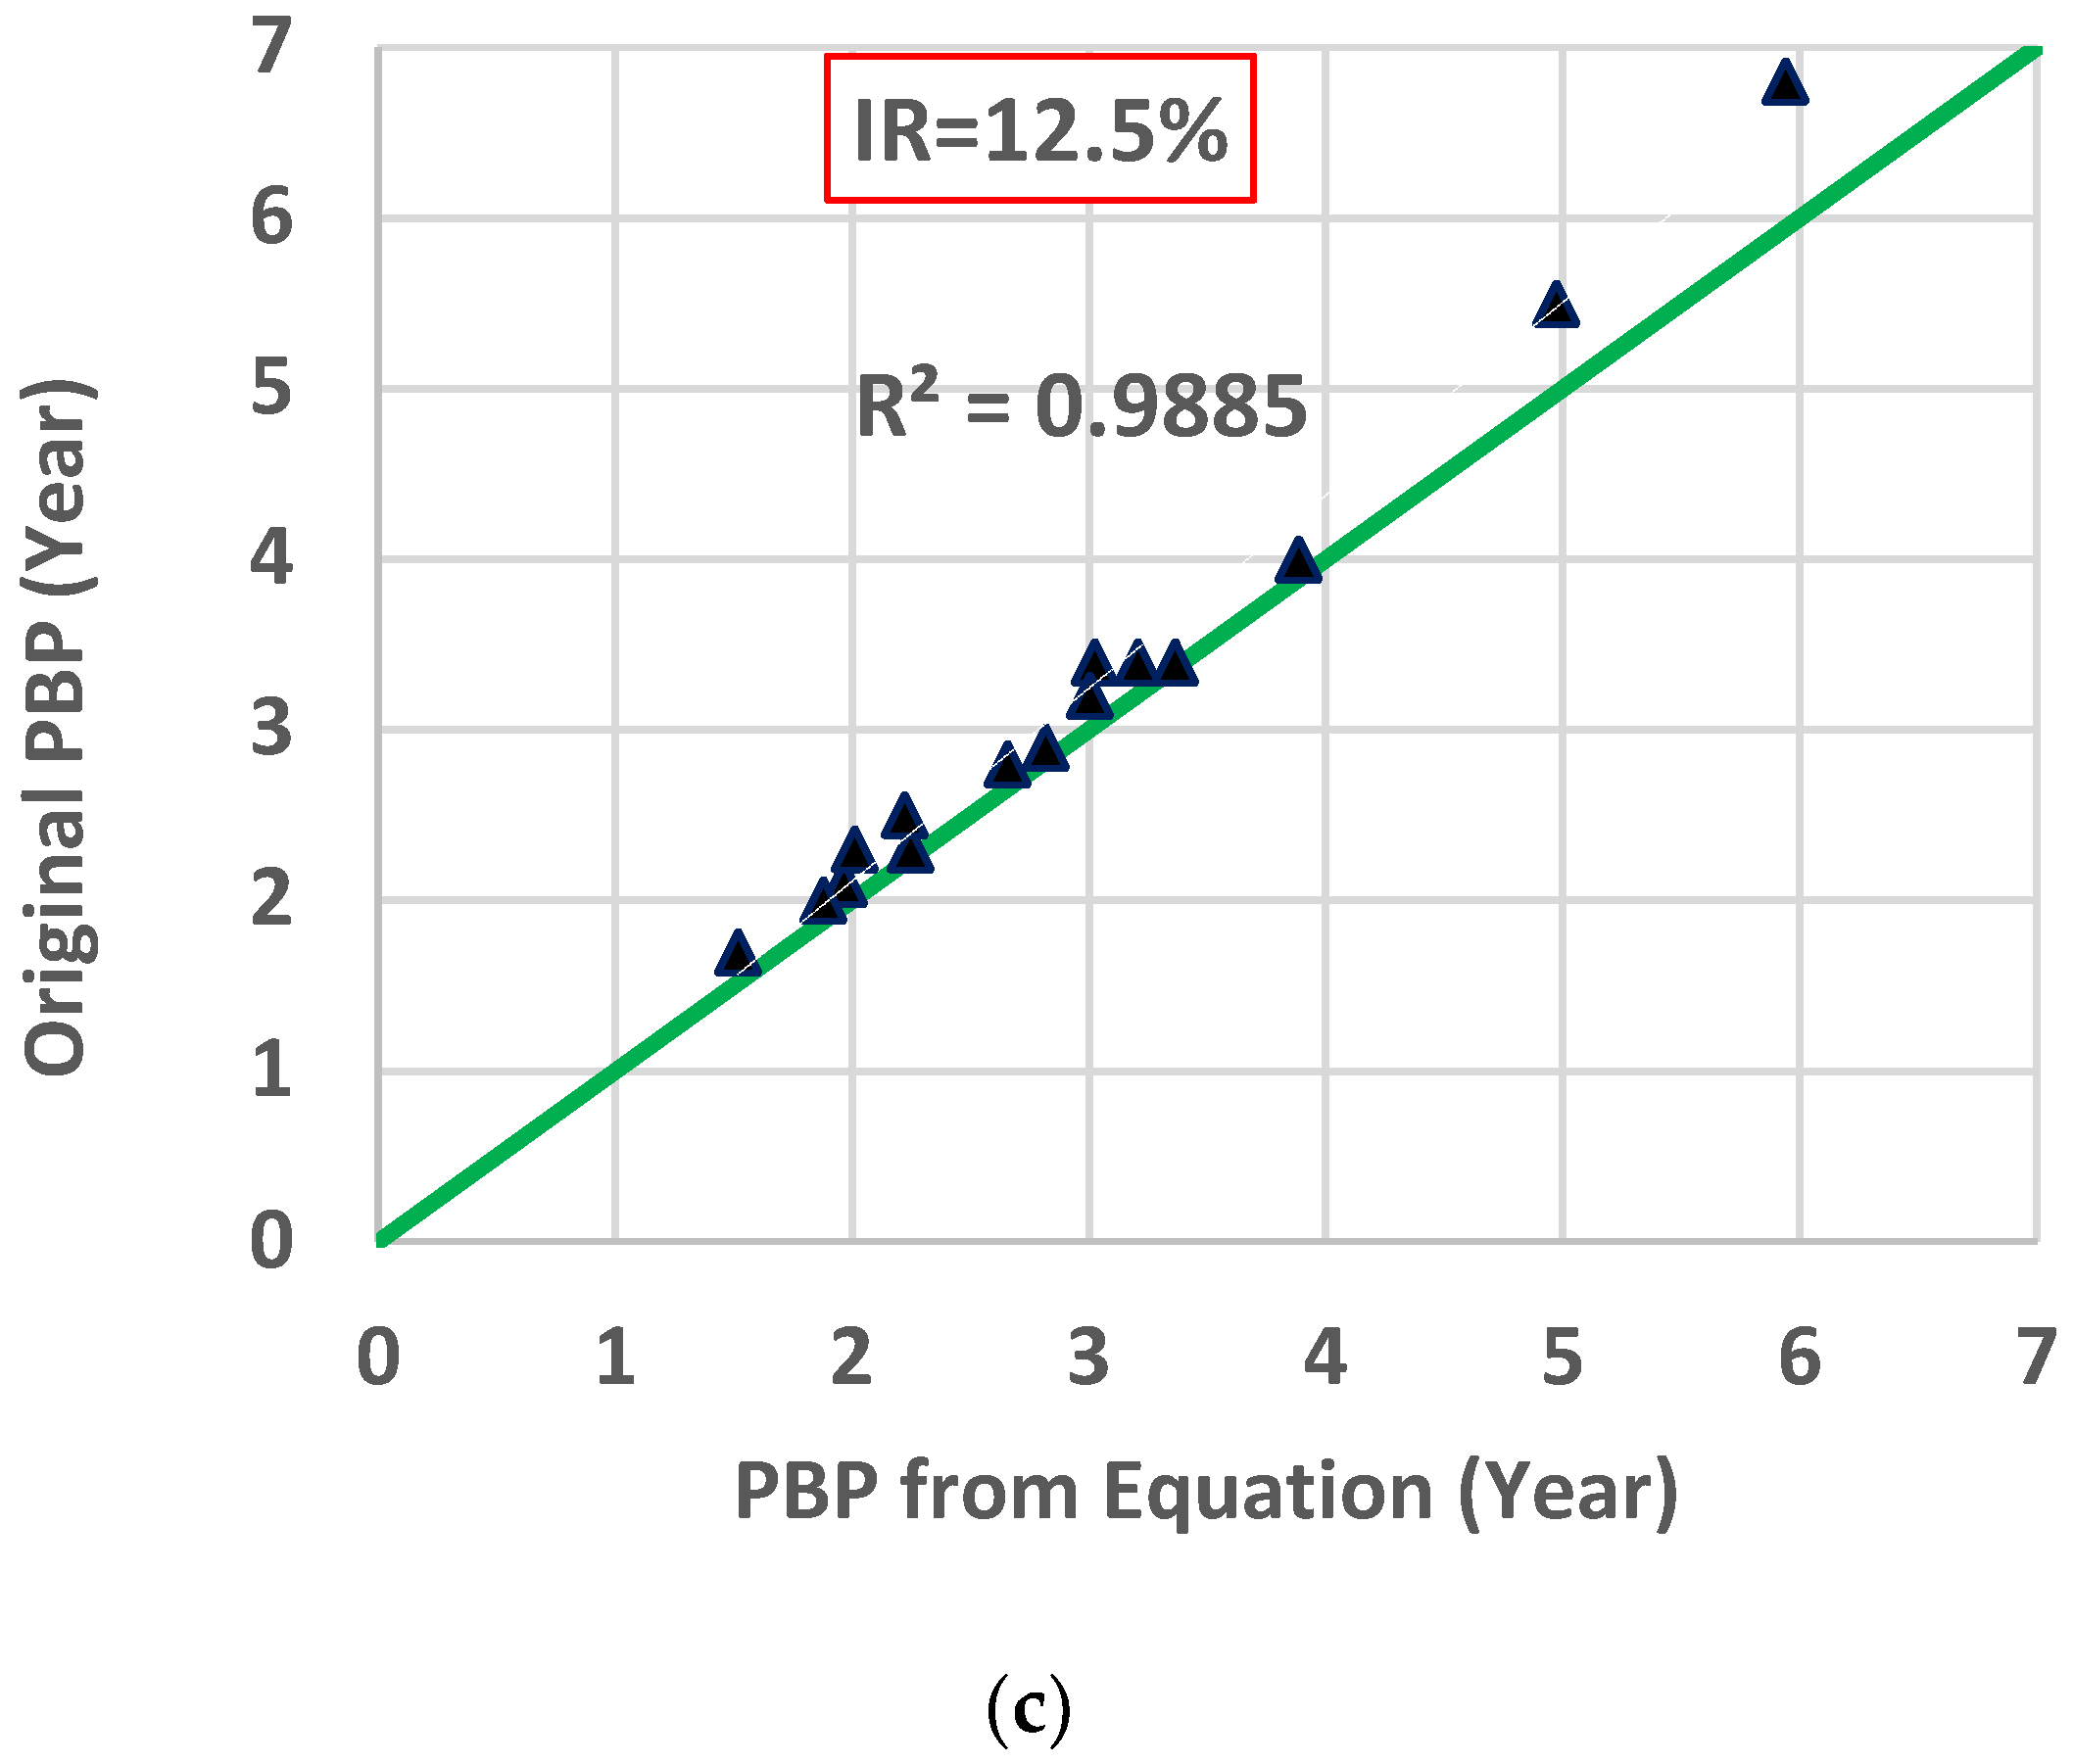
Accuracy of the developed equation was assessed through calculating payback periods using the developed equation for different input values of roof areas, initial costs, and internal rates of return. The equation calculated values were compared with the original PBP calculations using the cumulative net present values of the net savings as outlined in Karim et al. [31]. Figure 4a–c shows the comparisons of the equation predicted results with the original PBP calculations using cumulative net present values of the net savings. The comparisons are separately presented for different values of the rate of return; Figure 4a for 3%, Figure 4b for 8% and Figure 4c for 12.5%. In each figure a line drawn with an angle of 45° to show the ideal position of the scattered points. From the figures, it is clear that the developed equation can estimate the payback periods with very good accuracy, especially for lower internal rates of return and for the lower ranges of payback periods. Figure 4a shows all the points closely matching with the ideal line. Figure 4b,c also show very close matching of equation predicted results with the original calculations, slight discrepancies are observed only in the higher (5 and above) ranges of the PBPs. The co-efficient of determinations (R2) for the equation produced results are 0.993, 0.991, and 0.988 for the internal rates of return of 3%, 8%, and 12.5%, respectively. Furthermore, the correlation coefficients among the equation produced results and the results from traditional calculations are 1.0, 1.0, and 0.99 for the internal rates of return of 3%, 8%, and 12.5%, respectively. From the above acceptibility measures, it is clear that for 3% and 8% inernal rates of return, the equation produced results are having excellent match with the traditional calculations having ‘R2’ values of above 0.99 and correlation coefficents of 1.0. For the rate of return of 12.5%, the discrepancies are insignificant, as it still produces the results having ‘R2’ value of about 0.99 and correlation coefficent of 0.99.

3.3. Specific Scenario

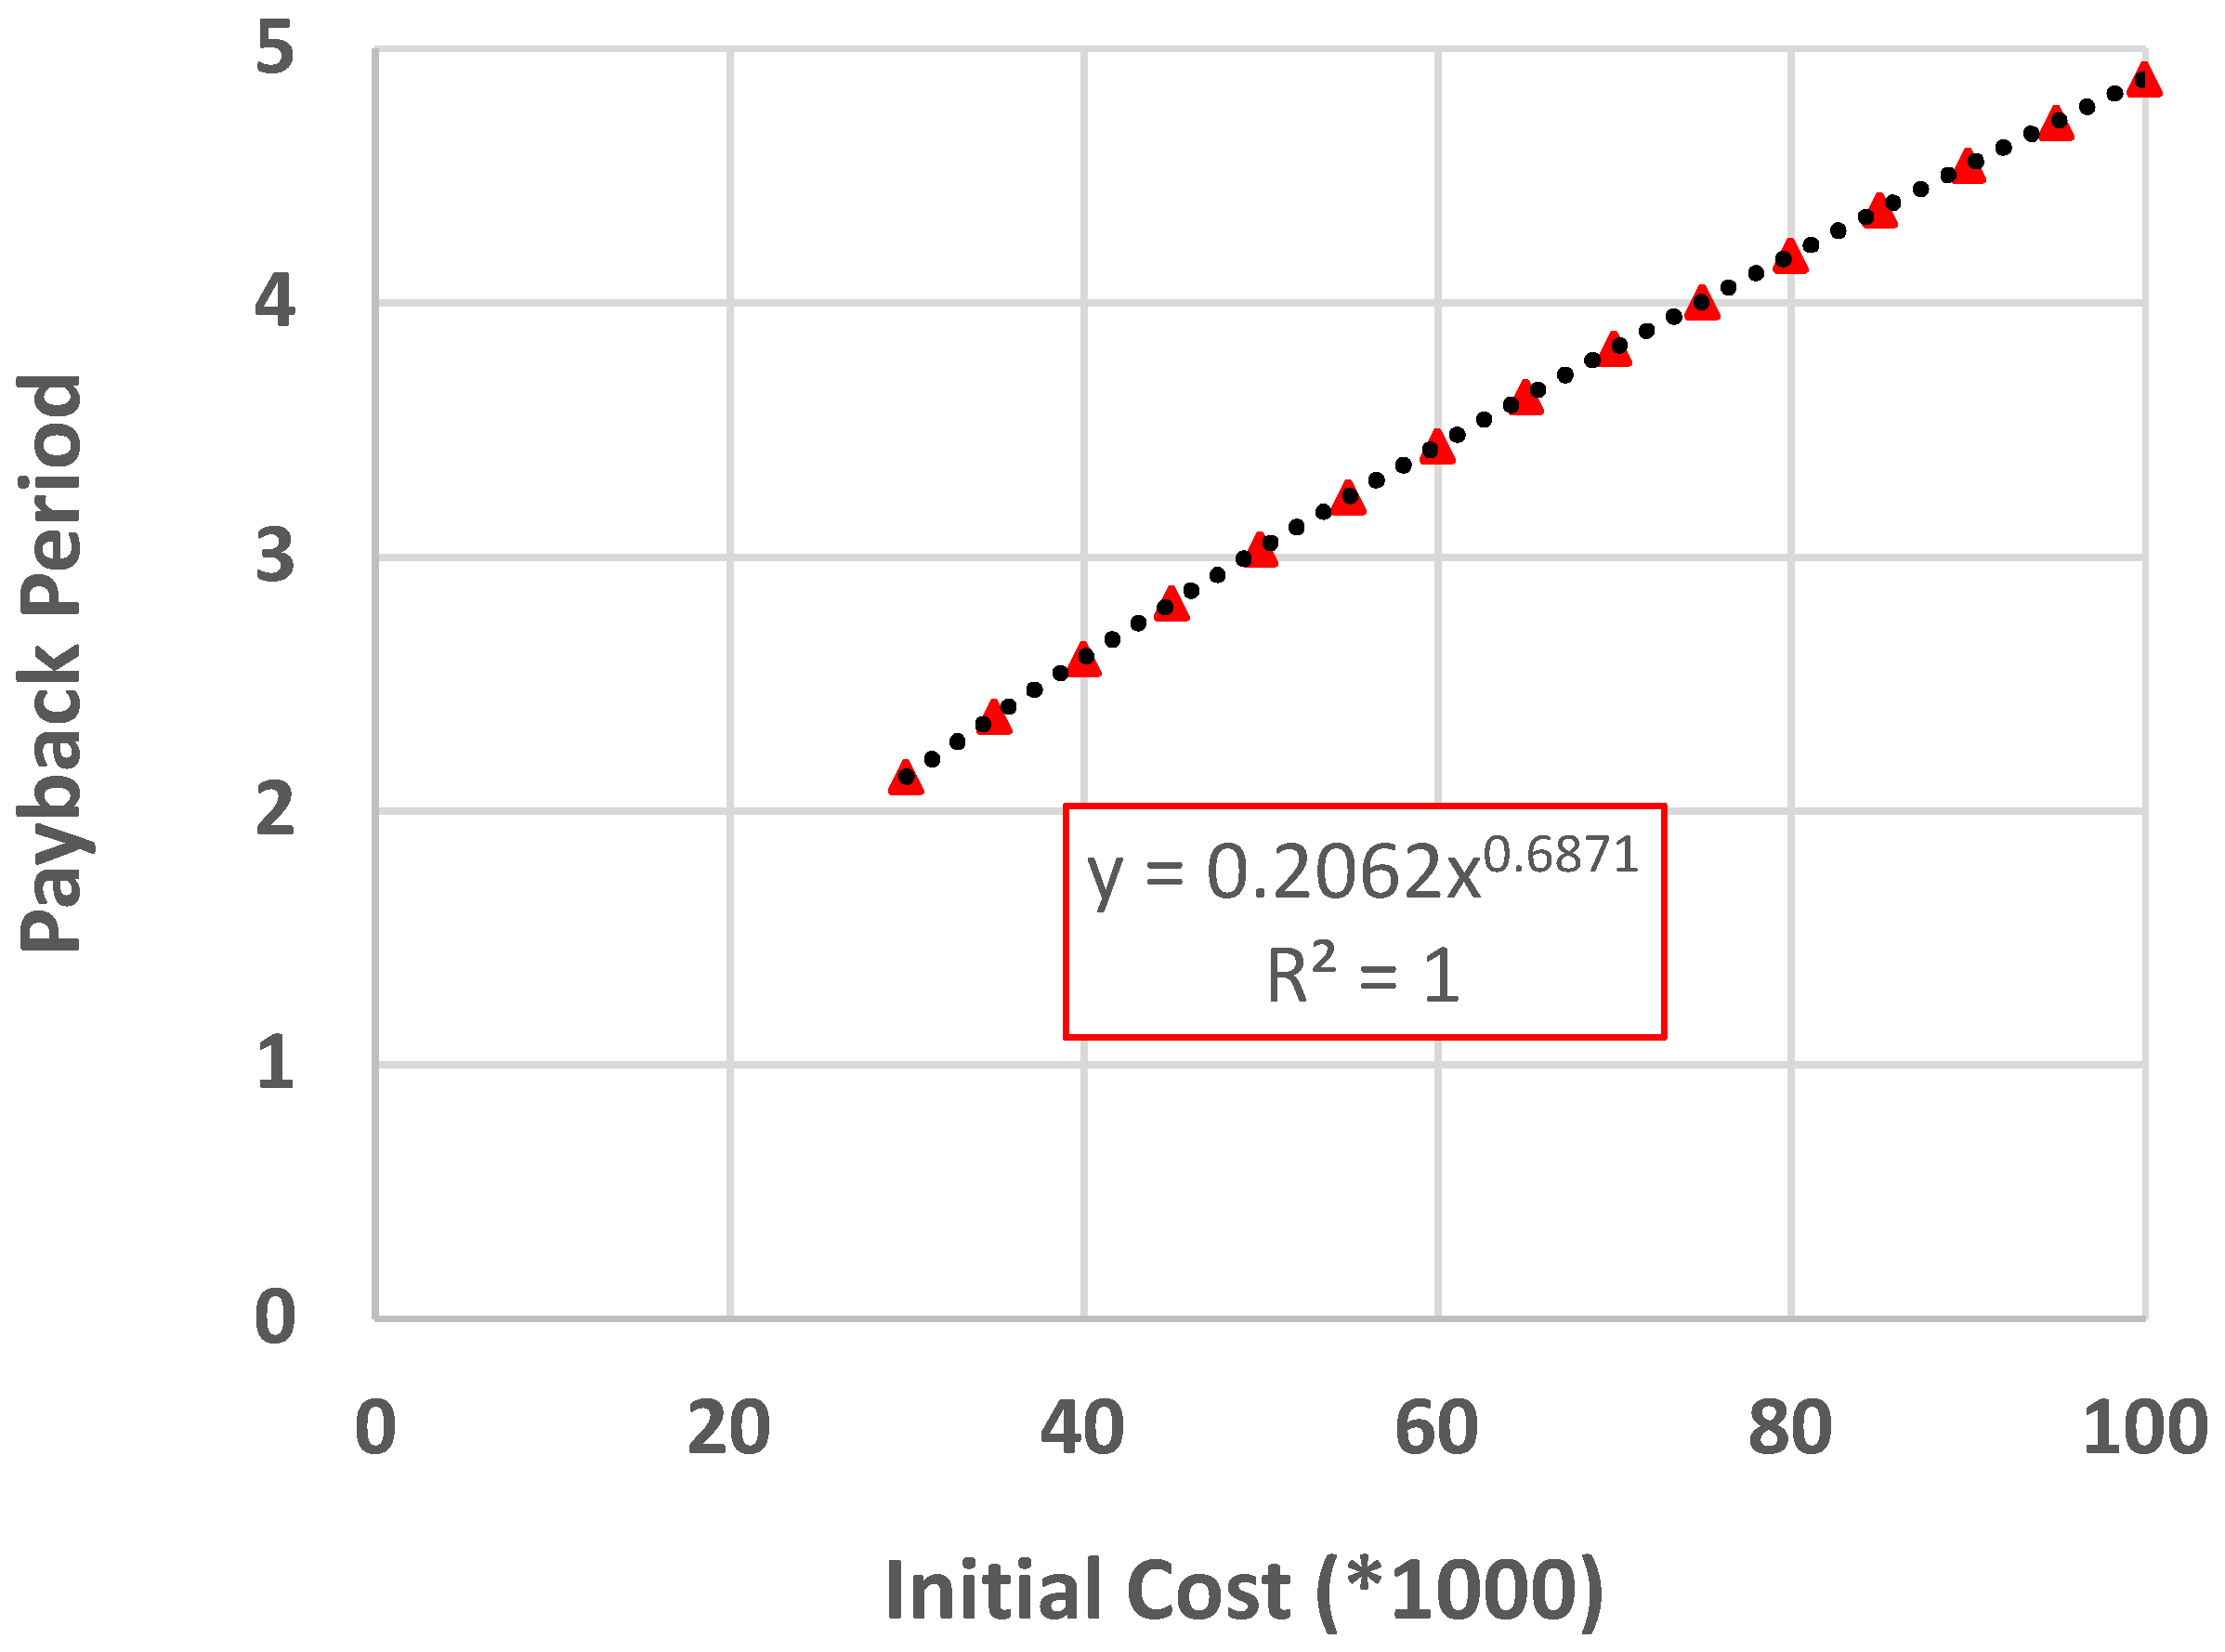
Figure 1 clearly demonstrates the relationship of roof area with the payback period, which is following a power function with a negative exponent value and the final developed equation contains the same function. However, from the developed equation it is difficult to visualise the relationship of initial cost with the payback period, as the initial cost is embedded both in the coefficient and exponent of the base equation i.e., Equation (12). To visualise the relationship between initial cost and payback period, the developed equation was used to calculate a series of payback periods (PBPs) for different values of the initial cost ranging from 30 K to 100 K for a fixed roof area of 500 m2 with an 8% rate of return. Figure 5 shows the relationship between initial costs and equation estimated payback periods. From the figure it is clear that it follows a clear pattern; a regression line produced with the calculated points provided a power function (with an exponent less than 1.0) as a best-fit line having a coefficient of determination (R2) value of 1.0.

4. Conclusions

Traditional practice of calculating payback period of any investment is conducted individually and case by case considering individual investment cost and successive benefits over the years, while transforming future expected benefits into a reduced net present value, which considers rate of return (in other words discount rate). Being a small sized system, the end-users of typical rainwater tanks are not interested in performing tedious payback period analysis for their investments. However, without such analysis, a knowledge-gap prevails which leads to reluctance in implementing such rainwater harvesting system although becoming more and more important with the tremendous demand of water under ever-increasing population and adverse impacts of climate change. Based on payback period calculations for costs of rainwater harvesting system and subsequent net monetary savings for five existing commercial buildings in the capital of Bangladesh, Dhaka a generalised equation is proposed. All the future monetary savings were converted to net present value applying a rate of return and eventually accumulating successive future savings.
It was found that the payback periods for each initial cost are dependent on the roof area, which is directly related to rainfall amounts collected on the roof. The base equation of roof area versus payback period can be expressed as a power-function having a negative exponent, which reveals higher the roof area lower the PBP. The coefficients and exponents of the base equations for all the initial cost values of return can be correlated with the initial cost and subsequently with the internal rates of return. A comparison between the equation produced payback periods and the original calculated payback periods reveled that equation can calculate the payback periods with very good accuracy, especially for lower payback periods and the payback periods with lower internal rates of return. Insignificant discrepancies are observed only in higher payback periods calculated with higher rate of return. Equation produced results are having coefficient of determination values ranging from 0.988 to 0.993. Furthermore, correlations between original calculated PBPs and equation produced PBPs varies from 0.99 to 1.0.
Such modelling exercise to derive generalised equation is useful for the stakeholders and end-users who want to implement similar rainwater harvesting system, but are not convinced of their potential return of benefit. This sort of equations will help in decision making on selecting input parameters such as roof area to be connected with the storage tank and the volume of tank which is related with the initial cost. Moreover, such equation can be easily converted to a mobile app, which will easily deliver the outcomes to the end-users. This is the first attempt of applied such methodology to evaluate payback period of a stormwater harvesting system. It is to be noted that developed equation is valid for the city of Dhaka, as it is dependent on the amount of rainfall in a particular city/location. For other cities, the expected amount of potable water savings with the same roof size will be different, which needs to be established through a proper RWH analysis tool, as it was earlier done for this study. Nonetheless, similar methodology can be applied to develop similar generalised equations for other cities/locations having different rainfall regimes. Eventually, different equations from different locations can be combined to one equation, which will include the rainfall amount as a variable.

Author Contributions

Conceptualization, M.A.I. and M.B.; methodology, M.A.I.; validation, M.A.I. and M.R.K.; formal analysis, M.A.I. and M.B.; investigation, M.A.I.; resources, M.B.; data curation, M.R.K.; writing—original draft preparation, M.A.I. and M.B.; writing—review and editing, M.A.I. and M.B.; visualisation, M.A.I.; supervision, M.A.I.; project administration, M.A.I. All authors have read and agreed to the published version of the manuscript.

Funding

This research received no external funding.

Institutional Review Board Statement

Not applicable.

Informed Consent Statement

Not applicable.

Data Availability Statement

The data presented in this study are available within the article and in the publication of Karim et al. [22].

Conflicts of Interest

The authors declare no conflict of interest.

References

  1. Matos, C.; Santos, C.; Bentes, I.; Imteaz, M.A.; Pereira, S. Economic analysis of a rainwater harvesting system in a commercial building. Water Resour. Manag. 2015, 29, 3971–3986. [Google Scholar] [CrossRef]
  2. Şen, Z.; Alsheikh, A.A.; Al-Turbak, A.S.; Al-Bassam, A.M.; Al-Dakheel, A.M. Climate change impact and runoff harvesting in arid regions. Arab. J. Geosci. 2013, 6, 287–295. [Google Scholar] [CrossRef]
  3. Rahman, S.; Khan, M.; Akib, S.; Che Din, N.B.; Biswas, S.; Shirazi, S. Sustainability of rainwater harvesting system in terms of water quality. Sci. World J. 2014, 721357. [Google Scholar] [CrossRef]
  4. Karim, R.; Bashar, M.Z.I.; Alam-Imteaz, M. Reliability and economic analysis of urban rainwater harvesting in a megacity in Bangladesh. Resour. Conserv. Recycl. 2015, 104, 61–67. [Google Scholar] [CrossRef]
  5. Bashar, M.Z.I.; Karim, M.R.; Imteaz, M.A. Reliability and Economic Analysis of Urban Rainwater Harvesting: A Comparative Study within Six Major Cities of Bangladesh. Resour. Conserv. Recycl. 2018, 133, 146–154. [Google Scholar] [CrossRef]
  6. Lade, O.; Oloke, D. Modelling Rainwater Harvesting System in Ibadan Nigeria: Application to a University Campus Office block. Eur. Int. J. Sci. Technol. 2019, 8, 57–71. [Google Scholar]
  7. Monjaiang, P.; Limphitakphong, N.; Kanchanapiya, P.; Tantisattayakul, T.; Chavalparit, O. Assessing Potential of Rainwater Harvesting: Case Study Building in Bangkok. Int. J. Environ. Sci. Dev. 2018, 9, 222–225. [Google Scholar] [CrossRef] [Green Version]
  8. Lawrence, D.; Lopes, V.L. Reliability analysis of urban rainwater harvesting for three Texas cities. J. Urban. Environ. Eng. 2016, 10, 124–134. [Google Scholar] [CrossRef]
  9. Lani, N.H.M.; Yusop, Z.; Syafiuddin, A. A review of rainwater harvesting in Malaysia: Prospects and challenges. Water 2018, 10, 506. [Google Scholar] [CrossRef] [Green Version]
  10. Sakson, G. Cost analysis of a rainwater harvesting system in Poland. E3S Web Conf. 2018, 45, 00078. [Google Scholar] [CrossRef]
  11. Zhang, S.; Jing, X. Hydrologic Design and Economic Benefit Analysis of Rainwater Harvesting Systems in Shanghai, China. In Proceedings of the International Low Impact Development Conference China 2016, Beijing, China, 26–29 June 2016; American Society of Civil Engineers: Reston, VA, USA, 2016. ISBN 780784481042. [Google Scholar]
  12. Matos, C.; Santos, C.; Pereira, S.; Bentes, I.; Imteaz, M.A. Rainwater storage tank sizing: Case study of a commercial building. Int. J. Sustain. Built Environ. 2014, 2, 109–118. [Google Scholar] [CrossRef] [Green Version]
  13. Moniruzzaman, M.; Imteaz, M.A. Generalized equations, climatic and spatial variabilities of potential rainwater savings: A case study for Sydney. Resour. Conserv. Recycl. 2017, 125, 139–156. [Google Scholar] [CrossRef]
  14. Rahman, A.; Keane, J.; Imteaz, M.A. Rainwater Harvesting in Greater Sydney: Water Savings, Reliability and Economic Benefits. Resour. Conserv. Recycl. 2012, 61, 16–21. [Google Scholar] [CrossRef]
  15. Musz-Pomorska, A.; Widomski, M.; Gołebiowska, J. Financial Sustainability of Selected Rain Water Harvesting Systems for Single-Family House under Conditions of Eastern Poland. Sustainability 2020, 12, 4853. [Google Scholar] [CrossRef]
  16. Garrick, D.; Iseman, T.; Gilson, G.; Brozovic, N.; O’Donnel, E.; Matthews, N.; Miralles-Wilhelm, F.; Wight, C.; Young, W. Scalable solutions to freshwater scarcity: Advancing theories of change to incentivize sustainable water use. Water Secur. 2020, 9, 100055. [Google Scholar] [CrossRef]
  17. Dijk, S.V.; Lounsbury, A.; Hoekstra, A.; Wang, R. Strategic design and finance of rainwater harvesting to cost-effectively meet large-scale urban water infrastructure needs. Water Res. 2020, 184, 116063. [Google Scholar] [CrossRef] [PubMed]
  18. Semaan, M.; Day, S.; Garvin, M.; Ramakrishnan, N.; Pearce, A. Optimal sizing of rainwater harvesting systems for domestic water usages: A systematic literature review. Resour. Conserv. Recycl. 2020, 6, 100033. [Google Scholar] [CrossRef]
  19. Sangave, A.A.; Mohite, S.J.; Pawar, H.R.; Kulkarni, V.V.; Abhangrao, C.R. Design & Estimation of Rain Water Harvesting System for a college campus in Solapur City. Int. J. Eng. Adv. Technol. 2019, 8, 4629–4632. [Google Scholar]
  20. Strelets, K.; Ovchinnikov, P.; Dzampaev, T. Performance based evaluation of rainwater harvesting system in public buildings. Matec. Web Conf. 2016, 7, 03006. [Google Scholar] [CrossRef] [Green Version]
  21. Galal, K. The efficiency of rainwater harvesting systems in the Lebanese coastal zone. Archit. Plan. J. 2020, 26, 2. [Google Scholar]
  22. Imteaz, M.A.; Moniruzzaman, M. Spatial variability of reasonable government rebates for rainwater tank installations: A case study for Sydney. Resour. Conserv. Recycl. 2018, 133, 112–119. [Google Scholar] [CrossRef]
  23. Farreny, R.; Gabarrell, X.; Rieradevall, J. Cost-efficiency of rainwater harvesting strategies in dense Mediterranean neighbourhoods. Resour. Conserv. Recycl. 2011, 55, 686–694. [Google Scholar] [CrossRef]
  24. Imteaz, M.A.; Shanableh, A.; Rahman, A.; Ahsan, A. Optimisation of Rainwater Tank Design from Large Roofs: A Case Study in Melbourne, Australia. Resour. Conserv. Recycl. 2011, 55, 1022–1029. [Google Scholar] [CrossRef]
  25. Woon, Y.B.; Tan, W.L.; Chow, M.F. Community Rainwater Harvesting Financial Payback Analyses-Case Study in Malaysia. IOP Conference Series: Materials Science and Engineering. IOP Publ. 2019, 636. [Google Scholar] [CrossRef] [Green Version]
  26. Stec, A.; Słyś, D. Rainwater potential use in dormitory building: Drinking water savings and economic costs. Ecol. Chem. Eng. A 2017, 24, 43–64. [Google Scholar]
  27. Domínguez, I.; Ward, S.; Mendoza, J.G.; Rincón, C.I.; Oviedo-Ocaña, E.R. End-user cost-benefit prioritization for selecting rainwater harvesting and greywater reuse in social housing. Water 2017, 9, 516. [Google Scholar] [CrossRef] [Green Version]
  28. Abdulla, F. Rainwater harvesting in Jordan: Potential water saving, optimal tank sizing and economic analysis. Urban. Water J. 2020, 17, 446–456. [Google Scholar] [CrossRef]
  29. Gato-Trinidad, S.K. Gan Preliminary analysis of the cost effectiveness of rainwater tanks rebate scheme in Greater Melbourne, Australia. Water Soc. 2012, 153, 127–138. [Google Scholar]
  30. Nagaraj, N.; Pradhani, U.; Chengappa, P.G.; Basavaraj, G.; Kanwar, R.S. Cost Effectiveness of Rainwater Harvesting for Groundwater Recharge in Micro-Watersheds of Kolar District of India: The Case Study of Thotli Micro-Watershed. Agric. Econ. Res. Rev. 2011, 24, 217–223. [Google Scholar]
  31. Karim, M.R.; Sakib, B.M.S.; Sakib, S.S.; Imteaz, M.A. Rainwater harvesting potentials in commercial buildings in Dhaka: Reliability and economic analysis. Hydrology 2021, 8, 9. [Google Scholar] [CrossRef]
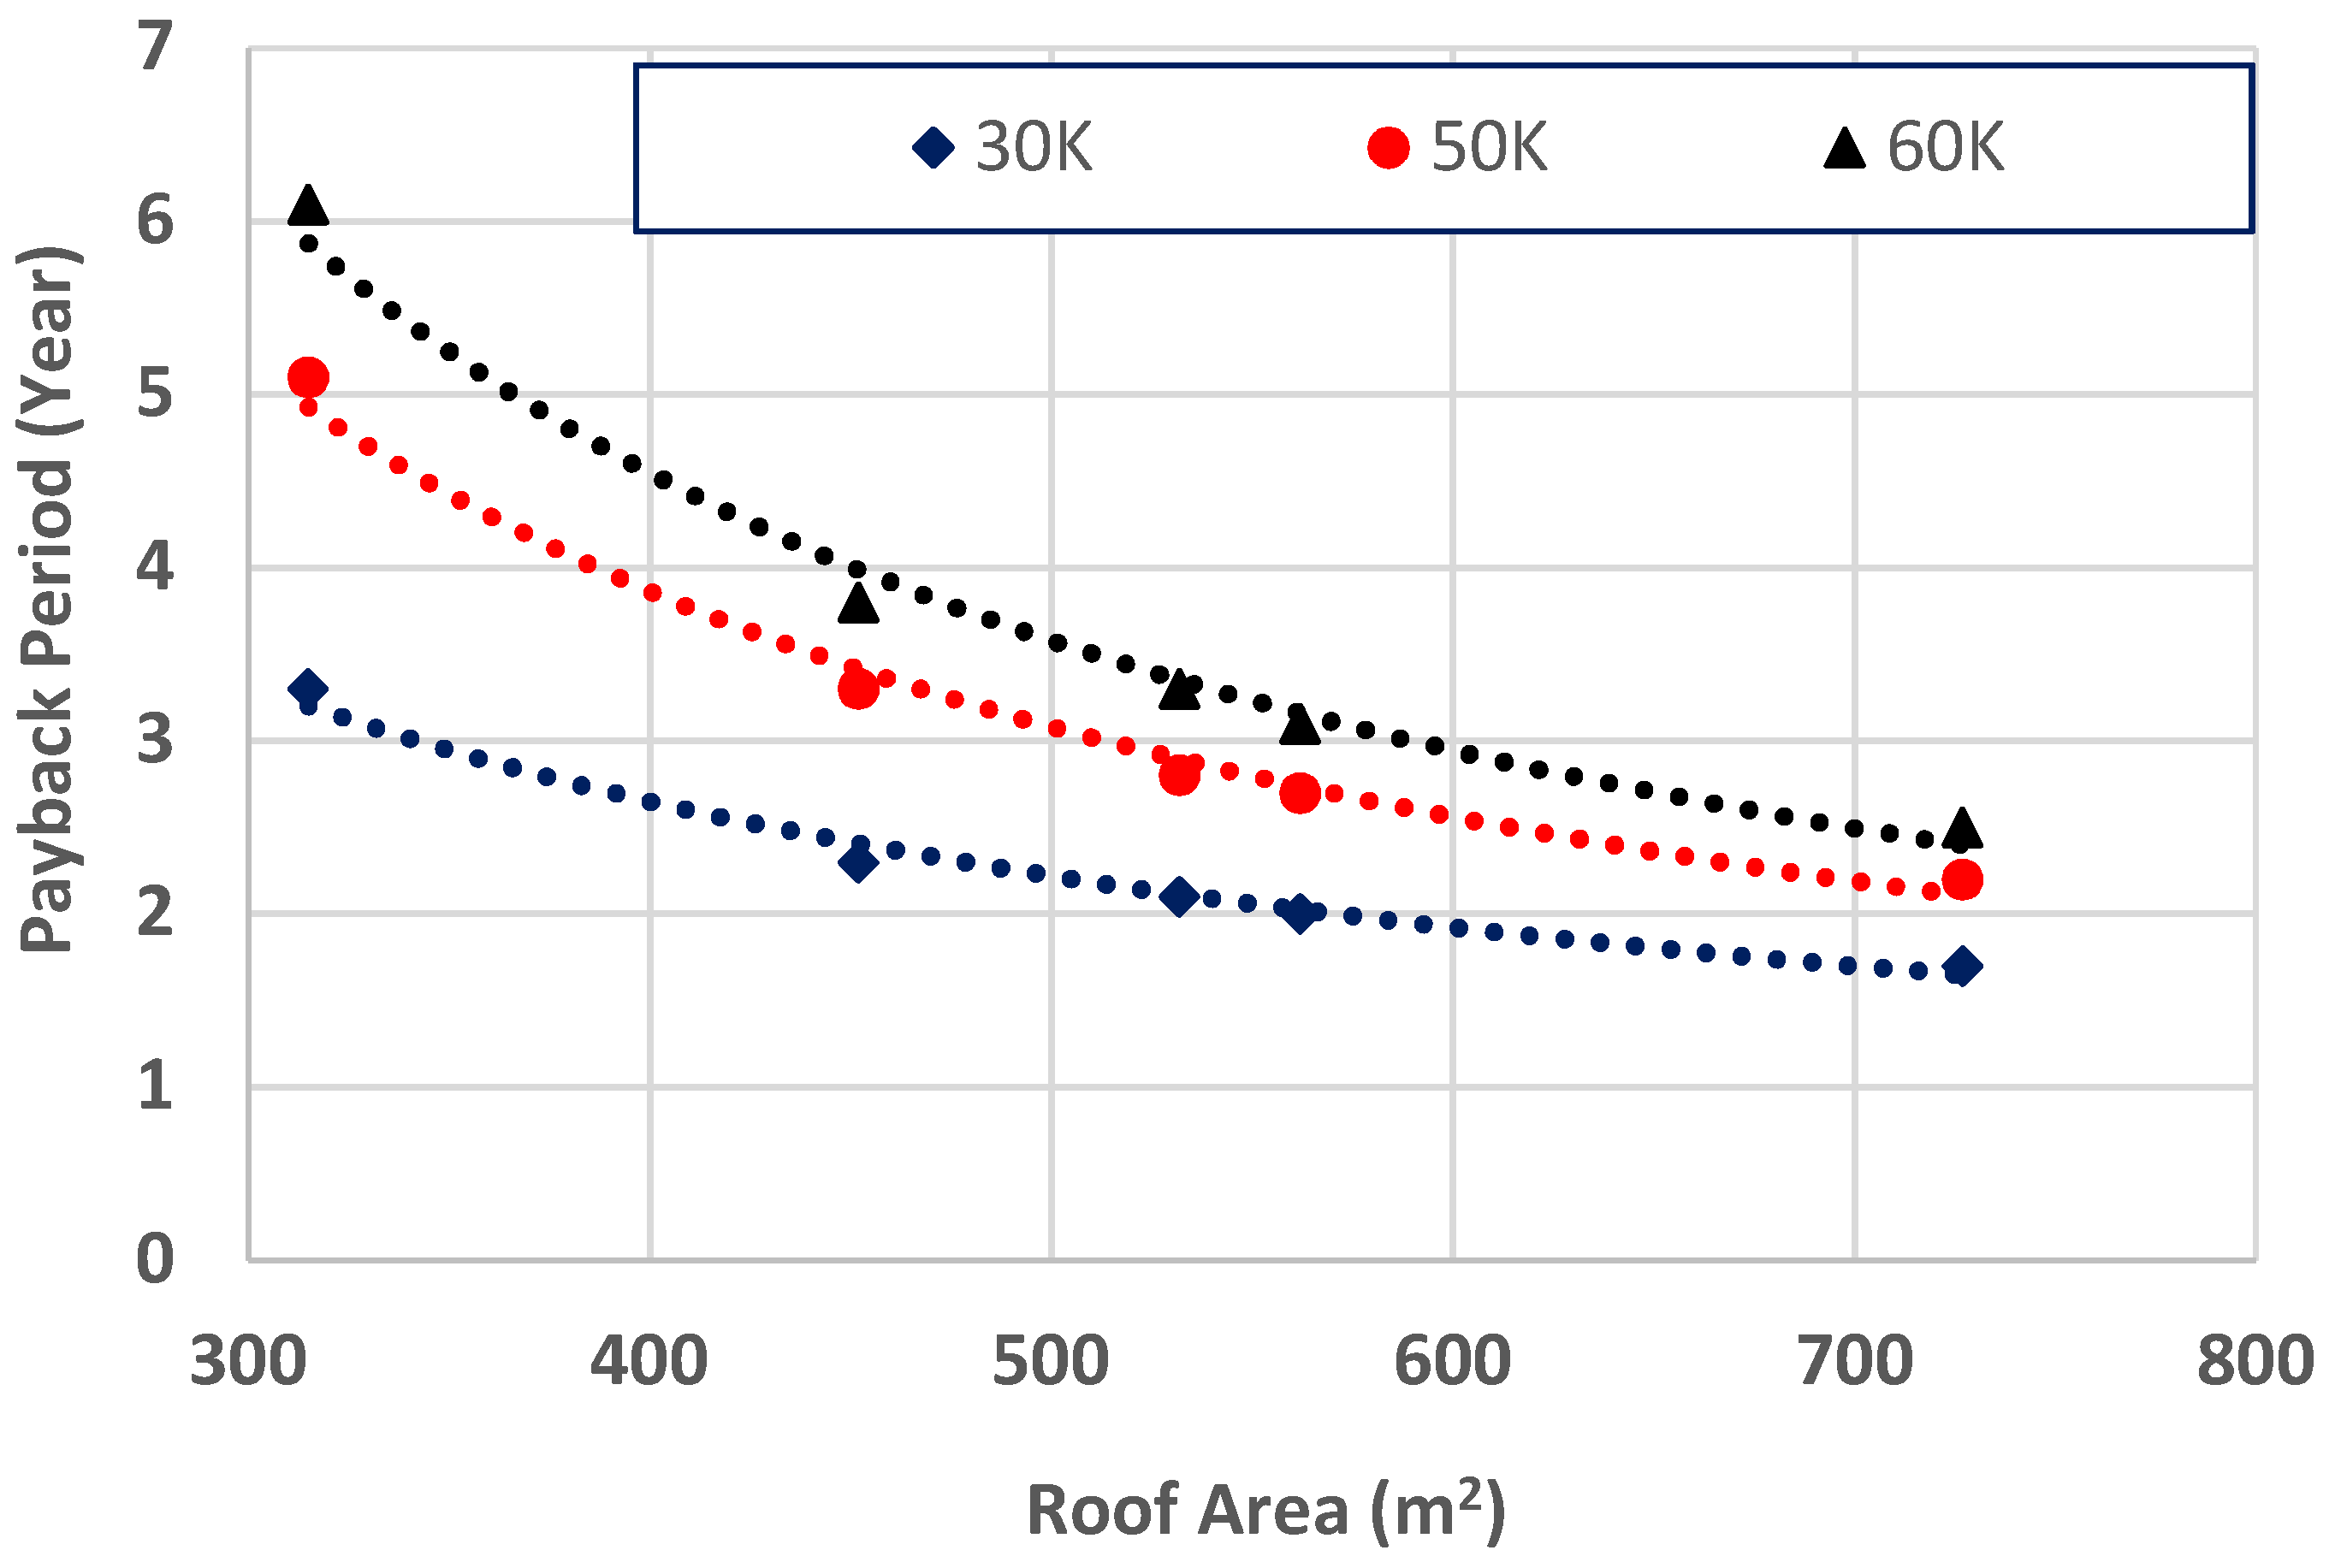
Figure 1. Payback period versus roof area curves under different initial costs.
Sustainability 13 04266 g001
Figure 2. Dependency of initial cost on payback period-roof area equation with: (a) Coefficient; (b) Exponent.
Sustainability 13 04266 g002
Figure 3. Relationships between rate of return and constants: (a) “c”; (b) “d”; (c) “e”; (d) “f”.
Sustainability 13 04266 g003
Figure 4. (a) Comparison of equation produced payback periods for 3% rate of return. (b) Comparison of equation produced payback periods for 8% rate of return. (c) Comparison of equation produced payback periods for 12.5% rate of return.
Sustainability 13 04266 g004aSustainability 13 04266 g004b
Figure 5. Relationship between initial costs and payback periods (roof area = 500 m2 rate of return = 8%).
Sustainability 13 04266 g005
Table 1. Details of the buildings considered in the study.
Building NameCatchment Area (m2)Total FloorsTank Size (m3)Installation Cost (BDT *)Maintenance Cost (BDT */year)
Evergreen Meher Tower3152 Basement + 1416230,00010,000
Green Landmark Tower4522 Basement + 1320940,00013,000
Green Satmahal5322 Basement + 1421445,00015,000
Green City Regency5622 Basement + 2232450,00018,000
Green City Edge7272 Basement + 1556660,00020,000
* Bangladesh Taka (currency).
Table 2. Values of the coefficients “c”, “d”, “e”, and “f” for different rates of internal return.
Rate of Returncdef
30.03272.62370.32030.3293
80.00543.22360.40880.5943
12.50.00053.94430.51540.9322
Publisher’s Note: MDPI stays neutral with regard to jurisdictional claims in published maps and institutional affiliations.