Article

Typological Differences in Railway Station Areas According to Locational Characteristics: A Nationwide Study of Korea

Urban Research Division, Korea Research Institute for Human Settlements, Sejong 30147, Korea
*
Author to whom correspondence should be addressed.
Sustainability 2021, 13(8), 4310; https://doi.org/10.3390/su13084310
Submission received: 19 March 2021 / Revised: 2 April 2021 / Accepted: 7 April 2021 / Published: 13 April 2021
(This article belongs to the Section Sustainable Urban and Rural Development)

Abstract

:
This study aims to explore whether railway station areas can be categorized according to locational characteristics on a nationwide level and whether the typological classification is valid for planning and development. Thirty-four railway station areas across Korea are analyzed and categorized using K-means clustering analysis. The results of the analysis prove that for all locational characteristics of land use, transit accessibility, and spatial form, station areas could be categorized into urban cores and suburbs. Moreover, the typological classification according to the location of urban cores and suburbs is valid in terms of development conditions and demand. This result implies that the role of the public and private sectors must be different in setting the space and size of areas of influence, and in forming and developing their use depending on the locational characteristics of station areas. This study contributes to the discussion on diversifying the planning and development of station areas as the heart of sustainable cities by verifying the types of station areas and their differences according to locational characteristics in East Asia, including Korea.

1. Introduction

With the growing interest in sustainability over the last few decades, constant efforts have been made to reduce vehicle travel that leads to high carbon emissions, while increasing the use of environmentally friendly public transportation such as railways. In particular, excluding Japan, which already has a dense railway network, many Asian countries such as China and Korea are making investments in transportation infrastructure that are as bold as their rapid economic growth, by quickly expanding their railroads. This change in spatial structure is expected to have a great impact on urban planning as well. Efforts to achieve transit-oriented development (TOD) with a focus on railway stations, such as in the US and European countries [1,2], have been recently accepted as a fundamental premise for urban planning and development in not only Japan and Hong Kong [3], but also in China and Korea [4,5].
However, compared to countries that have been using TOD as a means of urban planning for a long time, such as the US and Japan, Korea is yet to diversify the use of TOD in urban planning based on locational characteristics such as land use or the urban spatial structure of railway stations. The US has developed various types of TOD sites, such as centers, neighborhoods, and corridors, depending on the urban context in which the railway stations are located, actively considering these locations in urban planning [6]. Japan is also using differentiated station area maintenance techniques that consider the relationship between railway stations and the surrounding urban spaces, density, and functions [7]. This implies that various types of TOD plans and project methods are needed to reflect the functions of the urban spatial structure or surrounding conditions so that station area development can be pursued effectively.
As argued by Sohn and Kim (2011) [8], Korea has been actively using the concept of TOD planning in station area development, but has been unable to establish a differentiated plan and development model that can reflect the geographical status or land use of station areas or travel behavior characteristics. As a result, Korea is still seeking the development of railway station areas in the form of building new towns in suburbs. Consequently, there are many difficulties in the process of pursuing redevelopment or regeneration to utilize railway station areas as the new growth centers of urban cores. This is a concern not only in Korea, but also in many other Asian countries such as China [4]. Therefore, comparative research is needed in Asian countries such as Korea on how railway station areas can be categorized according to the urban context, and how approaches to urban planning and development projects must vary according to the type of railway station area.
This study investigates how railway station areas can be categorized in terms of land use, transit accessibility, and spatial form, in the context of the spatial structure and location of cities in Korea. In addition, it examines how development projects for the categorized railway station areas must be approached differently based on the present and future project conditions, such as development density or ridership. In Korea, major railway stations that are connected nationally are divided into old railway stations that have served as urban centers for decades, and new stations located in the suburbs that have mostly been added after the 2000s with the implementation of high-speed railways. Therefore, it is worth investigating whether the geographical location characteristics divided into urban cores and suburbs can be typologically classified in association with land use, areas of influence, and form of railway stations. In other words, this study suggests that railway stations located in urban cores and suburbs vary in terms of general conditions related to the urban context or station area development. Thus, the approach to urban planning or development of station areas must also be differentiated.
Accordingly, this study fulfills two major objectives. First, this study verifies whether types of railway station areas hold valid in the urban context in countries where railroad networks are rapidly expanding, such as Korea and China, in comparison to countries like the US and Japan that categorize TOD through cumulative station area development experience and use it in urban planning and development. Second, this study considers the different approaches suggested for the categorization of railway station areas in such developmental projects. Categorization considering the urban context can be used as a policy decision-making tool by policymakers or urban planners to promote more effective railway station area planning and development. Moreover, information on urban spaces and functional differences in railway station areas can contribute to further theoretical and academic endeavors.
The remainder of this paper proceeds as follows and Figure 1 shows a flow of this study. The next section reviews the key factors of consideration in the urban context for the categorization of station areas and implications for urban planning and development based on theoretical and empirical literature. The third section provides information on the station areas included in the study, data, and analysis methodology for categorization. The results of the analysis are provided in the fourth section, which discusses the typological characteristics of station areas and the differences in approaches to planning and development. The suggestions based on the results and policy implications of this study are presented in the final section.

2. Literature Review

2.1. Station Area Scope Setting and Location Functional Characteristics

In general, station areas are geographical areas under the influence of railway station areas where users of that railway station mostly reside or carry out various activities [9,10]. The process of analyzing and interpreting the characteristics of station areas begins with defining the physical boundaries of station areas, as the spatial structure and functional characteristics of station areas may vary depending on the geographical range. Therefore, researchers generally define station areas based on the Euclidean distance or about 10–15 min of walking time [11,12] and differentiate the physical boundaries of station areas based on the measure of the impact of public transportation and walking accessibility [13,14]. However, according to many studies (Table 1), the scope of station areas is difficult to define specifically through measures such as the Euclidean distance or walking accessibility. In order to determine the scope of station areas, it is important to consider their functional or locational context as well [15,16], and it is necessary to verify whether the characteristics of the areas of influence vary significantly depending on physical boundaries.
The locational and functional contexts of station areas have been generally analyzed by categorizing the level of land use distribution or land use mix (LUM). Categorizations are decided most generally by the difference in locational conditions between urban cores and suburbs [19], but this difference can be subdivided even more finely by the ratio of residence or density of buildings when comparing station areas within a specific city or limiting the scope to urban railway stations [26,27]. LUM is considered first in station area categorization because land use correlates with various factors such as accessibility to commercial districts [28], walking activity [29], and surrounding land value [30], thereby facilitating the determination of locational characteristics. Moreover, many studies on station areas focus on discovering what kind of station area planning and development will ultimately promote the use of public transportation and develop urban functions. Therefore, analyzing the LUM of station areas allows for the investigation of the spatial and functional characteristics of station areas to guide future planning and development, and confirms the presence of other influencing factors such as ridership or travel behavior.

2.2. Travel Behavior Characteristics and Accessibility
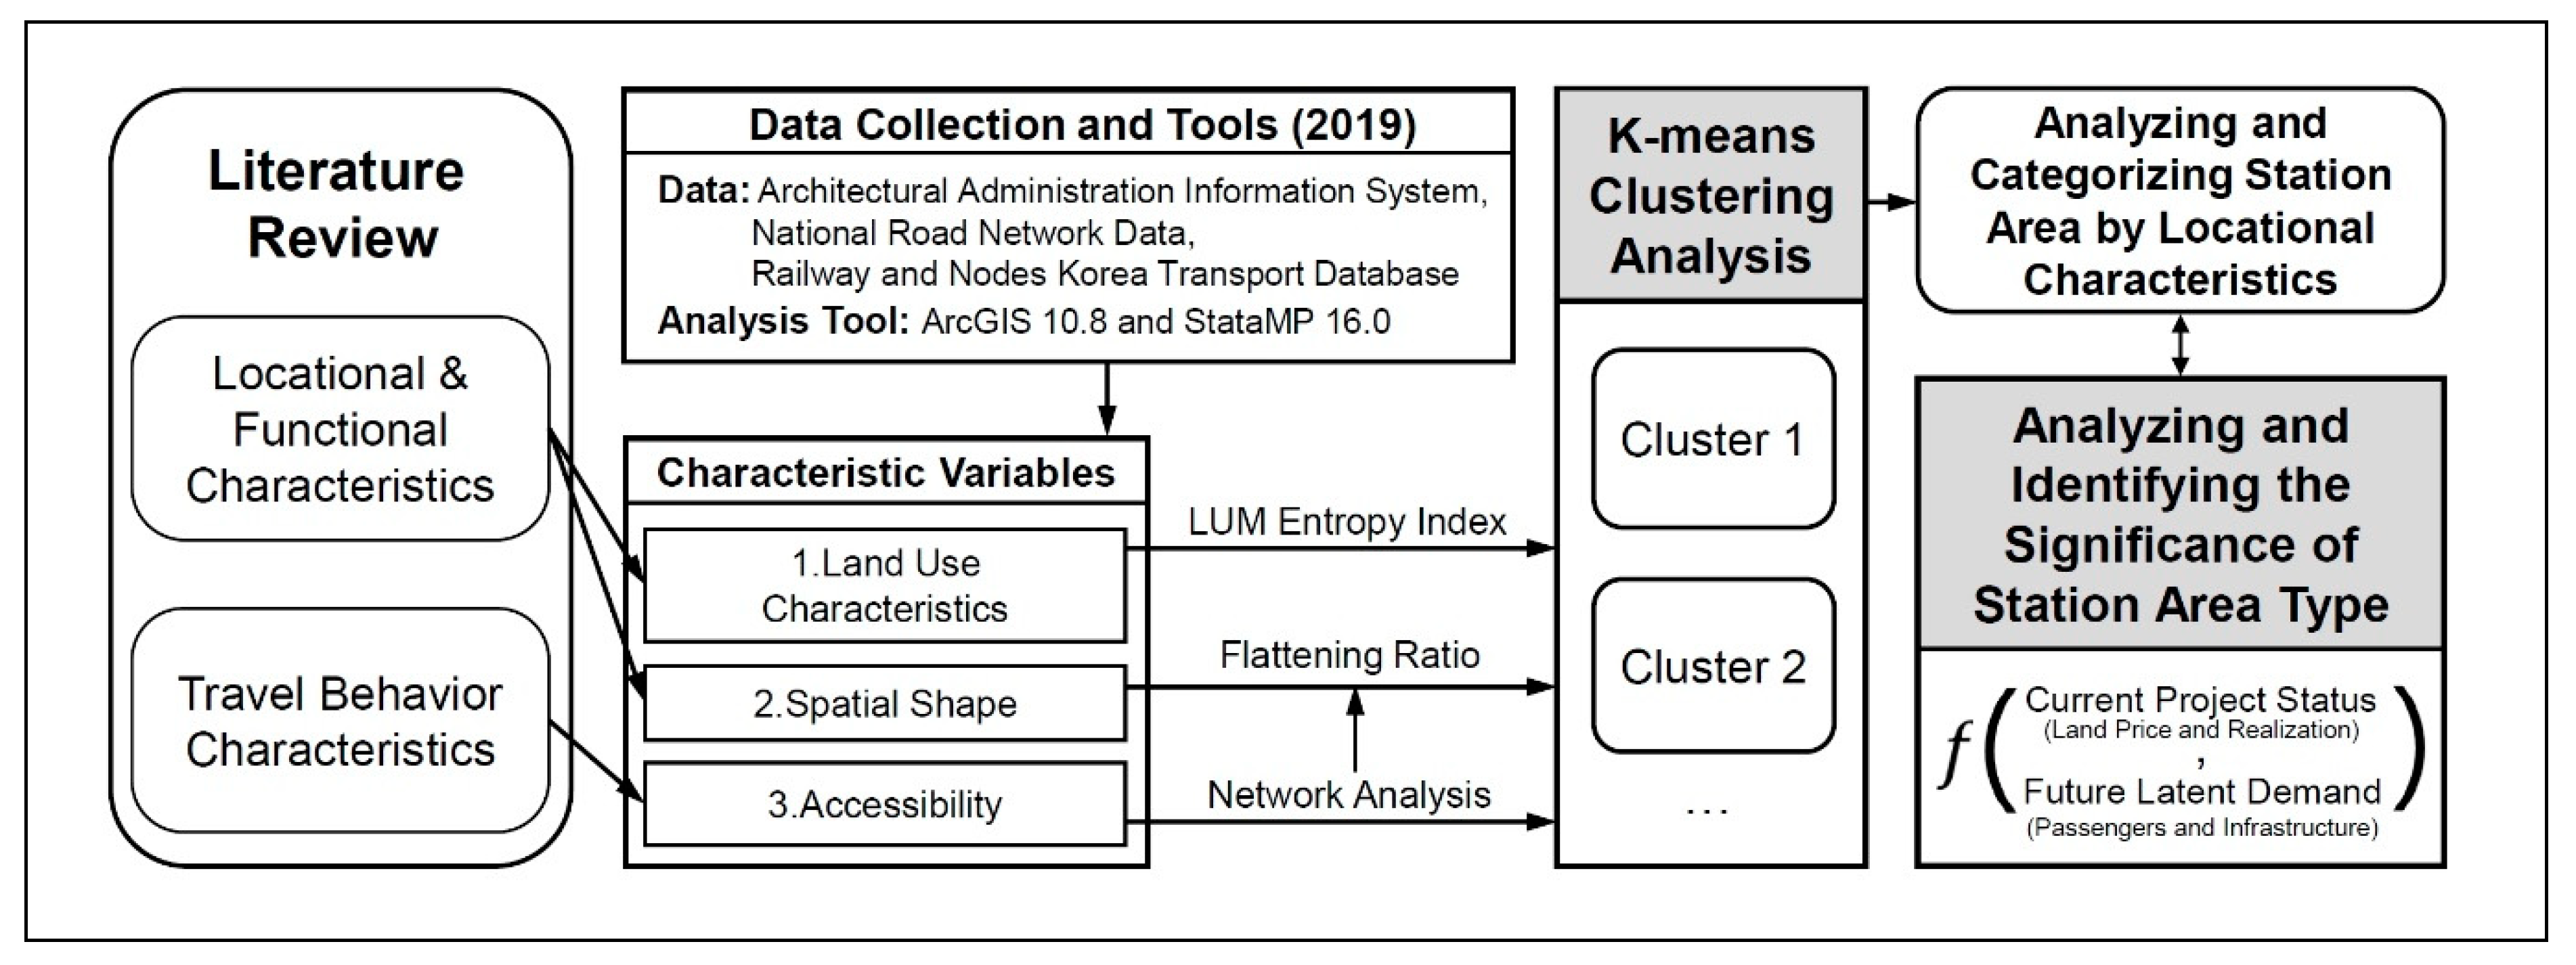
However, some studies have attempted to categorize station areas by focusing on travel behavior characteristics. The travel purpose distribution and behavioral characteristics of station users are effective in categorizing station areas [31], and the radius of influence, which is the scope of station area planning and development, is determined by the level of accessibility [14,15]. However, categorizing station areas in terms of travel behavior patterns poses difficulties in verifying the implications of spatial structure, development density, and functional distribution of urban spaces. Therefore, urban planning studies on the use of station areas mostly adopt the method of setting the travelable radius of influence and then employing a three-dimensional analysis of how LUM and spatial structure affect ridership [32,33] and accessibility [34,35].
As examined above, transit accessibility, such as land use characteristics or walking, is an index used to comprehensively categorize station areas or determine their key characteristics. However, existing researches using this index have several limitations, such as their data being limited to specific cities, therefore these studies have failed to empirically analyze the categorization patterns of station areas on a nationwide or metropolitan level. Moreover, very few studies have specifically revealed whether types of station areas according to physical influence or land use characteristics differ from those types that can be used in planning and projects, or provided in-depth policy implications of the emerging findings. Calthrope (1993) [11] and Cervero et al. (2002) [1] have provided information on types of station area development on a nationwide level, but these types do not correspond with categorizations based on land use and travel behavior characteristics. In particular, most studies in Asian nations such as Korea have been limited to big cities like Seoul [5] or been unable to attempt an overall categorization due to their analysis being limited to individual evaluation indicators such as ridership [8,33], accessibility [29,36,37], and land-use patterns [38,39]. Therefore, it is necessary to confirm whether the categorization of station areas based on land use and transit accessibility is still valid on a nationwide level. Furthermore, it is important to conduct additional research on whether the types of station areas from the aforementioned method match the types of station areas according to characteristics such as ridership and development density, which are directly linked to planning or projects, and thus, can secure logical consistency.
Adopting this perspective, this study categorizes major station areas in Korea at a nationwide level by considering land use, transit accessibility, and spatial structure characteristics. It further verifies whether the categorized types of station areas can be equally categorized in terms of station area planning and development through analysis, and what the direction of planning and development should be for the different categories of station areas.

3. Data and Methods

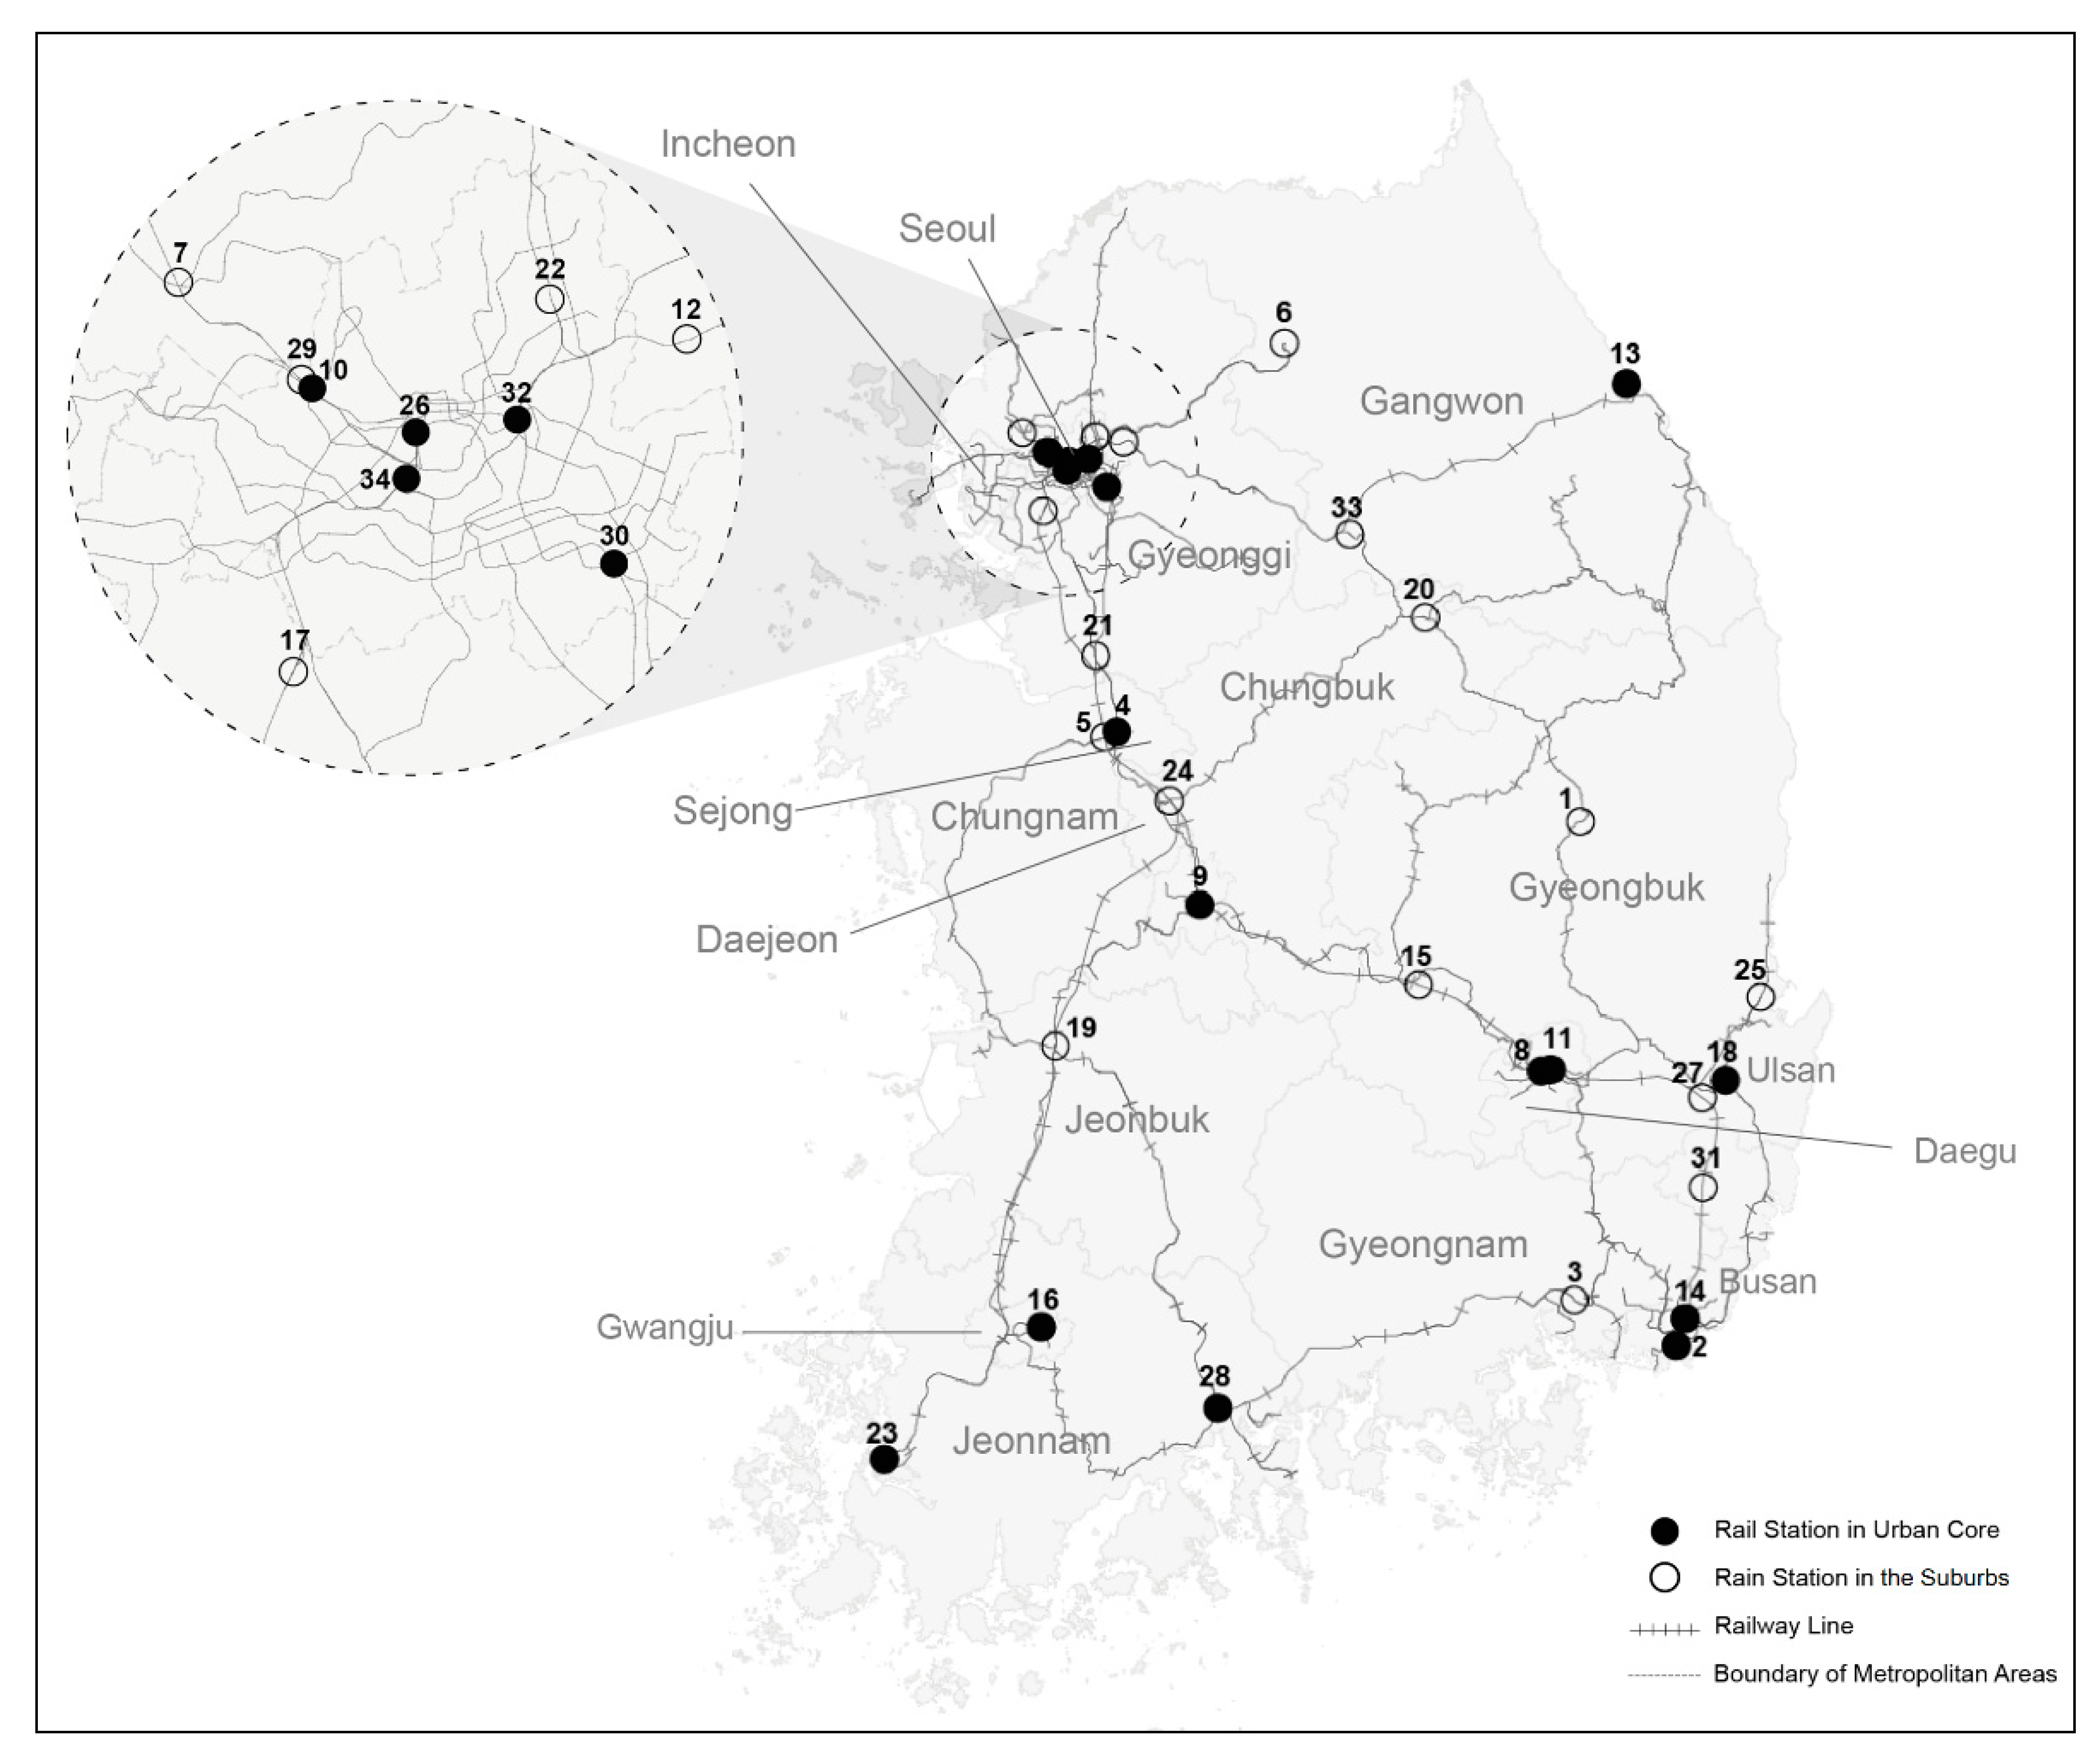
3.1. Selecting Station Areas for Categorization

This study addresses the question of whether railway station areas can be categorized at a nationwide level. Studies on railway station areas in Korea have mostly focused on urban railways, and comparative studies of railway station areas at a nationwide level have been rare [15,21,39]. However, since the opening of the high-speed railways in Korea in 2002, railway users have increased significantly, both on a nationwide and metropolitan level. Consequently, there is an increasing interest in station area development around major railway transfer points in big cities and provinces. Currently, there are 52 main stations serving as transfer points and last terminals in Korea’s national railway network, including high-speed rail. Of these, 34 stations currently have plans for the station area or development projects. Accordingly, this study selected these 34 major railway stations as targets for analysis.
The railway station areas analyzed in this study are geographically distributed in the Korean national territory, as shown in Figure 2 and Table 2, comprising 17 urban core stations and 17 suburbs stations depending on location. Urban core stations are mostly used in Seoul and big provincial cities such as Busan and Daejeon because of the formation of urban cores around the existing railway stations and for user convenience. However, for other regions, large high-speed railway stations have been established in the suburbs close to the city in the process of creating a high-speed rail network. As a result, stations in the suburbs are distributed substantially in areas other than big cities, and station area development in these areas remains an important pending regional issue.

3.2. Variables Included under Locational Characteristics and their Measurement Methods

As mentioned in Section 2, the key variables that categorize the locational characteristics of station areas are land use, transit accessibility, and spatial structure form. In this study, the land use of station areas was analyzed based on LUM using the entropy index. Moreover, transit accessibility was obtained by analyzing the accessible walking time through network analysis, and the spatial structure form was analyzed using the flattening ratio.
First, land was defined as an index to measure the diversity of two or more uses [40], and the most general index that verifies the land use patterns in the city [41,42]. LUM was indexed through the entropy index as in Equation (1); the entropy index had a value from 0 to 1, with a value closer to 1 indicating favorable LUM [43,44]. As can be seen in Equation (1):
LUM = y = 1 n P u ln P u ln n
where P u represents the area ratio for u , and n denotes the number of types of use for analysis.
This study classified the types of use into residential, commercial, business, public, cultural, and others. The areas of buildings for each use were obtained using the 2019 data from the Internet Architectural Administration Information System provided by the Ministry of Land, Infrastructure, and Transport.
Second, transit accessibility was based on accessible areas grounded on walking time and analyzed using network analysis. The radius of influence in railway station areas is measured in various ways, such as radius based on the Euclidean distance, living zone, or influence area of land use. However, the standard for this scope is defined differently among researchers or is merely set in physical boundaries. Thus, recent studies have generally analyzed pedestrian service areas using network analysis [45,46].
Network analysis is a geographic information system (GIS) spatial analysis technique that analyzes the accessibility of amenities and the areas in which they are used by analyzing the connectivity and paths of networks such as roads [47]. A network is composed of nodes and links, and the service area is calculated by establishing a triangular irregular network (TIN) based on the limit point ( D k ) and network in a certain travel time with a focus on the starting point ( O 0 ) designated on the network, and adding TIN, which is the network path from the designated point to the limit point [48]. This is shown in Equation (2):
R A a   =   i   =   1 n t i
where R A a represents the possible range of walking accessibility for Station a , T represents the overall TIN established based on the pedestrian network, and t i represents the TIN included in the social network distance (SND).
The path from the center of the designated station ( O 0 ) to the limit point ( D k ) satisfying a certain transit time is defined as O 0 D k ¯ , as shown in Equation (3):
O 0 D k ¯   =   l 1 , l 2 l j   |   i   =   1 j f l i   =   M
where l 1 , l 2 l j represents the set of links that constitute the path O 0 D k ¯ , and f l i represents the transit time calibration function.
The path O 0 D k ¯ is the sum of link sections ( l 1 , l 2 l j ), each of which comprises links in which the sum of the transit time derived from the transit time calibration function ( f l i is M , thereby satisfying SND. In this study, the average walking speed of adults was set to 4 km/h, and the standard walking time was measured at 5 min, 10 min, and 15 min to calculate the walkable zone. The pedestrian network was obtained from the 2019 national road network data based on the road name address system provided by the Ministry of Land, Infrastructure, and Transport to reflect both vehicle roads and pedestrian roads. ArcGIS 10.8 was used for network analysis.
Third, the spatial structure of the station areas was analyzed using the flattening ratio. The flattening ratio represents the flatness of an ellipse, calculated by subtracting the semi-minor axis (the shortest distance from the center of the ellipse) from the semi-major axis (the longest distance from the center of the ellipse) and dividing it by the semi-major axis. The flattening ratio is an index used to verify the types of spatial forms under the assumption that the actual station area of influence may not be determined in the form of simple circles using the Euclidean distance. According to previous studies, the spatial form of station areas is a major factor to be considered for future development potential [20], and many actual station areas of influence are in oval or atypical polygonal shapes, suggesting the need to distinguish squares and rectangles in setting the station areas [49]. Accordingly, this study analyzed the flattening ratio to identify whether locational types can be distinguished by the form of the station area’s spatial structure. The longest and shortest distances derived from the service area of the network analysis were used as the semi-major axis and semi-minor axis, respectively, of each station area.

3.3. K-Means Clustering Analysis for Categorization

Clustering analysis is a technique used commonly in statistics and machine learning for categorization as it uses similarity among independent variables without a dependent variable. There are various methods of clustering analysis, such as hierarchical, K-means, and DBSCAN (Density-Based Spatial Clustering of Applications with Noise); this study used K-means clustering analysis to categorize station areas. K-means clustering can determine the number of groups and is based on distance; thus, it can be used easily without much consideration of the statistical values—such as the mean, variance, or median—of the variables [50].
K-means clustering analysis is an algorithm that groups the given data into k clusters, minimizing the variance of each cluster and distance. Moreover, data within the cluster have similar properties, whereas the data in different clusters have different properties. In other words, grouping can be possible with just distribution of observed data, which meets the purpose of this study, i.e., categorization of the station areas based only on various locational characteristics without considering the dependent variables for specific purposes.
The analysis employed in K-means clustering is shown in Equation (4):
a r g m i n r , c   n   =   1 N   k   =   1 K r n k || X n     C k ||   2
Assuming that the number of clusters (k) is determined in advance, r n k is expressed as a binary variable with a value of 0 or 1 if the n th data belong to the k th cluster, C k represents the center of the k th cluster, and X n represents an n number of d-dimensional data. Here, the distance was measured based on the Euclidean distance. This study standardized and used three variables of locational characteristics to eliminate bias caused by different variable units. The statistical program Stata 16.0 was used for K-means clustering analysis.

4. Results and Discussion

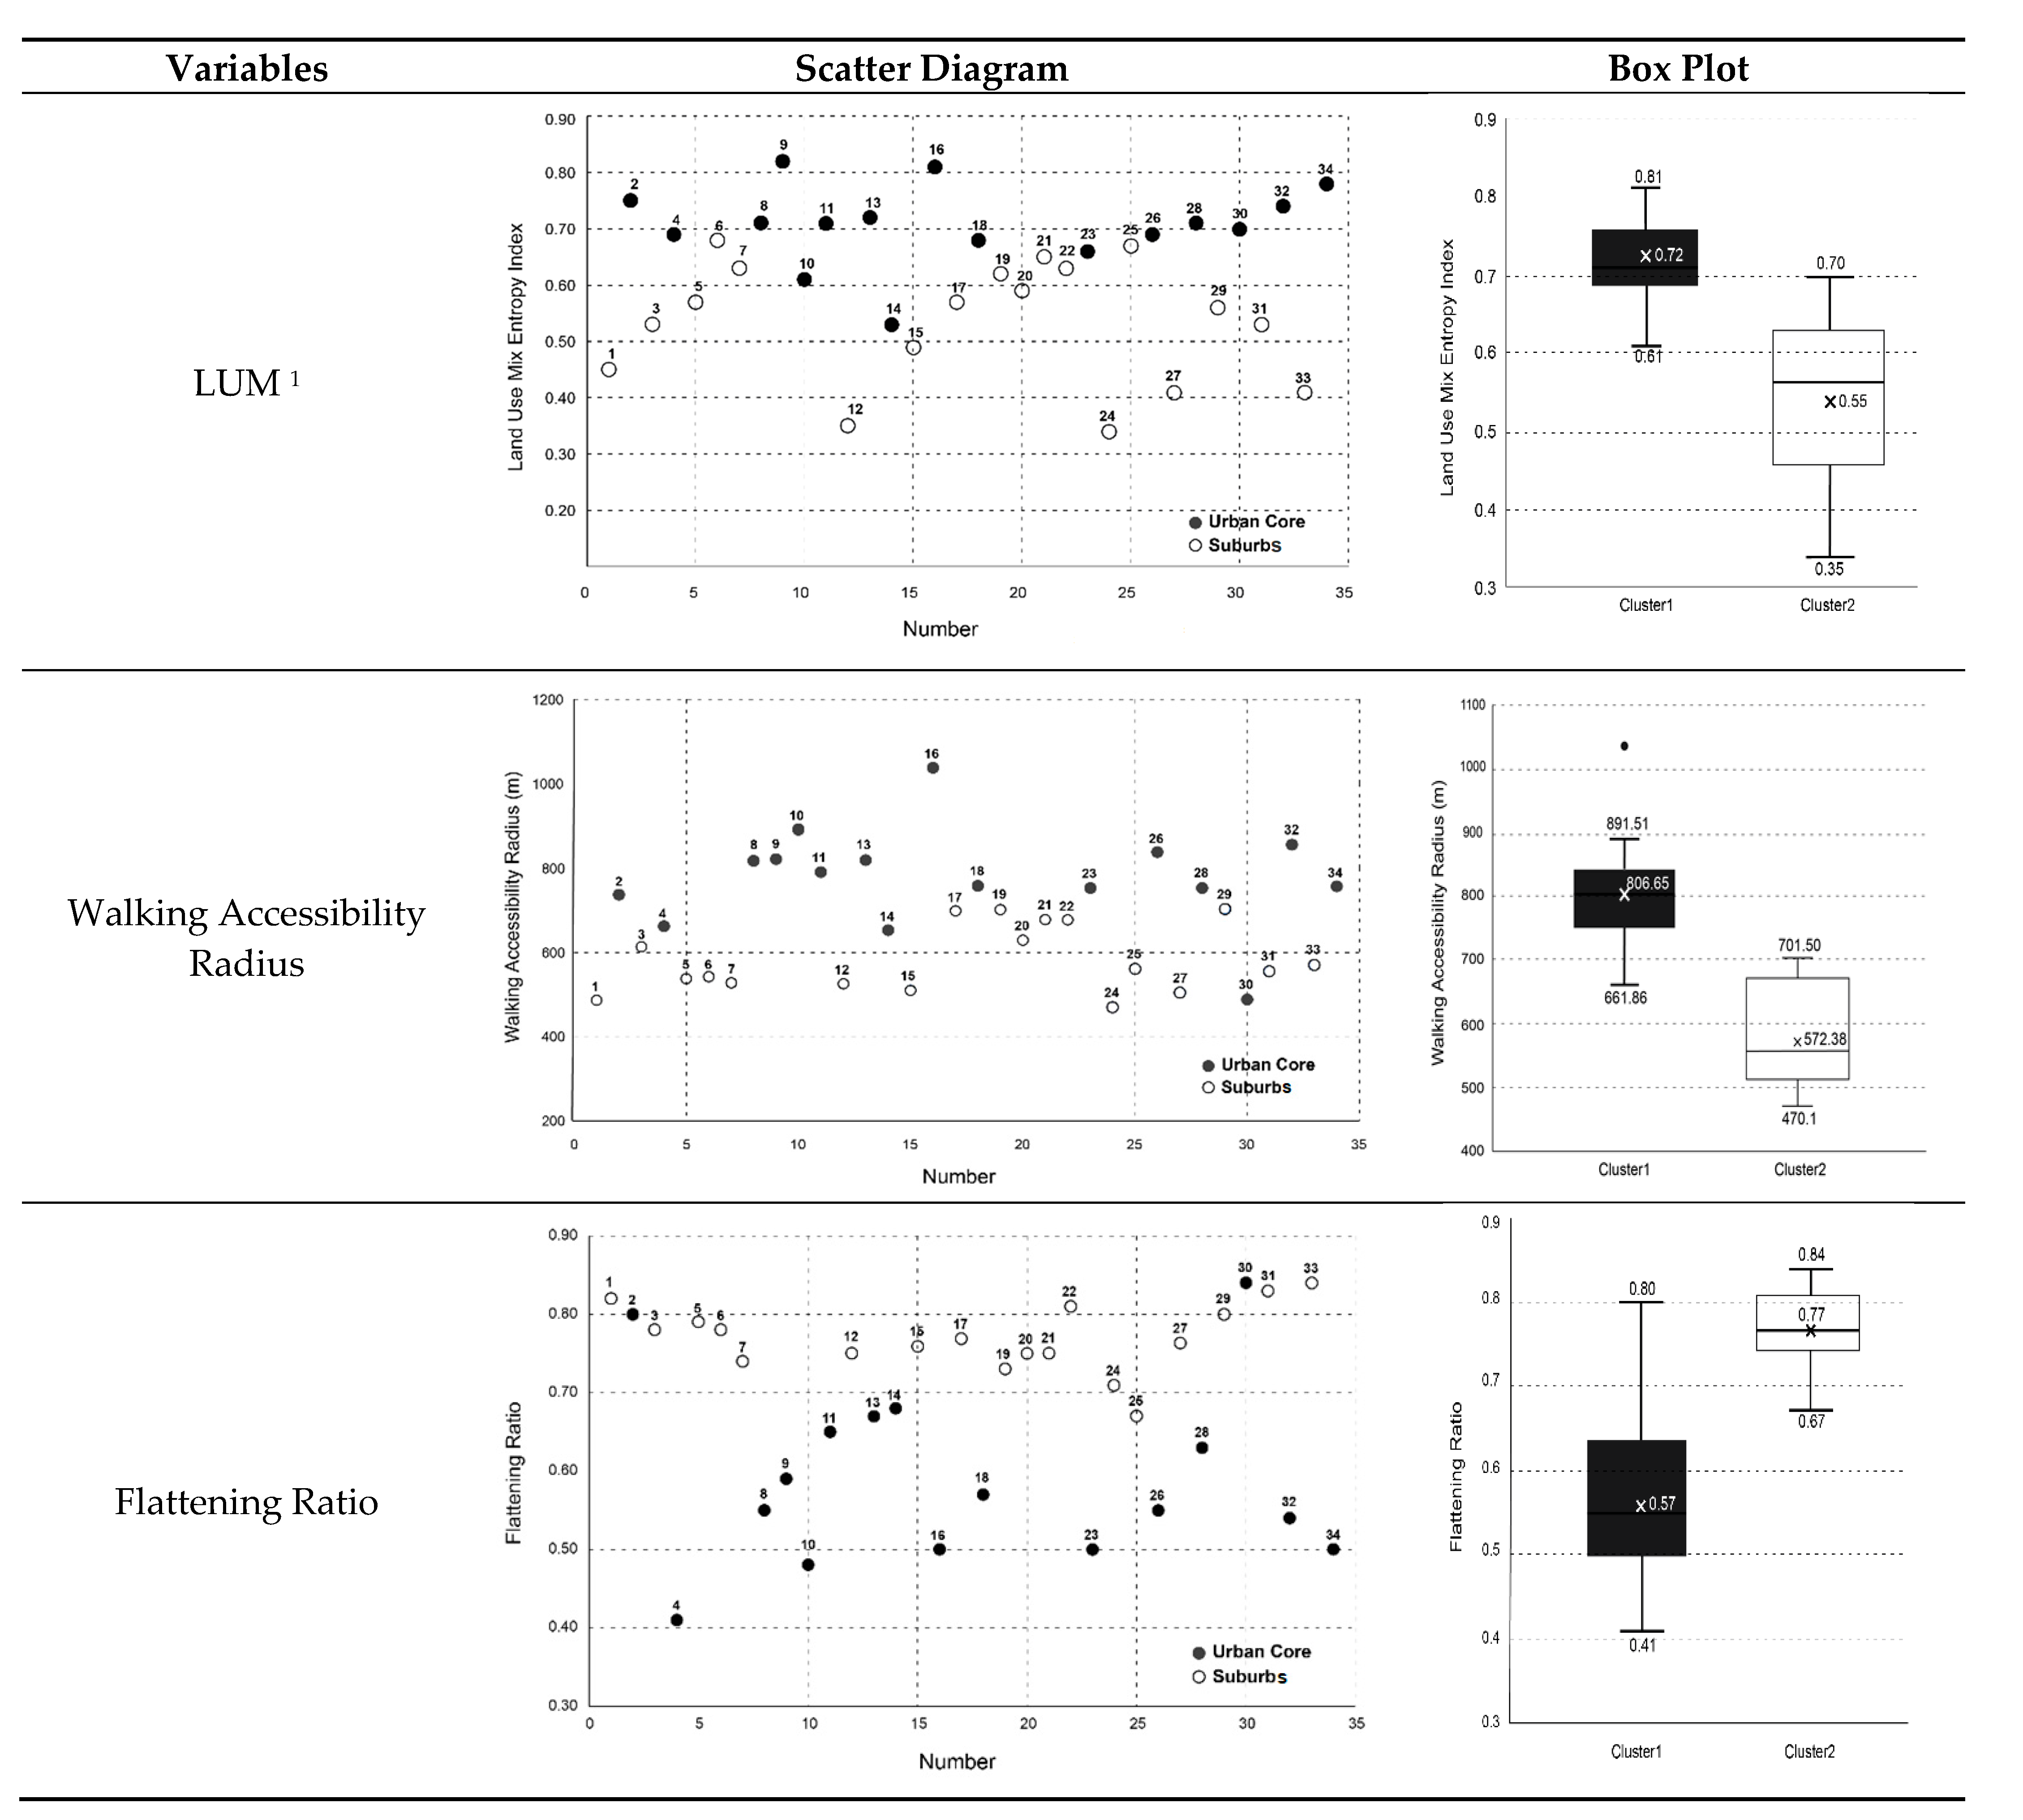
4.1. Results of Analyzing Station Area Categorization according to Locational Characteristics

Table 3 summarizes the results of K-means clustering with locational characteristics as the variables. Two clusters were derived: Cluster 1 comprising 14 station areas, and Cluster 2 comprising 20 station areas. The t-test revealed a statistically significant difference in all three locational characteristics, as shown in Table 4. Noteworthily, all station areas under Cluster 1 were located in urban cores, and most station areas under Cluster 2 were located in the suburbs, indicating the strong typicality of station areas depending on their location. More specifically, station areas categorized in Cluster 2 had a lower level of LUM and shorter walking accessibility radius per unit of time than station areas under Cluster 1. In contrast, the station areas in Cluster 2 tended to have a high flattening ratio. This indicates that while station areas in urban cores are close to a circular shape and form a mix of various uses with relatively broad areas of influence, those in the suburbs are close to an oval shape and form less mixed uses with relatively smaller areas of influence.
The patterns of each cluster according to the locational characteristics are shown in Figure 3. First, based on the LUM variables, the average LUM of Cluster 1 was 0.72, while that of Cluster 2 was 0.55, and this difference was statistically significant. Considering that each cluster has a similar character based on the station areas’ location in either urban cores or suburbs, the LUM of station areas located in urban cores is diverse, whereas that of station areas located in suburbs tends to be homogeneous. In particular, station areas with a high level of LUM were big provincial cities such as Busan, Daejeon, and Gwangju; these station areas had a high level of LUM for residential, commercial, and business uses. In contrast, most station areas located in the suburbs had a relatively high ratio of functions and uses when planning and developing suburban station areas in the future.
Second, there was a difference in the distribution of areas of influence through walking network analysis by cluster. The average radius of influence of station areas in Clusters 1 and 2 was 787 m and 580 m, respectively, with the difference between the two being statistically significant. Station areas in Cluster 2 showed consistent results with the 500–600 m influence areas set as station areas in many studies [11,13]. However, station areas in Cluster 1 proved that the radius of influence can be expanded to more than 800 m. In line with the arguments by Bertolini (1999) [20] and Lee and Song (2004) [21], for station areas located in urban cores with tightly or densely packed urban blocks, such as in the urban spatial structures of Korea or Europe, it might be more valid to set a larger radius of influence. Moreover, station areas located in the suburbs, as shown in Cluster 2, lacked walking accessibility as the road network was not as densely created as those in urban areas.
Third, the spatial form of the station areas varied between clusters. The average flattening ratio of station areas in Cluster 1 was 0.57, while that of station areas in Cluster 2 was 0.77. The closer the flattening ratio is to 0, the more a space is considered to resemble a perfect circle. The results show that station areas under Cluster 1 resembled a spatial form closer to a more compressed ellipse than did station areas under Cluster 2. This may be partially due to the topographical features of Korea, in which station areas located in the suburbs such as Pohang Station, Chuncheon Station, or Geoje Station, are adjacent to the mountains or waterfront.

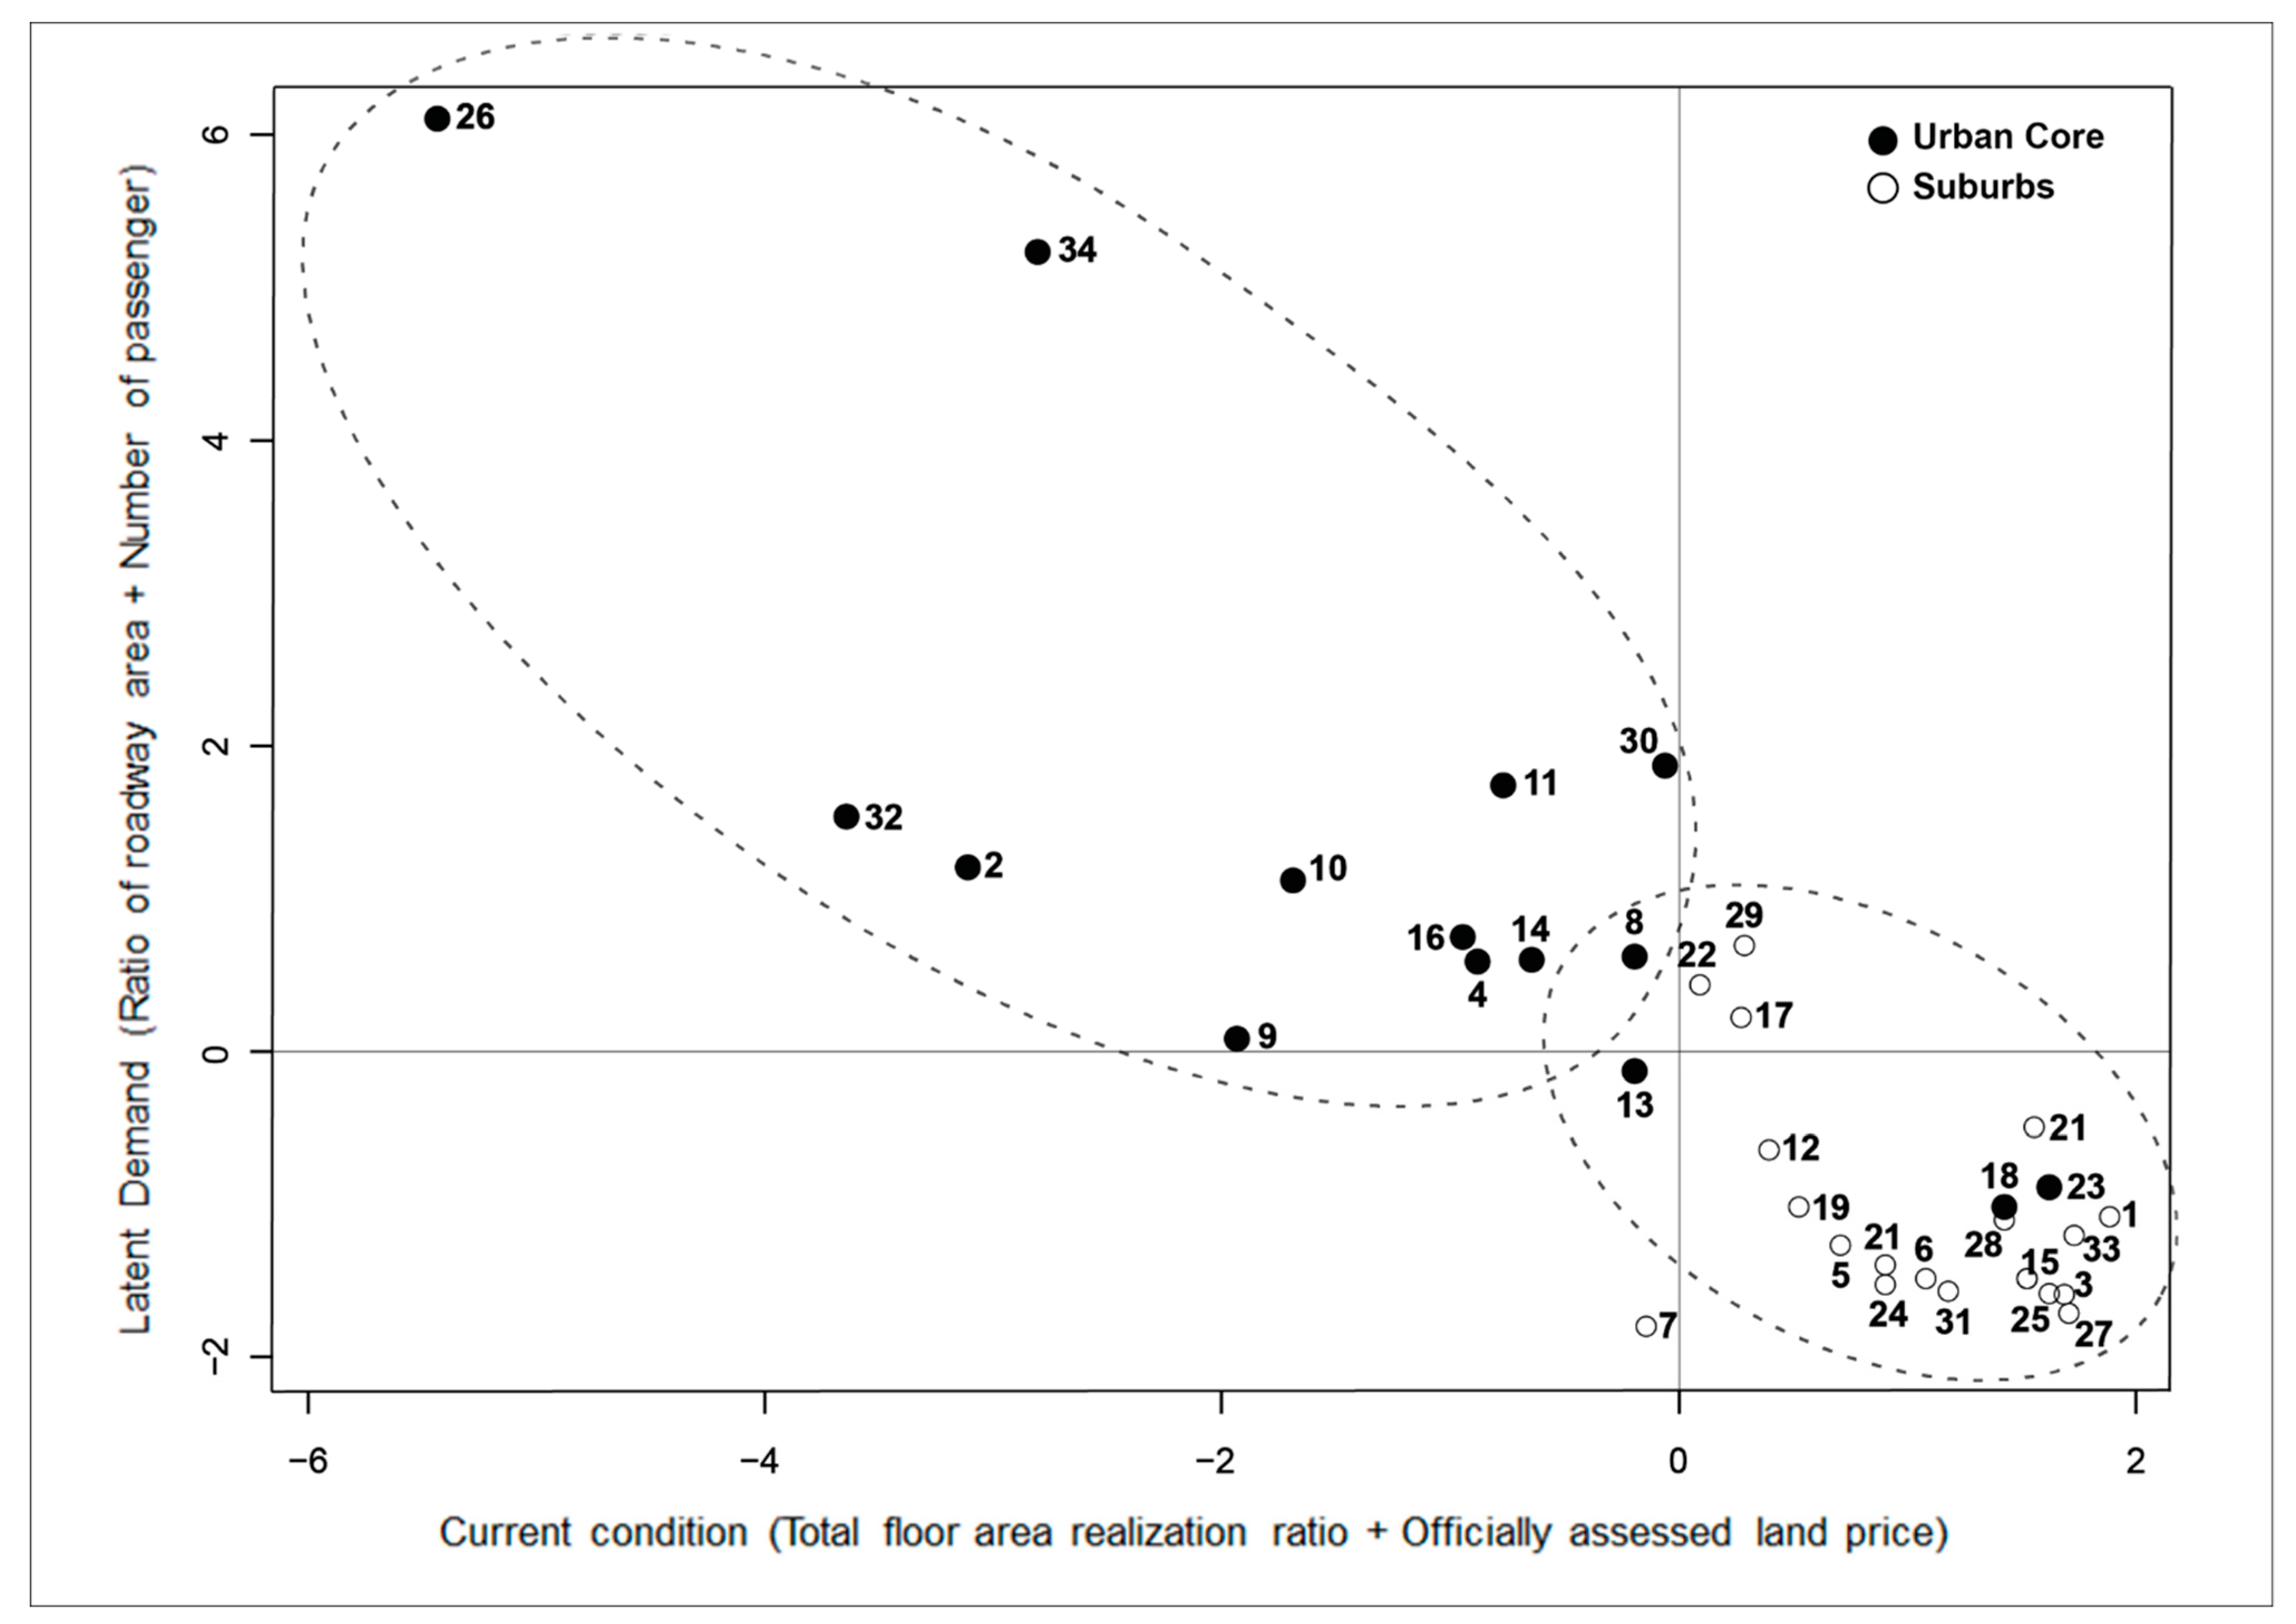
4.2. Results of Identifying the Significance of Station Area Types Classified by Locational Characteristics

This study also identified the significance of the types classified by the locational characteristics of station areas in planning and development. The analysis results proved that there is a difference in land use, transit accessibility, and spatial form depending on the type of station area. In terms of urban planning, reflecting this difference is sufficient to partially improve the existing approach; however, it is important to come up with clearer implications for each type to improve the development methods.
Therefore, this study identified whether the types classified by locational characteristics are still valid from the viewpoint of development, with a focus on a few key variables of development. Seo et al. (2018) [51] provided an analytical framework that revealed project tendency through expert group interviews with private developers and policy-making authorities using the parameters of current project status and future latent demand. The key indicators that determine the current project conditions in Korea include the total floor area realization ratio compared to the regulated total floor area and officially appraised land prices. This is because it is easy to carry forward the project in station areas with relatively low total floor area realization ratios and land prices due to large density changes from the development project as well as the low initial capital required [51]. Moreover, the key indicators to estimate the future latent demand are represented by the ridership of the station and the density of infrastructure such as roads. Since a considerable amount of the profit from station area development is reinvested in maintaining the infrastructure, the project feasibility can be improved by securing the infrastructure, and the estimated number of station area users is the most important factor that determines project feasibility. The judgment related to the effect of the station area development project based on these indicators is consistent with the results of previous studies investigating this phenomenon in Korea [15,38,52]. Therefore, this study used the total floor area realization ratio and officially appraised land prices as the indicators representing the current project status, and the ratio of roadway areas and the number of passengers as the indicators representing the future latent demand, and verified whether similar typological characteristics are found in the same station areas after standardization.
The results showed that there was a clear tendency between station areas located in urban cores and those located in the suburbs, as shown in Figure 4. More specifically, in terms of current project status, station areas located in urban cores showed higher total floor area realization ratios and officially appraised land prices than those located in the suburbs. This may be due to the constant increase in demand and land value in business and commercial districts and functions around railway stations during the process of the expansion of urban sprawl around railway stations in the past [1,7]. Thus, station areas located in the suburbs may seem relatively more favorable in terms of current project feasibility. Meanwhile, in terms of future latent demand, station areas located in urban cores showed a larger number of passengers and a higher density of infrastructure than those located in the suburbs. Therefore, in terms of future latent demand, station areas located in urban cores are relatively more favorable.
It is notable that Clusters 1 and 2, classified by locational characteristics of station areas, could be easily divided into urban cores and suburbs, respectively. This classification is also valid in the types of station area development considering project conditions and demand. Therefore, in the urban context of Korea, the typological classification of station areas into urban cores and suburbs can be applicable to locational characteristics as well as to planning and development conditions.

4.3. Discussion on a Differential Approach of the Station Area Type in Planning and Development

The above analysis results show several implications as follows. First, it may be difficult to adopt an approach similar to that of urban cores for the allocation of functions and uses when planning and developing station areas of the suburbs in the future. Because, in the urban context of Korea, station areas located in the suburbs are based on the premise of the formation of large-scale new satellite towns, and division of the land in large blocks. Therefore, it is better to maintain the spatial scope at a certain level, considering the function of railway stations in the process of planning and developing station areas in the suburbs. It is also necessary to consider designing the scope of planning and development of station areas in the suburbs in light of their expansion in a long rectangle shape, rather than recklessly setting it in a circular form, considering the surrounding topographical conditions. This is because in the case of railway station areas in the suburbs where pedestrians or the road network is not evenly formed, planning and developing the station area in a circular shape based on Euclid distance may be inefficient as it forms areas with weak accessibility.
In addition, even if the current business conditions are relatively unfavorable, station areas located in urban cores have a high future latent demand and can be developed more quickly if the regulations on building density are relaxed through incentives in terms of urban planning. Japan, which has a similar urban space context as Korea, has been applying this method for developing station areas in urban cores, such as those in Tokyo and Osaka, and showing outcomes in development [3,7]. Therefore, it may be effective to approach the planning and development of station areas located in urban cores by attracting private sector entities to make investments, while the public sector focuses on institutional support. In contrast, station areas located in the suburbs may have advantages in the current project conditions, but it may be difficult to attract investment from the private sector for these projects due to low future latent demand. Moreover, according to the results of the clustering analysis, there is a low possibility of expansion in these station areas in terms of LUM or infrastructure. Therefore, to encourage development in station areas located in the suburbs, it is necessary for the public sector to first make investments and improve land use with a focus on public functions; the effect of private investment can then be anticipated within a limited range. Especially, since the station area in the urban core has high potential demand in the future, the private sector should take the initiative to expand public facilities and public spaces that are insufficient in the urban core, while securing construction density and incentives for use in the public to secure business feasibility. On the other hand, in the case of station areas in the suburbs, the private sector does not have enough development feasibility to promote the project alone, so in the short term, it is necessary to jointly secure anchor facilities in combination with public projects. In addition, if demand expands in the future, a strategy to gradually expand the business from a long-term perspective is expected to be effective.

5. Conclusions

The goal of this study was to explore whether railway station areas can be categorized on a nationwide level based on the urban context of East Asian countries, including Korea, and whether categorization according to locational characteristics is still valid in planning and development conditions. This study contributes to the discussion on station areas in East Asia, especially Korea, where station areas are gaining importance with the expansion of high-speed rail networks. Furthermore, it contributes to setting the direction for the planning and development of station areas by investigating the typological characteristics of station areas in terms of locational characteristics such as land use, walking accessibility, and spatial form.
In summary, a clear pattern that can classify the major railway station areas in Korea into urban cores and suburbs was found for all three locational characteristics. Station areas located in urban cores formed relatively broader areas of influence and had a high level of LUM, while those located in the suburbs formed relatively smaller areas of influence and had a low level of LUM with a high ratio of residential use. There was also a statistically significant difference between urban cores and suburbs in the form of station areas. Moreover, both types showed a shape closer to an ellipse than a circle. This result shows that it is necessary to take a differential approach to the planning and development of station areas. Furthermore, the spatial location of urban cores and suburbs in the urban context may be considered to have a considerable effect on the function and influence of station areas.
Categorization according to the locational characteristics of station areas was found to be valid in terms of the project approach for development. The typological classification of urban cores and suburbs showed a statistically significant difference in terms of the current and future project conditions. Station areas located in urban cores had an advantage in future latent demand, whereas those located in the suburbs had an advantage in the present project conditions. These results imply that setting an effective policy direction for station area development in the future should involve attracting private investment combined with institutional support from the public sector for urban core station areas, attracting public investment, and securing optimum use for station areas in the suburbs. Above all, it is necessary to differentiate the planning and development strategies depending on the type of station area. For the station area in the urban core, it is effective for the private sector to lead planning and development by offsetting investment in public facilities that are insufficient with incentives such as density. In addition, for the station area in the suburbs, the private sector is effective to support public-led projects to secure anchor facilities first and expand demand and development areas in the long term.
This study also had a few limitations, which need to be addressed in future research. First, while this study focused on analyzing station areas on a nationwide level, the typological pattern may be different if the spatial scope is limited to the city level. Therefore, it is necessary to identify whether the typological classification of urban cores and suburbs is still valid for intercity units that have been a major geographical measure in studies related to station areas. Second, it is necessary to identify how the typological characteristics of station areas in the context of Asian countries, including Korea, are different from those of station areas in the US, Japan, and Europe. Such international comparative studies can contribute to improving the planning model for station areas, including TOD and typological diversification of station area development strategies. Finally, since this study reflects the specific context of an Asian country undergoing rapid expansion of high-speed railways and cities, further research must verify the impact of the development of high-speed railways and cities in association with the changes in station areas.

Author Contributions

M.S. designed this study, performed the analyses, and wrote the first draft; D.L. performed the analyses jointly and improved the methodological part. All authors have read and agreed to the published version of the manuscript.

Funding

This research was funded by a research grant entitled “The Revitalization of the Development Project and the Improvement of Legal System in the Station Area” from the Ministry of Land, Infrastructure, and Transport in Korea.

Institutional Review Board Statement

Not applicable.

Informed Consent Statement

Not applicable.

Data Availability Statement

The data will be made available upon request to the corresponding author.

Acknowledgments

This research is a part of a broader research entitled, “A Study on Facilitation of Urban Regeneration in Station Areas towards Energy Efficient Cities” to be published by the Korea Research Institute for Human Settlements at the end of 2019.

Conflicts of Interest

The authors declare no conflict of interest.

Appendix A

Cities and Counties Listed for Each of the Functional Urban Regions.
Table A1. Variable of the current project status and future latent demand of station areas.
Cluster TypeStation AreaCurrent Project StatusFuture Latent Demand
Total Floor Area Realization
(%)
Officially Appraised Land Price
( Thousand   Won   * / m 2 )
Ratio of Roadway Areas
(%)
Number of Passengers
(Millions/Year)
Cluster 1Busan18.1 496030.1 24.13
Cheonan21.7 156025.0 6.02
Daegu18.3 306019.5 5.41
Daejeon18.1 151023.6 19.54
DMC19.4 415023.1 17.38
Dongdaegu30.1 20808.9 25.65
Gangneung19.2 42021.1 3.46
Gwangju24.5 91029.8 0.43
Gyeongju11.5 8509.1 0.98
Mokpo13.8 3207.8 0.58
Seoul26.1 1121036.1 42.10
Suncheon12.5 3207.9 2.55
Wangsimni21.1 472029.3 31.02
Yongsan28.1 1310019.3 34.72
Cluster 2Andong11.5 7105.5 0.52
Changwon-Jungang8.9 2105.8 2.25
Cheonan-Asan9.4 103010.6 7.08
Chuncheon9.5 31012.8 1.78
Daegok7.1 31022.4 1.13
Donong11.5 201014.5 5.52
Geoje22.3 134026.8 1.19
Gimcheon9.3 3608.6 0.57
Gwangmyeong16.5 261012.0 10.06
Iksan10.6 124013.4 5.43
Jecheon16.8 2607.7 1.42
Jije10.1 32013.3 1.36
Kwangwoon Univ.19.6 196017.6 4.81
Osong8.6 6109.1 6.76
Pohang8.2 5106.1 2.62
Singyeongju8.1 1806.8 0.87
Susaek17.5 363018.6 1.35
Suseo16.1 783010.9 15.12
Ulsan8.5 4608.7 4.28
Wonju10.7 6206.2 1.36
* One thousand won is about 0.87 US dollars in 2019.

References

  1. Cervero, R.; Ferrell, C.; Murphy, S. Transit-oriented development and joint development in the United States: A literature review. In Transit Cooperative Research Program Research Results Digest; Transportation Research Board: Washington, DC, USA, 2002. [Google Scholar]
  2. Ren, T.; Dorina, P.; Sander, L.; Luca, B.; Dominic, S.; Erwin, K. Is transit-oriented development (TOD) an internationally transferable policy concept? Reg. Stud. 2018, 52, 1201–1213. [Google Scholar] [CrossRef] [Green Version]
  3. Zacharias, J.; Zhang, T.; Nakajima, N. Tokyo Station City: The railway station as urban place. Urban Des. Int. 2011, 16, 242–251. [Google Scholar] [CrossRef] [Green Version]
  4. Wangti, X.; Andrew, G.; Yingling, F.; Yongling, L. Transit-oriented development in China: Literature review and evaluation of TOD potential across 50 Chinese cities. J. Transp. Land Use 2017, 10, 743–762. [Google Scholar]
  5. Sung, H.; Choi, C. The link between metropolitan planning and transit-oriented development: An examination of the Rosario Plan in 1980 for Seoul, South Korea. Land Use Policy 2017, 63, 514–522. [Google Scholar] [CrossRef]
  6. Reconnecting America’s Center for Transit-Oriented Development. Station Area Planning: How to Make Great Transit-Oriented Places; Department of Transportation, USA: Washington, DC, USA, 2008; pp. 4–14. Available online: http://reconnectingamerica.org/assets/Uploads/tod202.pdf (accessed on 4 March 2021).
  7. Nikken Sekkei ISCD Study Team. Integrated Station-City Development. Archit. Urban 2013, 13, 64–69. [Google Scholar]
  8. Sohn, D.; Kim, J. An Analysis of the Relationship between the Morphological Characteristics of Transit Centers and Transit Riderships in Seoul Metropolitan Region. J. Archit. Inst. Korea Plan. Des. 2011, 27, 177–184. [Google Scholar]
  9. Park, S.; Sohn, D.; Lee, J. A Spatial Analysis of Transit Centers in Seoul Metropolitan Region for Developing Transit Oriented Urban Environments. J. Korean Soc. Civ. Eng. 2009, 29, 111–120. [Google Scholar]
  10. Lim, H. A Study on Transit-Oriented Development Method to Activate Transit Use for High Urban-Density Multi-Nucleated Seoul. J. Korean Soc. Transp. 2005, 23, 93–104. [Google Scholar]
  11. Cervero, R.; Kockelman, K. Travel demand and the 3Ds: Density, diversity, and design. Transp. Res. D Transp. Environ. 1997, 2, 199–219. [Google Scholar] [CrossRef]
  12. Ryan, S.; Frank, L.F. Pedestrian environments and transit ridership. J. Public Trans. 2009, 12, 39–57. [Google Scholar] [CrossRef] [Green Version]
  13. Debrezion, G.; Pels, E.; Rietveld, P. The impact of railway stations on residential and commercial property value: A meta-analysis. J. Real Estate Finan. Econ. 2007, 35, 161–180. [Google Scholar] [CrossRef] [Green Version]
  14. Lee, Y.S.; Sohn, D.W. A Relationship Analysis between Subway Transit Demand and Urban Spatial Characteristics in the Subway Station Area. J. Urban Des. Inst. Korea 2012, 13, 23–32. [Google Scholar]
  15. Kim, H.; Nam, J. The size of the station influence area in Seoul, Korea: Based on the survey of users of seven stations. Int. J. Urban Sci. 2013, 17, 331–349. [Google Scholar] [CrossRef]
  16. Tong, X.; Wang, Y.; Chan, E.H.; Zhou, Q. Correlation between transit-oriented development (TOD), land use catchment areas, and local environmental transformation. Sustainability 2018, 10, 4622. [Google Scholar] [CrossRef] [Green Version]
  17. O’Sullivan, S.; Morrall, J. Walking Distances to and from Light-Rail Transit Stations. J. Transp. Res. Board 1996, 1538, 19–26. [Google Scholar] [CrossRef]
  18. Kim, S.H.; Lee, C.M.; An, K.H. The influence of walking distance to transit stop on modal choice. J. Korea Plan. Assoc. 2001, 36, 297–307. [Google Scholar]
  19. Calthorpe, P. The Next American Metropolis: Ecology, Community, and the American Dream; Princeton Architectural Press: Toronto, ON, Canada, 1993. [Google Scholar]
  20. Bertolini, L. Spatial development patterns and public transport: The application of an analytical model in the Netherlands. Plan. Pract. Res. 1999, 14, 199–210. [Google Scholar] [CrossRef]
  21. Lee, J.Y.; Song, T.S. The analysis of the change of subway access area and subway user’s behaviors in the new town of the capital region. J. Korea Plan. Assoc. 2004, 39, 93–103. [Google Scholar]
  22. Choi, Y.; Kim, T.H.; Park, J.S. Development of selection model of subway station influence area (SIA) in Seoul city using chi-square automatic interaction detection (CHAID). J. Korean Soc. Railw. 2008, 11, 504–512. [Google Scholar]
  23. Givoni, M.; Rietveld, P. The access journey to the railway station and its role in passengers’ satisfaction with rail travel. Transp. Policy 2007, 14, 357–365. [Google Scholar] [CrossRef]
  24. Debrezion, G.; Pels, E.; Rietveld, P. Modelling the Joint Access Mode and Railway Station Choice. Transp. Res. Part E 2009, 45, 270–283. [Google Scholar] [CrossRef] [Green Version]
  25. Lee, J.Y.; Leem, Y.T. The establishment of B-TOD and setting up transit access distance by cycling choice. J. Korea Plan. Assoc. 2010, 45, 149–160. [Google Scholar]
  26. Dittmar, H.; Poticha, S. Defining transit-oriented development: The new regional building block. In The New Transit Town: Best Practices in Transit-Oriented Development; Island Press: Washington, DC, USA, 2004; pp. 19–40. [Google Scholar]
  27. Kim, S.Y.; Eom, S.Y.; Lee, M.H. A Study on Spatial Range of Seoul Subway Station Area on Characteristics of Land Use. J. Korea Plan. Assoc. 2013, 48, 23–37. [Google Scholar]
  28. Park, K.M.; Choi, C.K. Influence of Neighborhood Land Use on Residents’ Choices of Shopping and Leisure Facilities. J. Korea Plan. Assoc. 2012, 47, 249–263. [Google Scholar]
  29. Sung, H.; Lim, B.; Bessell, M.S.; Kim, J.S.; Hur, H.; Chun, M.Y.; Park, B.G. Sejong open cluster survey (SOS). 0. Target selection and data analysis. J. Korean Astron. Soc. 2013, 46, 103–123. [Google Scholar] [CrossRef] [Green Version]
  30. Jin, E.A.; Kim, D.Y.; Jin, J.I. The Effects of Mixed Land Use on Housing Price—Focused on the Apartment and General Housing Prices. J. Korea Plan. Assoc. 2016, 2011, 77–92. [Google Scholar] [CrossRef]
  31. Sung, H.; Kim, T. A Study on Categorizing Subway Station Areas in Seoul by Rail Use Pattern. J. Korean Soc. Transp. 2005, 23, 19–29. [Google Scholar]
  32. Ewing, R.; Cervero, R. Travel and the built environment: A meta-analysis. J. Am. Plann. Assoc. 2010, 76, 265–294. [Google Scholar] [CrossRef]
  33. Vale, D.S. Transit-oriented development, integration of land use and transport, and pedestrian accessibility: Combining node-place model with pedestrian shed ratio to evaluate and classify station areas in Lisbon. J. Transp. Geogr. 2015, 45, 70–80. [Google Scholar] [CrossRef]
  34. Berawi, M.A.; Saroji, G.; Iskandar, F.A.; Ibrahim, B.E.; Miraj, P.; Sari, M. Optimizing land use allocation of Transit-Oriented Development (TOD) to generate maximum ridership. Sustainability 2020, 12, 3798. [Google Scholar] [CrossRef]
  35. Oh, Y.T.; Kim, T.H.; Park, J.J.; Rho, J.H. An Empirical Analysis of Influencing Factors towards Public Transportation Demand Considering Land Use Type Seoul Subway Station Area in Seoul. J. Korean Soc. Civ. Eng. 2009, 29, 467–472. [Google Scholar]
  36. Lee, Y.S.; Choo, S.H.; Kang, J.M. Setting Spatial Ranges and Analysing Characteristics of the Adjacent Areas of Seoul Subway Stations. J. Korea Plan. Assoc. 2011, 46, 57–72. [Google Scholar]
  37. Lee, J.W.; Kim, H.Y.; Jun, C.M. Analysis of Physical Environmental Factors that Affect Pedestrian Volumes by Street Type. J. Urban Des. Inst. Korea 2015, 16, 123–140. [Google Scholar]
  38. Kang, J.; Shung, H. Temporal Reaction of House Price Based on the Distance from Subway Station since Its Operation: Focused on 10-year Experience after Opening of the Daejeon Urban Transit Line. J. Korea Plan. Assoc. 2019, 54, 54–66. [Google Scholar] [CrossRef]
  39. Lew, S.H.; Kang, J.M. A Study on the Influence Factors of Land Value by Urban Spatial Constitution. J. Korean Soc. Civ. Eng. 2012, 32, 61–69. [Google Scholar]
  40. Kim, S.H.; Kim, T.H.; Im, H.N.; Choi, C.G. Pedestrian Volume and Built Environmental Factors on Sales of Convenience Stores, Cosmetic Shops and Coffee Shops in Seoul. J. Korea Plan. Assoc. 2015, 50, 299–318. [Google Scholar] [CrossRef]
  41. Yun, N.Y.; Choi, C.G. Relationship between Pedestrian Volume and Pedestrian Environmental Factors on the Commercial Streets in Seoul. J. Korea Plan. Assoc. 2013, 48, 135–150. [Google Scholar]
  42. Im, H.N.; Lee, S.G.; Choi, C.G. Empirical Analysis of the Relationship between Land Use Mix and Pedestrian Volume in Seoul, Korea. J. Korea Plan. Assoc. 2016, 51, 21–38. [Google Scholar] [CrossRef]
  43. Sung, H.G. A Study on the Impacts of Residential Neighborhood Built Environment on Personal Health Indicators— Focused on the Planning Elements of Transit-Oriented Development. J. Korea Plan. Assoc. 2011, 46, 235–251. [Google Scholar]
  44. Lim, H.N. Developments and Useful Verification of Land Use Mix (LUM) Entropy Index on the Effect of Pedestrian Volume. Ph.D. Thesis, Hanyang University, Seoul, Korea, 2015. [Google Scholar]
  45. Ghorbanzadeh, M.; Effati, M.; Gilanifar, M.; Ozguven, E.E. Subway station site selection using GIS-based multi-criteria decision-making: A case study in a developing country. Comput. Res. Prog. Appl. Sci. Eng. 2020, 6, 60–69. [Google Scholar]
  46. Chen, Y.; Yan, C.; Patel, M.B. Network Analysis Subtleties in ICU Structures and Outcomes. Am. J. Respir. Crit. Care Med. 2020, 202, 1606–1607. [Google Scholar] [CrossRef]
  47. Jones, C. Geographical Information System and Computer Cartography; Pearson Education Limited: London, UK, 1997. [Google Scholar]
  48. Ma, S.I.; Kim, H.S. Accessibility to Welfare Facilities for the Aged through GIS Network Analysis: Focused on Inland Areas in Incheon. J. Korea Plan. Assoc. 2011, 70, 61–75. [Google Scholar]
  49. Cho, J.H.; Baik, E.Y. Geo-spatial Analysis of the Seoul Subway Station Areas Using the Haversine Distance and the Azimuth Angle Formulas. J. Inf. Technol. Serv. 2018, 17, 139–150. [Google Scholar]
  50. Nam, J.; Cho, H.; Ahn, S.; Kang, H. A Study on the Types of Station Area for Smart Shrinkage. Gyeonggi Res. Inst. 2020, 139–149. [Google Scholar]
  51. Seo, M.; Bae, U.; Park, D.; Lee, W.; Seo, J.; Kim, G.; Lee, S.; Ahn, S.; Kim, J. A study on Facilitation of Urban Regeneration in Station Areas towards Energy Efficient Cities. Korea Res. Inst. Hum. Settl. 2019, 64–66. Available online: https://library.krihs.re.kr/dl_image2/IMG/07/000000030556/SERVICE/000000030556_01.PDF (accessed on 4 March 2021).
  52. Choi, S.B.; Lee, J.H. The Structural Relationship between Area Activation and Complex Development of Railway Station Area. J. Korea Contents Assoc. 2016, 16, 594–603. [Google Scholar] [CrossRef]
Figure 1. Study flow diagram.
Sustainability 13 04310 g001
Figure 2. Major railway station areas in Korea and their location types. Railways and nodes were obtained using the 2019 data from railway GISDB(Geographic Information System Data Base) provided by The Korea Transport Institute, Korea Transport Database (KTDB). The administrative boundary is obtained using the 2019 data of administrative districts provided by the Ministry of Land, Infrastructure, and Transport.
Sustainability 13 04310 g002
Figure 3. Cluster patterns according to locational characteristics. 1 LUM: land use mix.
Sustainability 13 04310 g003
Figure 4. Results of analyzing the current project status and future latent demand of station areas. Statistics for each variable used in the analysis are presented in Appendix A.
Sustainability 13 04310 g004
Table 1. Studies on station area scope setting methods and spatial boundaries.
Areas (Radius)ResearchesContents (Method)
less than
500 m
O’Sullivan and Morrall (1996) [17];
Kim et al. (2001) [18]
Surveying light-rail users at transfer stations
(the points where the selection of walking as a mode sharply decreased)
500 m
–1 km
Calthorpe (1993) [19];
Ryan and Frank (2009) [12];
Bertolini (1999) [20]; Lee and Song (2004) [21]; Choi et al. (2008) [22]
Average walking distance
(normatively stipulating walkable distance from a station/distance reached by 90% walking trips)
more than
1 km
Givoni and Rietveld (2007) [23];
Debrezion et al. (2009) [24];
Lee and Leem (2010) [25]
Calculating railway service areas for bicycles
(modeling the joint access mode and railway station choice)
Table 2. Names of each railway station area and their location types (n = 34).
Location TypeStation Area
Urban center2 (Busan); 4 (Cheonan); 8 (Daegu); 9 (Daejeon); 10 (DMC, Digital Media City);
11 (Dongdaegu); 13 (Gangneung); 14 (Geoje); 16 (Gwangju); 18 (Gyeongju); 23 (Mokpo);
26 (Seoul); 28 (Suncheon); 30 (Suseo); 32 (Wangsimni); 34 (Yongsan)
Suburb1 (Andong); 3 (Changwon-Jungang); 5 (Cheonan-Asan); 6 (Chuncheon);
7 (Daegok); 12 (Donong); 15 (Gimcheon); 17 (Gwangmyeong); 19 (Iksan);
20 (Jecheon); 21 (Jije); 22 (Kwangwoon University); 24 (Osong); 25 (Pohang);
27 (Singyeongju); 29 (Susaek); 31 (Ulsan); 33 (Wonju)
Note: Railway station areas are listed in alphabetical order.
Table 3. Clustering analysis results (N = 34).
TypeStation AreaN
2 (Busan); 4 (Cheonan); 8 (Daegu); 9 (Daejeon); 10 (DMC); 11 (Dongdaegu);
13 (Gangneung); 16 (Gwangju); 18 (Gyeongju); 23 (Mokpo);
26 (Seoul); 28 (Suncheon); 32 (Wangsimni); 34 (Yongsan)
14
Cluster 1
Cluster 21 (Andong); 3 (Changwon-Jungang); 5 (Cheonan-Asan); 6 (Chuncheon);20
7 (Daegok); 12 (Donong); 14 (Geoje); 15 (Gimcheon); 17 (Gwangmyeong); 19 (Iksan);
20 (Jecheon); 21 (Jije); 22 (Kwangwoon University); 24 (Osong); 25 (Pohang);
27 (Singyeongju); 29 (Susaek); 30 (Suseo); 31 (Ulsan); 33 (Wonju)
Note: Railway station areas are listed in alphabetical order.
Table 4. T-test results.
Variables.ClusterObs.1MeanSD 2TP
LUM 3114−0.960.79−7.960.000 *
2200.670.39
Walking Accessibility Radius1140.950.637.730.000 *
220−0.660.57
Flattening Ratio1140.820.455.510.000 *
220−0.570.86
* p < 0.01, all variables were standardized for analysis. 1 Obs.: observations, 2 SD: standard deviation, 3 LUM: land use mix.
Publisher’s Note: MDPI stays neutral with regard to jurisdictional claims in published maps and institutional affiliations.

