Article

Open-Source Carbon Footprint Estimator: Development and University Declination

1
Civil Engineering and Mechanics Research Institute (GeM), Ecole Centrale de Nantes, UMR CNRS 6183, 1 Rue de la Noë, 44300 Nantes, France
2
Association Bilan Carbone (ABC), 41 Rue Beauregard, 75002 Paris, France
3
Datagir, Agence de la Transition Ecologique, 20, Avenue du Grésillé, BP 90406, CEDEX 01, 49004 Angers, France
*
Author to whom correspondence should be addressed.
Sustainability 2021, 13(8), 4315; https://doi.org/10.3390/su13084315
Submission received: 15 March 2021 / Revised: 8 April 2021 / Accepted: 8 April 2021 / Published: 13 April 2021
(This article belongs to the Special Issue Carbon Footprint and Sustainability Assessment)

Abstract

:
Anthropogenic greenhouse gas emissions need to be cut to limit climate change. Thus, universities, in the same way as citizens and companies, are starting to raise awareness about this issue and to take action to reduce their carbon footprint. Centrale Nantes, a French “Grande école”, initiated a low carbon transition with the calculation of the 2018 carbon footprint of the university. This report presents an individual carbon footprint estimator developed within the scope of the university, based on the new open-source French national simulator called “Nos Gestes Climat” proposed by ABC (Association Bilan Carbone (Association for the implementation of Carbon footprint assessment)) and ADEME (French Environment and Energy Management Agency). Development context and important features of the national version are described. Then, to meet university user’s expectations, feedback from a panel of testers has been collected in order to guide the declination development and promote good practices ensuring user engagement. The transparency of the data model, the accurate explanations, the variety of actions have been found to be key success factors for the development and the adoption of such a simulator. Results also suggested that users are keen to involve themselves in the university initiative to reach carbon neutrality.

1. Introduction

In recent years, the influence of anthropogenic greenhouse gas (GHG) emissions on global climate change has been demonstrated [1,2]. In the report “Global Warming of 1.5 °C” [3], the Intergovernmental Panel on Climate Change (IPCC) defines scenarios for limiting GHG emissions to keep global warming below 2 °C or even 1.5 °C. The 2 °C scenario would require a 25% reduction in emissions by 2030 compared to 2010 and the achievement of carbon neutrality by 2070. For the 1.5 °C scenario, the reduction is greater, still by 45% by 2030 compared to 2010, making it possible to reach carbon neutrality in 2050. Both mitigation and adaptation to climate change are technological, economic, social and institutional challenges that will become increasingly difficult to overcome without prompt action to reduce GHG emissions. In France, these objectives of reduction have been adapted since 2015 via the “Stratégie Nationale Bas-Carbone” [National Low-Carbon Strategy] (SNBC) [4] which sets the objectives for reducing GHG emissions by 2050: between 1990 and 2030, a 40% reduction of emissions is expected. By 2050, it will have to be divided by six. The SNBC also defines these objectives by sector of activity (building, industry, transport, energy, agriculture, waste).
Carbon becomes a relevant performance indicator for firms, organizations and educational institutions engaged in sustainable development [5,6]. The first step is the establishment of an accurate carbon footprint. According to the standard ISO 14064-1:2018 [7] which set standardized rules for carbon accounting, emissions of greenhouse gas can be classified in three categories:
According to the ADEME and ABC methodology [8], it can be divided into three main areas:
  • Scope 1 includes direct emissions (fuel combustion, carbon sinks)
  • Scope 2 covers indirect energy-related emissions (heating network, electricity)
  • Scope 3 includes all the other indirect emissions (purchases of products and services, travel, food...). These emissions usually represent 80% of the GHG emissions of a company [9].
Nowadays, current French regulations for carbon accounting are about to shift to new terminology in order to tackle the lack of exhaustiveness (i.e., taking into account only scope 1 and 2) and to comply with the last revision of the ISO norm 14064-1:2018 [7]. Thus, carbon accounting will have to address the significant emissions of an activity (regardless of scopes).
The second step is the development of a specific low carbon strategy. For organizations and particularly higher education institutions, shaping and then following a low carbon trajectory is a necessity, as they have the responsibility to lead by example [10]. Students are the decision-makers of tomorrow. Even though it will not be sufficient for reaching the global and long-term mitigation goal, changes need to occur at the individual level [11]. A recent paper [12] states that even with a population made of “climate heroes” (i.e., implementation of both individual change and individual investment from everyone) the individual scale can only induce a reduction of 45%. In a more conservative approach, it is expected a 25% reduction of greenhouse gas induce by the individual. Therefore, raising awareness among the students and the faculty as well as the staff is nonetheless a key factor.
Carbon footprints in universities have been studied by several authors [13,14,15,16,17,18]. Methodological inconsistencies, especially regarding the organizational boundaries selected for the analysis, have been reported as a major difficulty. Discrepancies appear between institutions according to Scope 3 emissions sources that are accounted for in their carbon footprints. One of the current challenges is to find a universal method to give access to an easy-estimation for university representatives and enable results comparison among higher education [19]. Either for educational content, campus awareness operations, policy development or technologies assessment, carbon footprint results are used by university stakeholders. Some initiatives are starting to be thought and developed to monitor universities’ sustainability building on carbon footprint calculation [20,21,22,23].
Online carbon emission estimator, which can be defined as the combination of a user-interface and data model, enables individuals to self-estimate carbon footprints in order to monitor emissions reduction strategies. The aim is to give the opportunity to the user to self-manage one’s behavior by proposing actions of emissions reductions. A lot of estimators have been developed for both public and private use to measure either individual or collective carbon footprints. It is also an opportunity higher education has to seize. According to Lin (2017) [24], the acquisition of the information is particularly efficient when information suits users’ daily activities. Academic context is especially relevant for this kind of application so carbon footprint calculators are useful tools for students to understand climate changes and raise environmental conscience [25].
Even though some literature is available on personal carbon footprint calculators within everyday life scope, no studies have reported on specific tools applied to professional and academic context. The present paper attempts to initiate and monitor the reduction of GHG emissions induced by the Centrale Nantes University proposing an open-source carbon footprint calculator related to the professional field to quickly measure carbon impact and encourage action within universities. The French national simulator “Nos Gestes Climat” (Our climate actions) (NGC) [26] has been chosen as a solid working base for a university declination made by students for university users. Data model is based on the 2018 Centrale Nantes carbon footprint and the perimeter has been restricted to the university activities. The aim of the calculator is to let the users identify the most important emissions sources related to their professional activities. Significant attention has been paid to user commitment and adoption [27,28]. A challenge, discussed in this paper, is to avoid user guilt and increase positive impact by proposing social comparisons and environmental advice [29,30].

2. Methods

2.1. Source Version

2.1.1. A National Carbon Footprint Estimator

“Nos Gestes Climat” is an open-source calculator, created in 2020 by ABC, a French non-governmental organization (NGO) dedicated to improve carbon accounting and facilitate the low carbon transition, and Datagir, a free public service supported by ADEME and the beta.gouv.fr incubator. It was inspired by a tool developed by the public agency ADEME in 2010, and more recently by another tool, MicMac, developed by the NGO Avenir Climatique (Climate of the Future).
NGC was built with ADEME and Avenir Climatique as advisors to tackle two main issues: the lack of easily accessible and reliable information on carbon footprint and the transformation of awareness into efficient actions. Climate and low carbon transition are more and more discussed by policymakers, companies, NGOs, schools and families. Until recently, climate information, especially emission factors, were publicly available through an online database maintained by ADEME, but very difficult to use by non-experts [31]. NGC aims to disseminate this data and make it accessible. However, knowing about emissions is not enough. In order to facilitate climate action, NGC also offers relevant actions adapted to the carbon footprint of the user and designed to reach the carbon neutrality in 2050.
Because of geographic limitations and the GHG emission factors used, the calculator is dedicated to the French population. To induce change at a larger scale, beyond the French boundaries, the educational purpose of NGC and its data model have to be adapted. The open-source methodology serves this purpose. It is very likely that the carbon footprint and its distribution will be significantly different in countries where the carbon intensity of the electric mix is much higher for instance. Thus, having specific emissions factors is key to adapt successfully NGC. The European Clim’Foot project aims to help countries developing their own emission factors database [32].

2.1.2. Technical Features

“Nos Gestes Climat” is a fork (a copy of the code then modified to serve different purposes) of the futur.eco project [33], itself a fork of mon-entreprise.fr (my-company.fr) [34], a calculator actively developed by the French public services incubator beta.gouv.fr and the French social taxes collector organism URSSAF. This chain of forks demonstrates the interest in open-source code for public services, where work done on one expert domain (social contributions) helps to bootstrap work on very different subjects. This success pushed the mon-entreprise team to externalize the projects’ core into a TypeScript library, publi.codes, which enables users to write models of public interest in a new French programming language and to expose these algorithms as well as simple forms to gather the needed input directly in Web pages. Model developed with public.codes can be fully documented in the Web app itself. In NGC, users can easily access calculation details.
NGC is separated into two code repositories, the user interface [35] and the data model expressed in yaml files [36]. The model repository is where contribution happens, mainly by the Datagir and ABC teams, but also any individual that finds a bug, has a question or wants to merge a better local model. The use of publi.codes ensures that updating the model automatically updates the end-user forms without any additional developer work. Since the first deployment of the project in June 2020, more than 500 issues have been answered or prioritized on the GitHub repository, which also contains NGC’s roadmap and detailed release notes.
The user interface itself is coded in Javascript/Typescript, and it is quickly evolving to help the user understand his footprint in an interactive, mobile-first and graphical way, as well as share his results easily on social networks to engage in conversations in order to shift from individual-level changes to social debates and hopefully policy-level action.
The form’s user experience follows the design principle that there should be only one question on the screen at time (even in desktop mode), instead of the traditional collection of 10+ inputs on a single page. Questions are grouped by consumption categories that also lets the user pause between two question rounds. An interactive graph shows the progress and the intermediate results of the simulation, given that the simulation starts with default answers for every question that accounts for the average French citizen. Numerical inputs can sometimes be hard to grasp, hence clickable suggestions are presented next to the input to help the user figure out orders of magnitudes (e.g., for the hours of long plane trips, “Paris ↔ New-York”, “Paris ↔ Nice”).

2.1.3. Advantages of the Tool for University Declination

Because of the limited amount of time dedicated to the student project associated with the University declination (6 months) and the quickly growing community around the national calculator, joining the developer community of NGC appeared as the best option. The source version has thus been forked as it was faster to implement and deploy than starting from scratch. The final open-source version is available on GitHub platform [37,38] so that future developments can be done within other organizations. The second strength of the calculator is the user-engagement approach. According to Mulrow (2019) [30], user involvement is a key to make sure carbon footprint estimation through a calculator is impactful on user habits. Characteristics like timeliness of the simulation, interface and specific-user advice have been carefully thought out in the declination.

2.2. Design of the University Declination

2.2.1. Carbon Footprint of Centrale Nantes

Centrale Nantes is a French “Grande école” (Technical University) founded in 1919 in Nantes, with 2400 students and 500 faculty and staff. The “Net-zero emissions” project was initiated in Centrale Nantes in order to estimate carbon footprint and foster individual and collective action towards lower emissions of GHG in all University activities. This project materializes the engineering school’s commitment to sustainable development and social responsibility.
In 2019 and 2020, students from “Net-zero emissions” project established scopes 1, 2 and 3 carbon footprints of Centrale Nantes. Calculation methods are based on quantitative data collected from different university services (general, financial, international mobility). For carbon emissions calculation, GHG emission factors were picked up from ADEME (French Environment and Energy Management Agency) GHG factors database [31]. The data model Bilan Carbone Campus® [Carbon footprint Campus] developed by Avenir Climatique and REFEDD (French students’ network for sustainable development) provided a useful method to adapt the national NGC calculator to university issues. It is a declination of the Bilan Carbone® model developed by ADEME [8] and contains GHG emission factors, which mainly reflect French conditions. It offered the ability to calculate specific activities GHG emissions related to university emission sources. For transportation and food, surveys were conducted. A questionnaire containing 22 question items was used for the transportation survey and 547 answers were collected. A questionnaire containing 14 question items was used for the food survey and 462 answers were collected.

2.2.2. Restricted Perimeter and User Profiles

Because of data access reasons, the perimeter was restricted to university-related activity emissions for scopes 1, 2 and 3. Personal-life decisions were not taken into account, only professional life was considered. As an example, a student trip from the university to their hometown was not accounted for in the estimation. For food-related emissions, only the five lunches were considered.
The major challenge was to manage differences between the users of the university. The aim was to separate people according to their building and facilities use and on-campus presence. Therefore, the choice was made to assign a specific part of the individual carbon footprint to each profile category named “Profile”. This part is considered as “fixed”: a user cannot have a direct influence on it as it is calculated on a pro-rata basis. For instance, the energy consumption of a building is shared between its users over its depreciation period.

2.2.3. Simulation Saving Add-On

To enrich the national version of NGC and enable future data analysis, the declination was designed with a saving functionality. On a voluntary basis, users can choose to anonymously send their data from the simulation to our database. Data is sent in a JSON format including the total of carbon footprint and the list of answers to the questions answered by the user. Benefits are twofold: contributing to statistical model and ensuring rigorous application during simulation and ensure the accuracy of the estimation. Figure 1.

2.3. Tests Strategy

In order to get regular and useful feedback during the development of the calculator, a panel of testers representative of the university population had been involved during the development stage. The idea was to reproduce this repartition in a group of users, to approach the actual expectations. To recruit this panel, an email had been sent to every on-campus user, and messages were posted on various social media pages dedicated to the project (especially to reach students), with a link to an online form, where they were presented what they would be asked to do. Expected user panel members were asked to commit for the one-month test period. Finally, the consumer panel was composed of 37 persons distributed as shown in Figure 2.
The role of the panel was to provide feedback on the calculator to make sure it would suit users of the university and meet their expectations. For every version developed, workshops and focus-groups were organized and testers were asked to fill a form with questions concerning understanding, calculation, question contents, bugs and issues. Three different versions of the calculator were submitted to the testers. The first and second versions were meant to help the development team to understand the expectations of the users. The third version was the latest on which new features were added to make sure feedback would help to identify issues before final deployment. The whole work realized for and with the panel of testers was composed of the following steps exposed below:
  • Recruitment of the panel via emails and posts on social network
  • Invitation on a messaging server
  • First version of the simulator, one-week feedback period
  • Correction of issues and implementation of new features
  • Second version, two-week feedback period
  • Focus-groups
  • Correction of issues and implementation of new features
  • Third version, two-week feedback period
  • Deployment

3. Results and Discussion

3.1. National Version

NGC national version provides a carbon footprint calculation based on six detailed input categories: food, transportation, housing, various consumption, public service and digital. During the simulation, the user visualizes his/her results in real-time until he/she reaches the end-view with a recap panel (Figure 3). The Figure 3 as well as other calculator screenshots contain text translated from French. However, English version of both national and university declination have not been released yet.
By default, the overall carbon footprint given by NGC is 11 tCO2eq. It corresponds to the averaged carbon footprint of a French individual. Default values are set in the data model initially.
As illustrated in Figure 3, emissions of a French individual are mainly driven by three items: food, transportation and housing. Eating habits contribute to one-quarter of the carbon footprint (2.8 tCO2eq), as it is essentially linked to the consumption of meat and more specifically of red meat. Another quarter of the carbon footprint is related to transportation (2.8 tCO2eq). A majority of the emission in this category is due to the use of cars and planes. Housing also represents approximately one-quarter of the carbon footprint (2.5 tCO2eq) but it can be much more significant for accommodations that rely on gas or heating oil. The consumption of goods represents 1.8 tCO2eq but can widely change because the calculation relies on a ratio model. NGC also takes into account 1.1 tCO2eq which represent the emissions of the public services. Each individual carbon footprint is impacted in the same way as there is no approximation to know which part an individual is actually using (roads, justice, schools, etc.). Finally, another 220 kg of CO2eq represents the digital carbon footprint. It takes into account a smartphone, a laptop and few hours a day of surfing the net.
Moreover, the final panel of NGC offers to the user information about the long-term objective of mitigation: reaching a carbon footprint of 2 tCO2eq [3,39]. The tab “Comment ça?” (What does it mean?) directs the users to a webpage that provides context and explanation. Finally, the button named “Passer à l’action” (take action) suggests a wide range of relevant actions, adapted to the carbon footprint of the user and designed to reach the carbon neutrality in 2050. This part is to be developed in 2021.
From the final version deployed in November 2020 until March 2021, the simulator accounted for more than 300,000 user connections. Moreover, website statistics about the number of clicks on the help-button of the questions show that the most difficult category for the user is the food section. It indicates that food is the category users are the most interested in and it suggests that care has to be taken for the related explanation.

3.2. Implementation of the University Declination

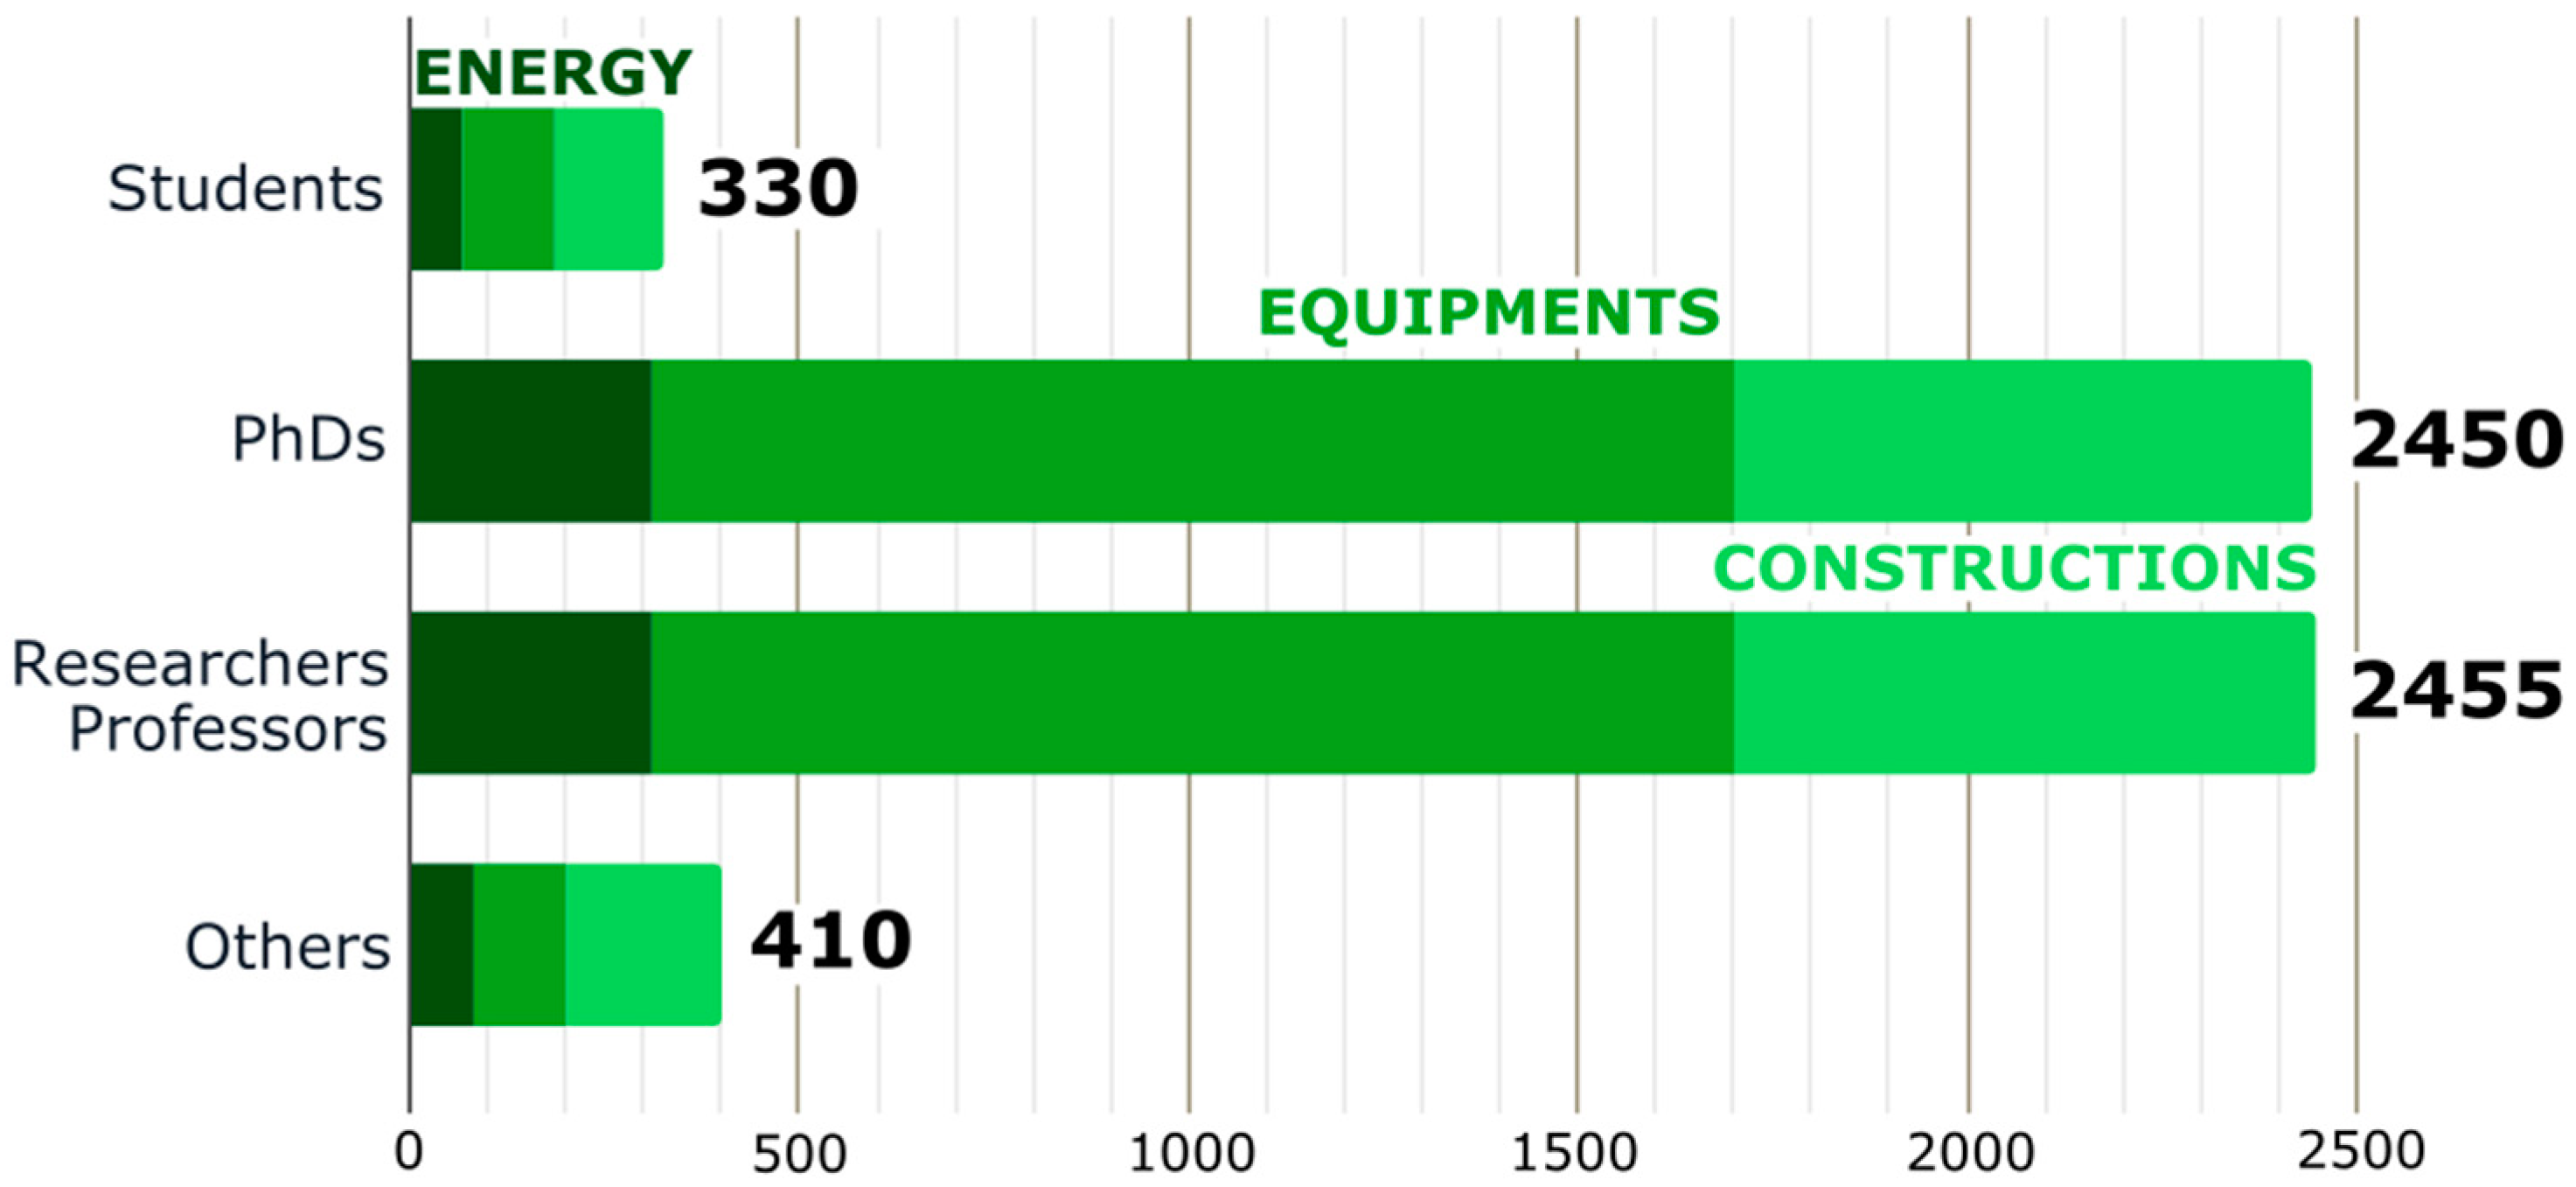
3.2.1. Initial User Profile-Related Questions

In 2018, the overall carbon footprint study of Centrale Nantes has led to the following carbon footprint: 5683 tCO2eq for all 3 scopes. Figure 4 illustrates the carbon footprint estimation according to the main activities of the University. Scopes 1 and 2 emissions have been found to be limited (less than 6% of the overall result). In contrast, scope 3 gathers three of the most carbon-intensive activities:
  • Student and staff trips (2060 tCO2eq, 36% of the overall result)
  • Products and Services (1200 tCO2eq, 21%)
  • Students and staff lunches (830 tCO2eq, 15%)
Clearly, some emission sources are directly linked to personal choices every individual makes within his professional life or academic progress. Therefore, actions on significant emissions sources have to be encouraged within the university: food, transportation, products and services.
Based on the engineering school population and emission sources highlighted in the 2018 carbon footprint, four profiles have been selected. Figure 5 illustrates emissions distribution according to users’ profile. A specific part relative to user function includes the emissions shared by all users: purchases, equipment, building energy. Transportation, food and a portion of remainders are directly connected to individual choices made within university activity perimeter. In any case, it appears to be essential to reduce the “professional part” of each user’s carbon footprint, in order to comply with the Paris Agreement requirements, by reducing emissions linked to personal choices.
Figure 6 illustrates the division of the carbon footprint into per-profile averages. It gathers two types of emissions. Some are common to all users, and includes GHG emissions linked to waste management and vegetation; the second varies depending on the profile. For instance, students only use buildings with classrooms whereas academic staff work in larger laboratories whose facilities accounts for a large section. This choice implies an approximation on the individual calculation but preserves the fluency of the simulation. User’s attention is drawn to transportation and food emissions on which individual action has a direct impact.
For the first version deployed in Centrale Nantes, the question related to profile is asked at the beginning and the provisional result section appears at the bottom of questions section (Figure 7a). Results are updated in real time according to user answers so they can visualize directly his/her impact. Default results are calculated according to averaged values for a typical user in Centrale Nantes. As a result of feedback and focus-groups analysis, profile contribution does not appear directly in the real-time simulation results but only on the result end-view.
In a future release, the aim is to refine this part and be able to offer personal advice to help people reduce their “profile” emissions. For laboratory users, the main section is due to the purchase, use and maintenance of the machines. Thus, an interface has been created (Figure 7b) to allow people to choose their research institutes in Centrale Nantes. The deployment will be done once research institutes will be able to provide their carbon footprint using dedicated tools [40].

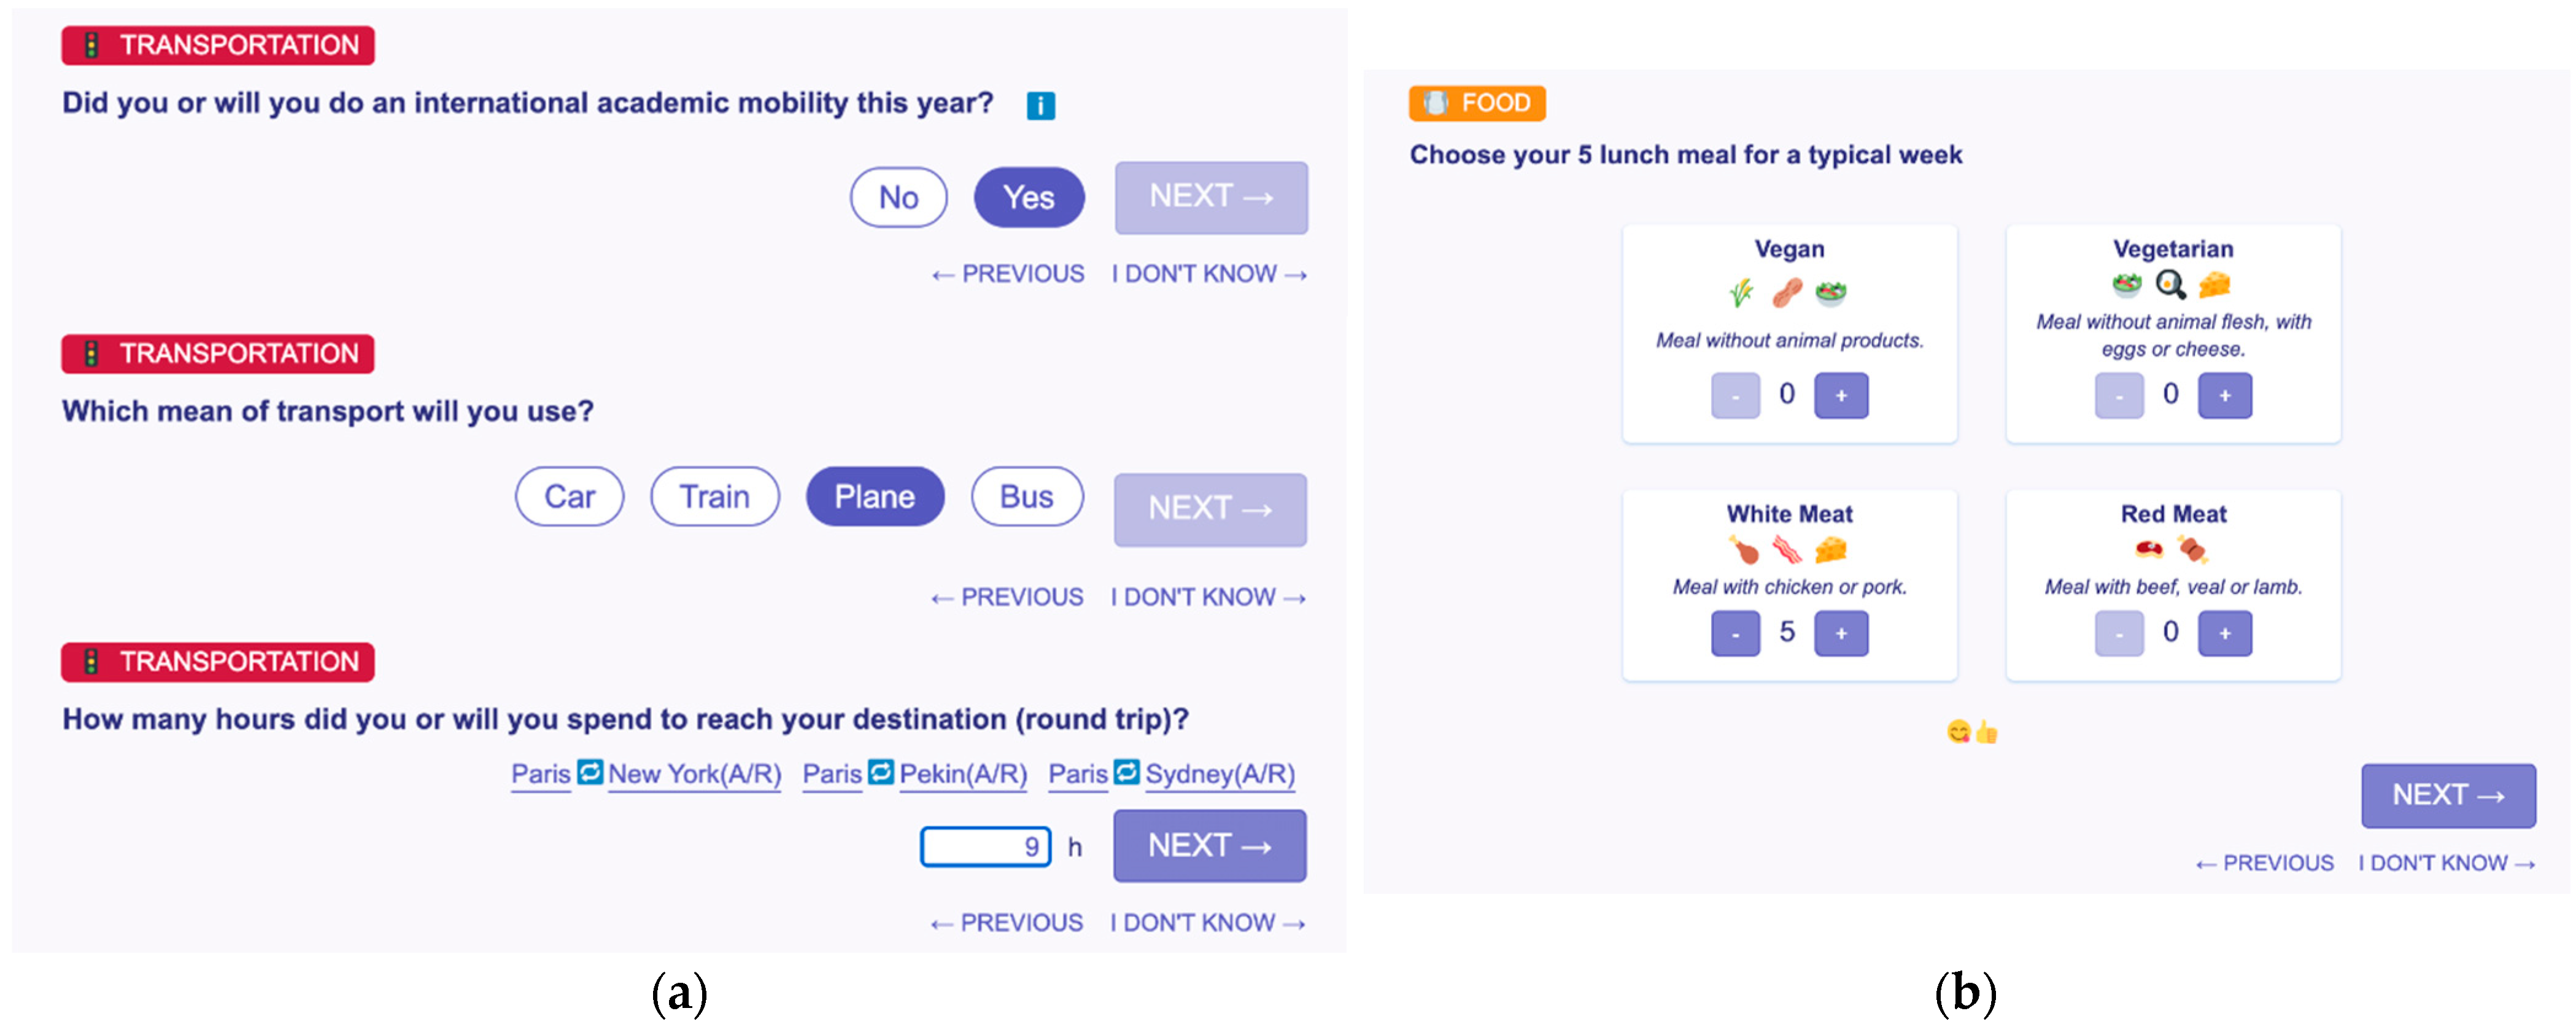
3.2.2. User-Specific Intermediate Questions

Recommendations of Mulrow et al. (2019) [30] have been followed to adapt and create input categories to the university declination on the basis of the national version. The order of questions was chosen to prioritize categories from the highest impact to the lowest as illustrated in Figure 8 for students. The aim is to offer a fast but relevant simulation. The average time to reach the end-view is around 7 min. It is a bit longer when the user pays attention to explanations and details. Transportation is the category users are the most interested in [30]. Special attention has been given to the precision of the questions of this category as it is also highly significant in determining one’s total carbon footprint, particularly in professional and academic life. Some questions from the simulator are illustrated in Figure 9a. Second category is food: users are asked to detail their five lunches choosing between vegan, vegetarian, white and red meat meals. The input panel is simplified as illustrated in Figure 9b to allow the user to report a typical work week lunch repartition. Beverage dispenser consumption is also considered here, more for perceived impact than for significant carbon impact. Specific to university activities, the student associative life is included and calculated in the simulation using a student specific question dedicated to the selection of the associations they are involved in (with a similar interface as the laboratory selection). This section is available and accurate in the calculator today thanks to the involvement of association members in their carbon footprint estimation. Finally, the impact of digital activities, a popular but little-known topic, is covered. The CoViD19 pandemic brought digital tools in the front line for studies. Even if the impact on the individual carbon footprint is low, it raises awareness about this more and more debated subject. GHG emission factors due to live conferencing or emails were taken from recent studies from the Shift Project [41] or Greenspector [42,43].

3.2.3. Typical Result and Advice on Reducing Carbon Emissions

When someone reaches the end of the simulation (it usually takes about ten minutes), the result view of the Figure 10a or Figure 11a appears. The first information, at the top, is the total of GHG emissions, which includes the “profile” part excluded in the provisional result so far. As reported by several studies, social comparison interface enables to promote calculator adoption [25,30]. A subdivision displays averaged users result, within perimeter, found in the 2018 carbon footprint study of Centrale Nantes to offer the possibility of comparing their own result to others. The final chart of GHG emissions is visible. The user has the opportunity to go deeper in the model by clicking on the chart and browsing the content of calculations. On this page, an information modal is also visible after three seconds to suggest users to share their results for statistical studies.
The main purpose of such a calculator is encouraging actions. Therefore, results are paired with actionable advice for lowering emissions. Based on user’s input, advice is quantified and ranked. Figure 10b or Figure 11b displays actions proposed regarding the result associated with international mobility transportation and food habits. In the situation of the Figure 10b, the user estimated to 9 h the time spent in the plane to join his destination. A relevant advice could be reducing his carbon footprint choosing the train instead of the plane.
Focus-groups led to identify actions expected by users to be quantified and proposed. Some suggestions were linked to the profile emissions specifically. They are collective actions and are out of the perimeter for now but they could be included in a future deployment.
Some users were also frustrated by the lack of advice associated with their own simulation. As suggested by Lin et al. (2017) [24], social networking interface could be implemented to encourage users with a higher low carbon attitude for instance, to share their carbon reduction experiences.

4. Conclusions

In this study, an individual carbon footprint estimator dedicated to University has been developed and tested. This tool, developed within the scope of Centrale Nantes, a French technical university, is based on the new open-source French national simulator called “Nos Gestes Climat” developed by ABC and ADEME. The following main conclusions can be drawn:
  • Professional carbon footprint estimators can be built to complement personal estimators. To do so, scopes and activities must be clearly identified and separated.
  • User-specific questions depending on user category (e.g., student, professor, staff) help increasing the ergonomics and the tool adoption. These elements are expected to increase the tool efficiency in triggering behavioral evolutions towards more sustainable practices.
  • Offering quantified advice to take action depending on the user’s habits is particularly relevant as it helps developing a deeper understanding of climate impacts and its relationships to the user professional and academic activities.
  • Open-source code availability and multi-agent collaborations are key success factors in developing sustainability initiatives. It enables the approach outlined in this study to be replicated in other higher education institutions.
Some perspectives can be given based on this work. Because of the difficulty to select model boundaries and enable comparison with other university results, the saving add-on could be further developed to display real-time analysis results on the end-view. A particular attention could be paid to the possibility to create several perimeters selecting questions to be included in one perimeter or another in order to extract custom results.
Users’ simulation responses and feedback will lead future work. The objective is to evaluate the user’s attitude changes regarding awareness raised by the calculator. Future deployment could include personal tracking of simulations through time.

Author Contributions

Conceptualization, C.A. and B.H.; methodology, C.A., B.B. and Q.G.; software, C.A. and M.T.; validation, B.H., Q.G. and E.R.; formal analysis, C.A., B.H. and M.T.; investigation, C.A. and B.B.; resources, B.H. and E.R.; data curation, C.A., B.H. and M.T.; writing—original draft preparation, C.A., B.H., B.B. and M.T.; writing—review and editing, Q.G. and E.R.; visualization, C.A.; supervision, B.H. and E.R.; project administration, E.R.; funding acquisition, Q.G. and E.R. All authors have read and agreed to the published version of the manuscript.

Funding

This research has been supported by the French ministry for the Ecological Transition (“Nos Gestes Climat” national version). The APC were partly funded by Ecole Centrale de Nantes.

Institutional Review Board Statement

Not applicable.

Informed Consent Statement

Informed consent was obtained from all subjects involved in the study.

Data Availability Statement

Nos GEStes Climat-ECN is available online [44] and source code can be downloaded from GitHub platform [37,38].

Acknowledgments

The authors acknowledge the fruitful discussions with “Nos Gestes Climat” users and the University declination panel of testers. C.A, B.H. and E.R. would like to thank the Sustainable Development Commission of the Ecole Centrale de Nantes.

Conflicts of Interest

The authors declare no conflict of interest.

References

  1. Wiedmann, T.; Minx, J. A Definition of ‘Carbon Footprint’. Ecol. Econ. Res. Trends 2008, 1, 11. [Google Scholar]
  2. Mancini, M.S.; Galli, A.; Niccolucci, V.; Lin, D.; Bastianoni, S.; Wackernagel, M.; Marchettini, N. Ecological Footprint: Refining the Carbon Footprint Calculation. Ecol. Indic. 2016, 61, 390–403. [Google Scholar] [CrossRef]
  3. IPCC Global Warming of 1.5 °C. Available online: https://www.ipcc.ch/sr15/chapter/spm/ (accessed on 8 March 2021).
  4. Energy Transition for Green Growth Stratégie Nationale Bas Carbone [National Low-Carbon Strategy]. Available online: https://www.ecologie.gouv.fr/sites/default/files/SNBC_SPM_Eng_Final.pdf (accessed on 8 March 2021).
  5. Čuček, L.; Klemeš, J.J.; Kravanja, Z. A Review of Footprint Analysis Tools for Monitoring Impacts on Sustainability. J. Clean. Prod. 2012, 34, 9–20. [Google Scholar] [CrossRef]
  6. Kitzes, J.; Peller, A.; Goldfinger, S.; Wackernagel, M. Current Methods for Calculating National Ecological Footprint Accounts. Sci. Environ. Sustain. Soc. 2007, 4, 9. [Google Scholar]
  7. International Organization for Standardization (ISO) Greenhouse Gases (Standard No. 14064-1). Available online: https://www.iso.org/standard/66453.html (accessed on 12 March 2021).
  8. Association Bilan Carbone; ADEME (The French Environment and Energy Management Agency) Methodology Guide—Version 8—Accounting Principles and Objectives. Available online: https://www.associationbilancarbone.fr/wp-content/uploads/2018/03/guide-methodologique-en-v2.pdf (accessed on 7 March 2021).
  9. Association Bilan Carbone; ADEME (The French Environment and Energy Management Agency) Réduire Les Émissions de Gaz à Effet de Serre Tout Au Long de La Chaîne de La Valeur de Votre Activité (Reduce Greenhouse Gas Emissions throughout the Value Chain of Your Activity). Available online: https://www.associationbilancarbone.fr/wp-content/uploads/2017/07/guide-pratique-scope-3.pdf (accessed on 12 March 2021).
  10. Robinson, O.; Kemp, S.; Williams, I. Carbon Management at Universities: A Reality Check. J. Clean. Prod. 2015, 106, 109–118. [Google Scholar] [CrossRef]
  11. Gifford, R. Psychology’s Essential Role in Alleviating the Impacts of Climate Change. Can. Psychol. Psychol. Can. 2008, 49, 273–280. [Google Scholar] [CrossRef]
  12. Carbone 4 Faire Sa Part? (Do Your Part?). Available online: http://www.carbone4.com/wp-content/uploads/2019/06/Publication-Carbone-4-Faire-sa-part-pouvoir-responsabilite-climat.pdf (accessed on 12 March 2021).
  13. Alvarez, S.; Blanquer, M.; Rubio, A. Carbon Footprint Using the Compound Method Based on Financial Accounts. The Case of the School of Forestry Engineering, Technical University of Madrid. J. Clean. Prod. 2014, 66, 224–232. [Google Scholar] [CrossRef]
  14. Yañez, P.; Sinha, A.; Vásquez, M. Carbon Footprint Estimation in a University Campus: Evaluation and Insights. Sustainability 2019, 12, 181. [Google Scholar] [CrossRef] [Green Version]
  15. Clabeaux, R.; Carbajales-Dale, M.; Ladner, D.; Walker, T. Assessing the Carbon Footprint of a University Campus Using a Life Cycle Assessment Approach. J. Clean. Prod. 2020, 273, 122600. [Google Scholar] [CrossRef]
  16. Larsen, H.N.; Pettersen, J.; Solli, C.; Hertwich, E.G. Investigating the Carbon Footprint of a University-The Case of NTNU. J. Clean. Prod. 2013, 48, 39–47. [Google Scholar] [CrossRef]
  17. Gómez, N.; Cadarso, M.-Á.; Monsalve, F. Carbon Footprint of a University in a Multiregional Model: The Case of the University of Castilla-La Mancha. J. Clean. Prod. 2016, 138, 119–130. [Google Scholar] [CrossRef]
  18. Bekaroo, G.; Bokhoree, C.; Ramsamy, P.; Moedeen, W. Investigating Personal Carbon Emissions of Employees of Higher Education Institutions: Insights from Mauritius. J. Clean. Prod. 2019, 209, 581–594. [Google Scholar] [CrossRef]
  19. Robinson, O.J. Towards a Universal Carbon Footprint Standard: A Case Study of Carbon Management at Universities. J. Clean. Prod. 2018, 172, 4435–4455. [Google Scholar] [CrossRef]
  20. Dolf, M.; Teehan, P. Reducing the Carbon Footprint of Spectator and Team Travel at the University of British Columbia’s Varsity Sports Events. Sport Manag. Rev. 2015, 18, 244–255. [Google Scholar] [CrossRef]
  21. Lambrechts, W.; Van Liedekerke, L. Using Ecological Footprint Analysis in Higher Education: Campus Operations, Policy Development and Educational Purposes. Ecol. Indic. 2014, 45, 402–406. [Google Scholar] [CrossRef] [Green Version]
  22. Townsend, J.; Barrett, J. Exploring the Applications of Carbon Footprinting towards Sustainability at a UK University: Reporting and Decision Making. J. Clean. Prod. 2015, 107, 164–176. [Google Scholar] [CrossRef]
  23. Lozano, R.; Young, W. Assessing Sustainability in University Curricula: Exploring the Influence of Student Numbers and Course Credits. J. Clean. Prod. 2013, 49, 134–141. [Google Scholar] [CrossRef]
  24. Lin, S. Identify Predictors of University Students’ Continuance Intention to Use Online Carbon Footprint Calculator. Behav. Inf. Technol. 2017, 36, 294–311. [Google Scholar] [CrossRef]
  25. Edstrand, E. Making the Invisible Visible: How Students Make Use of Carbon Footprint Calculator in Environmental Education. Learn. Media Technol. 2016, 41, 416–436. [Google Scholar] [CrossRef]
  26. Datagir; Association Bilan Carbone “Nos GEStes Climat” Calculator. Available online: https://nosgestesclimat.fr (accessed on 1 April 2021).
  27. Li, X.; Tan, H.; Rackes, A. Carbon Footprint Analysis of Student Behavior for a Sustainable University Campus in China. J. Clean. Prod. 2015, 106, 97–108. [Google Scholar] [CrossRef]
  28. Chao, Y.-L. Predicting People’s Environmental Behaviour: Theory of Planned Behaviour and Model of Responsible Environmental Behaviour. Environ. Educ. Res. 2012, 18, 437–461. [Google Scholar] [CrossRef]
  29. Mallett, R.K.; Melchiori, K.J.; Strickroth, T. Self-Confrontation via a Carbon Footprint Calculator Increases Guilt and Support for a Proenvironmental Group. Ecopsychology 2013, 5, 9–16. [Google Scholar] [CrossRef]
  30. Mulrow, J.; Machaj, K.; Deanes, J.; Derrible, S. The State of Carbon Footprint Calculators: An Evaluation of Calculator Design and User Interaction Features. Sustain. Prod. Consum. 2019, 18, 33–40. [Google Scholar] [CrossRef]
  31. ADEME (The French Environment and Energy Management Agency) Resource Centre for Greenhouse Gas Accounting. Available online: https://www.bilans-ges.ademe.fr/en/ (accessed on 8 March 2021).
  32. Clim’Foot Clim’Foot Database. Available online: https://www.climfoot-project.eu/en/overview-0 (accessed on 12 March 2021).
  33. Beta.gouv.fr Futur.Eco (GitHub Repository). Available online: https://github.com/laem/futureco (accessed on 1 April 2021).
  34. Beta.gouv.fr Mon-Entreprise.Fr (GitHub Repository). Available online: https://github.com/betagouv/mon-entreprise (accessed on 1 April 2021).
  35. Datagir Nosgestesclimat-Site (GitHub Repository). Available online: https://github.com/datagir/nosgestesclimat-site (accessed on 1 April 2021).
  36. Datagir Nosgestesclimat (GitHub Repository). Available online: https://github.com/datagir/nosgestesclimat (accessed on 1 April 2021).
  37. Ecole Centrale Nantes; Auger, C. Nosgestesclimat-Site-ECN (GitHub Repository). Available online: https://github.com/SustainabilityCN/nosgestesclimat-site-ECN (accessed on 1 April 2021).
  38. Ecole Centrale Nantes; Auger, C. Nosgestesclimat-Model-ECN (GitHub Repository). Available online: https://github.com/SustainabilityCN/nosgestesclimat-model-ECN (accessed on 1 April 2021).
  39. Energy Transition for Green Growth L’empreinte Carbone Des Français Reste Stable (The Carbon Footprint of the French Remains Stable). Available online: https://www.statistiques.developpement-durable.gouv.fr/sites/default/files/2020-01/datalab-essentiel-204-l-empreinte-carbone-des-francais-reste-%20stable-janvier2020.pdf (accessed on 12 March 2021).
  40. Mariette, J.; Blanchard, O.; Berné, O.; Ben-Ari, T. An Open-Source Tool to Assess the Carbon Footprint of Research. Sci. Commun. Educ. 2021. [Google Scholar] [CrossRef]
  41. The Shift Project “LEAN ICT”-Towars Digital Sobriety. Available online: https://theshiftproject.org/wp-content/uploads/2019/03/Lean-ICT-Report_The-Shift-Project_2019.pdf (accessed on 7 March 2021).
  42. Greenspector; Derudder, K. L’impact Environnemental Des Moteurs de Recherches. Available online: https://greenspector.com/fr/moteurs-de-recherches/ (accessed on 7 March 2021).
  43. Greenspector; Leboucq, T. Quelle Application Mobile de Visioconférence Pour Réduire Votre Impact? Available online: https://greenspector.com/fr/quelle-application-mobile-de-visioconference-pour-reduire-votre-impact/ (accessed on 7 March 2021).
  44. Ecole Centrale Nantes. Centrale Nantes “Nos GEStes Climat” Calculator. Available online: https://ngc-ecn.netlify.app (accessed on 1 April 2021).
Figure 1. Simulator usage diagram.
Sustainability 13 04315 g001
Figure 2. User distribution within panel of testers.
Sustainability 13 04315 g002
Figure 3. Averaged overall carbon footprint results for a typical French individual (text in the figure is translated from French).
Sustainability 13 04315 g003
Figure 4. Overall carbon footprint results of Centrale Nantes (yellow bars represent uncertainty of measurement [8]).
Sustainability 13 04315 g004
Figure 5. Average carbon footprint per user in Centrale Nantes for four typical users in 2018 (tCO2eq).
Sustainability 13 04315 g005
Figure 6. Carbon footprint details for user specific-part in Centrale Nantes for four typical users in 2018 (kgCO2eq).
Sustainability 13 04315 g006
Figure 7. Initial questions of the simulator: (a) profile question, and (b) laboratory selection interface (text in the figure is translated from French).
Sustainability 13 04315 g007
Figure 8. Cumulated impact on the individual carbon footprint relatively to the number of questions answered during a student simulation.
Sustainability 13 04315 g008
Figure 9. Typical intermediate questions of the simulator: (a) questions related to international mobility, and (b) lunch selection panel (Text in the figure is translated from French).
Sustainability 13 04315 g009
Figure 10. Simulator results section for a student carbon footprint estimation: (a) results details, comparison with Centrale Nantes users average, results chart including profile section, and (b) associated advice to reduce individual carbon footprint (Text in the figure is translated from French).
Sustainability 13 04315 g010
Figure 11. Simulator results section for a researcher carbon footprint estimation: (a) results details, comparison with Centrale Nantes users average, results chart including profile section, and (b) associated advice to reduce individual carbon footprint. Use the train instead of the plane for short business trips/Opt for eco-driving (text in the figure is translated from French).
Sustainability 13 04315 g011
Publisher’s Note: MDPI stays neutral with regard to jurisdictional claims in published maps and institutional affiliations.

