1. Introduction
In the era of globalization, a close link between university and industry with commitment towards community and corporate social responsibility (CSR) is an important driver to create long-term opportunities for sustainable development. The 2030 agenda of United Nations for Sustainable Development speaks unequivocally the role of education for peace and prosperity of mankind and the planet for an enduring present and future [
1]. The targets to achieve Goal 4: Quality Education have culminated into initiatives of practitioners, educators, and other stakeholders to empower youth in accessing technical, vocational, and tertiary education without a gender bias through the acquisition of knowledge and skills in a lifelong learning environment [
2]. Education for sustainable development (ESD) is treated as the means to achieve sustainability transformation through developing competencies of people, educators, and organizations within a systematic approach.
The research brings together two different disciplines in which the researcher from the discipline of economics identifies the opportunities for job creation, and in turn, the contributions to economic growth and the welfare of the community at large. The other researcher with a design and ergonomics specialization explores service design for contemplating the circular flow of interaction between industry, the university, and people. A university’s endeavor to be involved in community engagement activities for mutual benefit, the transition of industry’s vision from mere profit generation to supporting social causes towards perpetual relations, and the close collaboration between the university and industry towards community engagement are not unique in today’s world. There is no dearth of research exploring the opportunities to create such long lasting impact on the community through corporate social responsibility beyond its philanthropic and charitable activities. However, this research highlights the significance of the recognition of prior learning (RPL) and its implementation, which provides an opportunity for people in the community to earn credit through prior non-formal and informal learning. Higher education institutions (if RPL is implemented) acknowledge the non-formal and informal learning experiences of people who do not possess a university degree, but have acquired skills through non-formal and informal learning, provided that there is evidence to calculate earned credit through prior learning [
3].
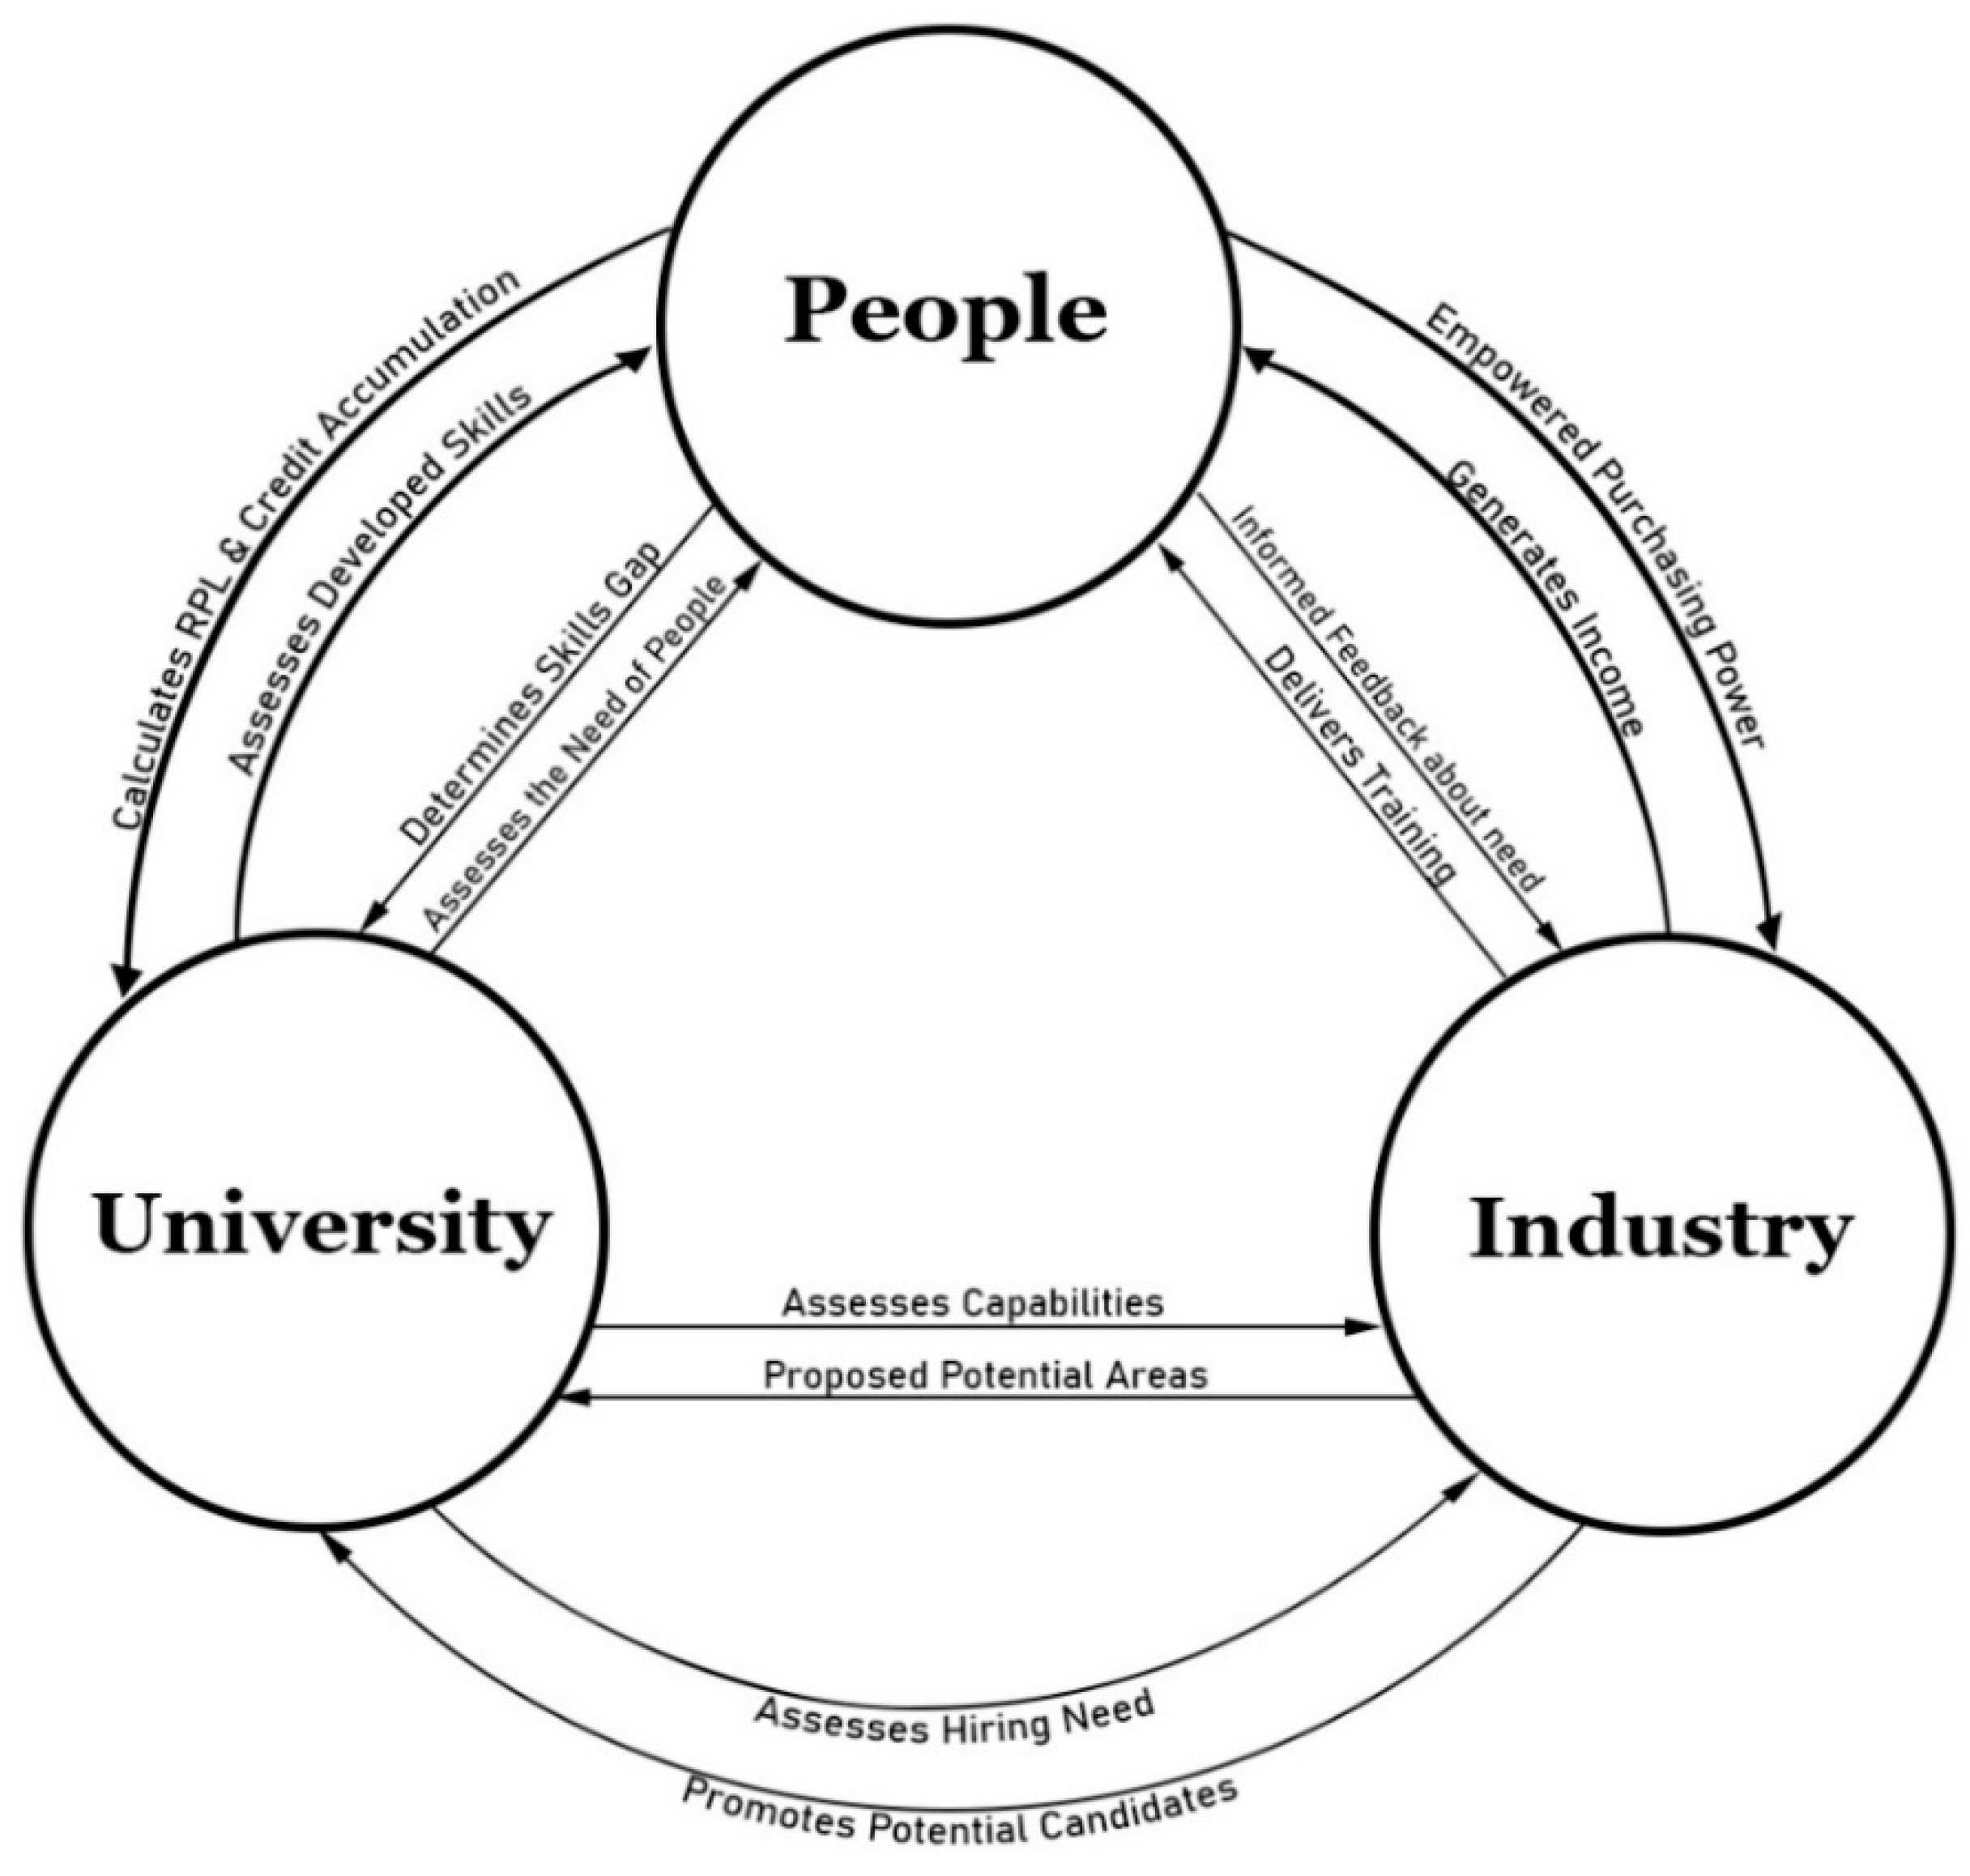
The research aims to propose a model which outlines a framework for ensuring the sustainable development goals towards empowering youth and adults across the community. The proposed model shall reinforce the cooperation among academia, industry, and people from diverse background with mutual benefits; the process is described as assessing the skill gap of communities via the university, communicating to industry by identifying areas of improvement, including how the industry shows its commitment by providing training, resulting in the university’s pursuit to grant credit and prepare youth and adults for job opportunities or promotions. This circular flow of interaction among the university, industry, and people in phases explores the career opportunities for communities contributing to economic growth, which is underpinned by the CSR practices of industry and the community engagement principle of higher education.
3. Methods
The research is descriptive in nature. Primary data were collected through conducting online surveys for academicians, industry professionals, and community people. The idea behind the design of questionnaires was to find the interrelations between the survey responses of the three entities, namely, academicians, industry professionals, and community people, and how to embed sustainable development strategies within the organizations for mutual benefit.
A non-probability sampling technique was adapted to know RPL implementation, CSR practices, perception of RPL, and its role towards career progression, higher studies, and the interaction between industry, the university, and the community towards economic development and sustainable future. Questionnaires were administered to respondents through email, colleagues, social media connections, and their acquaintances. Overall, 104 academicians, 105 industry professionals, and 101 people from the community responded to the survey.
Table 1 depicts the country-wise profile of all the respondents who participated in the survey.
Table 1 presents the country-wise summary profile of the academicians, industry professionals, and community people who responded to the surveys conducted online. The country-wise classification of respondents shows that within the academicians’ responses, 69 participants were from India, 17 were from Bahrain, and 18 were from other countries, namely, Egypt, Saudi Arabia, the USA, the UAE, the UK, Jordan, Italy, Romania, Singapore, Turkey, Canada, Oman, and Iraq. For the industry professionals’ responses, 42 were from Bahrain, 24 were from India, and 39 were from other countries, namely, Saudi Arabia, the USA, Oman, Kuwait, the UK, Hong Kong, Iraq, the UAE, Canada, and the Philippines. The country-wise classification of respondents showed that within the community people responses, 40 participants were from India, 25 were from Bahrain, and another 36 were from other countries, namely, Hong Kong, the Philippines, the USA, the UAE, Saudi Arabia, Egypt, the UK, Canada, Singapore, Iraq, and Oman.
The number of respondents from each of these countries apart from India and Bahrain was limited, since the target was to gather diverse responses and practices. Hence, all other countries except Bahrain and India (with a small number of responses from each) were considered collectively as ‘other countries’.
Table 2 represents the descriptive analysis of the country profile of respondents.
Table 2 shows the academicians who responded to the survey were mostly from India (66.3%), with only 16.35% from Bahrain, and the remaining 17.3% from other countries. The standard deviation (SD) was calculated as 28.59 for the country-wise profile of academicians. Within the industry professionals, 40% were from Bahrain, 22.8% were from India, and the remaining 37.14% were from other countries. The SD for this category was 9.18. With regard to the respondents from community, 39.6% were residents of India, 24.75% were residents of Bahrain and 35.6% were from other countries with the SD calculated as 7.69. This reflects that there was less variability of the data for the country-wise profile of industry professionals and community people. The analysis considered respondents from Bahrain, India, and other countries (combined) for each of the three surveys.
The demographic profile of the academicians who responded to the survey reflected that around 59% of the respondents were male, 47% were assistant professors, and 27% were associate professors. Around 54% of them possessed experience of more than 15 years, and 21% of them had experience between 5 to 10 years. Respondents covered a wide range of disciplines.
For the industry professionals who responded to the survey, around 67% of the respondents were males working in wide range of industries. About 52% of them had a bachelor degree in specialized areas, and 38% of them possessed a master degree. Respondents covered a wide range of disciplines and industries, namely, engineering, business administration, IT, economics, science, architecture and interior design, oil and gas, etc.
The demographic profile of the community people who responded to the survey reflected that around 70% of the respondents were male. Out of the 101 respondents, 48.51% of the respondents in the community survey were within the age group from 26 to 35 years, 31.68% were in the age group from 18 to 25 years. About 15.84% were diploma holders, 8.91% had completed certificate courses, 5.94% received vocational training, and 22.7% were school dropouts. The remaining 46.53% of the respondents from the community were bachelor degree holders.
All the three surveys were analyzed using tables and charts for appropriate interpretation. Descriptive statistical analysis (mean, variance, and standard deviation) were conducted for each of the responses while considering the country-wise data.
The Chi-square test and binary logistic regression results were derived using SPSS. After analyzing the results, researchers developed a model to identify the circular flow of interaction between industry, the university, and the community towards bridging RPL and CSR, which in turn can lead to the achievement of the SDGs.
4. Results
The researchers analyzed the conducted surveys for academicians, industry professionals, and community people.
The following sections provide insights into the results of the surveys focusing on the perception of RPL amongst the academicians, practices of CSR and community engagement in higher education institutions, collaboration with industry, skill gaps in the job market, areas of needed training to enhance skills and competences, preferred modes of training, and the interaction or partnership between the university and industry through CSR and community engagement activities, among others.
4.1. Academicians’ Responses
Results of the survey for academicians are represented through tables, graphs, and charts using statistical tools. With regard to the awareness about Goal 4: Quality Education of United Nations Sustainable Development Goals (SDGs), 69.15% of the respondents expressed that they were aware, whereas 30.85% of the respondents did not have a clear idea about sustainable development goals. However, descriptive analysis showed that there was variability in the data from the respondents of Bahrain, India, and other countries. This is evident from the SD values (SD = 20.4 with the category where respondents were aware and SD = 17.7 with category where respondents were unaware of SDGs) when interpreting the responses.
4.1.1. Perception towards RPL
Amongst the respondents, 52.13% mentioned that RPL policy is available at their affiliated higher education institutions (HEIs). The reason behind the non-availability of RPL policy for the institutions of the remaining 47.87% of respondents is that RPL is mostly applied in developed countries and a considerable number of the respondents (66.3%) belonged to India.
The results further showed that 53.19% claimed that their affiliated institutions implement RPL to allow youth and adults to accumulate credit gained through informal and non-formal learning experiences. Descriptive analysis on the country-wise responses showed data are largely variable around the mean, which is evident from the high SD values. More specifically, the SD for the category of granting credit was 32.5 and SD for the category of not granting credit was also high (24.5), implying the responses are not reliable.
Only 18% of the respondents answered the question asking about the mechanism of RPL implementation, even though the claim that the HEI has RPL policy came from more respondents. The comments made by these respondents were not exactly about the mechanism, but rather about general practices like using ICT, digital tools, incorporating practices into learning outcomes, and bringing rural students into higher education, among others, which imply that the understanding and implementation of RPL has not been clear.
Regarding the question of how to measure the impact of implementing RPL in higher education, only 23% of the respondents answered, and the majority of the respondents skipped this question. About 52% believed that the impact of RPL implementation lies in greater equality of opportunity in professions, 40% opined for career progression, and 36% for society’s well-being and contribution to national economy. Only 16% of the respondents considered the impact of RPL on the opportunity for pursuing education for school or college dropouts.
However, the country-wise classification of the results showed that only 11.11% of the academicians from Bahrain believed that RPL has an impact on career progression with negligible or no preference for widening access, the greater equality of opportunity in profession, higher studies, and social well-being. Participants from India expressed more meaningful results with 66.67% for career progression, 76.92% for greater equality of opportunity in profession, 75% for society’s well-being, and 100% of them opting for widening access and the ability to pursue education for dropouts. The majority of the participants from other countries (combined) did not believe that there is any impact on widening access and pursuing education aligned with the overall perception of participants from Bahrain. Around 22.22% of them believed that RPL has an impact on career progression, and 25% of them perceived that RPL has an impact on society’s well-being. The descriptive analysis illustrated that mean response for the alternative options remained the same at 33.33. The standard deviation (SD) values inferred that the responses of the participants are largely dispersed from the mean. The high SD value of 57.74 for widening access and pursue education can be validated because of the nil choice for these options by the respondents from Bahrain and other countries. The lowest SD (29.40) was calculated for career progression, which shows that the perception between the participants from India, Bahrain, and other countries were comparatively closer for the impact of RPL on career progression.
The majority of the respondents skipped the question related to collaboration with industry to implement RPL. Even so, 40% of them expressed that there is significant collaboration with industry and another 24% opined that, to some extent, there is collaboration with industry in implementing RPL. However, these responses lacked consistency and confirmed that academicians who responded in the survey do not have a common understanding about RPL and its implementation.
4.1.2. Perception towards CSR
Figure 1 presents the perception of the academicians about their institutions’ practice towards CSR.
As per
Figure 1, 69.23% of the respondents mentioned that CSR practices are through providing training and workshops to the community for career development. In total, 53.85% of the respondents revealed that conducting community engagement/service activities also constitutes an important scope of CSR activities. Around 41% of the respondents mentioned that conducting capacity building workshops for adults and youths of the community is another form of CSR practice by HEIs. The country-wise classification shows that about 76.19% of the respondents from India opined that CSR practices by HEIs culminated in recycling, energy conservation, and eco-friendly conservation processes. Only 52.63% participants from India mentioned that offering university services and resources to the community is one of the practices to serve society. On the contrary, 31.58% (highest) of the respondents from Bahrain acknowledged that HEIs offer university services and resources to community, followed by 30% of them who agreed that conducting community engagement/service activities is one of the prominent CSR initiatives. The result also showed that 31.25% (maximum) of the respondents from other countries (combined) acknowledged that providing incubation services form an important part of the CSR practices of HEIs, which was aligned with the perception of the majority of the respondents from India.
Descriptive analysis showed that the mean value for all the CSR practices as perceived by the participants from Bahrain, India, and few other countries was 33.33 for all the wide range of CSR practices, except for providing incubation services to entrepreneurial projects, which had a mean of 39.58. The lowest SD (18.48) for university services and resources to the community shows that the perceptions varied from the mean. The SD for community engagement activities was calculated as 21.86, which also shows the next lesser variability of the responses from the mean, followed by the SD for capacity building workshops at 22.42. The highest deviation from the mean was calculated as 37.19 (SD) for the responses towards recycling, energy conservation, etc.
Regarding HEIs’ collaboration with industry through CSR activities, the country-wise classification of data revealed that 24% of the respondents from Bahrain, 56% from India, and the remaining 20% from other countries mentioned that HEIs have collaboration with industry through CSR activities to some extent. The SD (19.73) for this option showed the least variability in the responses around the mean (33.33). Overall, 39.29% of the respondents opined that their affiliated institutions have significant collaboration with industry through CSR activities, within which 13.64% were from Bahrain, 77.27% were from India, and the remaining 9.09% were from other countries. However, the SD (38.12) suggests something about polarized values/responses from the mean for the said option. There was a kind of uniformity in the opinion of the respondents (Bahrain, India, and other countries) in accepting that collaboration with industry exists to some extent. This further implies that HEIs develop networking or partnership with industry to implement CSR approaches and principles.
About the contribution towards sustainable development through CSR activities at the institutional level, 47.37% of the respondents acknowledged the contribution of HEIs towards sustainable development through CSR activities with conviction. Another 38.60% of the respondents agreed with the proposition to some extent, whereas only 14% were not sure about the contribution towards sustainable development goals. However, the descriptive analysis of the country-wise responses illustrates that, even though the mean value was 33.33 for all three options, the SD (7.22) for the option ‘not sure’ implied less variability of the data from the mean. More specifically, within the 14% of the respondents who were not sure about the contribution towards sustainable development through CSR, 37.5% of the respondents were from Bahrain, another 37.5% were from India, and 25% were from other countries. Amongst the respondents who held the view that HEIs surely contribute to sustainable development through CSR practices, at least to some extent, the majority were the academicians from India. However, the high SD values reflect that the results cannot be generalized with respect to these two opinions.
4.1.3. Perception towards Interaction between University, Industry, and Community
The researchers wanted to know whether there is any interaction between the university, industry, and the community. A majority (87.67%) of the respondents mentioned that there is interaction between industry, the university, and the community. However, descriptive analysis reflects there was a high variability in the responses from the mean. To be specific, the SD for the category that there is communication was 29.3 and the corresponding SD for the category that there is no communication between the university, industry, and the community was 29.4. This suggests that there is lack of consistency between the perceptions of respondents from Bahrain, India, and other countries.
Figure 2 shows the areas of interaction or communication between industry, university, and community.
Figure 2 depicts that overall, 75.86% respondents believed that training and workshops for students for career and professional development is the dominant area of interaction and communication between industry, the university, and the community. Within this, 21.74% of the respondents belonged to Bahrain, 65.22% were from India, and the remaining 13.04% were from other countries. The high SD value of 27.95 for this area of interaction illustrates that responses were widely scattered from the mean.
Around 69% mentioned that the interaction is done through internship, guest speaker and field visit which are regular practices in HEIs. The country-wise classification of responses shows that out of the above mentioned 69% respondents, 23.81% were residents of Bahrain, 59.5% were of India, 16.6% were from other countries. The mean value is same for the responses with respect to all areas. However, SD (22.96) is least reflecting comparatively less variability in the responses within the area of internship, guest speaker and field visit.
Around 66% felt that social, cultural events and activities are important avenues which bring them closer for interaction. Within this context, 64.1% of the respondents were from India whereas 17.9% of them are from Bahrain and the remaining 17.9% were from other countries. This is another significant area as revealed by academicians from India. However, SD (26.65) shows the variation of the responses from the mean which is not negligible.
Another important area is joint research between industry and university which was highlighted by 55.17% of the respondents of the survey. Descriptive analysis of the country-wise responses suggest that around 66.67% were from India within the above mentioned % of respondents. The SD (29.22) was higher than the previously mentioned areas, implying scatteredness of the data around the mean (33.33).
4.2. Industry Professionals’ Responses
Completed survey questionnaires for the industry professionals were analyzed and results are presented in this section using statistical tools.
4.2.1. Initiative towards CSR Activities
Industry professionals were asked to reveal whether the organizations take up CSR activities to serve the community. Around 45% of the respondents mentioned that their companies take initiatives in CSR activities to serve the community significantly, another 39% revealed that CSR activities are undertaken to some extent. Only approximately 14% of the respondents expressed that their organizations have not taken initiatives towards CSR activities. The country-wise classification of the responses and the descriptive analysis show that the mean responses were the same with respect to the perception of the respondents on whether companies take initiative to serve the community (not yet, significantly, and to some extent). Within the overall 45% of the respondents who believed that there are significant initiatives by the company, 45.83% were from Bahrain, 29.17% were from India, and another 25% were from other countries. The SD (11.02) showed less variability in the responses, implying that companies in Bahrain are contributing more to community service through their social responsibility approaches compared to India and other countries. A similar perception came from the respondents across Bahrain, India, and other countries with regard to the option ‘to some extent’; 57.14% were residents of Bahrain, 19.05% were from India, and the remaining 23.81% belonged to other countries. The SD (20.76) as calculated as highest amongst the three responses, but showed reasonable dispersion in the data. This further confirms the fact that CSR is embedded in the strategies of organizations beyond the scope of charity.
CSR activities generally culminate into serving society, protecting the environment, supporting people, and providing training and education. Respondents were asked to rank the activities as prioritized by their respective organizations. The average ranking for the activities, namely protecting the environment and serving the society, were 2.85 out of 4, followed by 2.25 for supporting people, and 2.05 for providing training and education.
The country-wise classification of the responses showed that within the activity protecting the environment as rank 1, 57.69% respondents were from Bahrain, 8.33% were from India, and 30.77% were from other countries; however, the high SD value (24.71) for this rank reflects the variability of the data from the mean. Similarly, 50% of the respondents belonged to Bahrain amongst the industry professionals who gave rank 2 to the activity serving society. For the same category, 16.67% were residents of India, and 38.46% were from other countries with a similar ranking. The SD (16.93) for this ranked activity reflects less dispersion in the responses from the mean. Comparing the SD values for the ranks given for each of the four activities, it can be inferred that the ranks towards supporting people had the least variability, followed by providing training and education, protecting the environment, and serving society. This shows the priority areas for CSR activities of the organizations in these countries.
Industry professionals provided further insight into the specific CSR practices towards the environment and sustainability. Energy and other resource conservation, eco-friendly production and processing techniques, and waste reduction are commonly activities undertaken by companies towards protecting the environment and sustainability. Recycling and pollution control are other activities towards this endeavor. The country-wise classification of the responses and descriptive measures illustrates that amongst the respondents with the highest preference for eco-friendly production and process techniques, 62.07% were from Bahrain, 10.34% were from India, and 27.59% were from other countries with an SD of 26.34 (reasonably high variability in the responses). Waste reduction observed the lowest SD (20.62) where 57.14% of the respondents were working in Bahrain, 21.43% were working in India, and another 21.43% were from other countries. Another dominant area was energy conservation, for which the SD was 23.67, where 60.6% were part of companies in Bahrain, approximately 18% were from India, and the remaining 18% were from other countries. As clearly evident in the descriptive analysis, companies in Bahrain take significant initiative towards the environment and other areas of sustainability. However, respondents from India comprise a smaller percentage within each initiative/practice towards the environment and sustainability.
With respect to CSR practices towards society, overall, 55.74% of the respondents mentioned that companies contribute towards improving quality of life, 54.1% revealed that companies volunteer for serving the community through a wide range of activities, followed by 49.1% of the professionals who mentioned that contributing towards economic development and well-being is another significant practice. Within each category, descriptive analysis was conducted based on country-wise responses. With regard to the respondents who selected ‘volunteering for serving the community’, 42.86% were from Bahrain, 28.57% were from India, and another 28.57% were from other countries. The SD (8.25) reflects much less variability in the responses towards this activity to serve the society. Respondents who opted for ‘serving underprivileged people through specialized services’ as the CSR practice comprised 54.5% from Bahrain, 27.2% from India, and 18.1% from other countries with an SD of 18.92, showing less scatteredness of the responses. The next marginally higher SD (19.60) was reflected in the perception of the industry professionals who selected ‘contributing towards economic development ensuring social well-being’ as the CSR practice, amongst which 55.5% were from Bahrain, 18.5% were from India, and the remaining 25.9% were from other countries. Improving quality of life showed a relatively higher variability in the responses from the mean (33.33) with the calculated SD as 23.78.
Respondents from industry gave their opinion about CSR practices of industry towards supporting people. Overall, 34.43% of the respondents expressed that their organizations take initiatives to save lives through innovative solutions within which approximately 53% were working in Bahrain, 12% were from India, and 35% were from other countries with an SD of 20.66. About 29.51% mentioned that rescuing people during an emergency and initiatives to minimize road accidents are other practices observed in industries. The country-wise classification showed, amongst them, that approximately 40% were from Bahrain, 27% were from India, and 33% were from other countries with a very low SD (6.67), implying less dispersed responses from the mean for the above-mentioned practice.
Respondents further provided feedback on the initiatives taken by organizations to provide training and education. About 62.30% of the respondents indicated that hands on training to the community to support career development is the most prominent activity of companies, and within that, approximately 41% of the respondents were from Bahrain, 29% were from India, and another 29% belonged to other countries. The SD for the responses towards this practice was only 6.79, reflecting less variability in the perception. Those who acknowledged ‘capacity building workshop to youth and adults’ as the important CSR practice of the company, showed very low dispersion in the responses with an SD of only 2.89. This implies that capacity building workshops to enhance employability skills are very common across the respondents participated in the survey. ‘Support entrepreneurship contributing towards national economy’ and ‘empowering women through impactful initiatives’ are other two initiatives undertaken by the companies as perceived by the respondents with slightly high SD values compared to the above-mentioned values of SD.
4.2.2. Collaboration between Industry and University
Below,
Figure 3 presents the areas of collaboration between industry and the university as ranked by the industry professionals. The respondents ranked the areas of collaboration through research, projects, activities and events, internships, guest speakers, filed visits, etc.
Figure 3 depicts that the average ranking score was highest (7.1) for joint research, which implies collaboration between the university and industry is mostly reflected in joint research for the overall responses. The second highest ranked score (6.26) reflected community engagement activities to collaborate with the university, followed by commercial research with a ranked score of 6.16, and CSR practices with a ranked score of 5.28. Descriptive analysis highlighted the following points: there was significant variability in the ranked areas ranging from 57.7 to 5.5 (SD values); for internship, conference, and competition, and events and activities largely, the variability in the responses were less, the reason for such a kind of variation is due to multiple rankings for each area and a limited number of respondents to reflect significant results.
4.2.3. Skill Gap in the Job Market
Industry professionals were asked to identify the skill gap in the community to meet the job market requirements.
Figure 4 shows the perception of the industry professionals about the skill gap amongst youth and adults in the job market.
Figure 4 depicts that a considerable proportion of the overall respondents (73.77%) opined that the skill gap exists in technical skills relevant to industry. It is noteworthy that within these respondents, 47.3% were professionals in Bahrain, 28.9% were working in India, and the remaining 23.6% were from other countries. The SD (12.4) for this response related to the skill gap was the least amongst all the options/skill gaps, implying that respondents had a similar perception and there was less dispersion in the data from the average value of 33.3. Hence, it is pertinent to provide training in order to enhance technical skills of the participants. Needless to say, this has impact on employability of the youth and adults irrespective of their qualifications.
Around 44% of the overall respondents believed that problem-solving skills are another area of concern to meet the job requirement. Within these, 56.5% were from Bahrain, 21.7% were from India, and other countries as well, with a SD of 20.08. This shows the scatteredness of the data from the mean with moderate variability. In total, 42.62% of the industry professional noted that youth and adults in the community lack communication skills and leadership skills that are essential in the job market. Descriptive analysis on the country-wise responses revealed that the SD for communication skills was calculated as 14.6, reflecting less variation in the responses between countries. However, with respect to leadership skills, the SD came out to be bit high (28.9), which further boils down to the fact that there is a difference of opinion between the respondents from Bahrain, India, and other countries. Around 66% from Bahrain in that category believed that leadership skills need to be enhanced. To be specific, only 14% and 19% from India and Bahrain, respectively, identified the skill gap in leadership. However, there was no disagreement about the existence of the skill gap. Around 36% of them indicated that IT skills need to be developed to live up to the expectation in the profession as an overall response. However, descriptive analysis identified that the SD (23.6) signifies the variability in the responses for this skill set. Comparing the SDs for the responses towards leadership skills and IT skills, it can be added that variability in the data/responses was not at maximum for the IT skills and that adults/youth do require training in this aspect to work successfully in the profession.
Respondents were further asked about their idea on providing training to adults and youth in the community. Around 52.46% of the respondents believed that their colleagues are capable of providing vocational training to adults and youth of the community, amongst whom 53.3% were from Bahrain, 13.3% were from India, and the remaining 33.3% were from other countries. In total, 31.15% were not sure of this fact, out of which 50% were from Bahrain, 30% were from India, and 20% were from other countries. The SD was calculated with a value of 15.8, showing that there is variability in the data, but it is in between the variability shown in other two category of responses. Further, 16.39% of the respondents overall commented that their colleagues are capable for such training, but it has to be discussed with superior for implementation. Within this category, 46.4% worked in Bahrain, 25% in India, and 21.43% in other countries with the SD at 13.5, implying the least deviation of the values from the mean. Overall, the results confirm that industry experts are capable and willing to provide training to the community to bridge the skill gap. However, this has to be implemented at strategic practices of the organizations.
4.3. Community Responses
Completed survey questionnaires for the community were analyzed using statistical tools and the results are presented in this section. Focus was given to identify the relation between the level of employment and level of education, level of skills developed in industry, and the training needs of the community.
Regarding the current employment status of the community people, overall analysis showed that 50.49% of the respondents were employed in private sector, 13.86% were self-employed, and only 7.92% were working in public sector, whereas 27.72% of them were unemployed. However, the country-wise classification revealed that, within the category ‘employed at private sector’, 39.5% of the respondents were from Bahrain, 41.86% were from India, and the remaining were from other countries. Within the category, ‘employed at public sector’, 28.5% were residents of Bahrain, 42.8% were residents of Bahrain, and 28.5% were from other countries. Amongst the respondents who were self-employed, 36.3% were from Bahrain, 54.5% from India, and 9% were from other countries. Within those who revealed their unemployment status, 11.1% were from Bahrain, 72.2% were from India, and 16.7% were from other countries. Descriptive analysis of the responses showed that the mean for all the categories was same at 33.33. However, the SD was the lowest (8.25) for those working at public sector, showing uniformity in the data. Slightly higher variability (12.81) was shown for the responses related to ‘employed at private sector’. The SD (33.7) showed a high level of dispersion of the responses from the mean.
Educational qualification of the respondents from the community was analyzed showing that 46.53% of the respondents held a bachelor degree, within which 42% were from India, 29% were from Bahrain, and another 29% were from other countries. However, this response was the most reliable since the SD for this category came out to be 7.45, implying that the responses are not widely varied around the mean. The responses further showed that 15.84% were diploma holders within whom 46% were from Bahrain, 38% were residents of India, and 15% were from other countries with the SD of 16.01 (next highest variability).
Overall, 22.77% of the respondents were drop-outs, 8.91% of them had certificate courses, and 5.94% of them had vocational training. Descriptive analysis on the country-wise responses illustrated that the SD for the category of drop-out was 20.5 and it was 29.4 for the category of certificate courses. This reflects the scatteredness of the data around the mean, and especially, the responses for certificate courses and vocational training infer that there is a significant difference in the qualification status between the respondents of Bahrain, India, and other countries.
4.3.1. Practical Skills Gained through Informal and Non-Formal Learning Experience
Respondents were asked whether they possess adequate practical skills without formal qualification from university. Overall, 36.9% of the respondents agreed that they have gained significant practical skills over the years without formal qualification in higher education. The country-wise classification depicted that within this category, 52.3% of the respondents were from Bahrain, 28.5% were from India, and the remaining 19% were from other countries. The SD (17.1) for this response category reflects that there is variability in the data around the mean value, but it is not completely unreliable. Another 39.1% opined that they have acquired practical skills to some extent without having formal degree. Amongst this, 32.2% respondents belonged to Bahrain, 51.6% belonged to India, and the remaining 16.1% were from other countries that participated in the survey. The mean and SD for this category came out as exactly the same as the previous one (mean 33.3 and SD 17.1), showing that there is variability of the data, but it is not largely dispersed. This collectively suggests that the majority of the respondents have gained hands on skills through practice without having formal degree from the university.
Regarding the awareness of RPL in higher education, the overall responses illustrated that 71.73% of the community people did not have awareness of RPL, and only 28.26% of the respondents claimed that they were aware of RPL. The country-wise classification of the responses and the descriptive analysis suggested that the SD for the responses with awareness about RPL was 19 and SD for the responses with no awareness of RPL was 21, along with the same mean value of 33.3. It can be inferred that there is dispersion in the data from the mean to some extent. However, within the category of respondents who claimed to be aware of RPL, 52.2% were from Bahrain, 33.3% from India, and the remaining 14.2% were from other countries. Consistent with this perception, within the category of other respondents who were not familiar with the concept of RPL, 23% were from Bahrain, 57.6% were from India, and 19.2% were from other countries. However, empirical studies reveal that RPL has not been applied in Bahrain and India. The majority of the respondents were residents of India and Bahrain; thus, it is unlikely for the respondents from these communities to know about RPL.
Respondents were asked about the sources of informal and non-formal learning experience through which credits are earned in higher education. Overall responses illustrated that around 20% of the respondents relied on self-study, 15.7% gained learning experience through mentoring, and another 11.4% focused on internet surfing. Around 10% of the respondents mentioned that they attended community offered programs/courses, followed by another 10% of the respondents who resorted to reading books and articles. Descriptive analysis on the country-wise responses revealed that the mean remained the same, but the SD for each category of responses were different, ranging between 57.7 and 11.5, respectively, for open courseware and networking with peers, friends, family, and relatives. The SD for the discussion in the chat/forum and the SD for the community offered programs were 14.4 and 16.6, respectively, showing comparatively less variability in the responses of these categories. The SD for the responses towards internet surfing, mentoring, and self-study were calculated as 21.8, 23, and 24.7, respectively, showing the amount of dispersion in the data from the mean. The results imply that there is no clear indication or major trend for gaining informal and non-formal learning. However, reliability in the responses was observed for the sources, namely, networking with people, chat/forum, community offered programs, and internet surfing. It is noteworthy that such kinds of informal and non-formal learning took place among the respondents without any conscious attempt to gain RPL.
The survey captured the perception of the respondents about the impact of RPL. Overall responses summarized that 31.8% of the community people believed that RPL has an impact on standard of living and social recognition, whereas 27.2% opined that RPL would impact career progression/promotion at work. Very few perceived that RPL can lead to opportunities for a formal degree and/or higher studies in the university. The country-wise classification of responses and the descriptive analysis suggested that the SD turned out to be quite high for the probable impact of RPL. However, the minimum SD (28.8) was the same for the responses towards a better standard of living, career progression, enrolling into higher studies, and awarding formal degree from HEIs. This captures the fact that respondents have a kind of consistency in understanding impact of RPL for the above-mentioned opportunities.
4.3.2. Hands on Training from Industry
With regard to the training needs, respondents were asked whether they need training from industry for career progression or job opportunity. Around 46.9% of the respondents emphatically mentioned about the training needs. Within this category, of those who responded, 41% of them were from Bahrain, 45% were from India, and 13% were from other countries. Overall, 31.8% were interested to receive training from industry in order to enhance employability skills. Within this category, approximately 50% were from Bahrain, 36% were from India, and 14% were from other countries. However, descriptive analysis provided the following insight: the SD for both the responses (17.2 and 17.9) was almost similar, with a marginal difference or similar extent of variability existing in the data around the mean 33.33. Even otherwise, the logical response should be that there is training needed for the adults and youth for career progression.
The survey further identified the skill gap as perceived by the respondents to prepare well for the job market. The overall need of the community to acquire employability skills was highlighted.
Figure 5 presents the skills required by the community to enhance employability in the labor market.
Figure 5 depicts that 50% of the respondents required training in IT skills and communication skills from industry to meet the requirements of the labor market. Around 42% of them required technical skills relevant to industry. The country-wise classification showed that there as consistency between the responses with regard to IT skills, technical skills, leadership skills, problem-solving skills, and communication skills from the respondents in Bahrain, India, and other countries. For communication skills, within the 50% of respondents, 38% of them were residents of Bahrain, 33% were residents from India, and 28% were from other countries with the SD (4.76) implying uniformity in the responses. For IT skills, within the 50% of respondents, 41% were from Bahrain, 47% were from India, and the remaining 11% were from other countries with the SD (18.9) showing some variability in the data around the mean. Within the participants opting for technical skills, 42% of them were from Bahrain, another 42% were from India, and 14% were from other countries with the SD calculated as 16.5m showing some variability in the data, but less than the variability that existed in the responses for IT skills. Descriptive analysis showed that the SD for design/drawing skills and problem-solving skills (7.2 and 8.3, respectively) reflect less variability in the data. Hence, it is evident that the majority of the respondents from the community need training in communication skills, IT skills, technical skills, problem-solving skills, and design and drawing skills. This finding is consistent with the skill gap perceived by the industry professionals.
Regarding the preferred mode of training, about 43.93% of the respondents preferred online training with flexible time, followed by 37.8% with a preference for face-to-face training in the locality. It can be noted here, respondents were from both rural and urban areas. Within those who opted for online training with flexible time, 41% of them were from Bahrain, 32% were from India, and 27% were from other countries. The SD for this category of response was only 6.94, implying much less dispersion in the data or proving reliability of the responses. The SD for the responses within face-to-face training in the locality was 15.7, showing that there is variability in the data compared to the previously mentioned option.
Respondents were asked about their association with industry to receive training. Overall responses depicted that the majority (90.9%) of the people do not have any contact with industry willing to serve the community through training. Within this, 49% were residents of Bahrain, 41% were residents of India, and 17% were from other countries and the SD (14.48) showed that there is variability in the data, even though it is not largely scattered. This finding highlights the need to create networking between industry and the community for mutual benefit.
Respondents were asked about their expectations after getting RPL for the future once it is implemented. Overall responses revealed that 65.1% of the respondents expected career enhancement as a result of RPL, within which 40% of the respondents belonged to Bahrain, another 40% also belonged to Bahrain, and 20% were from other countries. However, the SD for the responses towards career enhancement was 11.5, meaning there is variability in the data, but it is not very high. Only 22.7% were interested to continue education if RPL is implemented, and approximately 44% of the respondents within this category were from Bahrain, 33% were from India, and the remaining 22% were from other countries with the SD at 11.1, which is very close to the above-mentioned category. This result shows consistency with the finding before, which confirms that people aspire to move ahead in their careers once credit is granted for informal and non-formal learning experiences. Very few chose the option of receiving a higher degree, and the SD (33.3) value also showed polarized responses compared to the mean.
4.3.3. Interaction between Industry, the University, and the Community
For a sustainable future, the collaboration between industry, the university, and the community is required, which was asked in the survey and is reflected in below
Figure 6.
Figure 6 highlights that considerable number of the respondents (53.03%) believed that interaction between industry, the university, and the community is very much essential. The country-wise classification of responses illustrated that 36% of the respondents were from Bahrain, 50% were from India, and 14% were from other countries. The SD for this category of responses was calculated as 17.9, reflecting some kind of variability in the data, but it is still reliable. Around 39% of them opined that this interaction is not only important, but it needs proper planning for effective implementation. Further, 36% of them were from India, another 36% were from other countries, and only 14.2% were from Bahrain, showing that respondents from Bahrain overall were sure about the interaction between industry, the university, and the community. The SD (12.3) implies there is less variability of the data towards this category as compared to the previously mentioned variability with the SD at 17.9. This suggests that there should be partnership or networking between industry, the university, and the community for sustainability.
4.4. Results of Statistical Test/Analysis
The Chi-square test of independence was run using SPSS to know if there was an association between the categorical variables. If the p-value (calculated value) was less than or equal to the significance level, the null hypothesis was rejected, which implies that there is a statistically significant association between the variables. The Chi-square test was conducted to know whether there was an association between the country of residence and other variables, namely, awareness about SDGs, the HEIs implementing RPL and for how long, the outcome of practicing RPL, HEIs collaboration with industry, HEIs practicing CSR, linking RPL with CSR, etc. However, from the responses of the academicians, the association was reflected between the country of HEIs and impact of RPL on ‘society’s well-being and contribution to national economy’ (p = 0.048), between the country of HEIs and the outcomes of practicing RPL towards ‘eligibility for diploma/certified courses’ (p = 0.029), and between the country of HEIs and RPL applied on community people in rural areas without jobs (p = 0.007).
From the responses of the industry professionals, the following associations were concluded: area of specialization/industry of the firm and the CSR activities like hands on training for the community to support career development (p = 0.039), area of specialization of the company and CSR practices to support entrepreneurship (p = 0.049).
Finally, from the responses of the community people the main association reflected was between the country of residence and the interaction between the university, industry, and the community (p = 0.485).
Binary logistic regression was also conducted in SPSS to predict the relation between the independent variable and dichotomous dependent variable. However, due to a lack of understanding of the concept of RPL and a small number of responses for some of the important questions, the derived results are not statistically significant. However, the binary logistic regression showed a significant result using the responses for ‘Does your institution believe and practice corporate social responsibility?’ as the dependent variable and three following independent variables: ‘Does your institution have any relation/collaboration with industry to implement?’; ‘Does your institution link RPL with CSR in its practices?’; ‘Does your institution develop collaboration with industry through CSR activities?’. Omnibus tests of the model coefficients implied that there is significant improvement in the new model over the baseline model since the new model has a significantly reduced 2LL (49.022a) compared to the baseline. It suggests that the new model is explaining more of the variance in the outcome.
The Nagelkerke R square (0.796) showed that the model explained around 79% of the variation in the outcome. The Hosmer and Lemeshow Test also showed that the model was a good fit to the data. The model now correctly explains the outcome for 91.3% of the cases compared to 55.8% in the base model. The positive regression coefficients (B) for the variables ‘institution linking RPL with CSR’ and ‘collaboration with industry through CSR’ (20.678 and 20.148) imply the significant association between independent and predicted variable.
4.5. Reflection on Results: Framework for Interrelating the University, Industry, and the Community
On the basis of the analysis of the results, the researchers propose the model illustrated in
Figure 7 which presents a framework and interrelates the three entities: the university, industry, and the community people.
The graphical model presented above can be explained below.
4.5.1. Phase one: (The Straight Arrow Relations)
The University:
Assessing the needs of people in light of local context, economy, and industry;
Determining the skills gap;
Assessing the capabilities of the industry in terms of training to be given to people related to the local context;
Proposing potential areas for developing people’s skills and competences by the industry.
The Industry:
4.5.2. Phase 2: (The Curved Arrow Relations)
The University:
Assessing developed skills, competences, and practiced work/experience’
Recognition of prior learning and proposed credit accumulation;
Assessing industry recruitment needs, and research and development;
Informing potential candidates to industry.
The Industry:
4.5.3. Implementation Plan
The proposed framework is an endeavor to achieve the SDGs towards empowering youth and adults across the country. In order to build a network between industry, academia, and the community and to embed the sustainable development strategies, it is imperative to create a common platform with people from industry, the university, and the community with diverse backgrounds. The framework can be initially presented in this platform by conducting a workshop to encourage innovative ideas about the format and to invite examples for the implementation of the above framework. The workshop shall open the door for collaboration between industry professionals and educators to volunteer for such projects. The workshop shall encourage the participants to review the model, to explore technical details, and to identify opportunities for experimental work promoting SDGs. The workshop shall assign group tasks to the participants (preferably partners from industry and academia) to specify assessing RPL, to identify the training needs of the people in remote areas, to highlight the skills needed to impart training for the target group, to brainstorm ideas for informal learning, and to integrate skills and competences through RPL with labor market needs.
The workshop will be designed as an open invitation to stakeholders (industry professionals, educators) to identify the tools to implement such a model across the country. The workshop is expected to spread the innovative tool to help achieve SDGs locally, embracing organizations and the university together to provide opportunities for lifelong learning for the youth and adults across the country. The workshop is expected to recreate or develop detailed processes of the proposed model.
The workshop shall bring together the partners from academia, industry, and the people and shall work on the roadmap to implement the model in their countries. Such initiatives can subsequently lead to reporting on the achievements to the network and strengthening the partnership.
5. Discussion
5.1. RPL Implementation
In many of the higher education institutions, especially in Bahrain, RPL policy is in place, but the mechanism to grant credit has not been implemented. That is why the concept of RPL is not new within academia, and the literature shows the amount of research in RPL in different countries around the world. However, RPL has not been implemented widely in countries like India and Bahrain, and respondents have not always completed the surveys in consistent manner. This leads to the fact that these countries need to implement RPL, and the mechanism should come from the regulatory body to have consensus about how to grant credit based on informal and non-formal learning.
It is imperative to create awareness amongst the community about the significance of RPL and its impact on earning credits in higher education. Regarding the impact of RPL, there is some kind of uniformity between the perception of academicians and community people highlighting career progression/development. Very few of the academicians and community people expect that the RPL mechanism would motivate adults and youth for further education or formal degree from university. Thus, there is a need for collaboration between academia, industry, and the community for the achievement of SDGs.
5.2. CSR Practices
Majority of the respondents from industry revealed that organizations take part in CSR activities not to do charity, but to provide training and workshops to serve the community, to protect environment, etc. Collaboration between the university and industry lies in community engagement activities apart from joint research. This perception was reflected in the responses of academicians, where a good number of respondents believed that community engagement activities form an important scope of the CSR practices of HEIs. This also suggests that CSR practices are not common only for companies, but it was integrated with the philosophy or perspectives of HEIs.
5.3. Skill Gap and Training Needs of Community
As reflected in industry professionals survey results, there exists a skill gap in the labor market. A significant number of the respondents admitted that the people aspiring for jobs lack the technical skills appropriate for industry jobs, followed by a skill gap in problem-solving, communication, and leadership skills. Few of them felt that the labor market identified inadequate IT skills amongst the working people. Responses also confirmed that a considerable section of the industry professionals acknowledged hands on training to the community to support career development as an important aspect of CSR practice of companies. This result was also reflected in the survey conducted for academicians, with significant number of respondents indicating that CSR practices of HEIs are implemented through providing training and workshops to the community to support career development. Similar feedback was received through the survey conducted for the community regarding training needs. The majority of the community people accepted that there is skill gap and showed interest in receiving training from industry towards enhancing employability skills. However, a significant number of community people require training in IT skills and communication skills, followed by the need for enhancing technical skills relevant for jobs. These results match the perceptions of industry professionals about skill gaps and training needs.
5.4. Interrelating Industry, the University, and the Community: The Framework
A majority of the respondents from academia expressed that there is collaboration between industry, the university, and the community. Few of them mentioned that HEIs have collaboration with industry through CSR activities. A similar result was found in the survey for industry professionals, which showed a good number of the industry professionals agreed that there is collaboration or partnership between industry and the university. This was reiterated in the community survey, where the majority of the respondents indicated that interaction between industry, the university, and the community is essential and it needs proper planning for effective implementation. The proposed framework can bring together the university, industry, and the community by bridging the gap between RPL and CSR, which ensures the achievement of SDGs towards empowering youth and adults. Organizations are involved in CSR practices, but these are not always directed to the actual need of the community and how they can contribute to the implementation of RPL by HEIs. It is important to embed sustainable development strategies in transforming learning frameworks and building the capacity of educators and industry consultants while contributing to the national economy.


