Abstract
A compound parabolic concentrator (CPC) is a non-imaging device generally used in PV, thermal, or PV/thermal hybrid systems for the concentration of solar radiation on the target surface. This paper presents the geometric design, statistical modeling, parametric analysis, and geometric optimization of a two-dimensional low concentration symmetric compound parabolic concentrator for potential use in building-integrated and rooftop photovoltaic applications. The CPC was initially designed for a concentration ratio of “2×” and an acceptance half-angle of 30°. A MATLAB code was developed in-house to provoke the CPC reflector’s profile. The height, aperture width, and concentration ratios were computed for different acceptance half-angles and receiver widths. The interdependence of optical concentration ratio and acceptance half-angle was demonstrated for a wide span of acceptance half-angles. The impact of the truncation ratio on the geometric parameters was investigated to identify the optimum truncation position. The profile of truncated CPC for different truncation positions was compared with full CPC. A detailed statistical analysis was performed to analyze the synergistic effects of independent design parameters on the responses using the response surface modeling approach. A set of optimized design parameters was obtained by establishing specified optimization criteria. A 50% truncated CPC with an acceptance half-angle of 21.58° and receiver width of 193.98 mm resulted in optimum geometric dimensions.
1. Introduction
The rapid growth in global electric energy demand exhorts the development of sustainable and renewable energy resources [1]. Solar energy is the most promising resource among all the available options of renewable energy resources due to its abundance, cleanliness, and free availability [2]. To harvest solar energy, photovoltaic (PV) systems and solar thermal collectors are currently being used [3]. Solar PV systems have many distinct advantages, such as low maintenance costs due to the absence of any moving parts, quiet operation, no harmful greenhouse gas emissions into the atmosphere, and support for sustainable development. Solar PV technology plays a vital role in sustainable development by reducing the dependence on fast depleting fossil-fueled power plants [4]. However, the conversion efficiencies of conventional solar cells are inherently lower that further decline at higher cell temperatures [5]. Integration of optical concentrators and suitable heat dissipation mechanism with such solar cells have great potential to improve their energy conversion performance [6]. The resulting concentrated PV system produces more output with lesser solar cell material and thus provides the opportunity of net saving in the material and manufacturing cost of solar cells.
The concentrated photovoltaic systems can be subdivided into low, medium, and high concentration systems depending upon their concentration ratios [7]. Low concentration photovoltaic systems are relatively simple systems that usually employ CPC reflectors, belonging to the family of non-imaging optical concentrators, and can be employed as stationary installations [8]. On the other hand, medium and high concentrating collectors, categorized as line focusing and point focusing types, utilize imaging type concentrators, which essentially require complex tracking mechanisms for continuous and effective operation [9].
The compound parabolic concentrators (CPC) were first introduced by Roland Winston [10] as optical concentrators for thermal as well as PV applications. Later, some other research groups investigated the plausibility of the deployment of these concentrators to solar PV generators for improving their performances. The CPCs have emerged as the best static low concentrating systems for PV applications in the last two decades [11]. The benefits of the compound parabolic concentrator over other concentrating collectors include higher optical efficiency and the ability to collect both direct and diffuse solar rays [12]. They do not require active tracking mechanisms, and lesser space is needed for their installation [13]. Due to these advantages, CPC collectors combined with PV modules are found to be suitable for supplying electricity to domestic as well as small scale industrial/commercial consumers.
Over the last few decades, many researchers have proposed diverse geometries of CPC collectors [14] for improved optical and electrical performances. Garg and Adhikari [15] made optical design calculations for a 3× CPC intended for PV/thermal applications. The authors observed the variation of height to aperture as well as the reflector area to aperture area ratios against the concentration ratio of CPC. The CPC height was found to be 1.89 times its aperture width. Some recent research studies about the design of 2D CPC for PV applications are available in the literature [16,17]. Khalid et al. [18] investigated two unique CPC designs having a concentration ratio of 2×, the lowest truncated CPC and the highest truncated CPC, by comparing their optical performances with full CPC using ray-tracing simulations. The authors concluded that the lowest truncated CPC design exhibited better performance in terms of uniform flux distribution and the lowest material consumption. Hadavinia and Singh [19] used ray-tracing simulations for modeling two geometrically equivalent concentrators viz., V-trough and CPC. The authors demonstrated that truncated CPC had better acceptance of solar radiation beyond its acceptance angle range with a minor reduction in concentration ratio compared to full CPC. Both concentrators were designed for a geometric concentration ratio of “4×”. When compared with an equivalent V-trough, CPC generated 2.4% more power. Lee and Rao [20] used the fuzzy set theory for performing uncertainty analysis of a CPC-PV collector system located in Miami, USA. The authors performed single objective optimization-based simulations for three different objectives, and the corresponding optimal values of design parameters were obtained using fuzzy analysis technique for each objective. The objective functions included maximization of annual solar energy reaching the receiver surface (f1) and the lowest monthly incident solar energy (f2), as well as minimization of total cost of system (f3), including the cost of reflectors and land. The authors determined the deviations of all three objective functions from their crisp values in the lower and upper bounds and concluded that the width of PV receiver and acceptance angle were the most critical factors that control the deviations in upper bounds as compared to lower bounds.
Some researchers investigated the benefits of integrating CPC collectors with PV modules for amplifying their output power [21]. Mallick et al. [22] performed an experiment to compare the performance of an asymmetric CPC having a concentration ratio of 2× with a flat PV module. The results of their research showed that the CPC caused an increment in the ceiling of extreme yield by an amount of 1.61 as compared to that of an analogous module without concentration. Hossain et al. [23,24] carried out similar research with the purpose of expanding the productivity of a photovoltaic panel by utilizing CPC. A photovoltaic panel capable of following the sun in the absence of CPC and an analogous panel using CPC and following the sun were examined together under the outside environment in the Malaysian atmosphere. The researchers inferred from the experiment that the productivity of panel using CPC and the sun following arrangement was 1.5 times more than that of its counterpart operating in the absence of concentration and tracking. The application of the sun following mechanism with CPC was found to be a suitable approach for improving the yield of photovoltaic systems. However, the integration of tracking arrangement caused complexity and additional cost of concentrating PV modules. Yang et al. [25] conducted a comparative analysis to evaluate the energy production of a photovoltaic panel once employing CPC and then in its absence under the climatic conditions of China. The authors concluded that the production of power from a PV panel using CPC was almost double that of its fellow panel without concentration.
To solve the problem of non-uniform flux distribution on the PV module surface due to parabolic reflectors, Paul [26] presented the design of multi-sectioned CPC consisting of flat reflector sections instead of parabolas. The author designed a total number of eight concentrators having the same concentration ratios but a different number of flat reflectors, starting from one to eight. The comparative analysis revealed that standard CPC exhibited better optical performance within the acceptance angle range. Regarding the uniform flux distribution, the multi-sectioned CPC consisting of seven flat reflectors manifested better performance. However, the comparative cost analysis among various designs was not conducted by the author. To appraise the influence of collector alignment in a CPC-based photovoltaic/thermal system, Lee et al. [27] employed thin-film solar cells made up of gallium arsenide (GaAs) in a relatively cheaper symmetric mini-CPC made up of plastic. The results thus obtained were compared with those of a flat photovoltaic panel for east–west axis and north–south axis collector orientation. The experiment was performed in natural conditions, and it was shown that the above-mentioned solar cells, when used with CPC oriented in a north–south direction, gathered 68% and 50% more radiation than flat PV panel inclined at a specific angle for hot and cold atmosphere, respectively. This was apparently because of a smaller acceptance angle since the concentrator was oriented opposite to the sun track. On the contrary, the authors inferred that such type of solar cells, when used with CPC oriented in an east–west direction, produced almost double additional power than a flat solar panel for hot and cold weather conditions, respectively. This enhancement resulted mainly due to the orientation of CPC in the same direction as the sun track. The authors also concluded that employing the sun following system augmented the intensification of solar radiation by approximately three times as compared to a flat solar panel having the same area for hot and cold weather.
The optimization of design, and sizing of solar collectors, is inevitable for rendering them a cost-competitive and reliable renewable energy resource [28]. Many researchers have used response surface methodology for experimental design, modeling, and optimization of different solar energy systems. In a recent study, Rejeb et al. [29] used the RSM technique for optimizing the design parameters of a hybrid concentrated photovoltaic/thermoelectric generator for maximizing its electrical efficiency. The results generated from the numerical model were further analyzed using RSM. The authors used four parameters as independent factors, namely the product of solar radiation and optical concentration, ambient temperature, electrical load, and leg height of thermoelectric generator, whereas the hybrid system’s efficiency was selected as the response. The authors concluded that response surface modeling is the best tool for studying the combined interactions between input factors and the desired response variable. In another study, Rejeb et al. [30] evaluated the electrical and thermal performances of a hybrid nanofluid-based photovoltaic/thermal collector using RSM. The authors determined the extent of the significance of input factors by studying the combined effect of input factors on responses. Luo et al. [31] used an improved algorithm combining successive RSM and simulated annealing for design optimization of a solar power tower consisting of 2650 heliostats located in Spain.
Despite the availability of numerous designs of CPCs for PV applications, little attention has been paid to design optimization and sensitivity analysis involving all design parameters. The present research article presents the design optimization, parametric study, and statistical modeling of CPC concentrator intended for photovoltaic applications leading to its geometric optimization, using response surface modeling technique. The initial focus during the design phase was to achieve desired concentration while still maintaining a stationary installation. The best aperture width and truncation position of CPC were identified. The effect of different truncation positions on the geometric concentration ratio was estimated. Moreover, the acceptance half-angle and receiver width were varied to observe their impact on total CPC height, entry aperture width, and concentration ratio. The synergistic influences of design factors on responses were analyzed using three-dimensional surface plots. The corresponding optimum values of the design parameters of CPC were obtained by using the statistical approach, and the results are presented in this article.
2. Materials and Methods
2.1. Design of Compound Parabolic Concentrator for PV Applications
The compound parabolic concentrator belongs to the family of reflective non-imaging concentrators. These concentrators work on the edge ray principle, which states that light rays coming from the edges of the source are focused on the edges of the receiving surface. Consequently, the intensity of solar radiation on the receiving surface is increased. The amount of solar cell material required for a given electrical output, therefore, decreases [32]. Another advantage of using a concentrated photovoltaic system is that the output electrical power increases by a factor equal to the concentration ratio of the given concentrator [33]. The CPC is generally used in solar thermal, PV, or hybrid PV/thermal systems. For solar PV applications, a CPC with a flat receiver is always used. This section focusses on the design of CPC having a flat receiver to house commercially available silicon solar cells. The proposed low-concentration photovoltaic (LCPV) concentrator is shown in Figure 1. The proposed concentrator has been designed for LCPV systems. An LCPV system, like a conventional PV module, utilizes the most sustainable energy resource on the earth surface, i.e., solar energy and converts it into electrical energy.
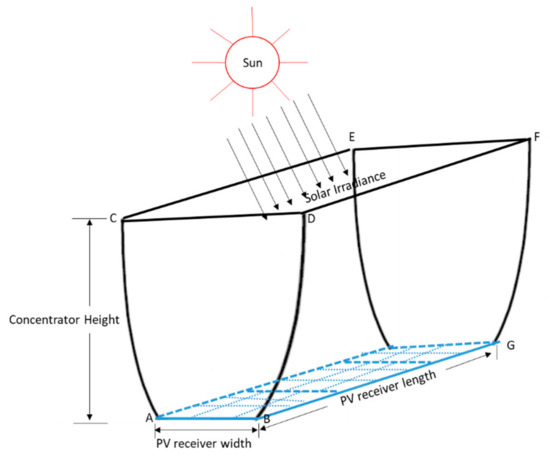
Figure 1.
The proposed low concentration PV system.
A compound parabolic concentrator usually consists of two separate reflectors having a parabolic shape, which direct the sun rays arriving at the opening facet to the outlet aperture. The right and left sides of the CPC comprise two distinct parabolic curves, with the corners of the PV module placed between the focal points of the two counterparts. The axes of the constituent parabolas are aligned away from the axis of the CPC by an angle known as acceptance half-angle (θa), which defines the angular range through which all radiations arriving at the entrance are received by CPC without maneuvering its position. In the ideal reflector, any ray entering the aperture at angles between ±θa (acceptance half-angle) will be reflected on the PV cells placed at the focus plane of the concentrators. CPCs can be classified as two dimensional or three dimensional. Another classification results due to symmetry, i.e., symmetric and asymmetric CPCs. However, all CPCs originate from symmetric 2D CPC [10]. The geometrical profile of a symmetric 2D CPC is shown in Figure 2.
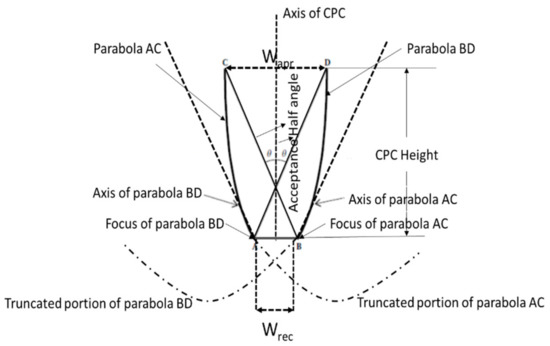
Figure 2.
Geometric profile of a 2D compound parabolic concentrator.
The concept of geometric concentration ratio was introduced to compare the eminence of concentrating solar collectors. The geometrical concentration ratio (CR) of a CPC can be described as the ratio of the span of the opening aperture (Wapr) to that of exit aperture (Wrec), as given in Equation (1).
The optical concentration ratio of an ideal compound parabolic concentrator is defined by the acceptance half-angle as given in Equation (2). It depends upon the quality of reflector surfaces forming the concentrating system. The geometric and optical concentration ratios become equal when the solar flux incident on the aperture and the receiver surface is uniform.
where θa is acceptance half-angle, ideally, any ray falling on the entry aperture within the limits of acceptance half-angle will reach the receiver either directly or after reflecting from the concentrators. However, it is not possible for any real solar concentrator to reach the theoretical boundary of concentration, as some solar radiation is lost when it falls on the reflectors. The CR for a concentrating solar collector is dependent on its geometrical characteristics and cannot be altered after the system is manufactured.
The design of the CPC concentrator involves solving the equations describing its aperture width, height, focal length, and cartesian coordinates of its reflectors [34]. To start the design process, two parameters are needed to specify the complete geometry of 2D CPC, (i) the width (Wrec) of flat receiver AB and the acceptance half-angle (θa). The entry aperture (Wapr), height (H), and focal length (F) of CPC are given by Equations (3)–(5).
The coordinates (x′, y′) of the right parabola are first determined such that the y-axis is identical with the parabola axis, and the origin lies on its focus point A. A set of (x, y) coordinates is determined in the desired coordinate system [34]. The apex of the parabola defining the right branch lies at the points given by Equations (6) and (7).
The shape of reflectors plays a consequential role in the concentration of solar radiation on the receiver surface and must be carefully selected. The set of coordinates for the right parabolic reflector are generated, starting from point B by using the Equations (8) and (9).
The coordinates of supplementary points lying on the same reflector surface are calculated by incrementing the values of x′1 and y′1 through a small variable δx as given below:
The value of the small incremental variable δx has to be guessed by the designer depending upon his choice of the smaller or more extensive set of data points for the reflector’s geometry and calculated using Equation (12).
where Wapr is the width of the entry aperture and N > 100, the (x, y) coordinates of the right branch of the CPC profile are finally determined by using Equations (13) and (14).
The solution of Equations (13) and (14) renders the data points required to generate the complete geometry of the right reflector. The left branch is a mirror image of the right unit with the coordinates given by Equation (15).
A MATLAB code was written to iteratively solve the design equations, starting from Equation (1) to (15), for generating the coordinates of the right and left reflectors of CPC. The resulting data set was used to plot the CPC profile. The CPC outline sketched through MATLAB software is shown in Figure 3.
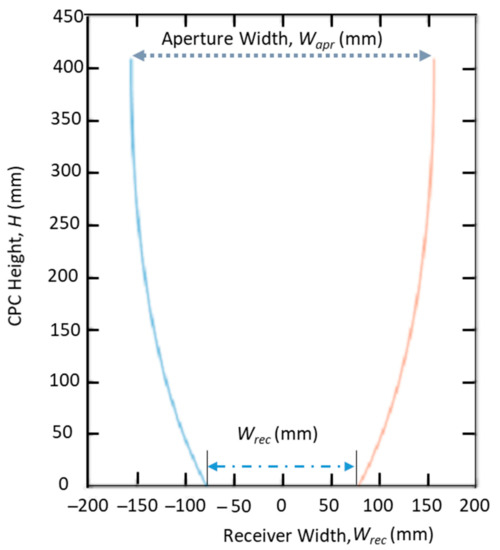
Figure 3.
MATLAB generated profile of a 2D symmetric CPC.
2.2. Truncation of CPC Reflectors
The height of CPC and the corresponding mirror area increases by increasing its concentration ratio. The ultimate consequences are increased material consumption and manufacturing expenditures. The portions of CPC that become parallel to its optical axis are contributing a small amount to the size of the entrance aperture width and CR. Hence, the geometric concentration ratio is minutely affected if we cut off or truncate these portions. The resulting truncated CPC thus requires less material while still maintaining a reasonably good concentration ratio, very close to its original or untruncated value. The decrement in geometric concentration ratio depends upon the amount of truncation, i.e., what percentage of full height has been removed. As a general rule, truncation to about 50% of fully developed height results in a good compromise between concentration ratio and mirror area [35].
In this study, an analysis was performed to investigate the relationship between the percentage of original height to be truncated, the resulting height left after truncation, reduction in aperture width, and geometric concentration ratio with truncation. It was observed that the 40–60% upper portion of the full height of CPC could be truncated without much decrement in the aperture width and concentration ratio. The concentrator designed during the present study was truncated to 50% of its original height, as shown in Figure 4. The design parameters of the CPC, before and after truncation, are summarized in Table 1.
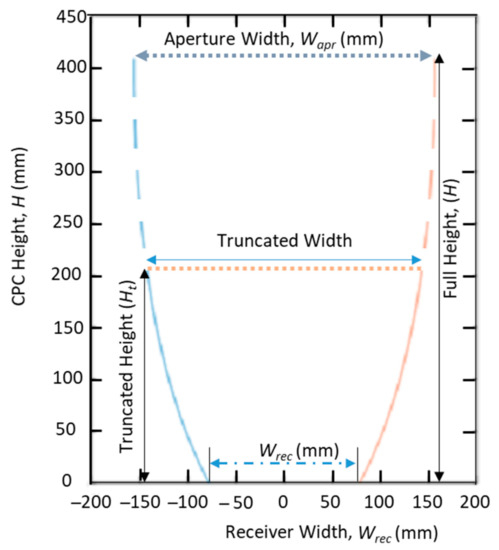
Figure 4.
Truncation of the CPC top portions.

Table 1.
Design parameters of CPC.
2.3. Design Optimization Using RSM
Multi-objective design optimization is an eminent step in the design process of various physical systems due to its noticeable impact on their performance and lifecycle cost. The design optimization method, in general, aims to search the available design space to determine the magnitude of design parameters that optimize the physical dimensions of the system subject to specific constraints. In design optimization problems, it is usually not feasible to perform experiments for evaluating the interactions between multiple factors and the desired responses of the given system [36]. On the other hand, numerical simulations-based design optimization procedure becomes time-consuming due to the possibility of having a large number of possible combinations of design factors. To reduce the number of simulations’ runs during the design optimization loop, response surface modeling-based optimization techniques have drawn the attention of researchers working in this field [37]. RSM utilizes a group of sampling points, obtained either through simulations or experiments, to approximate the system’s response within the design space. A total number of four steps are involved during the process of modeling and optimization using RSM [38]. These steps include (i) identifying the independent variables, (ii) conducting statistically designed experiments/simulations for building an approximate model, (iii) predicting the response, and (iv) performing the optimization procedure using pre-defined optimization criteria.
RSM is a blend of mathematical and statistical approaches used to explore the interrelationship amongst various independent variables and response variable(s) [39]. The applications of RSM are found in different research areas for experimental design, modeling, and optimization of multi-variate systems [40,41,42]. Originally RSM was developed to model experimental responses, but later it was also used for modeling simulation-based systems [43,44]. It is also used in design optimization problems due to its simplicity, accuracy, and improved convergence characteristics [45]. In optimization problems, the main goal of RSM is to optimize the response variables by evaluating different combinations of independent variables based on a chain of experimental designs. In RSM, the correlation between factors and responses of the given system may be expressed by linear or quadratic regression models, depending upon the nature of experimental/simulation data. A three-level fractional factorial design approach, known as face-centered central composite design (FCCCD), was employed to establish the functional correlation between design factors and responses for the geometric optimization of CPC. Equation (16) describes the model used for optimization of design parameters.
In the above Equation, y represents the response to be predicted; Xi and Xj represent independent parameters; and β0, βi, and βii are the constant, linear, and interactive coefficients, respectively, whereas βij is the quadratic coefficient. The flow chart of the procedure carried out is shown in Figure 5.
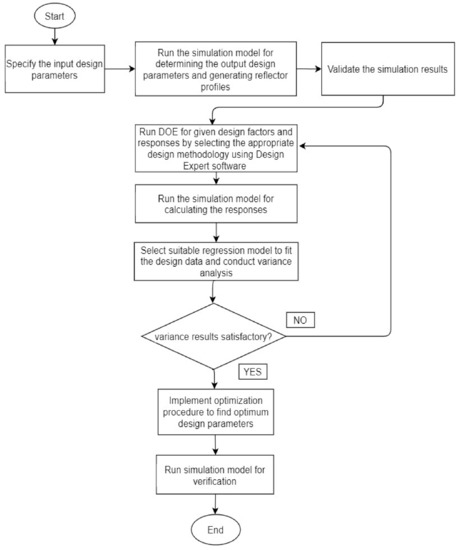
Figure 5.
Flow chart of the design optimization process.
In the present study, RSM was used for model building and subsequent geometric optimization of CPC, intended for PV applications. The receiver width and acceptance half-angle were selected as the independent design parameters, whereas concentration ratio, aperture width, and height of CPC were adopted as the response variables. The lower and upper levels for both input parameters were specified. The lower and upper levels for half acceptance angle were bound to be 20° and 40°, whereas the receiver width was altered in the range of 78 to 312 mm. During the optimization process, the independent factors were set to vary within the specified range. The optimization criteria for two responses viz. concentration ratio and aperture width were selected to be maximum, whereas CPC height was set to be minimal while carrying out the optimization. The optimization criteria, as well as lower and upper limits of design parameters, are specified in Table 2.
Table 2.
Criteria for design optimization.
The software, Design Expert 12, was used to generate the corresponding design matrix, considering two design factors and three responses. The CPC design equations were solved to insert the data in the relevant slots of the design matrix for each response. Based on the statistical evaluation, the quadratic model was found to be significant, with the value of the coefficient of determination approaching 0.92. After the model selection, 3D surface plots illustrating the correlation between design factors and responses were analyzed. These plots were used to comprehend the behavior of all the responses. Eventually, the optimization criteria for each design parameter were specified with the desired degree of importance. The subsequent surface plots indicated the optimum values of design parameters.
3. Results
3.1. Parametric Analysis
This section explores the influence of input design parameters on the geometry of the CPC collector. A parametric study was performed by varying the magnitudes of acceptance half-angle and receiver width to analyze their impact on the CR, aperture width, and height of CPC. Figure 6 exhibits the variation of height, aperture width, and concentration ratio against half acceptance angle. To accomplish this, the half acceptance angle was varied over a broad range of values starting from 10° to a maximum value of 90°. It is evident from Figure 6 that the concentration ratio and half acceptance angle have an inverse relationship between them. Having a larger half acceptance angle thus means a lower concentration ratio and vice-versa. Figure 6 also indicates that the height of CPC decreases with an increasing half acceptance angle, and so does the aperture width.
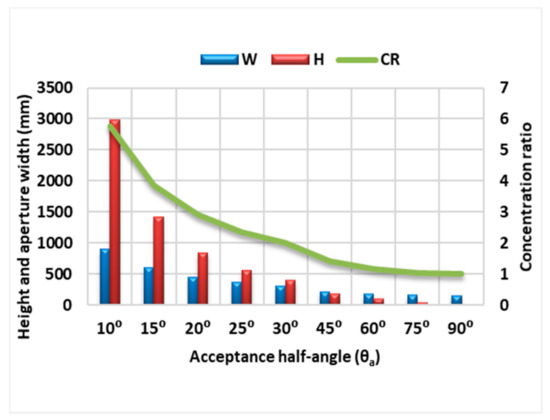
Figure 6.
Height, aperture width and CR versus acceptance half-angle of CPC.
For lower acceptance half-angles, the value of concentration ratio is large, while the height also follows a similar trend and acquires a significantly larger value. In contrast, for larger acceptance half-angles, concentration ratio and height both have miniature values. It can be concluded that the value of acceptance half-angle for CPC in the range of 20–40° is best suited for photovoltaic applications.
The variation of CPC full height and aperture width with receiver width for a fixed acceptance half-angle of 30° is shown in Figure 7. The value of the receiver width was altered from 78 to 780 mm to accommodate a larger receiver having more than one solar cell. As the receiver width is increased, the corresponding values of CPC full height and aperture width also increase, but the effect is more profound in the case of CPC height. Figure 7 shows that the height rises to a peak value of 3242 mm for the corresponding receiver width of 780 mm. The increased height means a larger concentrator size with more material consumption, which in turn increases the cost of the LCPV system. A lower value should, therefore, be preferred for the receiver width. As portrayed in Figure 7, the aperture and receiver widths of CPC are linearly associated with each other, for a given geometric CR or acceptance half-angle. For a larger size receiver, the entering aperture of CPC will become proportionately wider for collecting more solar radiation, which is desirable. However, the height parameter acts as a constraint while choosing the receiver width for a particular PV receiver. The receiver width lying in the range of 78–312 mm is expected to optimize both responses.
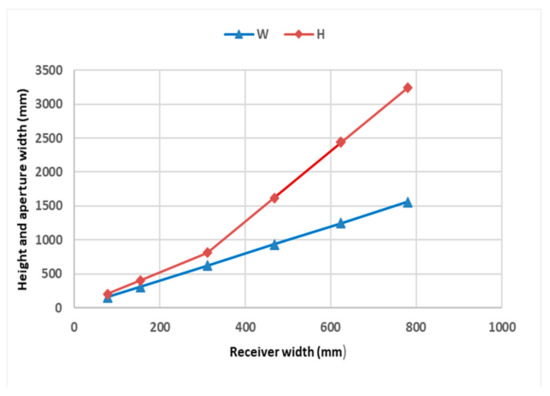
Figure 7.
CPC full height and aperture width vs. receiver width for fixed acceptance half-angle.
3.2. Effect of Truncation on CPC Height and the Corresponding CR
The variation of geometric CR and CPC height with increasing truncation level percentage is shown in Figure 8. Increasing truncation level results in reduced CPC height, thus achieving desirable material conservation. As a result, the cost to be incurred upon CPC manufacturing can be reduced significantly without sacrificing the geometric CR substantially. As depicted in Figure 8 the CR remains the same until the 30% truncation level, which means that 30% of top reflector portions can be removed without causing a reduction in the CR of the concentrator. There is a slight decrease in CR up to a truncation level of 50%. As the truncation level increases beyond 50%, the corresponding value of CR starts decreasing at a faster rate while still maintaining its value above 1.5 at 80% truncation level. Finally, beyond 90% truncation level, CR drops steeply to zero value. Similar results were reported in the literature [13] for 2D CPC with the thermal absorber.
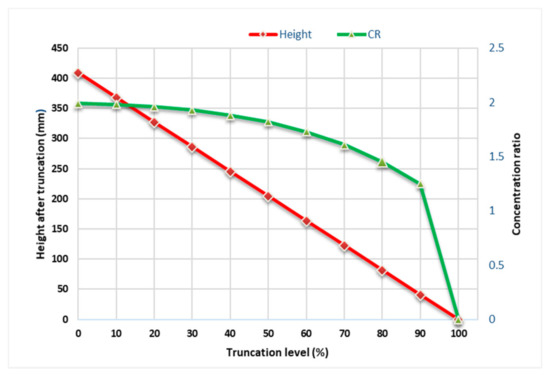
Figure 8.
Concentration ratio (CR) and height (H) vs. truncation level.
It is evident from Figure 8 that the truncation level in the range of 40–50% would only cause a slight curtailment in the magnitude of the geometric concentration ratio of CPC. In contrast, the total height would be reduced to approximately half of its original untruncated value. Consequently, the total mirror area would be reduced, causing a decrement in the cost and installation space required for CPC. The current design strategy resulted in the abatement of merely 8.5% in the geometric concentration ratio, corresponding to a truncation level of 50%.
3.3. Statistical Modeling and Analysis
The significance of both independent design factors and their interaction with each other was determined using analysis of variance. In this study, a quadratic regression model was selected for all three responses. The appropriateness of the chosen regression models was validated through the regular coefficient of determination (R2), adjusted coefficient of determination (adjusted R2), and predicted coefficient of determination (predicted R2). The fit statistics for Wapr are enlisted in Table 3. The significance of the model is evident from the values of R2 (0.98), adjusted R2 (0.95), predicted R2 (0.93), and adequate precision (60.87). Moreover, the values of adjusted R2 and predicted R2 are in proximity to each other. Adequate precision compares the predicted values, called signal, and the average prediction error called noise. The value of the signal-to-noise ratio for the proposed model is >> 4, which indicates that it is suitable for searching the design space.
Table 3.
Fit statistics for Wapr.
Besides fit statistics, the diagnostic plots offer an alternate option for validating the models by graphically depicting the adequacy and normal distribution of the model statistical data. Figure 9 shows graphically the actual and predicted values for response 1 (Wapr). The predicted and actual values for the concerned response, as depicted by the graph, are in close agreement with each other.
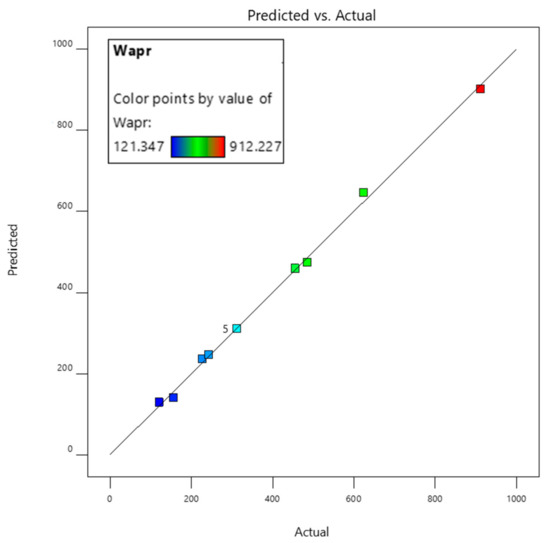
Figure 9.
Predicted versus actual values for the aperture width (Wapr).
Figure 10 shows the graph of run order versus externally studentized residuals. The distribution of data points along the run order suggests that there is no significant increase or decrease in the values predicted by the model. Only a single point lies outside of the lower critical value line, which has no noticeable effect on the performance of the selected model.
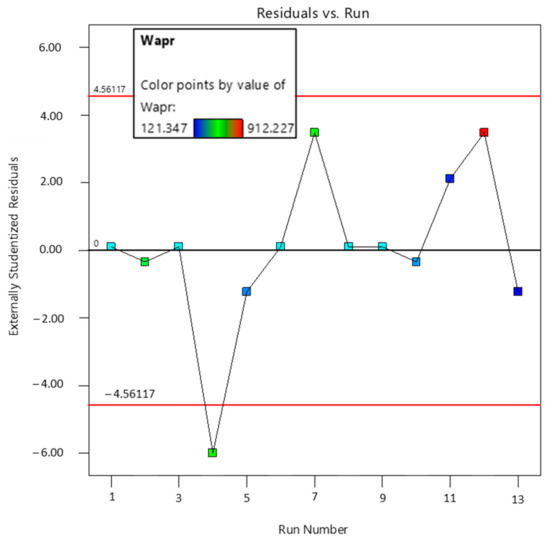
Figure 10.
Run order versus residuals plot for the aperture width (Wapr).
The fit statistical data for the second response, i.e., height (H), is given in Table 4. The values of R2, adjusted R2, and predicted R2 and adequate precision are 0.99, 0.98, 0.91, and 48.84, respectively, which indicates that the selected model for predicting the values of the height parameter is significant. The minute difference between predicted R2 and actual R2 confirms the adequacy of the chosen model. The higher value of adequate precision ensures that the model has a signal sufficient to be used in optimization.
Table 4.
Fit statistics for height (H).
The actual and predicted values for response 2 viz. height (H) are shown graphically in Figure 11. As indicated by the graph, the predicted and actual values for the concerned response are in close agreement with each other. Likewise, the actual and predicted values are very close to the fitted line, which implies that the goodness-of-fit is appreciably high for the given model.
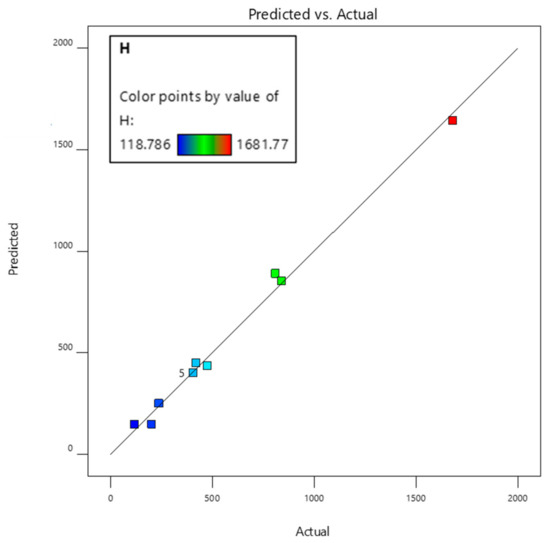
Figure 11.
Predicted versus actual values for CPC height (H).
Figure 12 shows the residuals versus run order plot for CPC height (H) and examines the goodness-of-fit of the selected regression model. The distribution of data points along the run order indicates the random scattering of data around the central line. This means that there is no apparent drift in the data collected by the model. Additionally, the test sequence of data collection has no significant effect on the data collected during the process.
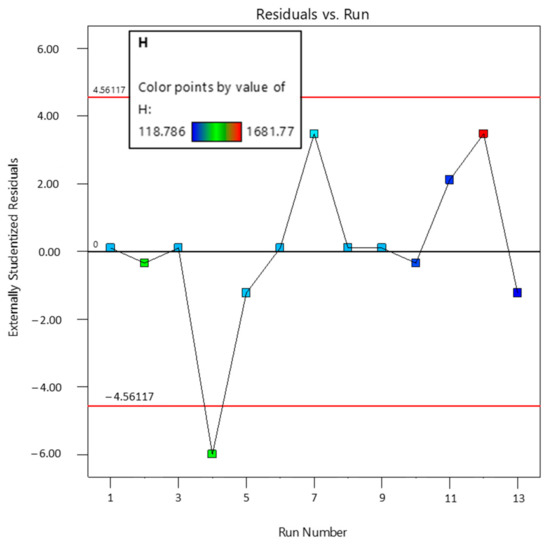
Figure 12.
Run number versus residuals plot for CPC height (H).
The fit statistical data for the third response, i.e., concentration ratio (CR), is given in Table 5. The values of R2, adjusted R2, predicted R2, and adequate precision are 0.99, 0.99, 0.98, and 90.94, respectively, which indicated that the selected model for CR is significant. The values of adjusted R2 and predicted R2 have a negligibly small difference from each other, which confirms the adequacy of the model for predicting the relevant parameter. Adequate precision is exceptionally high in this case. The model possesses a high enough signal for optimization, which is an eminently desirable feature.
Table 5.
Fit statistics for CR.
Figure 13 shows the plot of actual and predicted values for response 3 viz. concentration ratio (CR). This graph aims to expose the values that are not easily predicted by the selected model, but no such values are found in this case. As shown in Figure 13, the predicted and actual values for CR are closely related, thus validating the model.
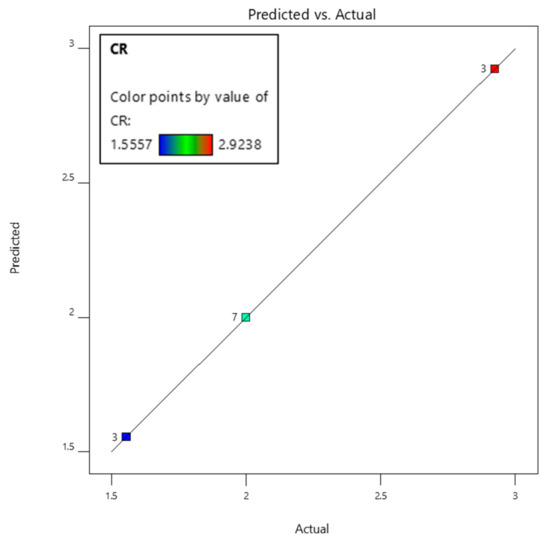
Figure 13.
Predicted versus actual values for CR.
The run order plot for response 3 (CR) is displayed in Figure 14. The distribution of data points along the run order suggests that there is no significant increase or decrease in the values predicted by the model. Most of the values are in close proximity to the central line with random scattering. No specific pattern of residuals above and below the central line is observable, in this case, which leads to the conclusion that the run order of the design process has no significant influence on the data.
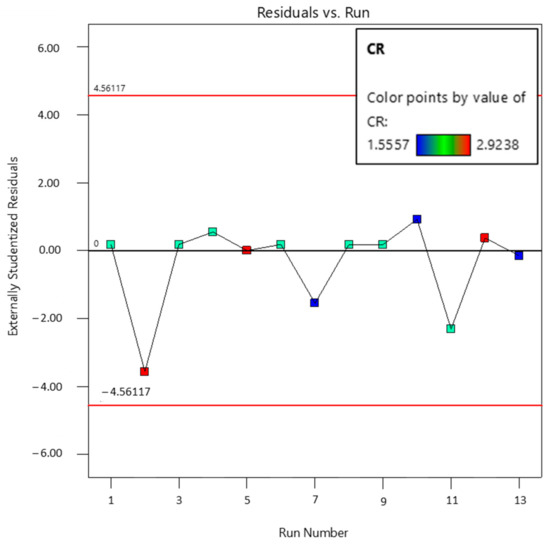
Figure 14.
Run number versus residuals plot for CR.
3.4. Geometric Design Optimization
As already concluded in Section 3.1 from parametric analysis, the acceptance half-angle and receiver width lying in the range 20–40° and 78–312 mm are expected to produce optimized CPC geometry. A further investigation is therefore required to locate the exact values of input design parameters for the optimum solution of the design process. The goal of determining the set of optimum design parameters was accomplished using a statistical technique, RSM. The simulations were performed using the software Design Expert 12. The lower and upper limits for independent parameters were specified to be 20° and 40° and 78 and 312 mm, respectively. The objectives of optimization were set to maximize CR and aperture width and to minimize the total height of CPC. The constraints imposed on the design parameters to optimize the response are listed in Table 2.
The interrelationship between the factors and the responses in RSM is best described by surface plots. A three-dimensional surface plot shows the functional relationship between the designated dependent variable and the corresponding two independent variables. The response surface plot showing the combined effects of variation of acceptance half-angle and receiver width on the height of CPC is shown in Figure 15.
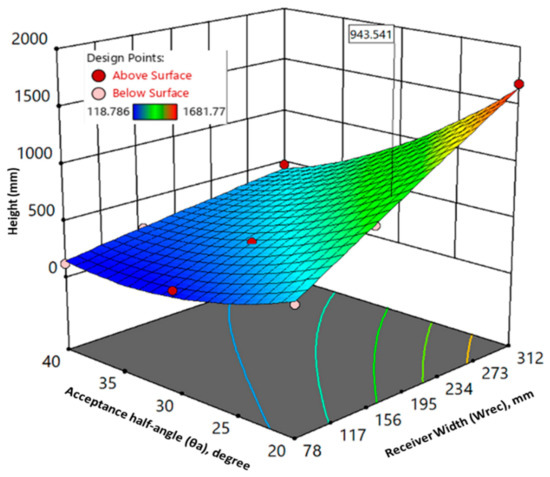
Figure 15.
The combined effect of design factors on CPC height (H).
It depicts the combined effect of variation of acceptance angle and receiver width on the resulting CPC height. As the acceptance half-angle increases, the height decreases to lower values. On the other side, as the aperture width increases, the height of CPC increases too. A trade-off between two conflicting outcomes of the response parameter can be found using the response surface modeling approach. As demonstrated in Figure 6, the optimum value of CPC height turns out to be 943.54 mm.
The synergistic effect of acceptance half-angle and receiver width on the aperture width is shown in Figure 16. The aperture width decreases with increasing acceptance half-angle. However, the amount of decrement is lesser as compared to that of height. When the receiver width increases, the aperture width follows the same pattern. According to specified optimization conditions, the optimum value of the aperture width is evaluated to be 534.218 mm.
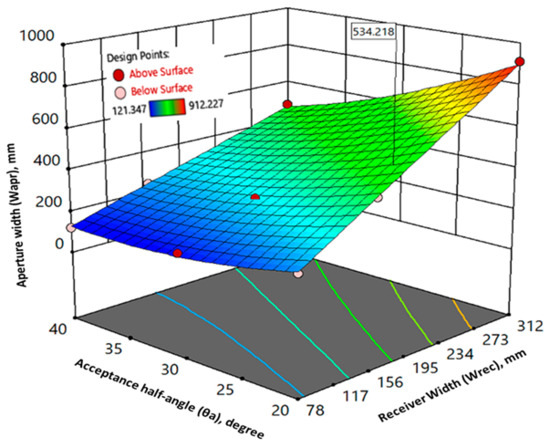
Figure 16.
The combined effect of design factors on the aperture width (Wapr).
Figure 17 demonstrates the collaborative effect of acceptance half-angle and receiver width on the CR of CPC. There exists an inverse relationship between the CR and acceptance half-angle of CPC, as demonstrated by Figure 17. Conversely, the receiver width has no significant impact on the CR of the concentrator. The optimum value of CR comes out to be 2.74, which implies a reasonable trade-off between the conflicting constraints.
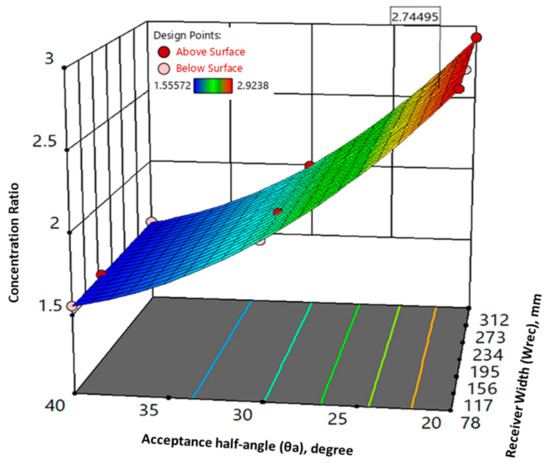
Figure 17.
Collaborative effect of factors on CR.
The optimization ramps for design parameters are shown in Figure 18. The criteria defined for optimizing the responses are depicted by each ramp. The value of one of the independent variables was bound to vary within the specified range while the other was set to be maximized. The red pointer indicates the optimum value for each factor, while the blue one disseminates the same information about the responses.
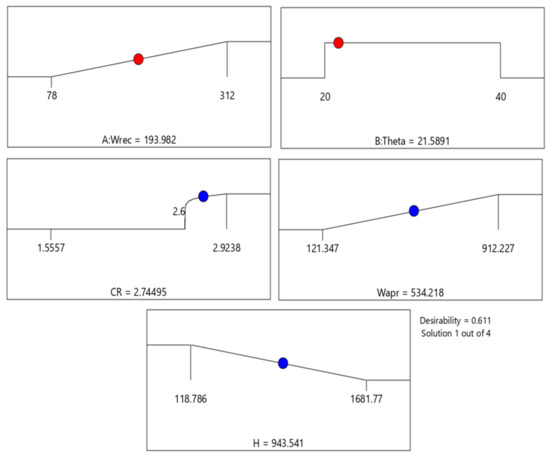
Figure 18.
Optimization criteria for factors and responses.
3.5. Discrete Effects of Factors on the Responses
The isolated impact of each design factor on the responses, i.e., aperture width, height, and CR of CPC, is given by the perturbation diagrams as demonstrated in Figure 19, Figure 20 and Figure 21 for aperture width (Wapr), height (H), and CR, respectively.
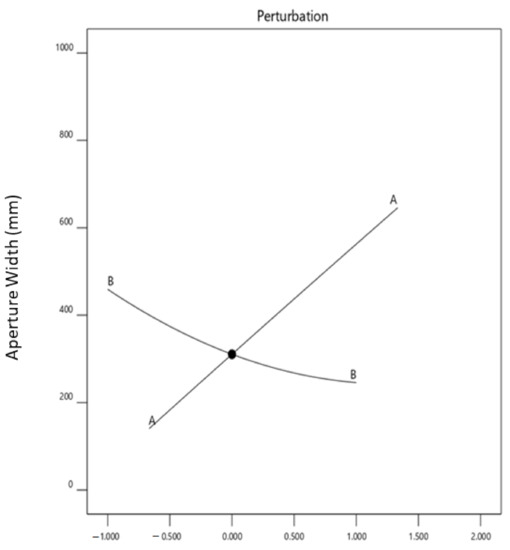
Figure 19.
Perturbation plot for the aperture width (Wapr).
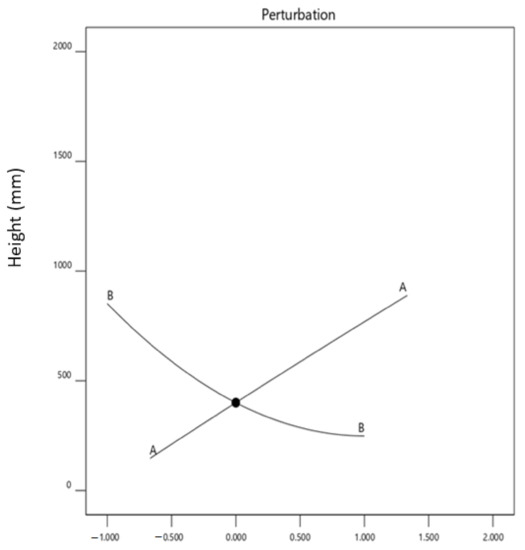
Figure 20.
Perturbation plot for CPC height (H).
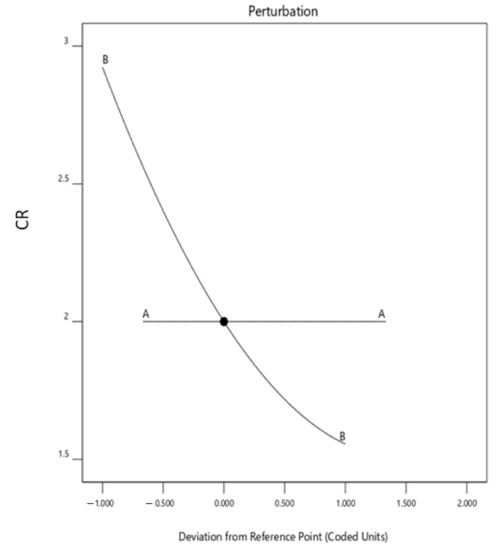
Figure 21.
Perturbation plot for the CR.
Figure 19 demonstrates the variation of aperture width as each design factor changes from its reference position while the remaining factors are kept fixed at their corresponding reference values. The sensitivity of each response to a specific factor is depicted by the slope of the relevant factor line.
The slope of the design factor “A” indicates the direct relationship between factor “A” and its corresponding response. The design factor “B” has a negative gradient, as shown in Figure 20, which confirms its inverse relationship with the relevant factor. The design factor “B” has a profound effect on the height compared to the design factor “A”.
As shown in Figure 21, the design factor line “A” has zero slopes, which confirms that it has no significant impact on the corresponding response. Contrarily, the steeper slope of design factor “B” demonstrates its conspicuous influence on the response.
After performing the detailed statistical analysis, the optimization studies were conducted based on the defined criteria for different design parameters. The optimized design parameters are enlisted in Table 6. When compared with Table 1, the optimal values of design parameters are different than initial design values. The lower value of acceptance half-angle indicates that more adjustments will be required in the CPC position for quasi-stationary applications of the concentrator. Contrarily, the designed concentrator possesses a higher concentration ratio as compared to the initial design. The optimum truncated height has almost doubled, yet this accruement is justified due to the comparatively larger size of the receiver. The optimum values of dependent design parameters were validated through simulations.
Table 6.
Optimized design parameters of CPC.
4. Conclusions
The non-imaging compound parabolic concentrators are suitable for low concentrating photovoltaic applications as they can collect both direct and diffuse radiations and do not require continuous tracking. Such collectors are also useful in thermal as well as hybrid PV/thermal applications, whereby they can supply both electricity and process heat for low to medium temperature applications. In this paper, a two-dimensional symmetric CPC with a flat receiver has been designed for PV applications. The reflector profiles were generated by developing a code in the MATLAB program that solves the mathematical equations describing the relationship between design parameters of the CPC. The concentrator was initially designed for an acceptance half-angle of 30° and receiver width of 156 mm to accommodate a single crystalline silicon solar cell. The optical concentration ratio of the resulting CPC was found to be “2×”. The effect of changes in acceptance half-angle on height and aperture width of the CPC was determined. Subsequently, the receiver width was increased to house more solar cells, and its impact on the height and aperture width of the concentrator was observed. The CPC was then truncated for different percentages of full height. The effect of truncation on the aperture width and geometric concentration ratio was evaluated to determine the optimum truncation level.
Detailed statistical analysis and successive geometric optimization were performed using the response surface modeling approach. The resulting 3D surface plots were analyzed to comprehend the combined effect of design factors on the relevant responses. It was concluded that a symmetric 2D CPC with an acceptance half-angle of 21.59° and receiver width of 193.98 mm yielded the optimum geometric dimensions for stationary low concentrating photovoltaic applications. Based on RSM analysis, a truncation level of 50% was selected, which caused only an 8.5% decrease in the geometric concentration ratio. At the same time, half of the reflector material and manufacturing cost were saved. The corresponding optimum values of concentrator height, aperture width, and CR are 471.77 mm, 509.24 mm, and 2.61, respectively, after 50% truncation. The resulting optimized geometrical profile is thereby pertinent for static concentrating solar photovoltaic collectors. Such collectors can reduce the expensive silicon solar cell area for a given electrical yield by employing comparatively low-cost optical concentrators.
Author Contributions
Conceptualization: F.M.; methodology: F.M. and J.A.; software: F.M. and M.A.A.; writing—original draft preparation: F.M.; writing—review and editing: J.A. and M.A.A.; visualization: I.E.; supervision: P.N.; project administration: P.N.; funding acquisition: P.N. All authors have read and agreed to the published version of the manuscript.
Funding
This research was funded by Universiti Teknologi PETRONAS, under the YUTP scheme having cost center 015LCO-024.
Institutional Review Board Statement
Not applicable.
Informed Consent Statement
Not applicable.
Data Availability Statement
The data presented in this study are available on request from the corresponding author.
Acknowledgments
The authors highly acknowledge the support and resources provided by Universiti Teknologi PETRONAS (UTP), Malaysia for this research.
Conflicts of Interest
The authors declare no conflict of interest.
Nomenclature
| Wrec | Width of receiver (mm) |
| Wapr | Width of aperture (mm) |
| H | Original CPC height (mm) |
| Ht | Truncated CPC height (mm) |
| Ci | Optical concentration ratio |
| F | Focal length |
| N | No. of aperture segments |
| (x0, y0) | Apex of parabola |
| (x, y) | x and y coordinated of parabola. |
| (x′, y′) | New x and y coordinates of parabola |
| Greek Symbols | |
| θc | Acceptance-half angle (°) |
| β0 | Constant coefficient |
| βi | Linear coefficient |
| βii | Interactive coefficient |
| βij | Quadratic coefficient |
| Abbreviations | |
| 2D | Two-dimensional |
| CPC | Compound parabolic concentrator |
| CR | Concentration ratio |
| LCPV | Low-concentration photovoltaic |
| RSM | Response surface modeling |
| FCCCD | Face-centered central composite design |
| DOE | Design of experiments |
References
- Novas, N.; Fernández-García, A.; Manzano-Agugliaro, F. A Simplified Method to Avoid Shadows at Parabolic-Trough Solar Collectors Facilities. Symmetry 2020, 12, 278. [Google Scholar] [CrossRef]
- Brahma, B.; Wadhvani, R. Solar Irradiance Forecasting Based on Deep Learning Methodologies and Multi-Site Data. Symmetry 2020, 12, 1830. [Google Scholar] [CrossRef]
- Rad, H.G.A.H.; Haghgou, H.R.; Sarhaddi, F. Energy and Exergy Evaluation of Multi-channel Photovoltaic/Thermal Hybrid System: Simulation and Experiment. Int. J. Eng. 2019, 32, 1665–1680. [Google Scholar]
- Mekhilef, S.; Faramarzi, S.Z.; Saidur, R.; Salam, Z. The application of solar technologies for sustainable development of agricultural sector. Renew. Sustain. Energy Rev. 2013, 18, 583–594. [Google Scholar] [CrossRef]
- Bi, Z.; Ma, J.; Pan, X.; Wang, J.; Shi, Y. ANFIS-Based Modeling for Photovoltaic Characteristics Estimation. Symmetry 2016, 8, 96. [Google Scholar] [CrossRef]
- Jaus, J.; Bett, A.W.; Reinecke, H.; Weber, E.R. Reflective secondary optical elements for fresnel lens based concentrator modules. Prog. Photovolt. Res. Appl. 2011, 19, 580–590. [Google Scholar] [CrossRef]
- Sharaf, O.Z.; Orhan, M.F. Concentrated photovoltaic thermal (CPVT) solar collector systems: Part I—Fundamentals, design considerations and current technologies. Renew. Sustain. Energy Rev. 2015, 50, 1500–1565. [Google Scholar] [CrossRef]
- Zahedi, A. Review of modelling details in relation to low-concentration solar concentrating photovoltaic. Renew. Sustain. Energy Rev. 2011, 15, 1609–1614. [Google Scholar] [CrossRef]
- Wiesenfarth, M.; Anton, I.; Bett, A.W. Challenges in the design of concentrator photovoltaic (CPV) modules to achieve highest efficiencies. Appl. Phys. Rev. 2018, 5, 041601. [Google Scholar] [CrossRef]
- Winston, R. Principles of solar concentrators of a novel design. Sol. Energy 1974, 16, 89–95. [Google Scholar] [CrossRef]
- Paul, D.I. Application of compound parabolic concentrators to solar photovoltaic conversion: A comprehensive review. Int. J. Energy Res. 2019, 43, 4003–4050. [Google Scholar] [CrossRef]
- Akhter, J.; Gilani, S.I.; Al-kayiem, H.H.; Ali, M.; Masood, F. Characterization and stability analysis of oil-based copper oxide nanofluids for medium temperature solar collectors. Mater. Werkst. 2019, 50, 311–319. [Google Scholar] [CrossRef]
- Akhter, J.; Gilani, S.I.; Al-Kayiem, H.H.; Ali, M. Optical Performance Analysis of Single Flow Through and Concentric Tube Receiver Coupled with a Modified CPC Collector Under Different Configurations. Energies 2019, 12, 4147. [Google Scholar] [CrossRef]
- Paul, D.I. Review of Mathematical Equations for the Design of Compound Parabolic Concentrating Solar Energy Collectors. Invertis J. Renew. Energy 2019, 9, 91. [Google Scholar] [CrossRef]
- Garg, H.P.; Adhikari, R.S. Optical design calculations for CPCs. Energy 1998, 23, 907–909. [Google Scholar]
- Xie, H.; Wei, J.; Wang, Z.; Yang, G.; Ma, Q. Design and performance research on eliminating multiple reflections of solar radiation within compound parabolic concentrator (CPC) in hybrid CPV/T system. Sol. Energy 2016, 129, 126–146. [Google Scholar] [CrossRef]
- Xie, H.; Wei, J.; Wang, Z.; Liu, Z.; Gao, Y.; Ma, Q.; Zhang, G. Design and performance study of truncated CPC by eliminating multiple reflections of solar radiation in hybrid CPV/T system: Highest and lowest truncation position. Sol. Energy 2016, 136, 217–225. [Google Scholar] [CrossRef]
- Khalid, M.; Wei, J.; Zhang, G.; Xie, H.; Fang, J.; Qaisrani, M.A.; Wang, Z.; Rehman, M.-U. Optical performance of quasi-stationary, low-concentration, and low-profile compound parabolic concentrators. J. Renew. Sustain. Energy 2019, 11, 053701. [Google Scholar] [CrossRef]
- Hadavinia, H.; Singh, H. Modelling and experimental analysis of low concentrating solar panels for use in building integrated and applied photovoltaic (BIPV/BAPV) systems. Renew. Energy 2019, 139, 815–829. [Google Scholar] [CrossRef]
- Lee, H.-G.; Rao, S.S. Uncertain Analysis of a Stationary Solar Compound Parabolic Concentrator PV Collector System Using Fuzzy Set Theory. J. Renew. Energy 2018, 2018, 1–12. [Google Scholar] [CrossRef]
- Tian, M.; Su, Y.; Zheng, H.; Pei, G.; Li, G.; Riffat, S. A review on the recent research progress in the compound parabolic concentrator (CPC) for solar energy applications. Renew. Sustain. Energy Rev. 2018, 82, 1272–1296. [Google Scholar] [CrossRef]
- Mallick, T.K.; Eames, P.C.; Norton, B. Power losses in an asymmetric compound parabolic photovoltaic concentrator. Sol. Energy Mater. Sol. Cells 2007, 91, 1137–1146. [Google Scholar] [CrossRef]
- Hossain, R.M.E.; Dzulkipli, A.F.; Rahman, K.A.A. Solar Cell Efficiency Improvement Using Compound Parabolic Concentrator and an Implementation of Sun Tracking System. In Proceedings of the 11th International Conference on Computer and Information Technology, Khulna, Bangladesh, 25–27 December 2008. [Google Scholar]
- Hossain, R.M.E.; Al, A. Efficiency Improvement of Solar Cell Using Compound Parabolic Concentrator and Sun Tracking System. In Proceedings of the IEEE Power and Energy Conference, Vancouver, BC, Canada, 6–7 October 2008. [Google Scholar]
- Yang, D.Q.; Yang, C.M.; Yuan, J.S. Experimental Study on Solar Photovoltaic System with Compound Parabolic Concentrator. Mater. Sci. Forum 2009, 610–613, 357–361. [Google Scholar] [CrossRef]
- Paul, D.I. Optical performance analysis and design optimisation of multisectioned compound parabolic concentrators for photovoltaics application. Int. J. Energy Res. 2018, 43, 358–378. [Google Scholar] [CrossRef]
- Lee, J.L.K.; Mazor, B.A.; Forrest, R.S. Epitaxial Lift-Off Processed GaAs Thin-Film Solar Cells Integrated with Low-Cost Plastic Mini-Compound Parabolic Concentrators; IEEE: Piscatway, NJ, USA, 2014. [Google Scholar]
- Baños, R.; Manzano-Agugliaro, F.; Montoya, F.G.; Gil, C.; Alcayde, A.; Gómez, J. Optimization methods applied to renewable and sustainable energy: A review. Renew. Sustain. Energy Rev. 2011, 15, 1753–1766. [Google Scholar] [CrossRef]
- Rejeb, O.; Shittu, S.; Ghenai, C.; Li, G.; Zhao, X.; Bettayeb, M. Optimization and performance analysis of a solar concentrated photovoltaic-thermoelectric (CPV-TE) hybrid system. Renew. Energy 2020, 152, 1342–1353. [Google Scholar] [CrossRef]
- Rejeb, O.; Ghenai, C.; Jomaa, M.H.; Bettayeb, M. Statistical study of a solar nanofluid photovoltaic thermal collector performance using response surface methodology. Case Stud. Therm. Eng. 2020, 21, 100721. [Google Scholar] [CrossRef]
- Luo, Y.; Hu, Y.; Lu, T. Efficient optimized design of solar power tower plants based on successive response surface methodology. Int. J. Low-Carbon Technol. 2019, 14, 475–486. [Google Scholar] [CrossRef]
- Ralph, E.L. Use of concentrated sunlight with solar cells for terrestrial applications. Sol. Energy 1966, 10, 67–71. [Google Scholar] [CrossRef]
- Li, G.; Xuan, Q.; Akram, M.W.; Akhlaghi, Y.G.; Liu, H.; Shittu, S. Building integrated solar concentrating systems: A review. Appl. Energy 2020, 260, 114288. [Google Scholar] [CrossRef]
- O’Gallagher, J.J. Nonimaging Optics in Solar Energy. Synth. Lect. Energy Environ. Technol. Sci. Soc. 2008, 2, 1–120. [Google Scholar] [CrossRef]
- Rabl, A. Comparison of solar concentrators. Sol. Energy 1976, 18, 93–111. [Google Scholar] [CrossRef]
- Unal, R.; Lepsch, R.; Engelund, W.; Stanley, D. Approximation model building and multidisciplinary design optimization using response surface methods. In Proceedings of the 6th Symposium on Multidisciplinary Analysis and Optimization, Bellevue, WA, USA, 4–6 September 1996. [Google Scholar]
- Wang, B.P.; Han, Z.X.; Xu, L.; Reinikainen, T. A Novel Response Surface Method for Design Optimization of Electronic Packages. In Proceedings of the 6th International Conference on Thermal, Mechanical and Multi-Physics Simulation and Experiments in Micro-Electronics and Micro-System, Berlin, Germany, 18–20 April 2005. [Google Scholar]
- Zahid, M.; Shafiq, N.; Isa, M.H.; Gil, L. Statistical modeling and mix design optimization of fly ash based engineered geopolymer composite using response surface methodology. J. Clean. Prod. 2018, 194, 483–498. [Google Scholar] [CrossRef]
- Alam, M.A.; Hamdan, H.Y.; Azeem, M.; Hussain, P.B.; bin Salit, M.S.; Khan, R.; Arif, S.; Ansari, A.H. Modelling and optimisation of hardness behaviour of sintered Al/SiC composites using RSM and ANN: A comparative study. J. Mater. Res. Technol. 2020, 9, 14036–14050. [Google Scholar] [CrossRef]
- Memon, A.M.; Sutanto, M.H.; Napiah, M.; Khan, M.I.; Rafiq, W. Modeling and optimization of mixing conditions for petroleum sludge modified bitumen using response surface methodology. Constr. Build. Mater. 2020, 264, 120701. [Google Scholar] [CrossRef]
- Khan, M.I.; Sutanto, M.H.; Napiah, M.B.; Khan, K.; Rafiq, W. Design optimization and statistical modeling of cementitious grout containing irradiated plastic waste and silica fume using response surface methodology. Constr. Build. Mater. 2020, 271, 121504. [Google Scholar] [CrossRef]
- Czyrski, A.; Jarzębski, H. Response Surface Methodology as a Useful Tool for Evaluation of the Recovery of the Fluoroquinolones from Plasma—The Study on Applicability of Box-Behnken Design, Central Composite Design and Doehlert Design. Processes 2020, 8, 473. [Google Scholar] [CrossRef]
- Yalçınkaya, Ö.; Bayhan, G.M. Modelling and optimization of average travel time for a metro line by simulation and response surface methodology. Eur. J. Oper. Res. 2009, 196, 225–233. [Google Scholar] [CrossRef]
- Zahraee, S.M.; Rohani, J.M.; Wong, K.Y. Application of computer simulation experiment and response surface methodology for productivity improvement in a continuous production line: Case study. J. King Saud Univ. Eng. Sci. 2018, 30, 207–217. [Google Scholar] [CrossRef]
- Kalkan, C.; Ezan, M.A.; Duquette, J.; Balaman, Ş.Y.; Yilanci, A. Numerical study on photovoltaic/thermal systems with extended surfaces. Int. J. Energy Res. 2019, 43, 5213–5229. [Google Scholar] [CrossRef]


Publisher’s Note: MDPI stays neutral with regard to jurisdictional claims in published maps and institutional affiliations. |
© 2021 by the authors. Licensee MDPI, Basel, Switzerland. This article is an open access article distributed under the terms and conditions of the Creative Commons Attribution (CC BY) license (http://creativecommons.org/licenses/by/4.0/).