Article

Spatiotemporal Variations in Water Flow and Quality in the Sanyang Wetland, China: Implications for Environmental Restoration

1
State Key Laboratory of Simulation and Regulation of Water Cycle in River Basin, China Institute of Water Resources and Hydropower Research, Beijing 100038, China
2
Department of Water Environment, China Institute of Water Resources and Hydropower Research, Beijing 100038, China
3
State Key Laboratory of Hydraulics and Mountain River Engineering, Sichuan University, Chengdu 610066, China
*
Authors to whom correspondence should be addressed.
Sustainability 2021, 13(9), 4637; https://doi.org/10.3390/su13094637
Submission received: 1 February 2021 / Revised: 26 March 2021 / Accepted: 2 April 2021 / Published: 21 April 2021

Abstract

:
Spatiotemporal modeling of wetland environments’ hydrodynamics and water quality characteristics is key to understanding and managing these ecologically important areas’ physical and environmental properties. We developed a two-dimensional numerical model based on the MIKE 21 module to analyze flow and pollution dynamics in the island-dominated Sanyang wetland of eastern China. Three simulation periods representing annual precipitation cycles were used to model freshwater discharge and water quality in the wetland. The results showed that the flow velocity in the study area had hydrodynamic characteristics typical of such a setting, with an average monthly flow velocity ranging from 0.01 to 0.04 m/s, contributing to an increased risk of serious eutrophication. The water quality problems (represented by ammonia nitrogen, NH3-N, and total phosphorus, TP, levels) peaked during the early summer peak rain season, followed by a gradual decline during a later flood period and the lowest values during the fall/winter dry period. Moreover, the spatial distribution of NH3-N and TP levels decreased from northwest to east, reflecting the influence of a highly polluted source. Our results provide a useful context for restoration efforts in the Sanyang wetland and other similar areas.

1. Introduction

Wetlands, sometimes described as “the kidneys of the landscape” [1,2], play an important role in providing ecological services to both humans and wildlife. These include shelter, habitats, food, protection from catastrophic flooding, irrigation, and carbon sequestration [3,4,5]. However, wetlands have rapidly degraded globally due to intensifying anthropogenic activities, such as pollutant loading from agricultural practices and industrial wastewater discharge [6,7]. The development of new, powerful, and data-based techniques is fundamental to urgent wetland restoration efforts.
Rapidly developing computer technology, databases, and information/image analysis techniques have been applied to the planning and restoration of new and degraded wetlands. For example, Klemas [8] reviewed remote sensing techniques used in wetland management and found that analysis of satellite and aircraft imagery, combined with on-the-ground observations, allowed researchers to accurately and cost-effectively determine short-term changes and long-term trends in wetland vegetation and hydrology. Weston et al. [9] used GIS (Geographic Information System) to optimize hydraulic analysis of macro- and micro-scale flow paths for wetland restoration, showing that this approach was capable of developing a useful representation of physical sites for further modeling. Huang et al. [10] used remote sensing and GIS techniques to determine regions most suited for wetland preservation/restoration. This approach was especially helpful in guiding the conversion of farmland to wetland. However, although many studies have shown that hydrology is a critical factor in wetland restoration, the hydrodynamics and water quality characteristics of many wetlands are not clearly defined or understood due to limited datasets for numerical modeling.
Traditional methods used to investigate the spatiotemporal characteristics of water quality are based on field measurements and laboratory analysis, but such data are often limited in scope while being time-consuming and costly to collect. Thus, various numerical models have been developed to study the hydrodynamic and environmental characteristics of wetlands and lakes. For instance, Somes et al. [11] developed a two-dimensional depth-averaged model based on MIKE 21 to examine factors controlling flow in different wetland zones. This approach was capable of reproducing wetland flow distributions far more efficiently than field investigations could. Hossainzadeh et al. [12] studied the spatiotemporal distribution characteristics of wetland chemical oxygen demand using the MIKE 21 hydrodynamic and pollutant convection diffusion model. Gargallo et al. [13] developed a mechanistic model for treating eutrophic water in free water surface constructed wetlands to simulate the removal of total suspended sediment and its relationship to phytoplankton and total phosphorus (TP). Wester et al. [14] proposed an enhanced quasi-two-dimensional modeling strategy that can accurately simulate river and wetland dynamics for large wetland areas to better understand their hydrodynamics. Dou and Jia [15] established a two-dimensional hydrodynamic and water quality coupling model by using MIKE 21 to evaluate different engineering measures aimed at improving wetland water quality.
Although such research has verified that numerical models improve the scientific understanding of water quality variations in different types of wetlands, few studies have reported on the spatiotemporal characteristics of water quality in highly channelized wetlands with many islands. In this study, we focused on the island-dominated Sanyang wetland in coastal China, using a two-dimensional hydrodynamic and water quality MIKE 21 model to investigate the unique hydrodynamic characteristics of this distinct setting and better define the area’s spatiotemporal distribution of water quality. Our study made up for the deficiency of previous studies in the spatial and temporal characteristics of water quality in highly channelized wetland with many islands. It provides an example for the research on water quality characteristics of the similar island-dominated wetlands around the world. At the same time, it can also help to identify the influencing factors of water quality deterioration in the management of these wetlands, and provide a scientific context for further local wetland management.

2. Materials and Methods
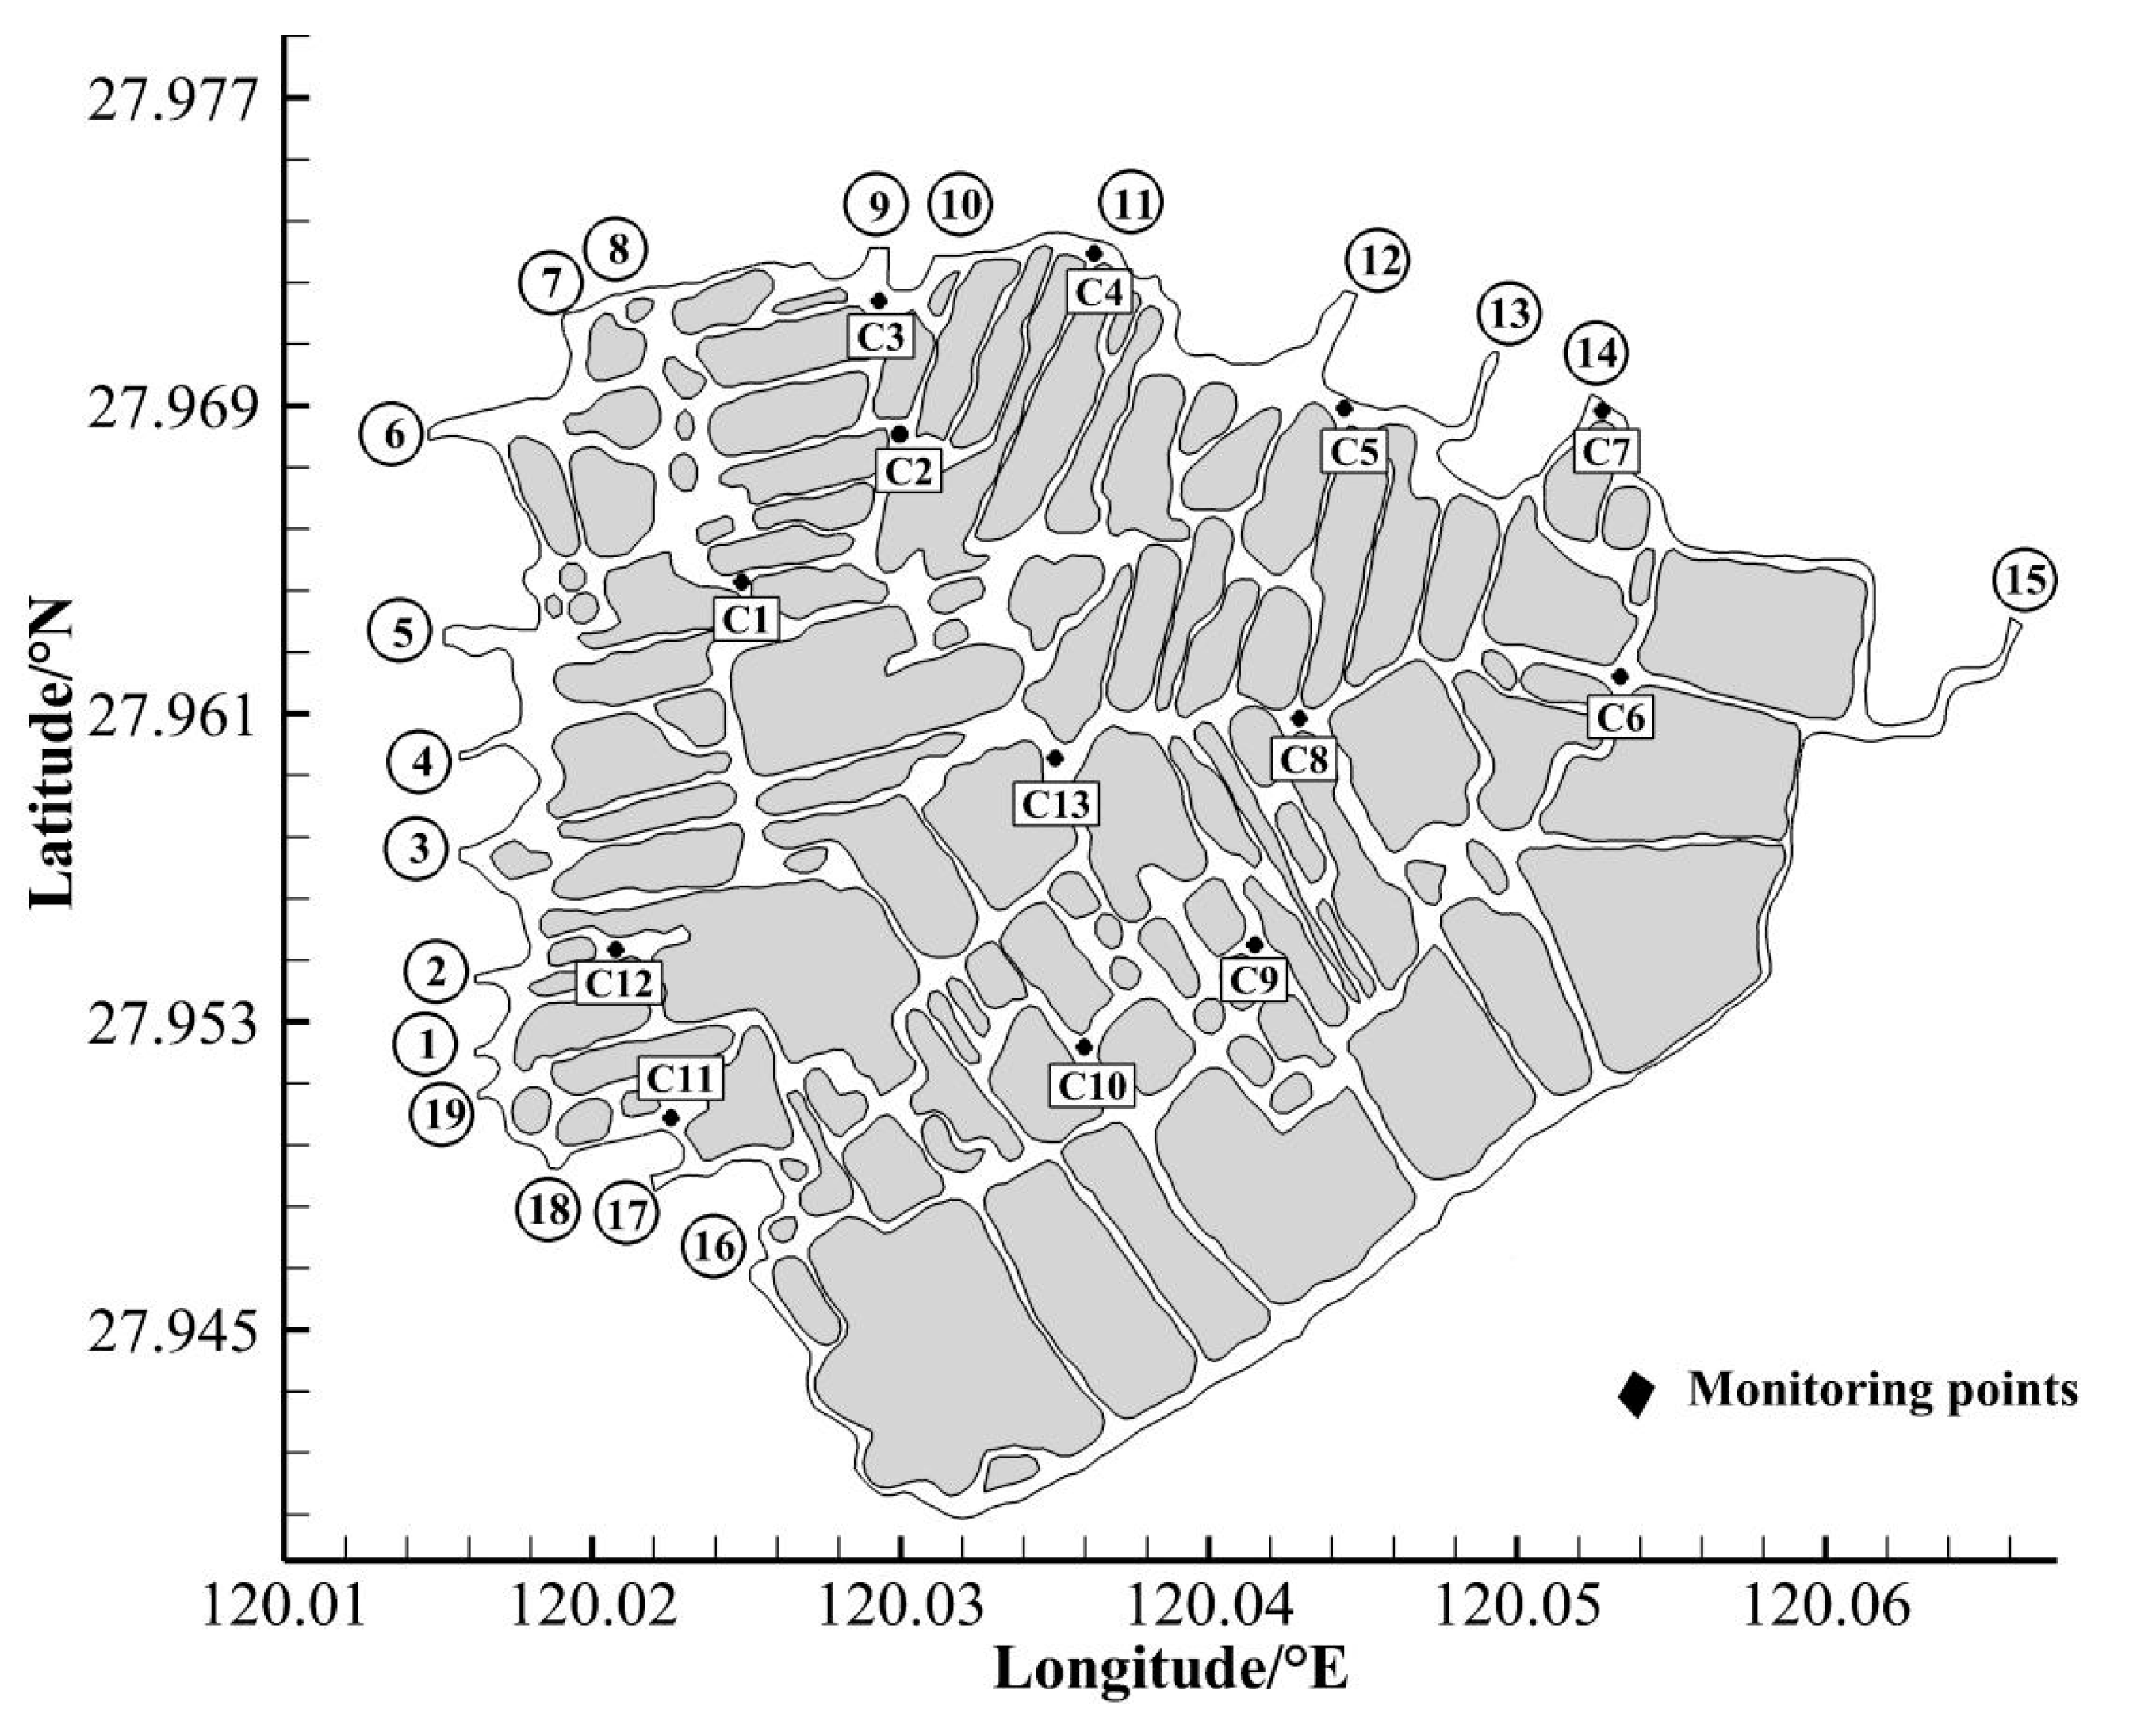
2.1. Study Area

The Sanyang wetland (120°40′–120°44′ E and 27°56′–27°58′ N, Figure 1) is located in the southeastern region of Wenzhou City, Zhejiang Province, a location that is well-known for its fast economic development over the last two decades. The wetland area covers ~12.5 km2, and there are about 161 islands in the complex river network. The average water depth is ~2.5 m with a flat bed gradient. In terms of biodiversity, there are 83 families and 168 species in the wetlands. The number of woody plant species is about 106, and most aquatic plants are emerged plants. The Sanyang wetland is generally called the West Lake Cultural Landscape of Wenzhou, as it plays an important role for local people, such as providing sightseeing opportunities and edible fruits. The potential value of the Sanyang wetland has been estimated at 55,332 yuan ha−1 yr−1 [16]. However, with rapid economic development, a large amount of pollutants from agriculture and industry has been discharged into the wetland, and the wetland environment has been severely damaged [17].
The region is located in a subtropical monsoon climate zone with alternating winter and summer monsoons. It has a moderate climate, sufficient sunshine, four distinct seasons, abundant rainfall (annual precipitation and evaporation are 1113–2494 mm and 1468.7 mm, respectively), and is occasionally impacted by typhoons, heavy rain, and floods. The peak rain season in late spring and early summer (April 16 to July 15) typically has the largest number of consecutive precipitation days in the year. The flood period in summer and autumn (July 16 to October 15), which is dominated by Pacific subtropical high pressure, has the highest rainfall. The dry period from October 16 to April 15 is controlled by cold high pressure. The frost-free period is 226–241 days, and the annual amount of sunshine ranges between 1442–2264 h.

2.2. Numerical Models

Sanyang wetland is a large shallow water wetland; the water vertical mixing is relatively uniform, the uneven distribution of space plane is more significant. Therefore, in order to reflect the overall variation characteristics of water quality in the study area, a two-dimensional mathematical equation with average water depth is used to describe the characteristics of water quality movement in Sanyang wetland. In this study, MIKE 21 model was selected to construct the mathematical model of water environment in Sanyang wetland. The MIKE 21 model is a widely used hydrodynamic model [18], and it was developed by the Danish Hydraulic Institute. The model is based on the cell-centered finite volume method, preferring the unstructured flexible mesh approach using triangular grid elements over a fixed grid system (i.e., quadrilateral elements of equal dimensions). It has the ability to provide variable grid resolutions to represent the much smaller dimensions of the study area. It includes hydrodynamic, transport, ecological/oil spill, particle tracking, mud transport, sand transport, and inland flooding modules [19]. MIKE 21 can allow longer strides, which can greatly reduce the calculation time when the accuracy is not high. In this study, MIKE 21 model is preferred to simplify the modeling process, ensure the robustness of the simulation method, and reduce the cost of simulation calculation.

2.2.1. Equations

The mathematical model was based on the shallow-water equations of the two-dimensional numerical solution method and the Navier–Stokes equations of the three-dimensional incompressible Reynolds value uniformity. This approach is subject to the Boussinesq hypothesis and the assumption of hydrostatic pressure. The finite volume and computational grid unstructured methods were used in the mathematical model along with a flexible boundary surface and dynamic complex terrain. The following equations were used:
(1) Hydrodynamic control equations:
Continuous equation:
ξ t + P x + q y = d t
Momentum equations:
p t + x ( p 2 h ) + y ( p q h ) + g h ξ x + g p p 2 + q 2 C 2 h 2 1 ρ w x h τ x x + y h τ x y Ω q f V V x + h ρ w x p a = 0
p t + y ( p 2 h ) + x ( p q h ) + g h ξ y + g p p 2 + q 2 C 2 h 2 1 ρ w y h τ y y + x h τ x y Ω q f V V y + h ρ w y p a = 0
(2) Water quality equation:
h C t + u h C x + v h C y = x h E x C x + y h E y C y + F C + S
where h ( x , y , t ) is the water depth (m); d ( x , y , t ) is the water depth variation over time (m); ξ ( x , y , t ) is the free surface elevation; p , q ( x , y , t ) are the discharge per unit width in the x and y directions (m3/s∙m), respectively; g is the gravitational acceleration (m/s2); C ( x , y ) is the Chezy resistance (m1/2/s); f = 2 Ω sin ϕ is the Coriolis force coefficient (Ω is the angular velocity of earth rotation, and ϕ is the latitude of Earth); V is the flow velocity (m/s); u , v are the mean flow velocity along the water depth in the x and y directions (m/s), respectively; V x , V y are the flow velocity components in the x and y directions (m/s), respectively; Ω ( x , y ) is the coefficient of the Coriolis force; ρ w is the water density (kg/m3); P a ( x , y , t ) is the atmospheric pressure (kg/m∙s); x and y make up the cartesian coordinate system; τ x x , τ x y , τ y y are the tangential stresses; C is the pollutant concentration (mg/L); E x , E y are the turbulent diffusion coefficient and dispersion coefficient in the x and y directions (m/s2), respectively; S are the source or sink terms for flow; and F ( C ) is the biochemical reaction.

2.2.2. Conditions and Parameters

Conditions and parameters were set default, and the observational data are as follows:
(1) Boundary conditions:
Rivers feeding and draining the wetland respectively represent sources and sinks of water and pollution. To simplify and shorten the computational time, 19 main rivers (Table 1, Figure 2) were selected for use in the model with reference to the continuity equation and mass conservation equation of pollutants. The location of these rivers with reference to the study’s monitoring and analysis points is shown in Figure 2.
(2) Initial conditions:
The initial water level, discharge, and water quality were determined from 2016 monitoring data. The initial velocity of the flow field was set to zero, the initial water level was set to 4.7 m, and the initial concentrations of ammonia nitrogen (NH3-N) and TP were set to 5.2 and 0.31 mg/L, respectively.
(3) Hydraulic parameters:
The critical Courant–Friedrichs–Lewy condition was set as 0.8 to ensure stable operation of the model. The Manning number in the rivers, determined by the sediment particle size and water depth of the river bed, was set to 38 m1/3/s. The eddy viscosity coefficient was calculated using the Smagorinsky formula, where the Smagorinsky factor, Cs, was set as 0.28.
The Smagorinsky formula:
τ i j - 1 3 τ k k δ i j = 2 μ t S i j ¯
μ t = C s Δ 2 S ¯
S i j ¯ = 1 2 u i ¯ x j ¯ + u j ¯ x i ¯ , S ¯ = 2 S i j ¯ S i j ¯ , Δ = Δ x Δ y Δ z
C s = 1 π 2 3 C k 3 4
where μ t is the turbulent viscosity at sublattice scale; Δ i is the mesh dimensions along axis i; C s is the Smagorinsky factor; C k is Kolmogorov constant.
Water levels between the water and land boundaries can be determined by the difference between dry and flood conditions. If the calculated water level had a good fit with the observed level, it was used in the calculation; otherwise, it was discarded. The dry, flood, and wetting depths were set to 0.005, 0.05, and 0.1 m, respectively.
The wind friction coefficient is a weak function of wind speed. For medium and strong winds in open seas, a value of 0.0026 produces good results, but, for gentler breezes, a smaller coefficient is needed. If wind speed changes are included in a model, the friction coefficient must be set as a change coefficient. In this case, as the average wind speed in the area is 2.3 m/s, the friction coefficient was set as 0.0026.
(4) Water quality parameters:
The degradation coefficients KNH3-N and KTP of NH3-N and TP were drawn from results for similar wetlands and set to 0.0069/d and 0.001/d, respectively, according to previous studies in similar wetlands [20,21,22,23].

2.3. Model Validation

2.3.1. Hydrodynamic Model Validation

The hydrodynamic parameters were calibrated and verified by the measured water level data from the Sanyang wetland. The water level monitoring point C13 (Figure 2) is the only water level monitoring point in this area, so we selected this point for the verification of observed and simulated water level values (Figure 3). Due to the limitation of data collection, the calibration time we choose is from 1 January to 31 December 2016. The relative error ( δ ) was selected to evaluate the fitting effect of the simulated and measured values.
δ = Δ / L × 100 %
where δ is the relative error; Δ is the absolute error; L is the true value.
The result shows that δ = 0.03 % in the validation of water level. This suggests that the model produced a well-fitted curve which could accurately reflect the hydrodynamic characteristics of the Sanyang wetland and be confidently used for further water quality simulations.

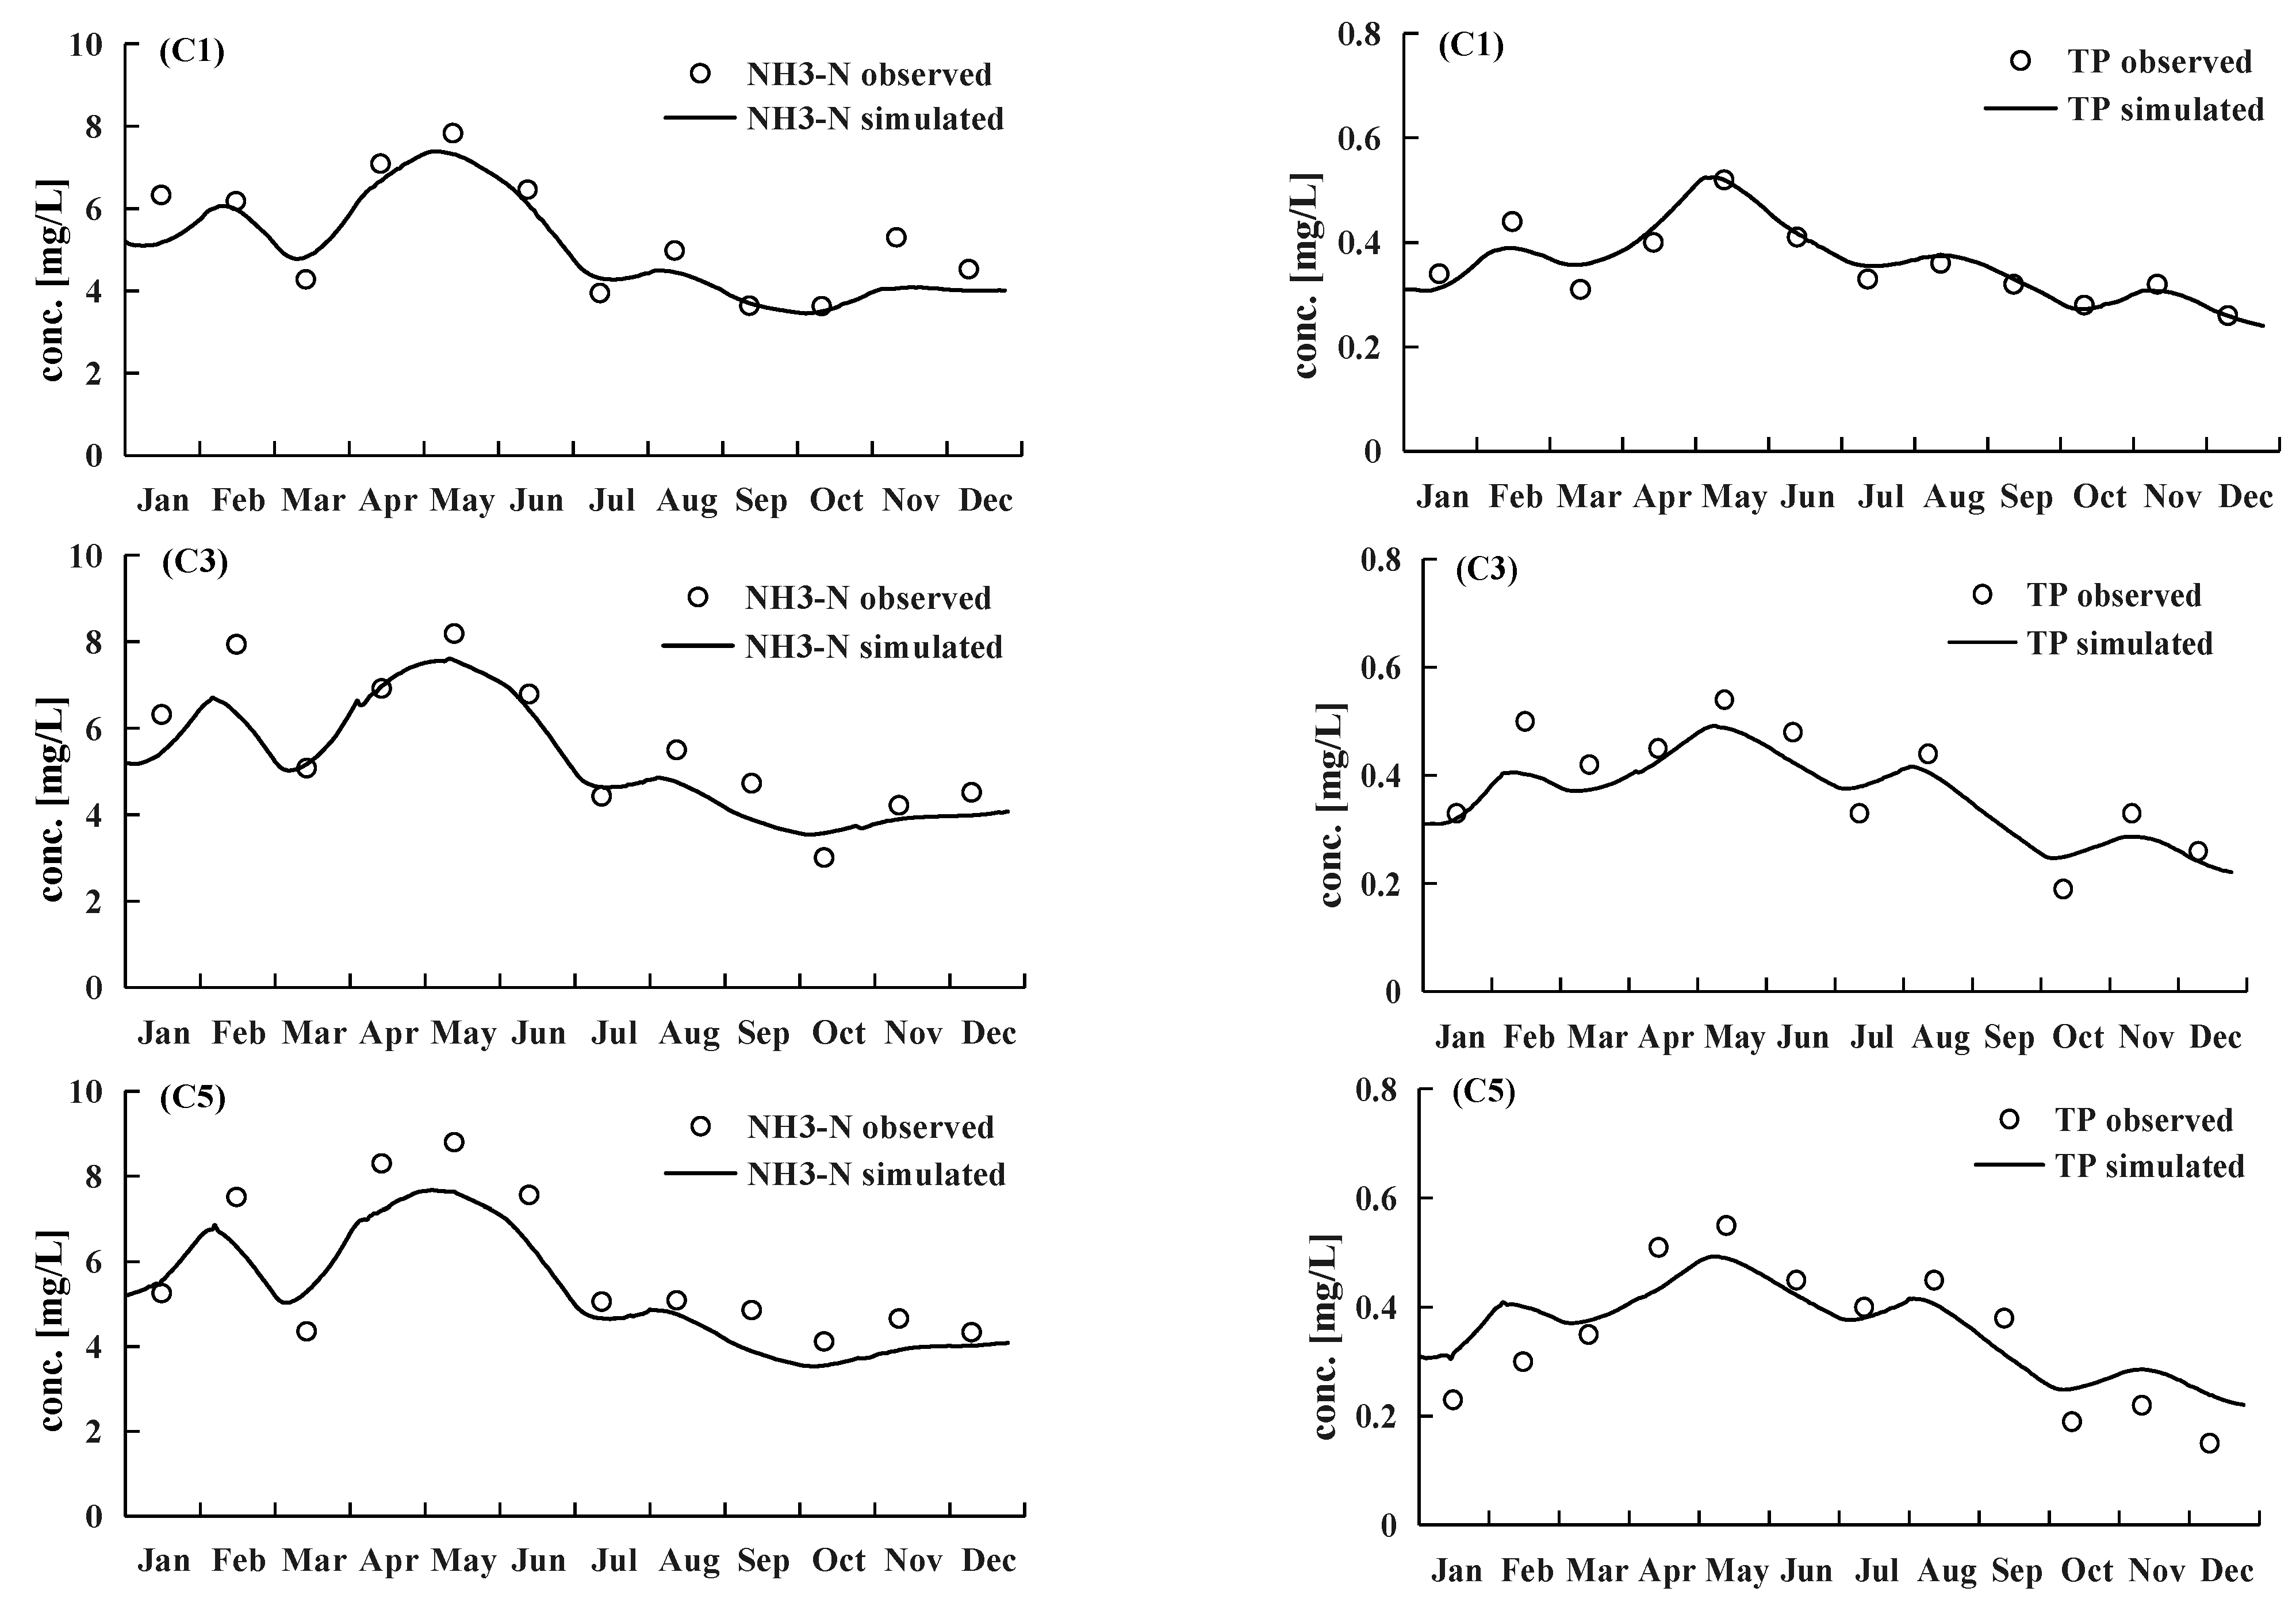
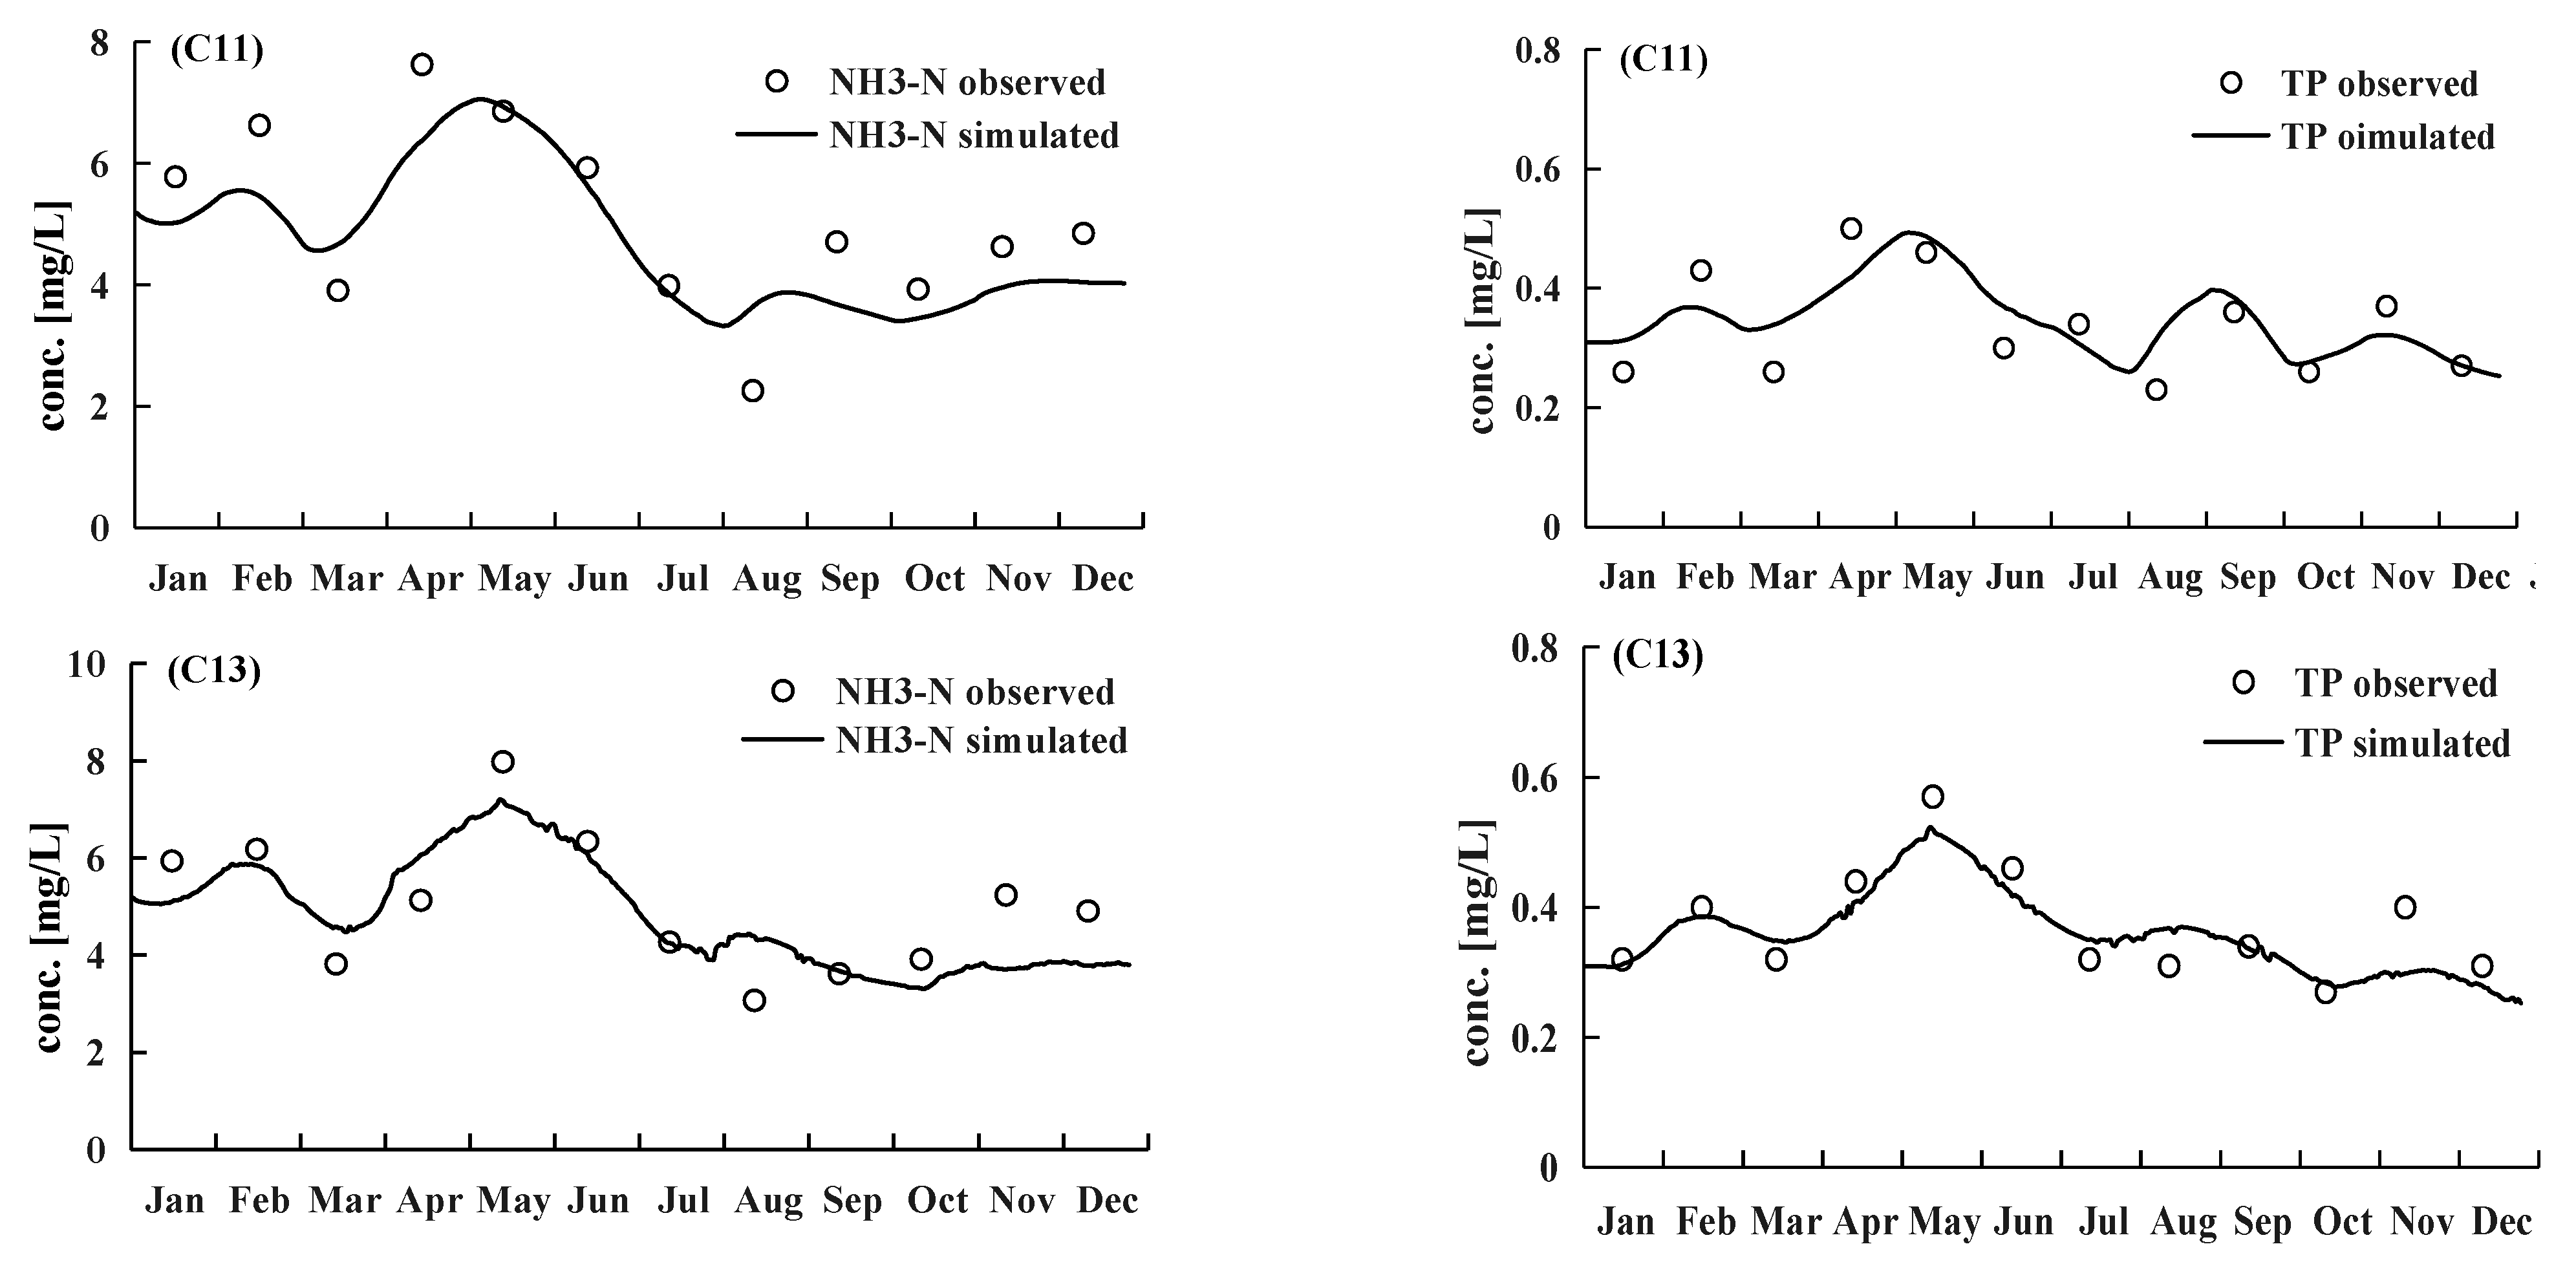
2.3.2. Water Quality Model Verification

The observed and simulated values for NH3-N and TP throughout 2016 were verified at points C1, C3, C5, C11, and C13 with an error level below 20% (Figure 4). These points were selected because they each represent a direction so that makes sure that all directions are covered. The calculation results of relative error in the validation of water quality shows in the Table 2.
The relative error of each point is basically controlled within 20%, suggesting that the simulation result of the model is good. The model accurately reflected the tendencies of the hydrodynamic and water quality trends and could thus be applied to the simulation and analysis of the water environment in the study area.

3. Results

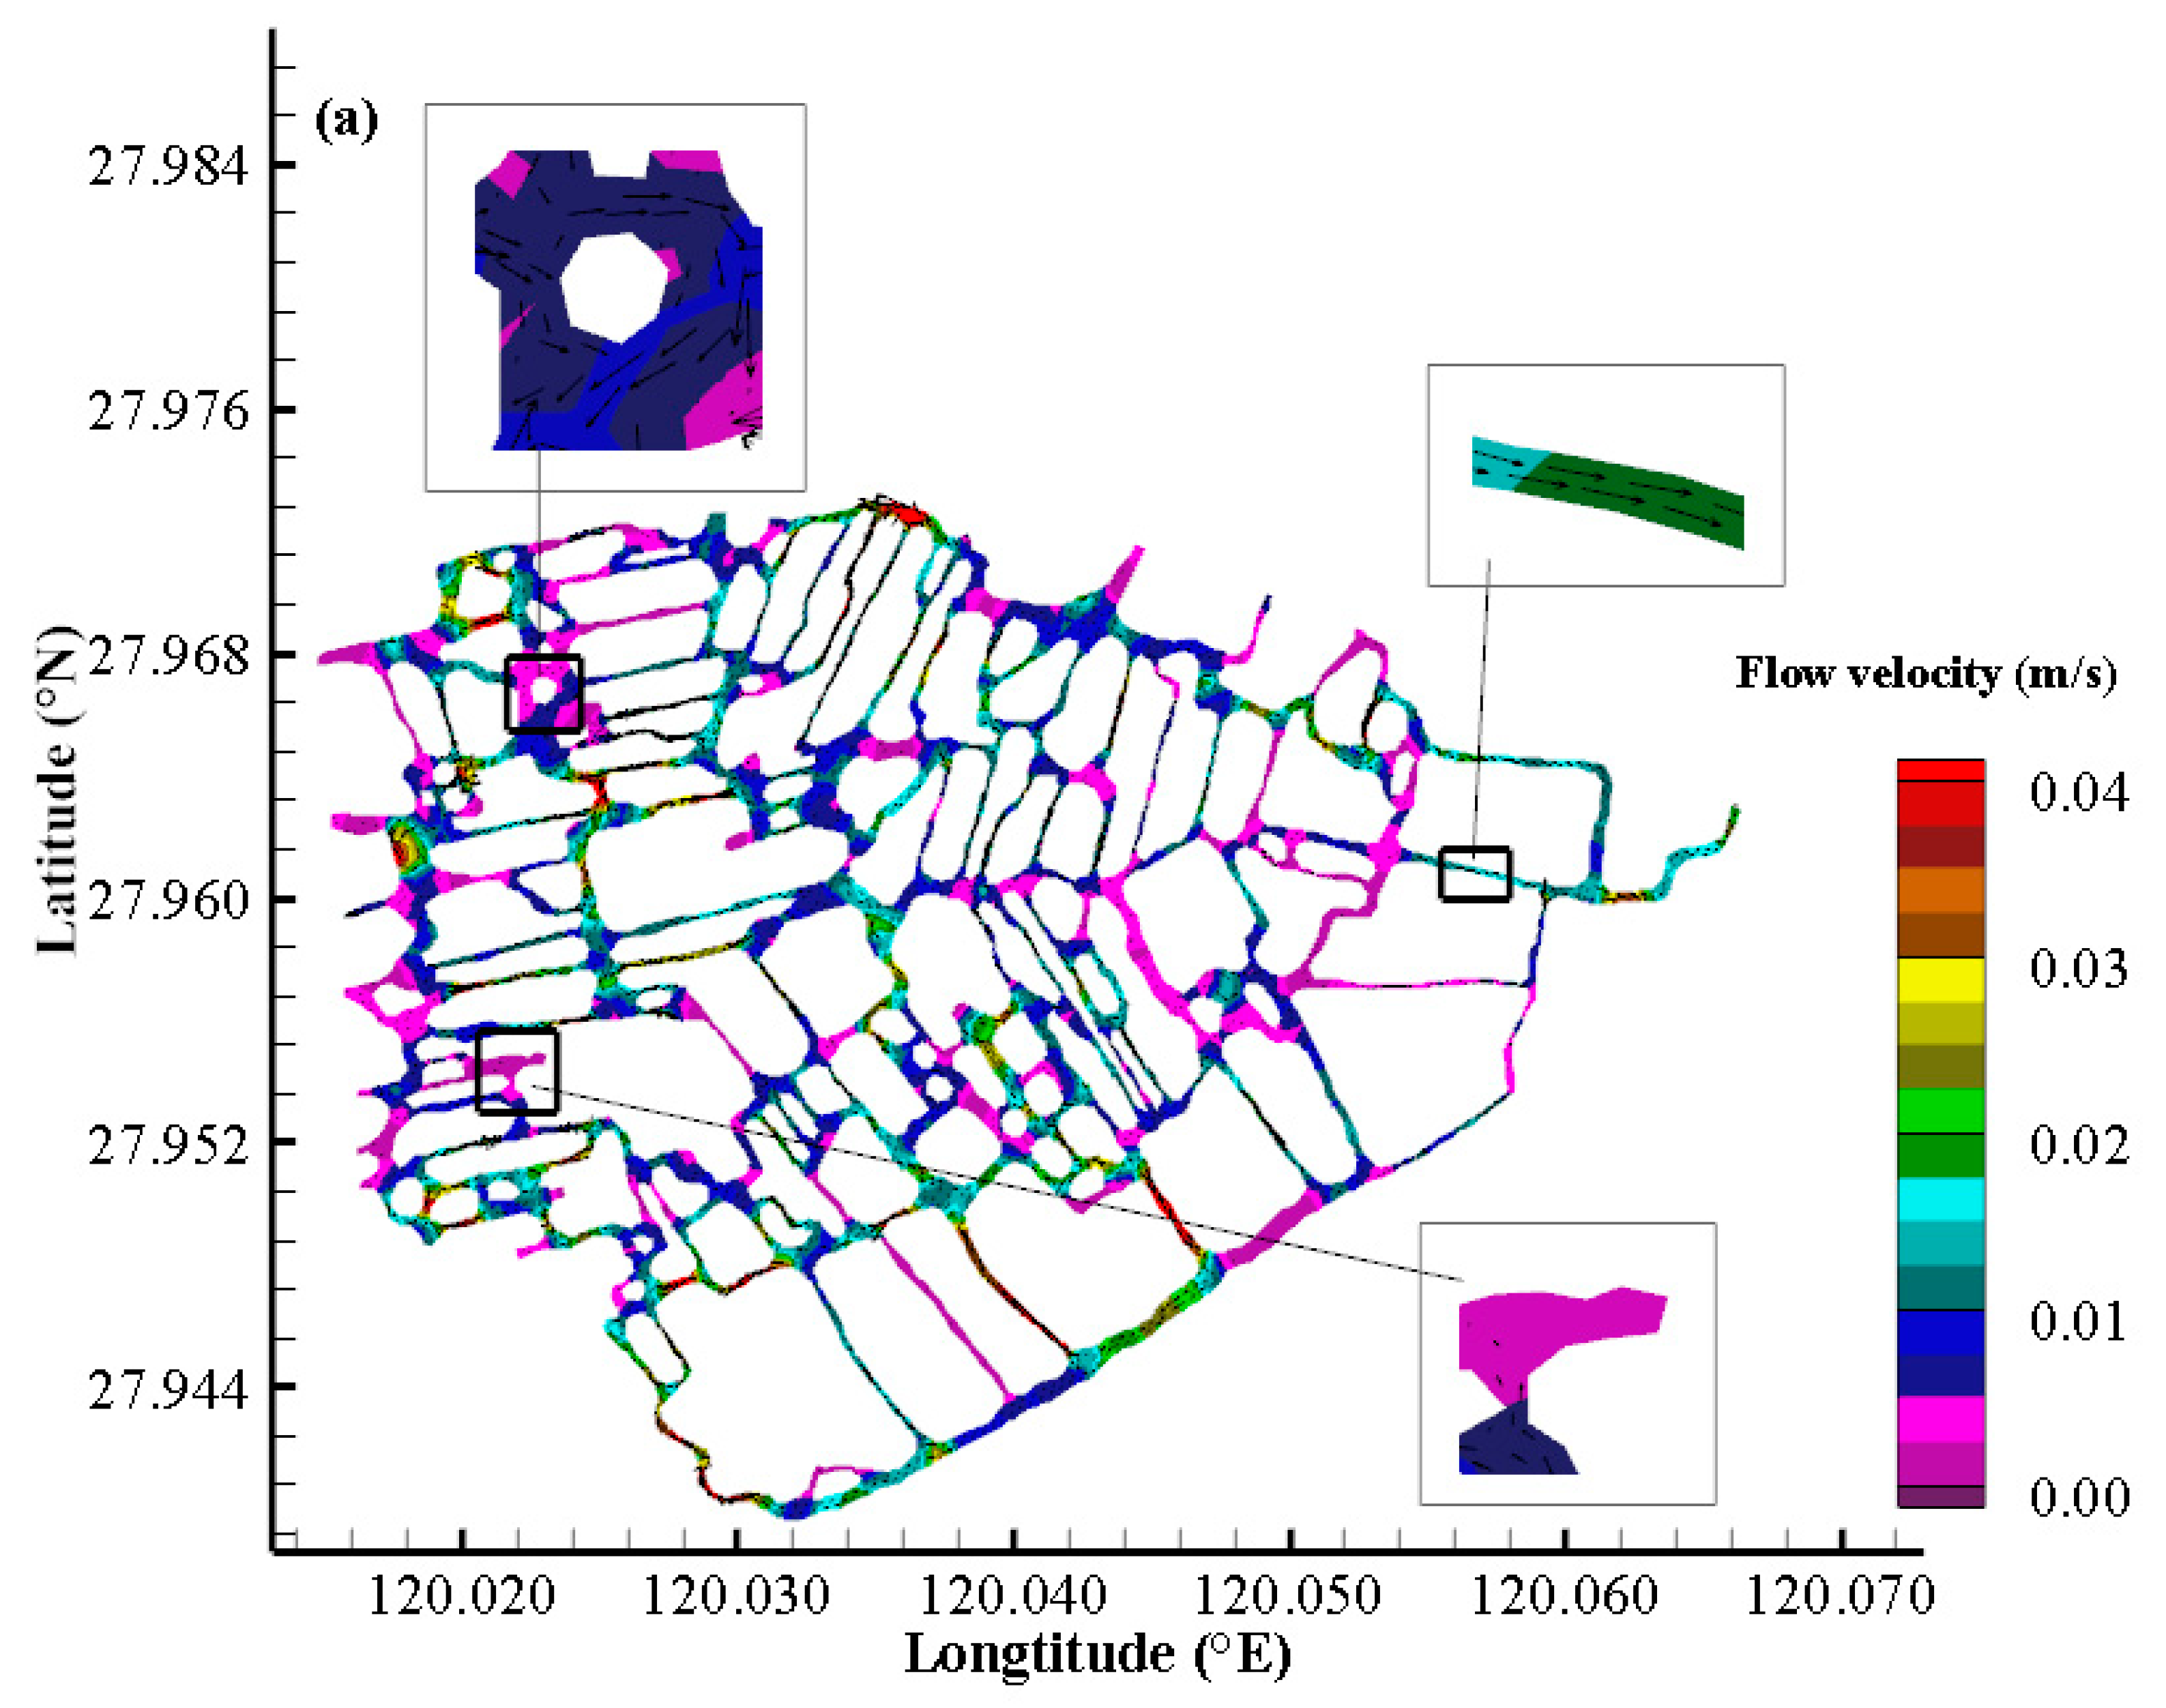
3.1. Hydrodynamic Characteristics

The flow velocity in the Sanyang wetland was 0–0.150 m/s (mean: 0.013 m/s), 0–0.154 m/s (mean: 0.014 m/s), and 0–0.593 m/s (mean: 0.022 m/s) during the dry, peak rain season, and summer flood periods, respectively. The annual mean velocity was relatively slow (0.013 m/s). The higher flow velocity was located on the southwest sides of the wetland, and the flow pattern showed the typical flow characteristics of a river flow regime. The results showed that there were some small current circulations in some of the open water areas, and the flow was stagnant in some channels without outlets (Figure 5). The main flow direction of the Sanyang wetland runs from west to northeast, with a certain amount of circulation inside the wetland.
The seasonality within the same year is the same across the historic years in the Sanyang wetland, so we analyzed the results based on the simulation results in 2016. The period division is shown in the following Table 3.
Figure 6 shows the results of the spatial distribution of the flow velocity. Each figure uses the same color band, with one color representing one flow velocity and one figure representing one period. Overall, the average flow velocity in the Sanyang wetland did not change significantly throughout the year with a variation range within 0.5 cm/s (Figure 5). The flow patterns are consistent with the regional precipitation patterns. The flow velocity was lowest during the dry period (Figure 6a), increased during the peak rain season (Figure 6b) to its peak during the summer flood period (Figure 6c), and gradually decreased and remained relatively stable during the next dry period. The maximum flow velocity of Sanyang wetland is about 5.7 cm/s, and the flow velocity of most waters is below 2.5 cm/s. The velocity is higher in the western entrance area, the interchange of rivers in the middle area, and the eastern exit area. In the severely insufficient hydrodynamic reaches (the flow velocity below 0.5 mm/s), the water body is easily affected by the input of organic matter from the outside, which may cause local water quality deterioration.

3.2. Spatiotemporal Distribution of Water Quality Indicators

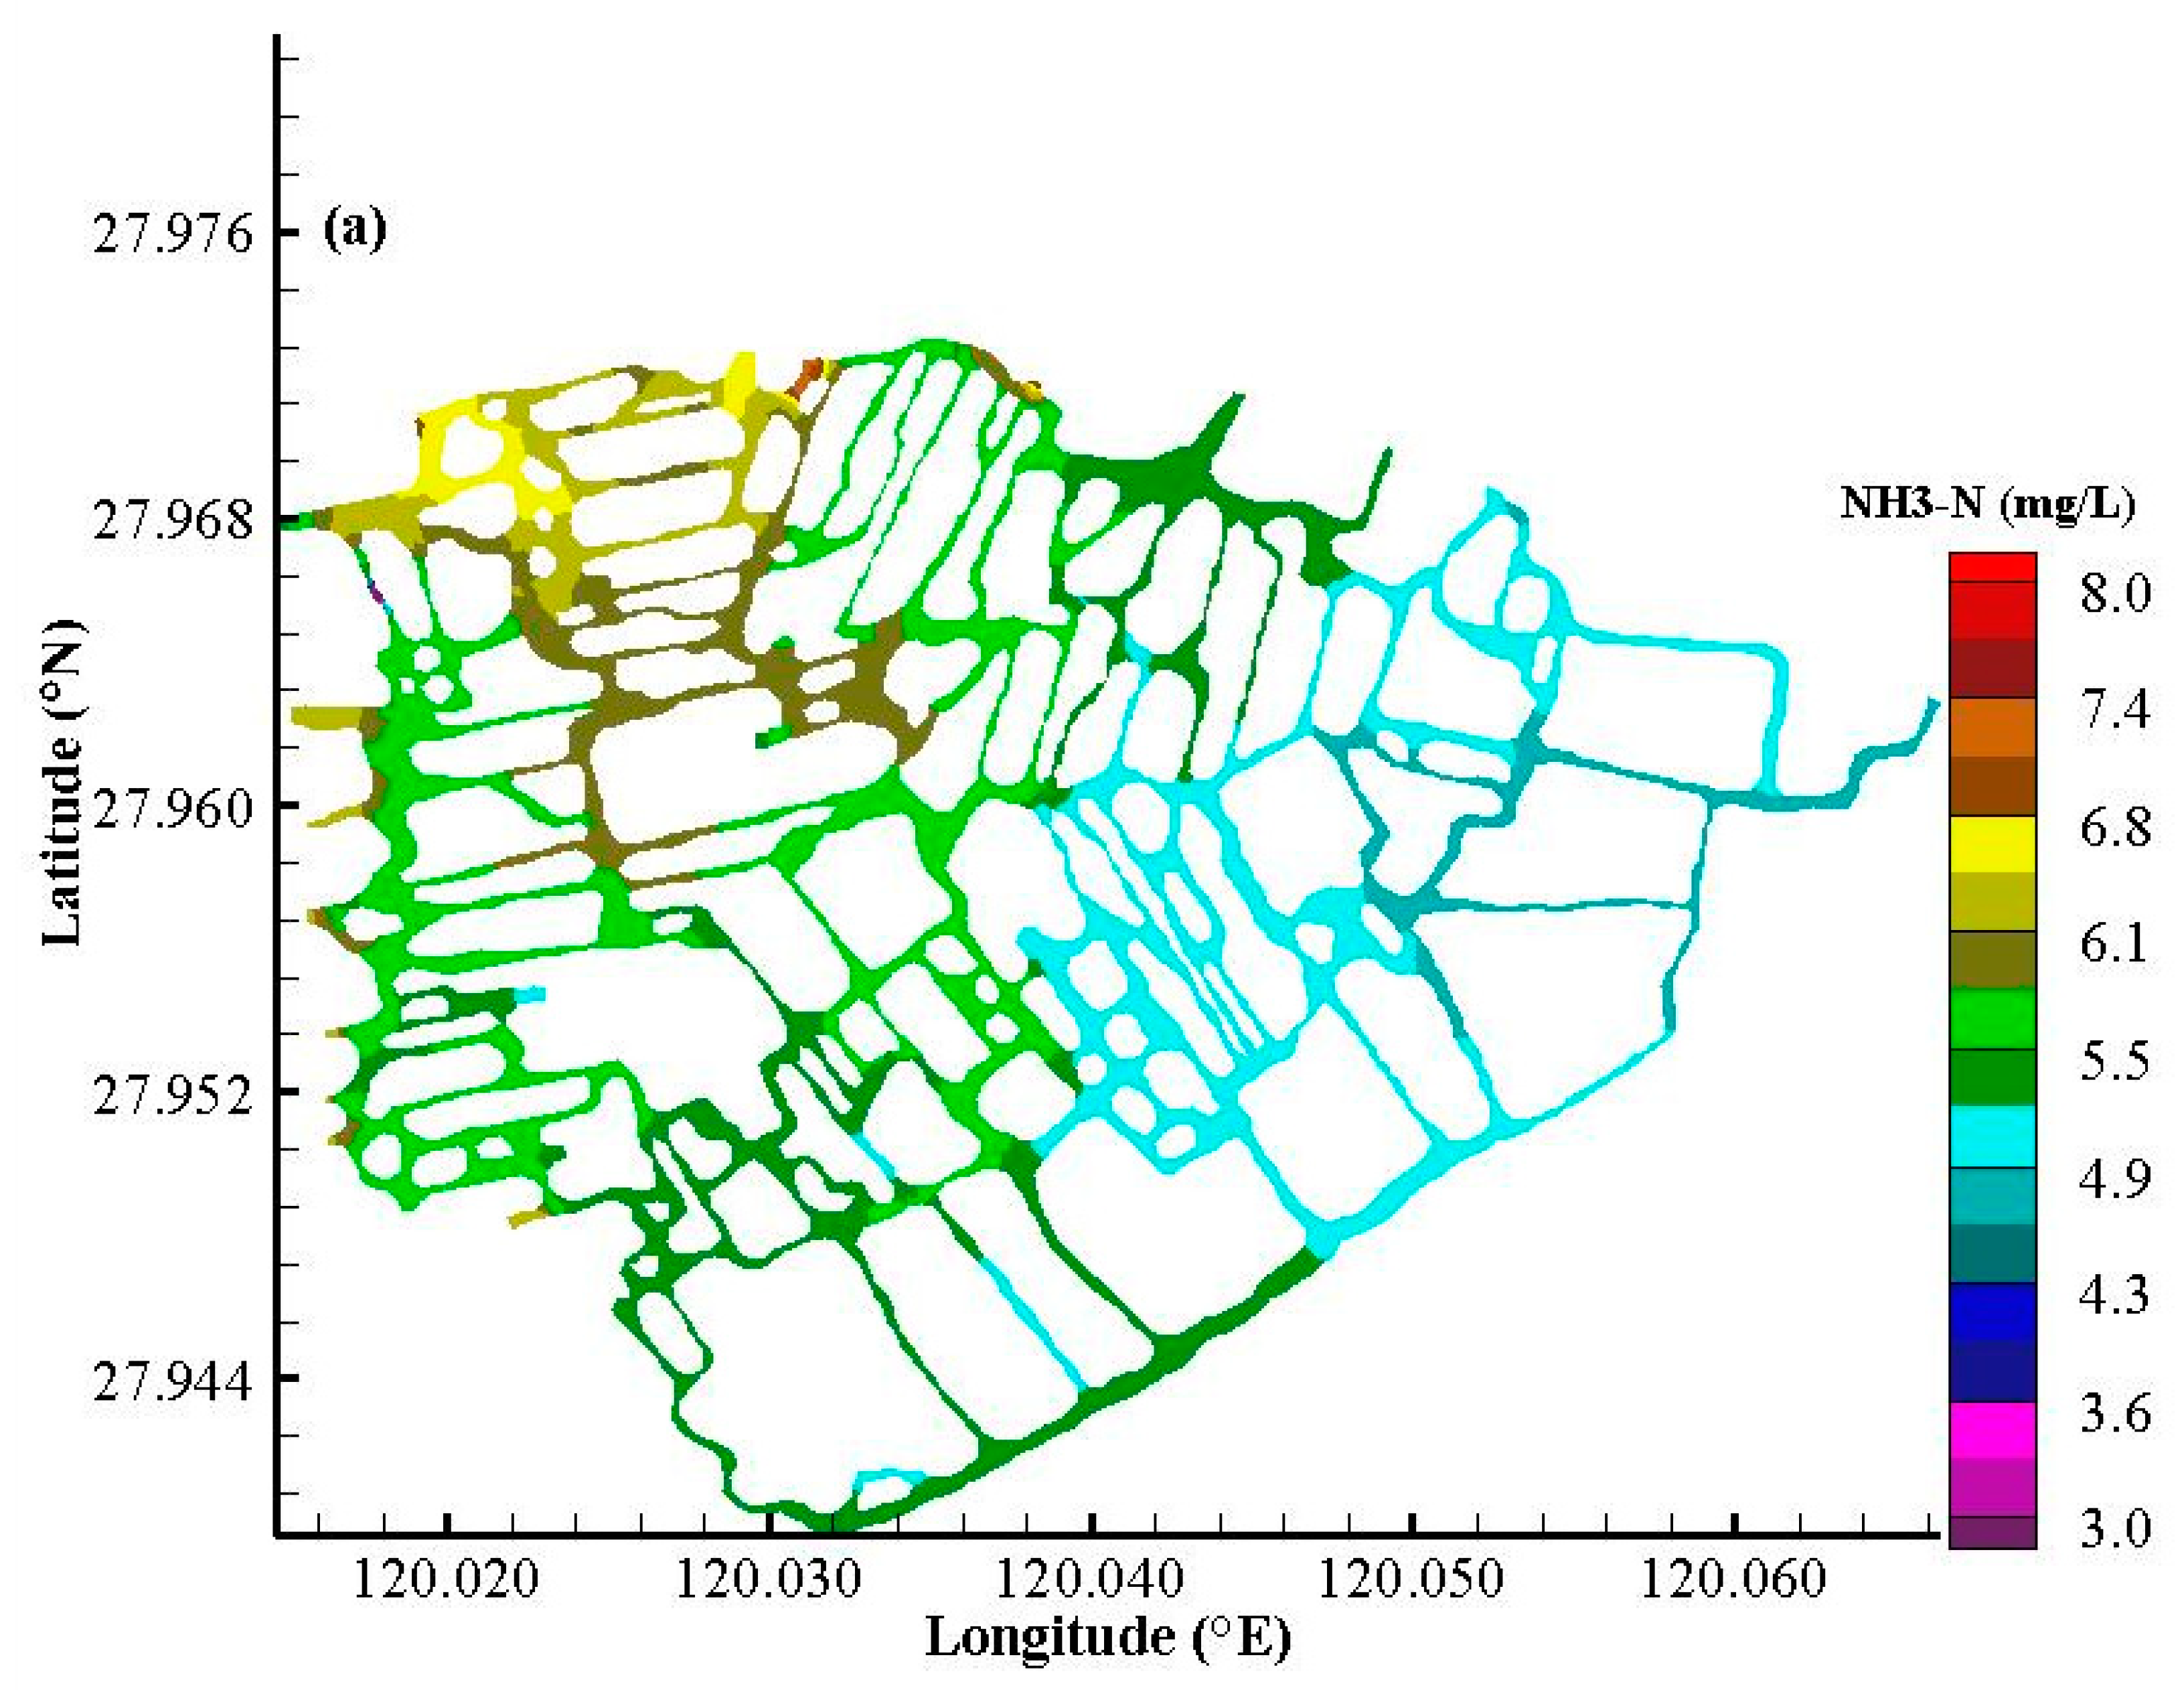
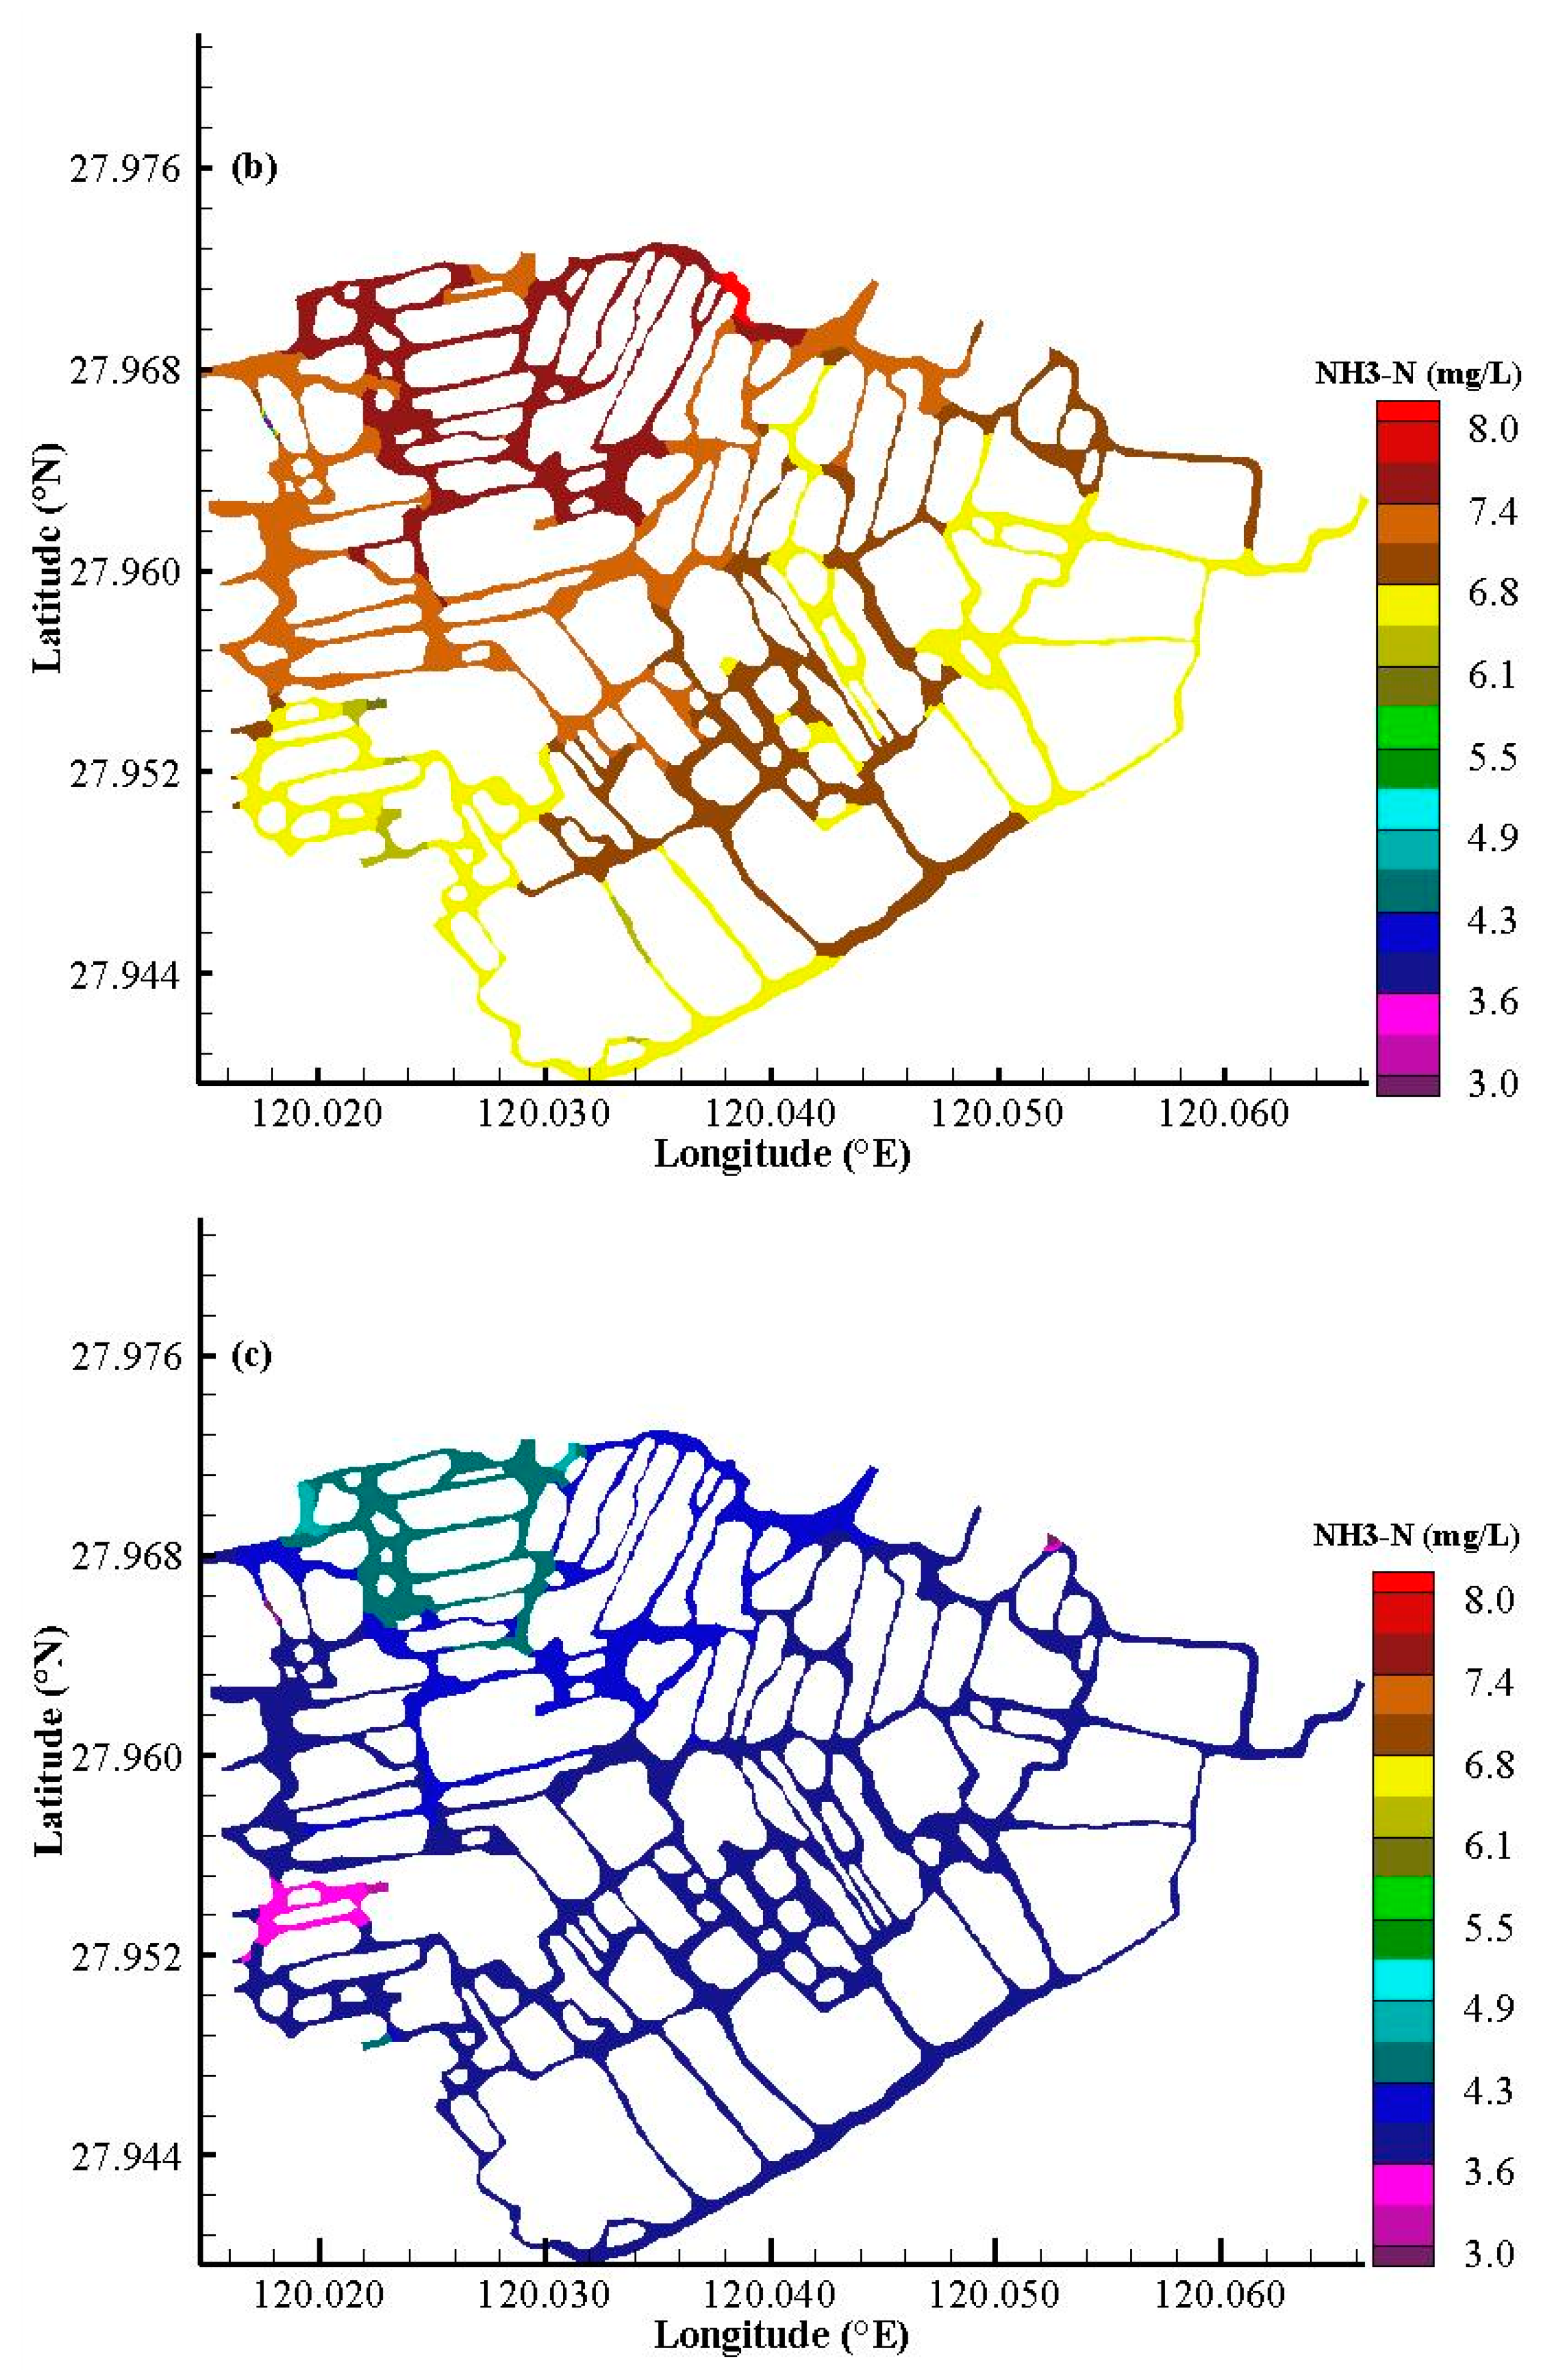
3.2.1. Ammonia Nitrogen (NH3-N)

The average monthly mean NH3-N concentration in the Sanyang wetland varied from 3.47 to 7.05 mg/L, indicating serious eutrophication (Figure 7). The NH3-N concentration in the dry period fluctuated within a narrow range from January to March, reached its maximum value in May before decreasing steadily to its minimum value in October, and slowly increased again. Figure 8 shows the result of the spatial distribution of the NH3-N concentration. Each figure uses the same color band, with one color representing one NH3-N concentration and one figure representing one period. Concentration of NH3-N in Sanyang wetland is at a high level of 3.8–6.4 mg/L, and the variation is obvious in different periods: During the peak rain season, the concentration of NH3-N in the water body is high, which is mainly higher than 5.6 mg/L (Figure 8b). During the wet season, the concentration of NH3-N in water body is relatively low, mainly in the range of 3.8–4.4 mg/L (Figure 8c). During the dry season, the NH3-N concentration in the water body is relatively low, mainly in the range of 3.8–4.4 mg/L (Figure 8a). The concentration of NH3-N in Sanyang wetland is high in the peak rain season, and the concentration of NH3-N in the seriously polluted area is at a higher level in each section.

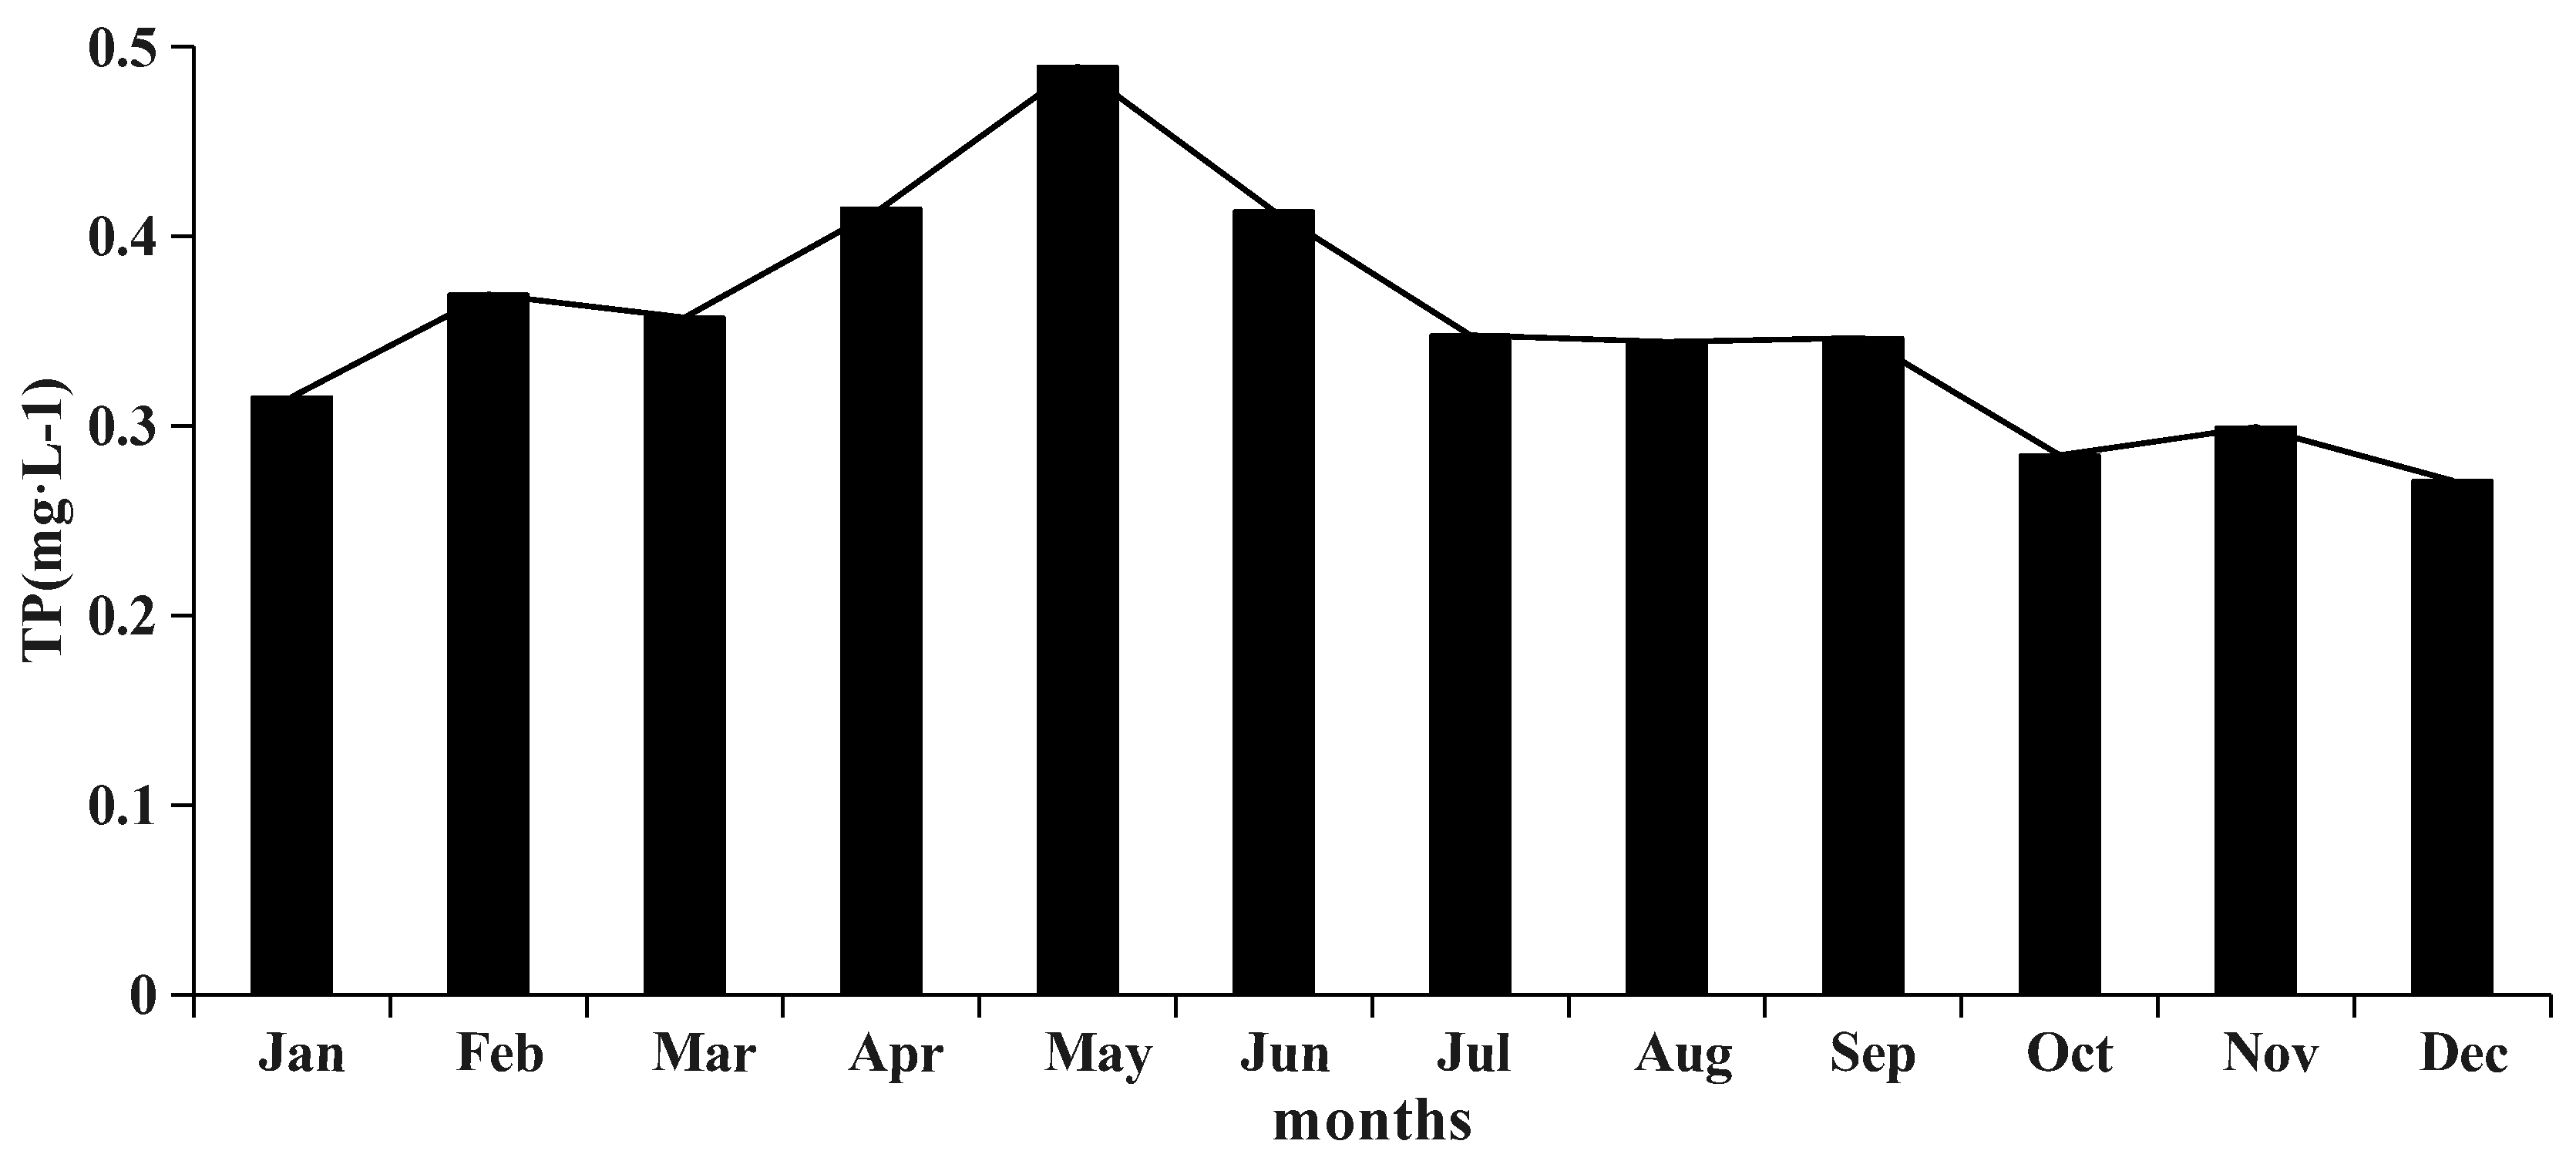
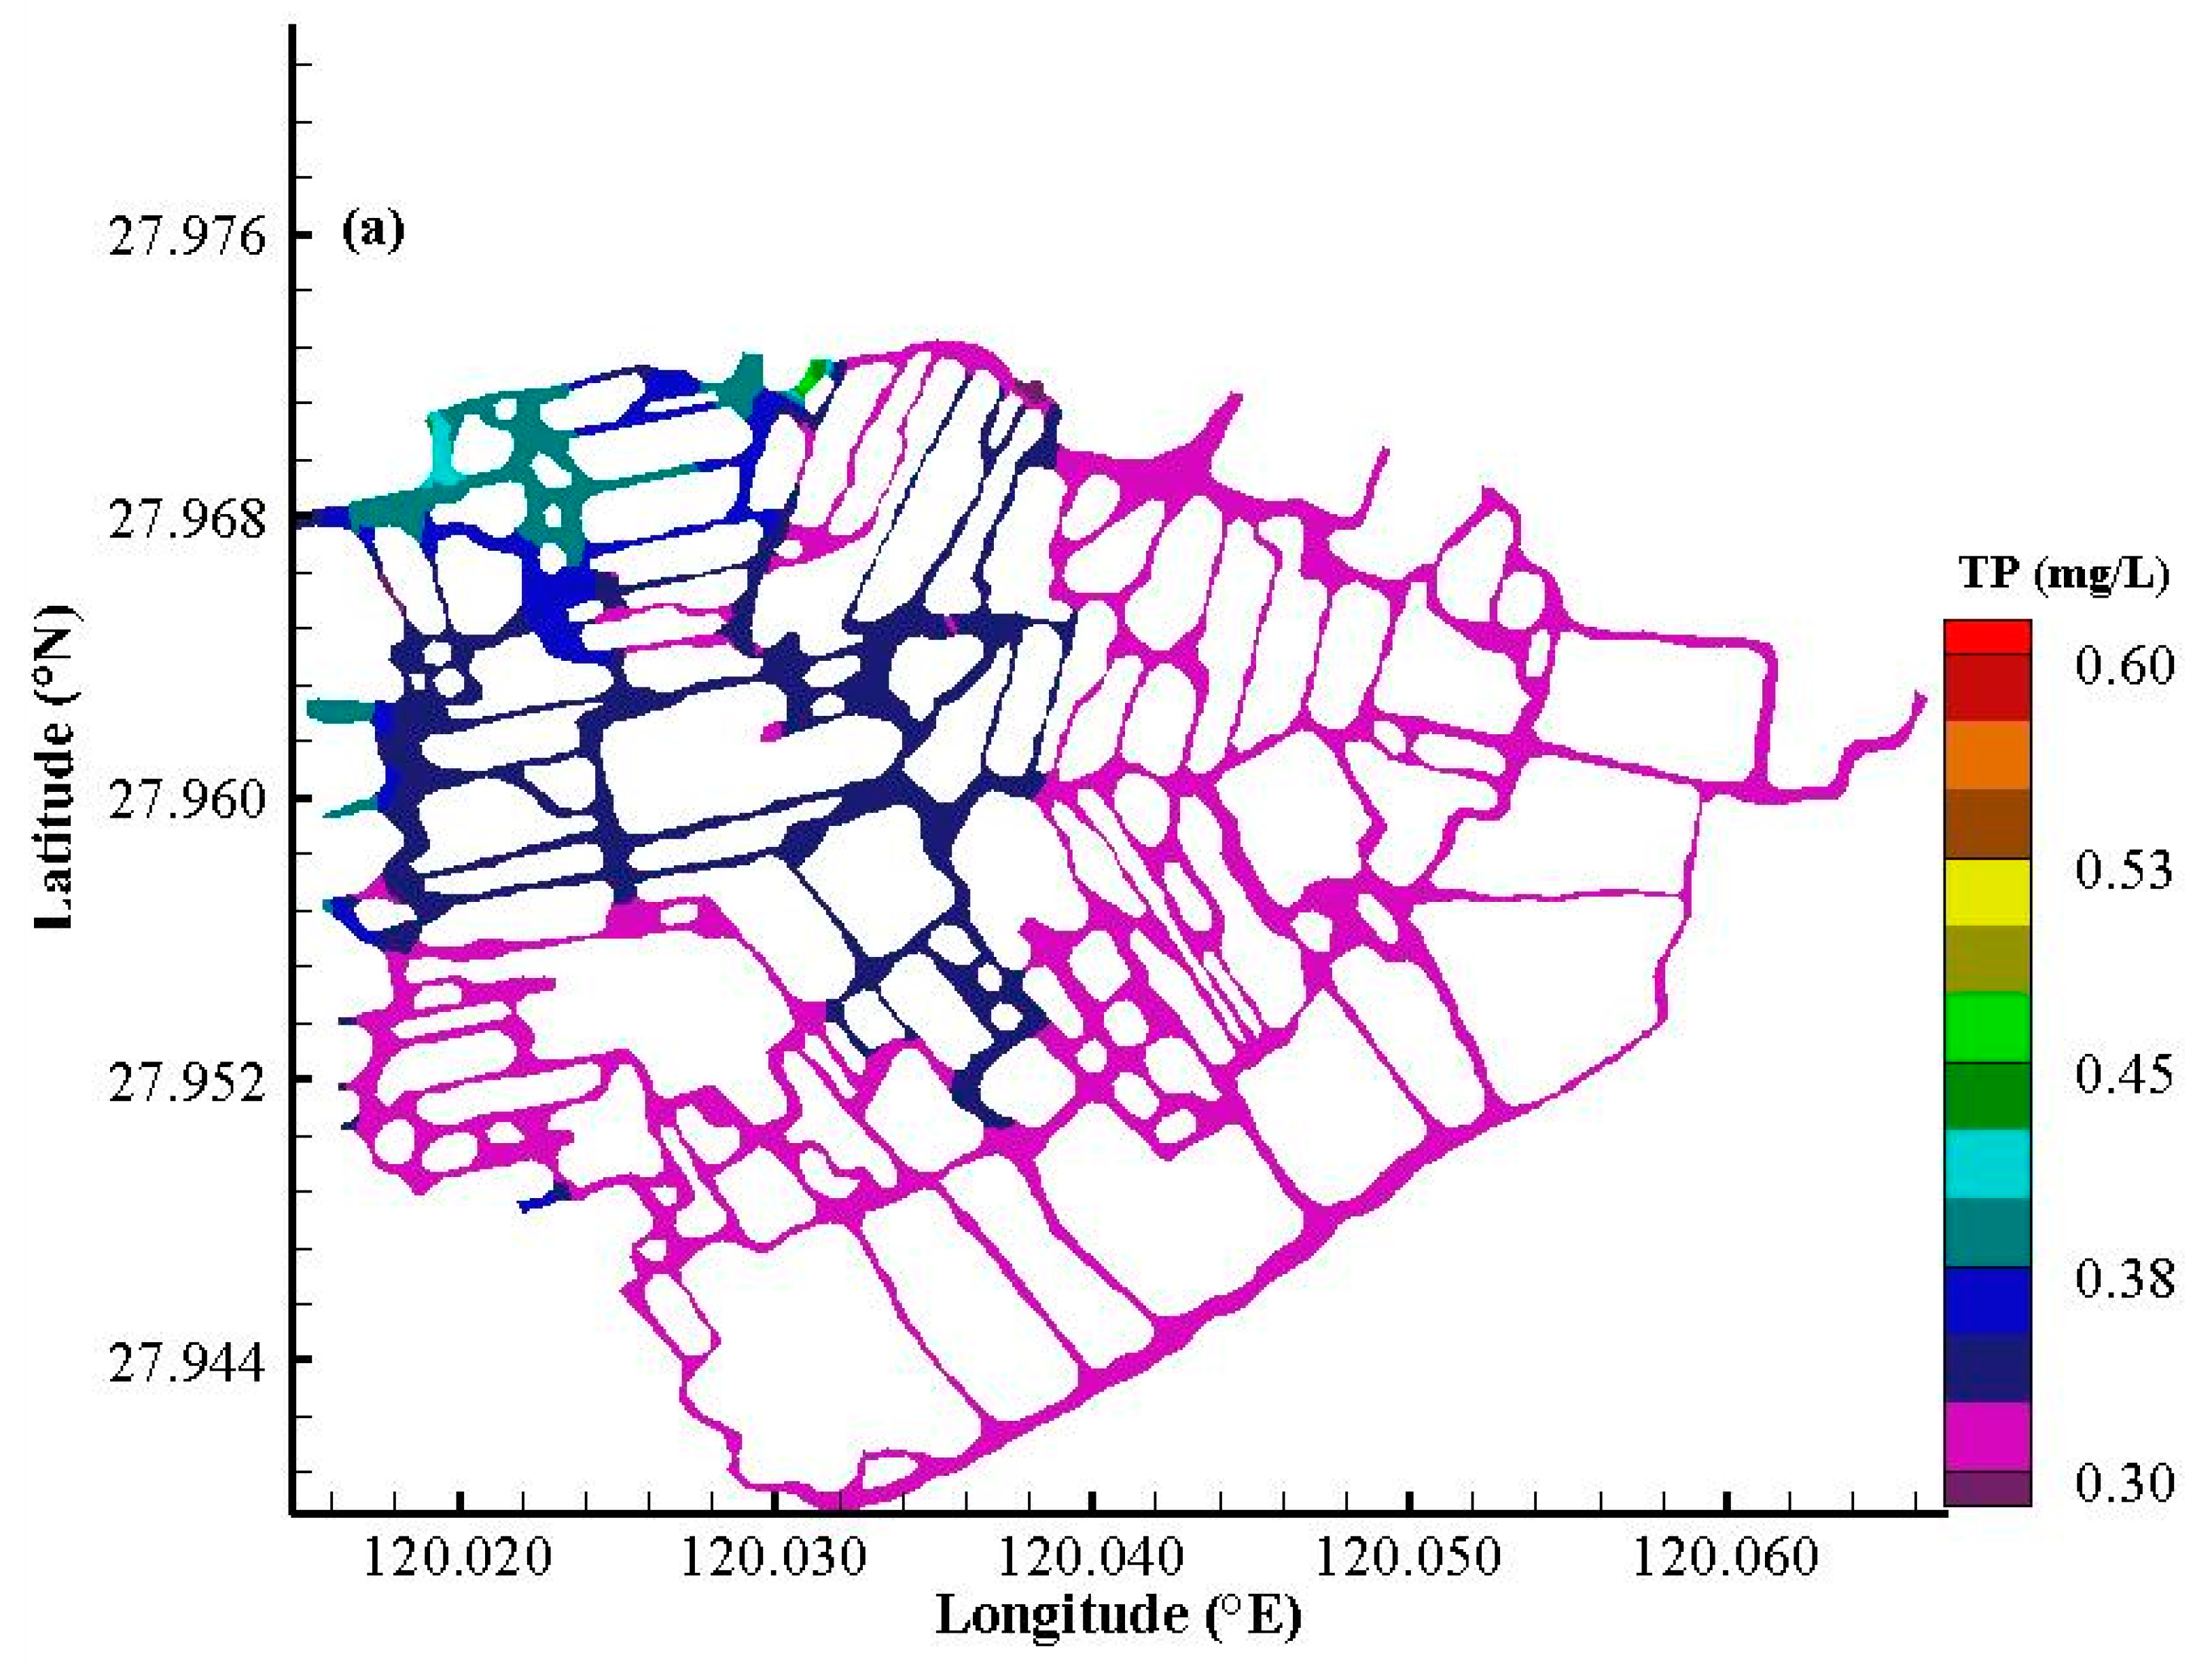
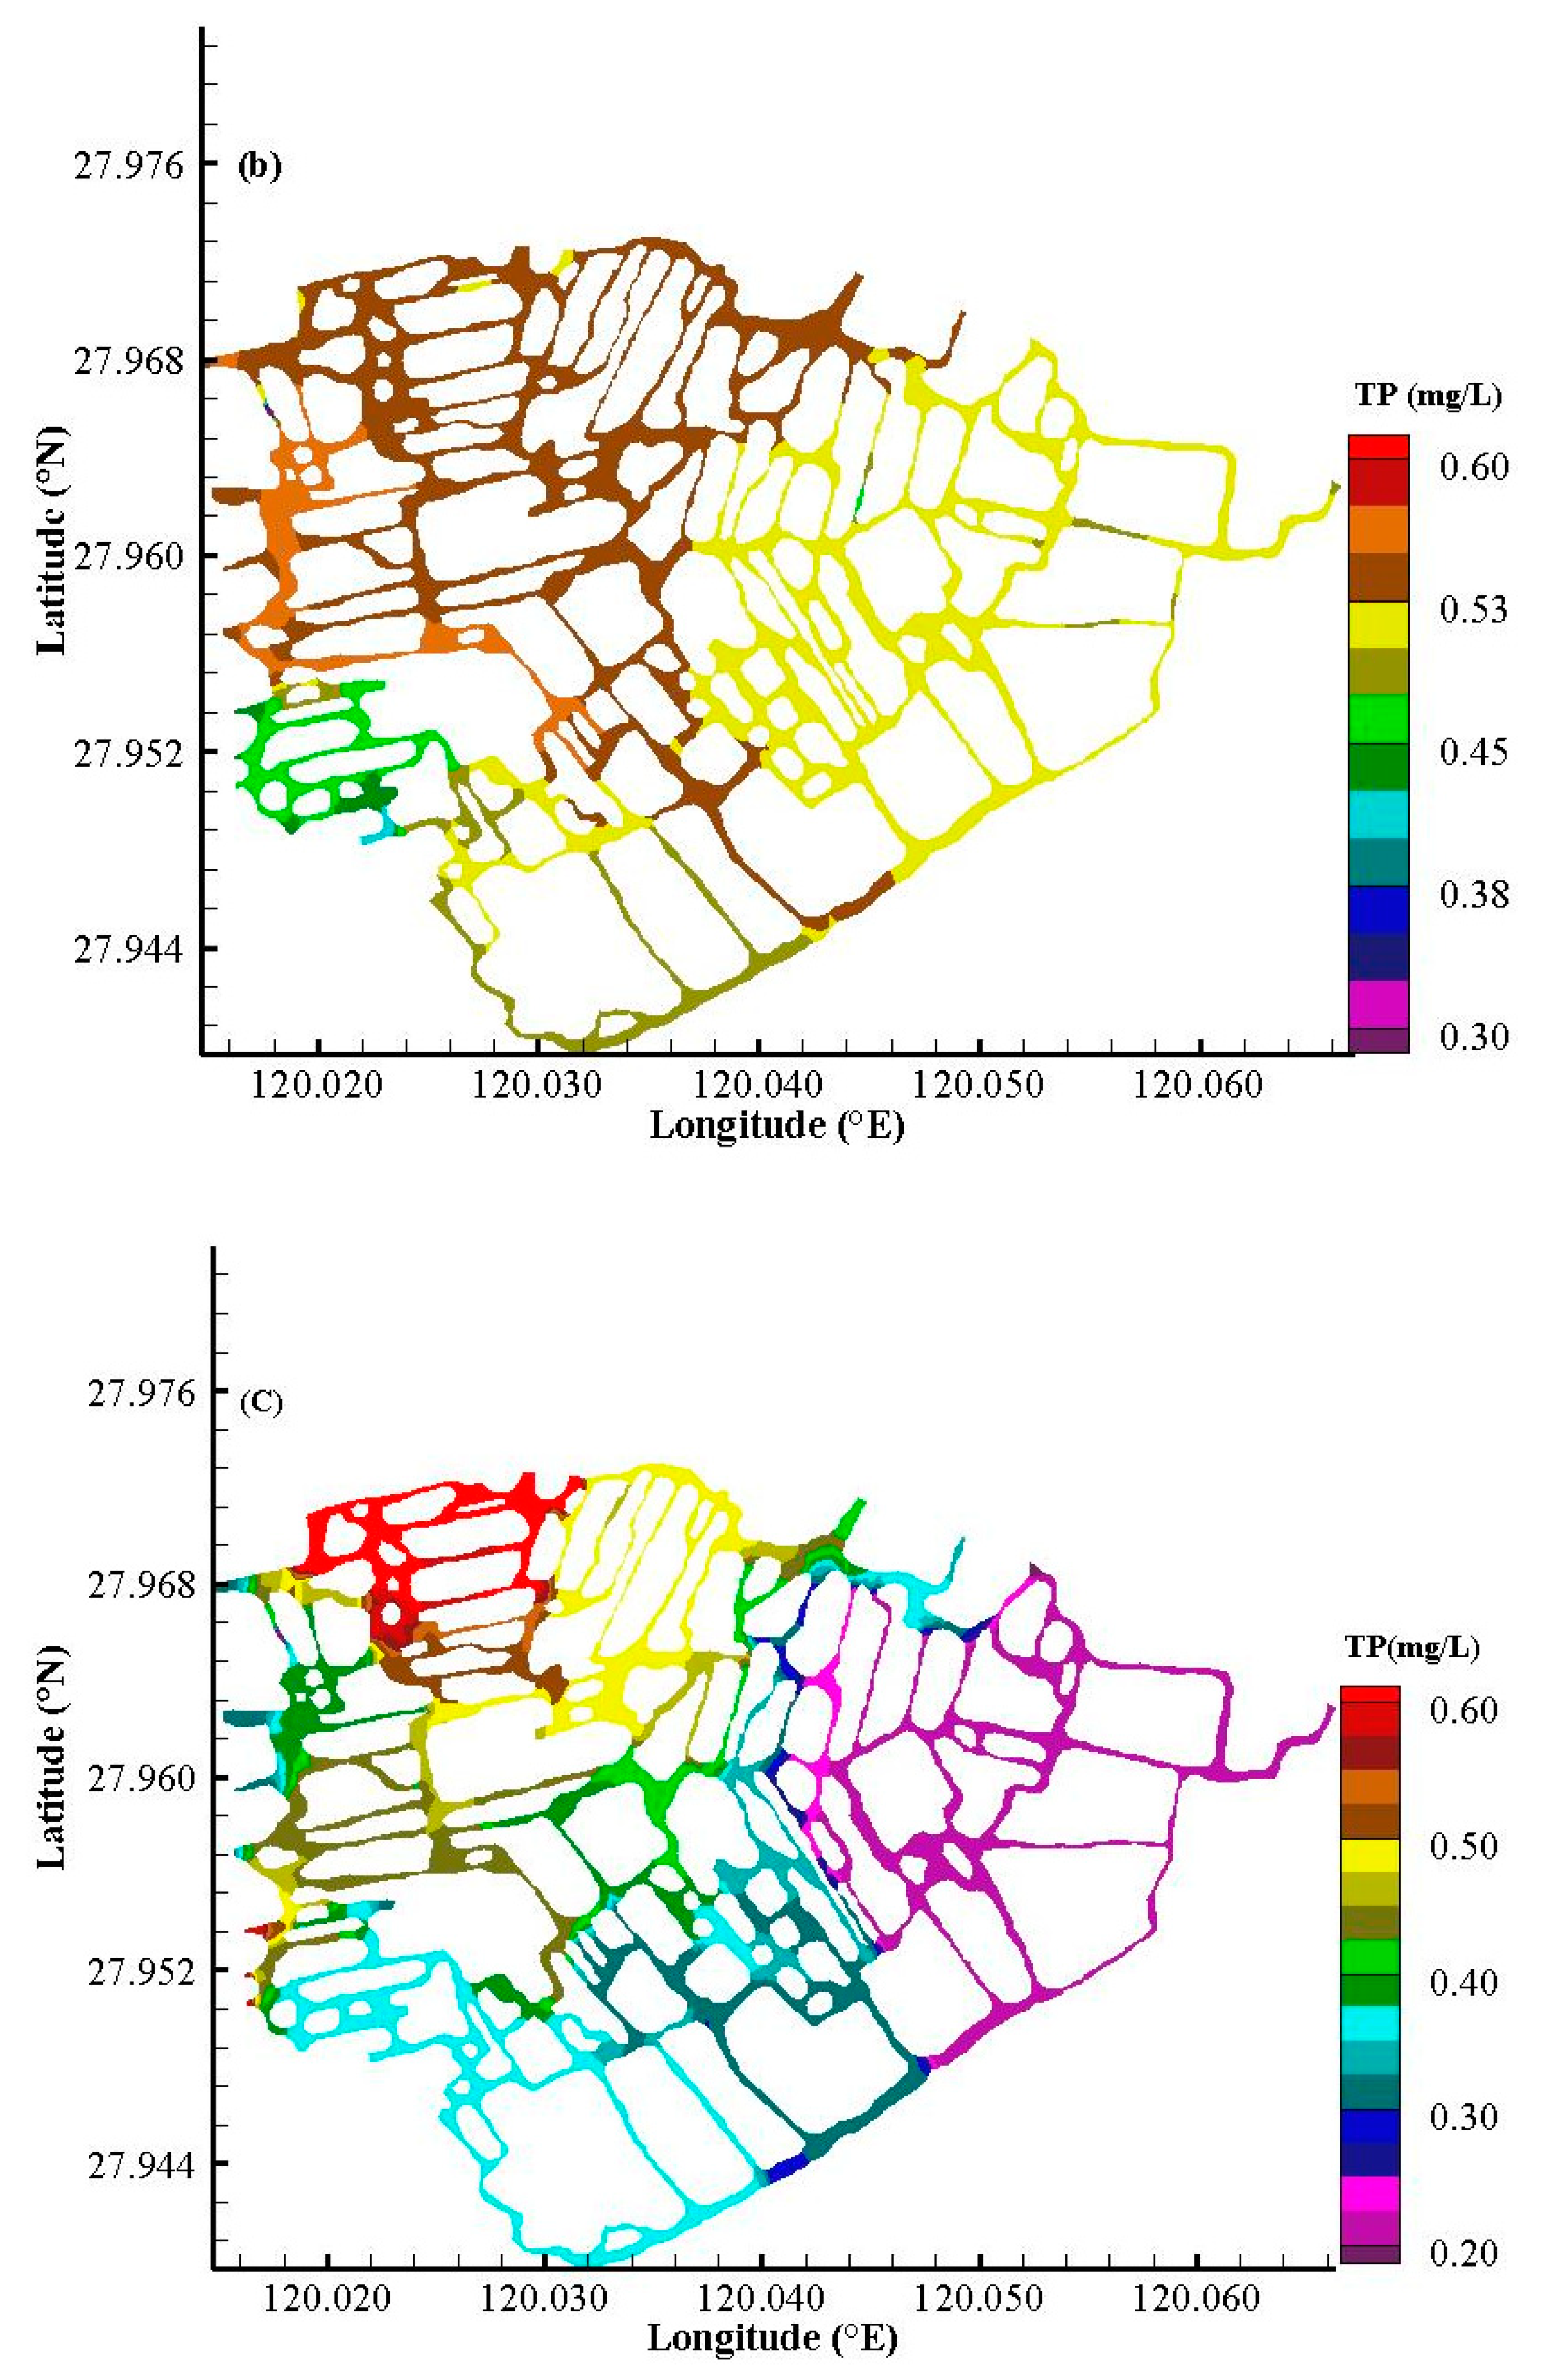
3.2.2. Total Phosphorus (TP)

The spatiotemporal distribution of TP was similar to that of NH3-N. The monthly mean concentration ranged from 0.38 to 0.49 mg/L, again confirming serious eutrophication (Figure 9). The TP concentration in the dry period remained at around 0.38 mg/L, began to increase during the onset of the peak rain season in April, reached its maximum value in May, and then slowly decreased. The TP concentration remained stable during the summer flood period and decreased during the transition into the dry season. Figure 10 shows the result of the spatial distribution of the TP concentration. Each figure uses the same color band, with one color representing one TP concentration and one figure representing one period. Similar to NH3-N, TP reached its widest spatial distribution during the peak rain season (Figure 10b), followed by the flood period (Figure 10c) and dry period (Figure 10a). During the peak rain season, the concentration of TP in water body was high, which was higher than 0.4 mg/L. During the wet season, the concentration of TP was high, mainly in the range of 0.32–0.36 mg/L. During the dry season, the concentration of TP is relatively low, mainly in the range of 0.24–0.30 mg/L. The TP concentration in Sanyang wetland was high in the peak rain season and wet season, and the TP concentration in the severely polluted area and the wetland outlet area was at a higher level in each section.

4. Discussion

The results showed that our model reflected the flow patterns and water quality in the Sanyang wetland well. In contrast to the traditional field monitoring method, our model showed a much longer time scale as well as more comprehensive spatial scale flow and water quality information, which can help managers better understand the wetland conditions and design better and more economical restoration schemes [24,25].
The flow velocity was low in the Sanyang wetland, indicating that the residence time in the wetland is long. As previous studies have shown, hydrodynamic characteristics are essential factors in the transport of pollutants, and less water exchange and long residence times increase the risk of eutrophication [26,27,28]. The main reason for the low flow and circulation in the wetland is that the river network is densely interconnected by channels surrounding the numerous islands. Moreover, the topography is relatively flat, and the wind in this area is not strong [29].
Water quality is an important factor in managing wetlands. Our results indicated that the water quality status in the Sanyang wetland is serious, which corroborates previous findings that the water quality in the study area is extremely poor [30]. This suggests that N and P sources from inlet rivers need to be better controlled. Both NH3-N and TP concentrations in the Sanyang wetland were highest in the northwest and lowest in the east, mainly because the predominant water supply comes from the Wenruitang River network to the west [31].
The Wenruitang River causes the wetland water body to become black and emit a strong, foul odor [17]. N and P concentrations gradually decreased in the inner areas of the wetland, possibly because the wetlands are able to remove some pollutants from the flow, which is similar to a pattern documented in China’s Taihu Lake [32]. The water quality in the wetland was poorer in the peak rain season, with increased N and P flow in the wetland, thereby increasing the NH3-N and TP concentrations.
The NH3-N and TP levels in the central part of the wetland were lower, which may have resulted partly from dramatic rainfall over a short period of time diluting the NH3-N and TP levels. This result was similar to that of Ji et al. [33], who found that copious rainfall played a significant role in improving the water quality of the Wenruitang River by decreasing N and P concentrations. Rainfall can also increase the dissolved oxygen in the water and contribute to reducing pollutant concentrations. Similarly, the NH3-N and TP concentrations were lower during the dry season, which might have resulted primarily from lower pollutant levels entering the wetland.
The results from our modeling study revealed spatiotemporal variations in the wetland environment. The flow velocity of the wetland was small, and this finding can help managers to select mitigation methods, such as the diversion of water from other rivers or lakes, as has been used in other studies [24,34,35,36,37]. This approach can increase the water velocity and shorten the water retention time; for example, the studied wetland can be connected with the Oujiang River nearby (Figure 1) to shorten the water retention time [38]. In addition, the spatiotemporal variations in NH3-N and TP could indicate where and when some methods should be carried out for improving wetland water quality. We can analyze the hydrodynamic and water quality characteristics of wetlands from the simulation results, and help identify the key causes and factors leading to the pollution. According to the spatiotemporal variation of NH3-N and TP, targeted measures can be taken to improve wetland water quality. We can identify exactly when and where reductions need to be made to what pollutants. For example, in some stagnant water areas, the concentration of NH3-N and TP is easy to be too high, then measures such as ecological floating beds [39,40,41] and water-lifting aeration can be treated. In this sense, the modeling results provide valuable hydrodynamic and water quality information on the Sanyang wetland, which can help wetland managers to restore and implement relevant measures accurately.

5. Conclusions

In this study, the MIKE 21 model was adopted to analyze the spatiotemporal distribution of water and pollutants (NH3-N and TP) in the Sanyang wetland during 2016. The results showed that the model can improve understanding of the hydrodynamics and water quality of the wetland. The spatiotemporal characteristics of the flow pattern could be useful for carrying out restoration measures and identifying the main reasons for poor water quality. However, the water quality is related to many factors (e.g., temperature), and further research should therefore take more factors into account. Future work should also incorporate more basic ecological data just like temperature, humidity, and species for a more powerful model setup, which can be even more useful for restoring degraded wetlands.

Author Contributions

Conceptualization, W.H.; methodology, J.B.; formal analysis, J.B.; data curation, J.B.; project administration, X.L. and W.P.; software, B.L.; validation, X.L. ; visualization, B.L.; writing—original draft, W.H.; writing—review and editing, J.B. and B.L.; supervision, W.P.;resources, J.Z. All authors have read and agreed to the published version of the manuscript.

Funding

This research received no external funding.

Data Availability Statement

Please contact the authors via email for the data.

Acknowledgments

The authors are extremely grateful to the editor and the anonymous reviewers for their insightful comments and suggestions. We also thanks to Jiquan Song for his help in the application of the model in this study.

Conflicts of Interest

The authors declare no conflict of interest.

References

  1. Berg, H.; Söderholm, A.E.; Söderström, A.-S.; Tam, N.T. Recognizing wetland ecosystem services for sustainable rice farming in the Mekong Delta, Vietnam. Sustain. Sci. 2017, 12, 137–154. [Google Scholar] [CrossRef] [PubMed] [Green Version]
  2. Sun, T.; Lin, W.; Chen, G.; Guo, P.; Zeng, Y. Wetland ecosystem health assessment through integrating remote sensing and inventory data with an assessment model for the Hangzhou Bay, China. Sci. Total. Environ. 2016, 566–567, 627–640. [Google Scholar] [CrossRef] [PubMed]
  3. Bobbink, R.; Whigham, D.F.; Beltman, B.; Verhoeven, J.T.A. Wetland Functioning in Relation to Biodiversity Con-servation and Restoration. In Wetlands: Functioning, Biodiversity Conservation, and Restoration. Ecological Studies (Analysis and Synthesis); Bobbink, R., Beltman, B., Verhoeven, J.T.A., Whigham, D.F., Eds.; Springer: Berlin/Heidelberg, Germany, 2006. [Google Scholar] [CrossRef]
  4. Green, A.J.; Elmberg, J. Ecosystem services provided by waterbirds. Biol. Rev. 2013, 89, 105–122. [Google Scholar] [CrossRef] [PubMed] [Green Version]
  5. Hansson, L.-A.; Bronmark, C.; Nilsson, P.A.; Abjornsson, K. Conflicting demands on wetland ecosystem services: Nutrient retention, biodiversity or both? Freshw. Biol. 2005, 50, 705–714. [Google Scholar] [CrossRef]
  6. Meng, W.; He, M.; Hu, B.; Mo, X.; Li, H.; Liu, B.; Wang, Z. Status of wetlands in China: A review of extent, degradation, issues and recommendations for improvement. Ocean Coast. Manag. 2017, 146, 50–59. [Google Scholar] [CrossRef]
  7. Nejadhashemi, A.P.; Wardynski, B.J.; Munoz, J.D. Large-Scale Hydrologic Modeling of the Michigan and Wisconsin Agricultural Regions to Study Impacts of Land Use Changes. Trans. ASABE 2012, 55, 821–838. [Google Scholar] [CrossRef]
  8. Klemas, V. Remote Sensing Techniques for Studying Coastal Ecosystems: An Overview. J. Coast. Res. 2010, 27, 2–17. [Google Scholar] [CrossRef]
  9. Weston, D.; Rowney, C.; Vogler, D.; Fuxan, A.; Kent, E. Using GIS to Optimize Hydraulic Analysis of Macro and Micro Scale Flow Ways for Macro Scale Wetlands Restoration—Challenges, Solutions, and Lessons Learned. In Proceedings of the World Environmental and Water Resources Congress 2011, Palm Springs, CA, USA, 22–26 May 2011; pp. 1963–1972. [Google Scholar] [CrossRef]
  10. Huang, N.; Wang, Z.; Liu, D.; Niu, Z. Selecting Sites for Converting Farmlands to Wetlands in the Sanjiang Plain, Northeast China, Based on Remote Sensing and GIS. Environ. Manag. 2010, 46, 790–800. [Google Scholar] [CrossRef]
  11. Somes, N.L.; Bishop, W.A.; Wong, T.H. Numerical simulation of wetland hydrodynamics. Environ. Int. 1999, 25, 773–779. [Google Scholar] [CrossRef]
  12. Hossainzadeh, Y.; Saghafian, B.; Bakhtiary, A. Impact assessment of periodical variation discharges on water quality of Anzali Wetland. Switz. Res. Park J. 2013, 102, 228–234. [Google Scholar]
  13. Gargallo, S.; Martín, M.; Oliver, N.; Hernández-Crespo, C. Sedimentation and resuspension modelling in free water surface constructed wetlands. Ecol. Eng. 2017, 98, 318–329. [Google Scholar] [CrossRef] [Green Version]
  14. Wester, S.J.; Grimson, R.; Minotti, P.G.; Booij, M.J.; Brugnach, M. Hydrodynamic modelling of a tidal delta wetland using an enhanced quasi-2D model. J. Hydrol. 2018, 559, 315–326. [Google Scholar] [CrossRef]
  15. Dou, M.; Jia, R. Optimization of water quality improvement program for Longfeng wetland considering the purifica-tion of aquatic plants. Acta Sci. Circumstantiae 2018, 38, 2418–2426. (In Chinese) [Google Scholar] [CrossRef]
  16. Tong, C.; Feagin, R.A.; Lu, J.; Zhang, X.; Zhu, X.; Wang, W.; He, W. Ecosystem service values and restoration in the urban Sanyang wetland of Wenzhou, China. Ecol. Eng. 2007, 29, 249–258. [Google Scholar] [CrossRef]
  17. Ek, C.; Whary, M.T.; Correa, P.; Fox, J.G. T1632 Toxoplasma Gondii Infection Does Not Alter Serologic Responses to Helicobacter pylori in Colombian Children and Thus Appears to Not Contribute to Gastric Cancer Risk. Gastroenterology 2009, 136, 547. [Google Scholar] [CrossRef]
  18. Wang, Q.; Li, S.; Jia, P.; Qi, C.; Ding, F. A Review of Surface Water Quality Models. Sci. World J. 2013, 2013, 1–7. [Google Scholar] [CrossRef] [PubMed] [Green Version]
  19. Cox, B. A review of currently available in-stream water-quality models and their applicability for simulating dissolved oxygen in lowland rivers. Sci. Total. Environ. 2003, 314–316, 335–377. [Google Scholar] [CrossRef]
  20. Dronova, I. The Study of Seasonal Composition and Dynamics of Wetland Ecosystems and Wintering Bird Habitat at Poyang Lake, PR China Using Object-Based Image Analysis and Field Observations. Ph.D. Thesis, University of California, Berkeley, CA, USA, 2012. [Google Scholar]
  21. Jiao, C.L.; Wang, H.; Yong-Shun, L.I. Numerical simulation of flow field of artificial wetland—A case of Pingyin wetland demonstration. South-to-North Water Transf. Water Sci. Technol. 2008, 6, 87–89, 108. (In Chinese) [Google Scholar] [CrossRef]
  22. Liu, T. Study of hydrodynamic and water quality simulation of constructed wetland in Yuqiao Reservoir. Xi’an Univ. Technol. 2017. Available online: https://kns.cnki.net/KCMS/detail/detail.aspx?dbname=CMFD201801&filename=1017853638.nh (accessed on 31 January 2021). (In Chinese).
  23. Ren, J.; Zhou-Hu, W.U.; Shi, H.J. Simulation and effect evaluation of Nansi Lake’s water quality control project. Saf. Environ. Eng. 2012, 19, 13–19. (In Chinese) [Google Scholar]
  24. Hu, W.; Zhai, S.; Zhu, Z.; Han, H. Impacts of the Yangtze River water transfer on the restoration of Lake Taihu. Ecol. Eng. 2008, 34, 30–49. [Google Scholar] [CrossRef]
  25. Rasmussen, E.K.; Petersen, O.S.; Thompson, J.R.; Flower, R.J.; Ahmed, M.H. Hydrodynamic-ecological model analyses of the water quality of Lake Manzala (Nile Delta, Northern Egypt). Hydrobiologia 2009, 622, 195–220. [Google Scholar] [CrossRef]
  26. Acuña, V.; Vilches, C.; Giorgi, A. As productive and slow as a stream can be—the metabolism of a Pampean stream. J. N. Am. Benthol. Soc. 2011, 30, 71–83. [Google Scholar] [CrossRef]
  27. Kawara, O.; Yura, E.; Fujii, S.; Matsumoto, T. A Study on the role of hydraulic retention time in eutrophication of the asahi river dam reservoir. Water Sci. Technol. 1998, 37, 245–252. [Google Scholar] [CrossRef]
  28. Mitrovic, S.M.; Bowling, L.C.; Buckney, R.T. Vertical Disentrainment of Anabaena circinalis in the Turbid, Freshwater Darling River, Australia: Quantifying Potential Benefits from Buoyancy. J. Plankton Res. 2001, 23, 47–55. [Google Scholar] [CrossRef] [Green Version]
  29. Boutron, O.; Bertrand, O.; Fiandrino, A.; Höhener, P.; Sandoz, A.; Chérain, Y.; Coulet, E.; Chauvelon, P. An Unstructured Numerical Model to Study Wind-Driven Circulation Patterns in a Managed Coastal Mediterranean Wetland: The Vaccarès Lagoon System. Water 2015, 7, 5986–6016. [Google Scholar] [CrossRef] [Green Version]
  30. Sun, Y.; Hengguo, Y.U.; Zhou, Q.; Liu, T.; Ma, Z. Seasonal variation of phytoplankton communities in Wenruitang River—A typical eutrophic urban river, Zhejiang Province. J. Lake Sci. 2018, 2, 375–384. (In Chinese) [Google Scholar]
  31. Li, Y.; Zhang, Q.; Arocena, J.M.; Thring, R.W. Heavy metals and nutrients (carbon, nitrogen, and phosphorus) in sediments: Relationships to land uses, environmental risks, and management. Environ. Sci. Pollut. Res. 2017, 24, 7403–7412. [Google Scholar] [CrossRef]
  32. Trolle, D.; Zhu, G.; Hamilton, D.P.; Luo, L.; McBride, C.; Zhang, L. The influence of water quality and sediment geochemistry on the horizontal and vertical distribution of phosphorus and nitrogen in sediments of a large, shallow lake. Hydrobiologia 2009, 627, 31–44. [Google Scholar] [CrossRef]
  33. Ji, X.L.; Zhu, Y.L.; Shang, X. Spatiotemporal variation and assessment of water quality in Wenruitang River network areas. Res. Soil Water Conserv. 2013, 20, 241–246. (In Chinese) [Google Scholar]
  34. Liu, Y.; Wang, Y.; Sheng, H.; Dong, F.; Zou, R.; Zhao, L.; Guo, H.; Zhu, X.; He, B. Quantitative evaluation of lake eutrophication responses under alternative water diversion scenarios: A water quality modeling based statistical analysis approach. Sci. Total. Environ. 2014, 468–469, 219–227. [Google Scholar] [CrossRef] [PubMed]
  35. Wang, P.; Wang, C. Water Quality in Taihu Lake and the Effects of the Water Transfer from the Yangtze River to Taihu Lake Project. Compr. Water Qual. Purif. 2014, 4, 136–161. [Google Scholar] [CrossRef]
  36. Wu, H.; Yan, H. Maintaining healthy rivers and lakes through water diversion from Yangtze River to Taihu Lake in Taihu Basin. Water Sci. Eng. 2008, 1, 36–43. [Google Scholar] [CrossRef]
  37. Hu, K.; Pang, Y.; Wang, H.; Wang, X.; Wu, X.; Bao, K.; Liu, Q. Simulation study on water quality based on sediment release flume experiment in Lake Taihu, China. Ecol. Eng. 2011, 37, 607–615. [Google Scholar] [CrossRef]
  38. Zhang, Y.J.; Xiao, C.; Mei, K.; Li, J.; Song, X.; Zhang, M. The effect evaluation of pollution flushing for improving water quality in Wenruitang River, China. In Proceedings of the 2012 Second International Conference on Electric Technology and Civil Engineering, IEEE Computer Society, Washington, DC, USA, 18 May 2012; pp. 3102–3105. [Google Scholar] [CrossRef]
  39. Huan, L.I.; Wei, W.U.; Luo, F. The comparison of removal effect of total nitrogen and total phosphorus in simulated eutrophic water among 4 kinds of emergent plants, 4 kinds of submerged plants and their mixed communities. Wetl. Sci. 2016, 14, 163–172. [Google Scholar]
  40. Yang, F.; Yang, Y.; Pan, H. Effect of an enhanced ecological floating bed (EEFB) on zooplankton community in a polluted river. J. Lake Sci. 2011, 23, 498–504. (In Chinese) [Google Scholar]
  41. Yuan, J.; Dong, L.; Yang, J. Study on purification effect of nitrogen and phosphorus in eutrophic river water by six emerged plants. Environ. Sci. Manag. 2017, 42, 75–78, 83. (In Chinese) [Google Scholar]
Figure 1. Location and detailed map of the Sanyang wetland, Wenzhou City, China.
Sustainability 13 04637 g001
Figure 2. Location of rivers and distribution of monitoring points in the Sanyang wetland.
Sustainability 13 04637 g002
Figure 3. Comparison of observed and simulated water level values at monitoring point C13 in the Sanyang wetland during 2016.
Sustainability 13 04637 g003
Figure 4. Comparison of observed and simulated water quality data in 2016 for ammonia nitrogen (NH3-N) and total phosphorus (TP) at monitoring points C1: Zhangjiaqiao River; C3: Lujiaan River; C5: Xiaheng River; C11: Qicaoqianchi River; and C13: Zhangyanfengmenqianhe River.
Sustainability 13 04637 g004aSustainability 13 04637 g004b
Figure 5. Monthly variations in mean flow velocity in the Sanyang wetland in 2016.
Sustainability 13 04637 g005
Figure 6. Distribution of flow velocity in the Sanyang wetland during (a) the dry period (October 16 to April 15); (b) the peak rain season (April 16 to July 15); and (c) the flood period (July 16 to October 15) in 2016.
Sustainability 13 04637 g006aSustainability 13 04637 g006b
Figure 7. Monthly variations in ammonia nitrogen (NH3-N) in the Sanyang wetland in 2016.
Sustainability 13 04637 g007
Figure 8. Distribution of ammonia nitrogen (NH3-N) in the Sanyang wetland during (a) the dry period (October 16 to April 15); (b) the peak rain season (April 16 to July 15); and (c) the flood period (July 16 to October 15) in 2016.
Sustainability 13 04637 g008aSustainability 13 04637 g008b
Figure 9. Monthly variations in total phosphorus (TP) in the Sanyang wetland in 2016.
Sustainability 13 04637 g009
Figure 10. Distribution of total phosphorus (TP) in the Sanyang wetland during (a) the dry period (October 16 to April 15); (b) the peak rain season (April 16 to July 15); and (c) the flood period (July 16 to October 15) in 2016.
Sustainability 13 04637 g010aSustainability 13 04637 g010b
Table 1. Primary rivers entering and exiting the Sanyang wetland.
NumberRiver NameNumberRiver Name
1Sanyangtiao11Shanqianzhi
2Wangtanyang12Shangongdian
3Qianhediananhe13Dongfengtou
4Henggangtou14Zhongxingqiao
5Laodianhou15Caozhaiyang
6Dongyang16Shuilangyangnan
7Dianqian17Shuilangyangxi
8Lincun18Shangcaihou
9Shengmenhou19Haipai
10Yongfengqiao
Table 2. Calculation results of relative error in the validation of water quality.
NH3-NTP
Point δ Point δ
C1−5.4%C1−1.6%
C3−6.0%C3−7.7%
C5−11.4%C519.2%
C11−11.4%C1119.2%
C134.4%C131.5%
Table 3. The division of the different periods.
PeriodMonths
Dry SeasonOctober 16 to April 15
Peak Rain SeasonApril 16 to July 15
Wet SeasonJuly 16 to October 15
Publisher’s Note: MDPI stays neutral with regard to jurisdictional claims in published maps and institutional affiliations.

