Article

Users’ Evaluation of a New Web Browser Payment Interface for Facilitating the Use of Multiple Payment Systems

by
Oussama Tounekti
*,
Antonio Ruiz-Martínez
and
Antonio F. Skarmeta-Gómez
Department of Information and Communications Engineering, University of Murcia, 30100 Murcia, Spain
*
Author to whom correspondence should be addressed.
Sustainability 2021, 13(9), 4711; https://doi.org/10.3390/su13094711
Submission received: 11 March 2021 / Revised: 14 April 2021 / Accepted: 21 April 2021 / Published: 22 April 2021

Abstract

:
The availability of multiple (mobile) electronic payment systems ((M)EPS) has led to the development of web browser payment interfaces that support various payment systems, facilitate the transaction, the choice of the payment system, and perform the payment. However, so far, no in-depth study on user satisfaction determinants with these interfaces has been conducted. Our work aims to cope with this issue. Thus, based on the analysis of payment literature and Google Chrome web browser (GCWB) payment interface, we propose a new web browser payment interface that considers users’ preferences to support multiple payment systems. Furthermore, we have developed a theoretical model to determine users’ preferences to support multiple payment systems. Our model is based on the extension of technology acceptance models. Finally, we evaluated both the theoretical and proposed payment interface through a survey research approach (n = 266); data were collected, and the hypotheses were tested via statistical analysis (chi-square test, regression coefficients). Our experimental results revealed that our proposed interface is accepted, easy to use, and satisfies users’ needs. The key factors for accepting a new web browser payment interface are ease of use, usefulness, security, confidentiality, privacy, payment method preferences, visual interface design, and credibility.

1. Introduction

Global (mobile) electronic payments services have become increasingly important. Payment methods are how customers can pay for their goods and services [1,2,3].
It is necessary to consider the payment methods that will be provided when starting a business and check periodically whether they are in line with their customers’ payment preferences, whether they meet the needs of the business. They facilitate and simplify the payment process allowing payment to be made according to the consumer’s preferences [2,4,5].
As electronic payments are increasingly used, worldwide, several other payment systems are being designed to facilitate online payment transactions and support multiple payment systems [2].
Despite the rapid growth that online payments have experimented recently, this astonishing development has led to new problems and challenges that include the main concerns of internet users: payment security [6], payment interface, data protection [7], perceived usefulness [8], and perceived ease of use [2,9], and processing [10,11].
(M)EPS that aim to conduct payment transactions and facilitate payment processing on (mobile) electronic devices has transformed the payment business model and the current financial innovation. In this aim of the research, many recent reviews concentrate on optimizing the quality of service of (M)EPS from the part of security and trustworthiness of transaction [12], network (5G technology), and Internet of Things (IoT)-based architecture [13]. Furthermore, previous research [1,2,3,14,15,16] shows that the current amount of research in m/e-commerce is increasing day by day.
Besides, given that current users support multiple (M)EPS, users like to use their preferred payment system [2]. More and more, the users are supporting more payment systems; based on the analysis of payment literature and theoretical model determine users’ preferences to support multiple payment systems, we decided to study the payment interface offered by the GCWB. We decided to propose a new web browser payment interface that considers users’ preferences to support multiple payment systems and facilitate the payment process. Therefore, we could make the checkout process easier, causing less resistance to online payment and reducing cart abandonment. In this study, we attempt to explore the degree to which specific (M)EPS factors affect consumers’ choices of the services. Such a concrete examination can offer a better understanding of user adoption of (M)EPS. This approach is essential because consumers can have distinctive preferences for (M)EPS-based payment methods [2].
Therefore, to achieve our research objective we investigated customer acceptance, based on data collected from a questionnaire, comparing between a payment interface offered by the GCWB and the new proposed payment interface to show which interface is the most accepted, easy to use, meeting more user needs and preferences [2], and facilitate the payment process taking into account the peculiarities of the choice payment and the online payment functionality which can better predict user satisfaction. Therefore, this research can provide evidence to fill the gap between theoretical knowledge and the practice of (M)EPS using the new proposed payment interface.
The rest of the article is coordinated as follows: The following section describes the literature review associated with this study. Then, we present the theoretical framework and the development of the hypotheses. We then describe the research method, after which we report and discuss our results. Finally, we will conclude with the implications, limitations of this research, and future research recommendation.

2. Literature Review

This part’s primary purpose was to examine the research literature associated with the broad frameworks of (M)EPS, the distinction of a payment system used for a purchase transaction, and the satisfaction of users of the latter payment systems. Studies concerning usage acceptance and intention to use (M)EPS are necessary [4,17,18]. In this draft, the literature review is divided into three sections: (a) study context in (M)EPS; (b) adoption theory of (M)EPS.

2.1. Electronic Payment System (EPS)

An electronic payment system (EPS) is considered part of an e-commerce transaction, which includes electronic payment for internet purchases [17].
Tan (2004) [19] classified electronic payment transactions into three sectors: retail electronic payment, professional electronic payment, and large-scale electronic payment; in particular, it is a payment system in which the valuable currency is transmitted electronically between two substances [19]. The literature on adoption focused on electronic payments shows that significant effects arise from ease of use, perceived quality, and satisfaction depending on the environment, culture, and technology [2,20,21].

2.2. Mobile Payment System (MPS)

The rapid advance of mobile technologies and the numbers of mobile phone users are giving a place to mobile payment systems (MPS) in the production of e-commerce and the natural evolution of electronic payments [17]. One of the first mobile payment solutions was introduced in 1997 by the Finnish company Sonera, which allowed users to purchase soft drinks using mobile phones [22]. Soon after, Google launched its Wallet app in 2011, while Apple launched Apple Pay in 2014. The use of mobile payment systems is increasing, and consumers are starting to accept them [23]. Then, tech companies, mobile operators, and financial institutions are already working on different scenarios and technologies to integrate mobile payments into everyday life [24]. Mobile payments have enabled consumers to eliminate the need to use cash [22,25], providing convenience and speed, ease of use, and secure information transfer between devices, such as restaurants or large retailers [26]. In another sense, Hsu et al. (2014) [27] present mobile commerce as a particular space, which allows people to exchange goods and services. A set of service qualifications distinguishes each mobile website. Depending on these services, the consumer will decide to stay or leave the site. Thus, the website’s characteristics are an effective tool determining the consumer’s decision, that is, their aptitude to behave as a convincing tool [28]. Reviews of literature on the use of mobile services have established a component such as perceived quality, usefulness, social influence, flexibility determined an influential role in expanding its acceptance quota [2,14].

2.3. Adoption Theory of (M)EPS

The literature has highlighted that technology is playing a vital and crucial aspect in the rise of the use of (mobile) electronic payment services in online transactions [29,30]. User acceptance is one of the most popular areas in the discipline of information systems. At the same time, many theories have been developed in the existing literature. The dominant theories in this area are Theory of Reasoned Action (TRA) [31], Technology Acceptance Model (TAM) [32,33], Theory of Planned Behavior (TPB) [34], Innovations Diffusion theory (IDT) [35], Extended Technology Acceptance Model (TAM2) and Unified Theory of acceptance and use of technology (UTAUT) [36], and Model of Adoption of Technology in Households (MATH) [37]. As a result, various studies were commissioned to add more concepts to better interpret user acceptance over the years. To guarantee the security, confidentiality, and availability of the (M)EPS, several frameworks have been put in place to facilitate the use and support several payment systems [38], such as Secure electronic marketplace for Europe (SEMPER) [39,40], Internet Open Trading Protocol (IOTP) [41,42], and Pay Frameworks [43]. These studies indicate that promoting electronic payments would be necessary to explore frameworks that assess these digital services’ sound quality. The literature on the acceptance of directed use on (mobile) electronic payments distinguishes that significant effects arise from ease of use and user satisfaction.

3. Theory and Hypotheses Development

This research’s theoretical constructs are based on the theories and extended to the acceptance and adoption literature, a well-established theory that has helped to build a rigid theoretical basis for our research. This section first describes our research’s theory development and then presents the research model and develops hypotheses to achieve our objectives.

3.1. Theory Development

The literature reviews on the use of (mobile) electronic payment services have established elements such as ease of use, usefulness, and flexibility [14]. Studies of theories of acceptance of use indicate that the main concepts mentioned above are available, such as perceived trust, security, price value [16,44,45,46]. Other publications [47] emphasize the importance of security, perceived ease of use, confidentiality, privacy, and perceived usefulness. Therefore, one of the ultimate influencing variables used to measure an information system’s accomplishment due to the unexpected state of the majority of systems is user satisfaction. User satisfaction can be viewed as an objective of perceived ease of use and perceived usefulness. Therefore, it is accepted that if users are entirely satisfied with an information system [48,49], this system will be successful. Extensive research in the academic literature is on the use of (M)EPS in online shopping [2,18,50]. These dominant themes include factors influencing the acceptance of payment by users [6], the contrast in the perception of these factors by various consumers [51], and the benefits and potential risks of technology [52].
Thus, the Payment Request API is a standard candidate for W3C to eliminate payment forms and meet user preferences. Tounekti et al. (2019) [2] admitted that the main factors affecting online payment preferences and consumer’s choice differ from those elaborated in traditional payment methods, which has demonstrated practical suggestions to support payment operations with web browsers and the W3C payment request (Application Program Interface (API)).
Numerous studies have examined the willingness of users to accept technology based on technology acceptance patterns. As part of the organization, we decided to adopt it for our research to validate a user payment interface. First, the perceived usefulness represents the degree of the user’s belief that using the proposed payment interface will improve the experience of its users in performing the online payment. When the perceived usefulness is privileged, the intention to use the new payment interface increases. The perceived ease of use explains the point of the complexity of the payment interface. Then, when the visual interface design complexity is less, the interface is easier to use, which increases the users’ intentions to use the payment interface. This research explores the user’s preference, and satisfaction to use the proposed payment interface combining the factors of adoption and extensive literature determining by the ease of use and usefulness, security, confidentiality, privacy, and credibility, associated with the payment method preferences, visual interface design, and desirability as additional factors. This theoretical model is illustrated in Figure 1.

3.2. User Satisfaction

Satisfaction through customer usage and perception plays a vital role in the success of (mobile) electronic payment services [53]. The previous literature has distinguished that online transactions’ acceptance is strongly motivated by user satisfaction and the user’s choice of payment method [2]. However, it is not easy to measure user satisfaction due to customers’ arrival when the service is consumed [54,55]. In this study, customer satisfaction concerning using an (M)EPS is developed through a survey to prove that our payment interface is accepted, easy to use, simplifies the payment process, and responds to user needs and preferences for payment choice [2]. User satisfaction is the dependent variable of our research, expressed through the development of hypotheses resulting from the analysis of the data collected from our questionnaire.

3.3. Research Model and Hypothesis Development

In this part, we identify the factors developed in the research methodology (see Figure 1): ease of use [9,21], usefulness [46,56], security [16,57], confidentiality [58], privacy [59,60], payment method preferences [2,18], visual interface design [61], credibility [62], and desirability [63].
For its identification, we followed the methodology explained below. Next, we describe these factors and present the hypotheses’ development, as shown in Figure 1.
Ease of use is a characteristic that would be a significant factor in the acceptability of using a payment interface. Davis (1989) [32] determined ease of use as “the extent to which a person believes that using a particular system would be effortless.” Therefore, ease of use is one of the main parameters as online business is regularly complicated for some users [9]. For any digital service, acceptance is often affected by the service’s usability, as the adoption literature shows in the work of Rana et al. (2013) [21]. However, (mobile) electronic payment services must offer a positive attitude towards user satisfaction so that ease of use is linked to the efficiency of using a method of payment, or payment interface, to discover the desired product and associated information and to examine it with minimal effort [9,21]. Therefore, we submit hypothesis H1 as follows.
Hypothesis 1 (H1).
There is a positive and significant relationship between ease of use and user satisfaction of the proposed payment interface.
Usefulness was clarified by Davis (1989) [32] as follows: “a user thinks that using a particular system would improve his performance at work.” According to Montazemi and QahriSaremi (2015) [56], perceived usefulness affects user satisfaction with the payment system. Hence, the strong influence of perceived usefulness, thus increasing users’ intentions to continue adopting online services. Digital payment models allow users to spend their money anywhere and anytime with fundamental fees [46]. Second, Davis (1989) [32], argues that a technology-driven platform should have tangible benefits that would also encourage their acceptance. Therefore, we suggest H2 as the pursuer.
Hypothesis 2 (H2).
There is a positive and significant relationship between usefulness and user satisfaction of the proposed payment interface.
Security is the extent to which the payment interface contains features that protect user data from misuse. As a result, security has been proven to be one of the main factors in the quality of an online service [2] and the protection of customer information from unsecured transactions [64]. Security has a significant role in maintaining good relations between merchants, users, and an online payment system. However, according to Chhonker et al. (2018) [16], a payment system is considered secure when it meets the need for data protection and securing sensitive personal information. Perceptions of security are identified as a challenge for users of online payment services and all new technologies in use. A lot of personal data is still required to access and use these payment technologies or platforms [45,46,57]. As shown in Figure 1, we propose H3 as follows.
Hypothesis 3 (H3).
There is a positive and significant relationship between the proposed payment interface user satisfaction and security sense.
Confidentiality is determined by protecting information, such as user identity, credit card information, and banking information, when purchasing products and services online [65]. This functionality means that the data must be secure between the parties detailed in the online payment. The purpose of using the (mobile) electronic payment interface is to facilitate payment information transactions and secure payment validation. However, a payment interface can have many other rights to access the information system and the transaction information. This information can then be analyzed and shared with these parties while keeping the priority of the confidentiality of the use of data [58]. Finally, although confidentiality concerns were raised, we looked at an impact on user satisfaction. We propose H4 as follows.
Hypothesis 4 (H4).
There is a positive and significant relationship between the proposed payment interface user satisfaction and confidentiality sense.
Privacy is a major concern for users who transact online. Users want their personal information to be protected by choosing the (mobile) electronic payment option. However, the privacy of digital services such as (mobile) electronic services and payments and data sharing can have a significant impact on service capacity [66] and the perceived risk [2]. These information privacy concerns include access to information from the (M)EPS that is supposed to be accessible, as well as access rights granted to electronic (mobile) applications such as data location, files, usage data, and network usage [60]. Gao and Waechter (2017) [59] detailed the flow theory to justify that privacy issues affect user satisfaction. For example, Suh and Han (2003) [67] studied the impact of security control and found that only the protection of privacy and data integrity had a significant effect on the acceptance of e-commerce. Therefore, we suggest H5 as follows.
Hypothesis 5 (H5).
There is a positive and significant relationship between the proposed payment interface user satisfaction and privacy sense.
Payment method preferences are a feature that would be the main character of accepting a payment system interface that supports multiple payment methods [2]. Preceding research has also shown that the end-users’ risk perception affects how they choose a payment method [18,68]. Therefore, we analyze the actual use of payment instruments and the relationship between usage and preferences. According to Tounekti et al. (2019) [2], the concept of intention to purchase was treated as a key component to complement the preferred payment method. The results of the previous analyses show that the highest percentage of responses confirms that the most used web browser was the browser supporting several preferred payment methods [2].
Hypothesis 6 (H6).
There is a positive and significant relationship between being able to configure the preferred payment method and user satisfaction of the proposed payment interface.
Visual interface designs combined with interfaces and web applications make it easier to find and access required information [61] or allow transactions to be carried out with minimal effort. Next, it is essential to design a user-friendly payment interface to efficiently perform their payment transactions. Payment systems have become more comprehensive and precise, with more user-friendly visual interface designs [69], which means user perceptions could influence perceived control and perceived security in e-commerce [61]. Other researchers have demonstrated the importance of interface design, and visual design that cover the interface’s visual aspect. Besides, visual interface design has influenced users’ intention to examine payment interfaces and applications [70]. It may also refer to factors such as navigation, interface appearance, and product choice.
Hypothesis 7 (H7).
There is a positive and significant relationship between visual interface design and user satisfaction of the proposed payment interface.
Credibility is the extent to which the content that the payment system entity can provide is reliable. In some previous studies [62], credibility is used to assess a payment interface’s content. The credibility of services comes from using data systems such as payment services and digital services. Granting the inductive proof argument, we hypothesized that if a payment interface had greater credibility, user satisfaction would be higher for online payments [62].
Hypothesis 8 (H8).
There is a positive and significant relationship between credibility and user satisfaction of the proposed payment interface.
Desirability should be seen as how we can get a user to act through design. According to Van Schaik and Ling (2008) [60], desirability involves the degree of a payment interface design’s visual appeal. Therefore, this research attempted to assess consumers’ perceptions, desirability, and willingness to pay using multiple supported payment systems and simplify the payment process using the payment interface. On the other hand, we tried to study this aspect from another point of view, namely the desirability of the payment interface, which reflects the users’ perceptions and points of view.
Hypothesis 9 (H9).
There is a positive and significant relationship between desirability and user satisfaction of the proposed payment interface.

4. Research Methodology

Our study aims to discuss and understand the user’s awareness and intention to use a new payment interface, which has been designed to facilitate the payment process using a (M)EPS. The payment interface was evaluated through a survey of international participants. A methodological approach to quantitative research based on literature is employed to interpret the derived factors in the context of user satisfaction. The theoretical research model (Figure 1) used is structured as follows: usage satisfaction (proposed interface solution) and the characteristics of the knowledge contributor (such as ease of use, usefulness, security, payment method preferences, etc.).
Multiple regression analysis was undertaken to identify which factors have a positive influence on user satisfaction of the proposed payment interface. For this, we defined the nine hypotheses, and to test each of the hypotheses independently by considered Pearson’s chi-square column to identify p-value, only those hypotheses were accepted whose p-value was less than or equal to 0.05.

4.1. Design of a New Payment Interface

In the previous article, Tounekti et al. (2019) [2] cited this to improve our understanding of user preferences and guide the plan for future payment methods principally associated with W3C payment API support. We studied designing a payment interface responding to user preferences and supporting multiple payment methods in this context. The payment interface developed in this research is based on API’s concept to be implemented on web browsers.

4.1.1. Current Payment Interface Offred by GCWB

Now, when the user logs into Chrome on their laptop, they can use the payment methods already saved in their Google account to fill out payment forms (Figure 2). Once the payment card is registered with the Google account, the user only has to enter the security code to pay for their online purchases. Chrome confirms that each time the browser opens, its user has a specific task to perform. That is why its developers are constantly thinking about new features that will further improve the user experience.

4.1.2. New Payment Interface Proposed in Our Study

Based on the research of Tounekti et al. (2019) [2], our research is focused on providing payment interfaces that facilitate payments when users support multiple payment systems and attempt to improve current web browser interfaces. Our new payment interface could support various payment systems, help users select their preferred payment method, and improve service acceptance. However, this new interface allows the user to determine their preferences to support multiple payment systems and facilitate the payment process. A sequence diagram (Figure 3) is defined as a type of interaction diagram because it describes how objects and components interact to complete a process.
The fundamental idea behind the proposed concept of the sequence diagram (SD) is to augment the sequence diagram with flow/exchange-based information such that it provides a more information-rich graphical representation of the system functions. To determine this goal, the SD’s visual representation must embed the presentation of the flows associated with the browsers, interface payment solution, and merchant or any customer, along with the timeline.
The proposed schema for the SD is presented in Figure 3, based on the Unified Modeling Language (UML) role. It allows the browsers, interface payment solution, and merchant and any customer to have multiple flowlines, to represent the timeline for the events and transformations on each of the flows involved in achieving the system’s functions.
An alternative combined fragment is used in our diagram to specify a group of lifelines/actors to show conditional flow.
For example, in Figure 3, using alternative multiple fragments [alt] because only the one whose condition is proper will execute ([If] user chooses new PM-not registered before = “true” [else] user chooses registered and preferred PM).
The user is brought to the interface via electronic (mobile) terminals. Once the user chooses their products and puts them in the shopping cart, the appropriate product information is then presented to them. To validate their shopping cart online, a user must go through our payment interface. This study used Adobe Photoshop CS6 2020 to generate the mockup for the web payment interface as a graphics editor platform. The interface is divided into two parts (Figure 4 and Figure 5):
Items-1: Preferred payment system [One-Click payment]
This element presents the new functionality, ease to use, usefulness, and security. The user can select one of the preferred payment methods registered before, with one-click, he/she can validate the shopping and finish it.
Items-2: Payment system available
This element presents the different payment methods supported by this solution. The user can choose a payment method (“Options” button) to validate their payment process among all the predefined payment methods. The functions are described as follows.

4.2. Survey Design and Content

To better understand what people know about the (M)EPS and to what extent they accept the payment interface offered, a user acceptance survey was conducted. The 13-question survey begins with an informative statement so that the participants can provide authentic, conclusive, and complete survey responses which helps us collect quality answers and ensure respondent confidentiality. The survey was developed and conducted using a Survey Monkey online questionnaire. There are four parts to the questionnaire, and the first is demographic information such as gender, age range, location, and education level. These data were used to characterize the sample and to constitute statistical results.
The second part investigates how often online payment is used to purchase products and services. The remaining questions presented different payment system solutions available (Credit Card, PayPal, Bitcoin, Google Pay, Apple Pay, and Samsung Pay) and asked respondents to indicate which solutions they prefer and use the most, as well as the most critical factors (ease of use, usefulness, security, confidentiality, privacy, payment method preferences, visual interface design, credibility, and desirability) when choosing their payment method. These questions were used to define the types of solutions that integrate under the system. In part 3, we present a screenshot (see Figure 4) of the current payment interface example and their features (ease of use, security, privacy, confidentiality) comparing with the characteristics (ease of use, usefulness, security, confidentiality, privacy, payment method preferences, visual interface design, credibility, and desirability) of the proposed payment interface to examine their willingness to accept and use it. Then, we present a second screenshot (see Figure 5), showing all the transaction steps: starting with the user choosing between the available payment methods until they validate and pay for the products purchased. Next, we asked the participants to use multiple-choice questions to compare between the current payment interface (GCWB) and the payment interface proposed as a solution. The statements are written in sentence form detailing the following characteristics: ease of use, usefulness, security, confidentiality, privacy, payment method preferences, visual interface design, credibility, and desirability; participants were asked to prove whether they were satisfied or dissatisfied with the statements on a Likert scale (very dissatisfied (1)–very satisfied (5)), by comparing the new payment interface developed and designed and the other current payment interfaces presented (Figure 4). Finally, in part 4, we asked respondents using questions from the Likert scale (5-point Likert scale ranging from (1) extremely well to (5) not at all well) allowing us to examine whether the new payment interface meets users’ preferences and needs during the payment transaction. Next, we asked the respondents to use multiple-choice questions to explore the most important factors (ease of use, usefulness, security, confidentiality, privacy, payment method preferences, visual interface design, credibility, and desirability) when using the new payment interface and choosing their preferred payment method. Participants could choose from a 5-point Likert scale (1), not at all likely, (5) extremely likely if they would recommend this new interface payment (Figure 5) to their friend or colleagues, then we asked users an open question to give their questions, opinions, and comments on the questionnaires, the interface and in general.

4.3. Data Collection Method

Since the research prescribed a large sample to rank the sources of satisfaction with the new payment interface, we used SurveyMonkey because it is effortless to create and customize the survey with the audience you want to target. The dissemination of the survey was established on the sharing of the link precisely on the web, social media (Facebook, LinkedIn, and WhatsApp), and addressing by email over a period from July to September 2020. Among the 310 questionnaires sent, we received 271 (87.42%). Only five responses (1.84%) were rejected because they contained missing data. Convenience sampling was the most common technique used when investigators were controlling a large population. Therefore, 266 responses were accepted for data analysis, which was analyzed using SPSS. 19 (Statistical Package for Social Sciences).

5. Results

To clarify the relationship and the effects of the nine factors (perceived ease of use, usefulness, confidentiality, the visual interface design, security, payment method preferences, credibility, privacy, and desirability) on the intention of using the new payment interface (Figure 4), a linear regression analysis was performed.

5.1. Demographics

The demographic characteristics of the respondents are presented in Table 1. A gender balance (male 41.4% and female 58.6%) can be detected, and two age groups prevail (18–25) (39.8%) and (26–35) (41%). In comparison, a significant minority who answered the questionnaire is over 46 years old (5.2%), which can explain and affirm that people in this age group are interested in the (M)EPS. Almost all participants have a higher education level (98.1%), of which 78.2% are at university education level and 21.8% at the primary and secondary education level. Participants came from different continents, mainly Europe (47.7%), followed by Africa (25.2%), America (14.3%), Asia (11.3%), and Oceania (1.5%). The profiles of the respondents (Table 2) revealed that 45.5% of the respondents used the Internet to buy products and services between 1 and 2 times per month, 29.3% used it to buy 3–4 times a month, and 20.7% of respondents buy online only during sales periods.

5.2. Cross Tabulation to Compare the User Satisfaction between the Current/New Payment Interface

The survey results presented in Table 3 show the highest number of respondents indicating the satisfied/very satisfied option using the new payment interface (96%). In contrast, in the current payment interface, the results are 48%. This means that respondents show a higher preference in using the new payment interface than the current payment interface, as it meets their preferences when processing their payment online. Finally, 32% of respondents were very dissatisfied/dissatisfied when using the current payment interface (Table 3).
In Table 4, we can see that the respondents are satisfied/very satisfied with the use of the current payment interface and intention to use the new payment in the future online transaction at the same time is higher (123 respondents). This means that many respondents use the current payment interface satisfactorily, and therefore, it is worth using the new payment interface in the future. Besides, Table 4 shows that respondents dissatisfied/very dissatisfied with using the current payment interface are interested in using the new payment interface (82 respondents).

5.3. Cross Tabulation to Test Independence and Relationship between Variables

Regression analysis was performed on scaled items to examine user acceptance of the new payment interface (Figure 4). Therefore, multiple regression was used to determine the effect of different factors (perceived ease of use, usefulness, confidentiality, visual interface design, security, payment method preferences, credibility, privacy, and desirability) on the probability of using the new payment interface in the future.
The chi-square independence test was used to determine if there is a relationship between the proposed new payment interface (Figure 5) and the divers component. Phi and Cramer’s V discovers the strength of this association. From Table 5, the results show a significant Pearson chi-square for all variables at 1% except for the “credibility” at 5%, which means rejecting the null hypothesis (“there is no relationship”) and obtain the alternate hypothesis (“there is a relationship”) of the existence of an association between the proposed user interface and all the characteristics studied.
Ease of use has the strongest relationship with the proposed new user interface (p < 0.05 and Phi and Cramer’s V = 0.45), which is followed by payment method preferences (Phi/Cramer’s V = 0.397), security (Phi/Cramer’s V = 0.382), usefulness (Phi/Cramer’s V = 0.353), confidentiality (Phi/Cramer’s V = 0.350), privacy (Phi/Cramer’s V = 0.305), desirability (Phi/Cramer’s V = 0.240), and visual interface design (Phi/Cramer’s V = 0.235). Credibility has the lowest relationship strength (p < 0.05 and Phi/Cramer’s V = 0.163), explaining why respondents could not guess how credible the proposed interface is. The variables studied (visual interface design, ease of use, confidentiality, payment method preferences, security, credibility, usefulness, privacy, and desirability) are important in constructing the preferred user interface. By evaluating each variable separately, in Table 6, we can clearly show each separate weight and interest.
Table 6 displays the highest percentage of respondents satisfied/very satisfied with the proposed new payment interface because it meets their needs regarding the feature of ease of use (80.82% of respondents), security (75.93%), payment method preferences (72.93%), usefulness and visual interface design (67.66%), privacy (65.41%), confidentiality (60.9%), and, finally, the least valued characteristics are credibility (47.36%), and desirability with (37.96%). We can conclude that ease of use, security, payment method preferences, usefulness, visual interface design, privacy, and confidentiality are the most important characteristics that the user accepts by using the new payment interface.
Table 7 shows the respondents’ frequency (89.8%) who are very satisfied (extremely well/very well) with the new payment interface offered because the new payment interface meets their preferences and needs during the payment transaction. With this high percentage, we can conclude that many respondents are ready and willing to use this new payment interface in the future.
Table 8 shows the respondents’ frequency (37.6%) who are also satisfied and willing to use the current payment interface offered by the GCWB in their future payment transactions. Then, 35% of this group of respondents were dissatisfied and very dissatisfied with the use of this payment interface in the future, and also, 27.4% were neither satisfied nor dissatisfied with this current payment interface. With these high percentages, we can conclude that many respondents are balancing between wanting to use this current payment interface or not in the future.
Based on the Kaiser–Meyer–Olkin coefficient (KMO), which is higher than 0.50, and Bartlett’s test of sphericity, which is significant at 0%, the use of principal component analysis (PCA) was justified. PCA method was used to avoid the multi-co-linearity between explicative variables (Table 9). The dependent variable was the weighted intention to use resulting from the factor analysis and explanatory variables: perceived ease of use, usefulness, confidentiality, visual interface design, security, payment method preferences, credibility, privacy, and desirability derived from the factor analysis (Table 10).
Table 10 shows the initial eigenvalues and the sums of extraction of the squared loadings. The Total column gives the eigenvalue or the variance of the original variables interpreted by each element. The variance column presents the ratio, indicated as a percentage, of the variance explained by each component to the total variance of all variables. In addition to the cumulative percentage column, the percentage variance defined by the first nine elements is provided.

5.4. Cross-Analysis—Relationship between Usage Satisfaction of the Interface and Respondents Supported Three or More Payment Systems

The cross-tab was a 2 by 2 table used to measure the association between payment interface user satisfaction, participant supporting multiple (M)EPS, and factors.
Table 11 shows the highest frequency of participants who used at least three types of payment systems (54.14%) when using the online purchase transaction. It appeared that 54.14% of the survey participants were people who used or preferred to use three or more payment systems for their payment transactions.
Our results for user groups that support multiple payment systems (144 participants (54.14%)) showed in Table 12 the numbers of participants satisfied and who accepted to use our payment interface offered in the future (139 out of 144 user groups, with 96.52%), the relationship between user satisfaction of this participant group (144 out of 266 participants) and factors.
Additionally, we found a significant relationship between payment method preference factors (93.75%), confidentiality (90.27%), usefulness (88.88%), visual interface design (84.72%), ease of use (83.33%), credibility (76.38%), security (58.33%), privacy (47.22%) and with the lowest percent for the desirability (27.08%), and this group of participants.

5.5. Extraction Method: Principal Component Analysis

Principal component analysis (PCA) was deployed in our paper to avoid the correlation between the independent variables. Nine components were identified; they are presented in Table 10. These nine components explain approximately 65% of the total variance of the initial variables. PCA was justified by the KMO coefficient and its significance (Table 9). The nine factors extracted were used to apply the multiple linear regressions to estimate their side effect to use the new payment interface. As mentioned above, PCA reduces unbiased results.
Based on the model summary (Table 13), we notice that the independent variables used in our model explain 0.546, the dependent variable, which is the intention to use the new payment interface. The adjusted R Square was 0.529, or 52.9% of the variance was represented by the nine factors (ease of use, usefulness, confidentiality, visual interface design, security, payment method preferences, credibility, privacy, and desirability), which are reported as a good fit for the regression model. The multivariate analysis began with a multiple regression inquiry to highlight the relationships and the inferential impacts on the dependent variable between the nine factors and the intention to use the new payment interface to validate the different hypotheses proposed preceding.
Based on regression analysis, eight independent variables are statistically significant, which means that these eight variables are significant preceptors to use the new payment interface (ease of use, usefulness, confidentiality, visual interface design, security, payment method preferences, credibility, and privacy). The desirability factor is not statistically significant with the standardized regression coefficient of −0.107 (p = 0.148) (Table 14).
To describe users’ payment interface preferences, we processed the various responses received from our respondents to specify which characteristic(s) is (are) necessary for users to choose their preferred payment interface. Then, we noted a positive effect of security and confidentiality on the proposed payment interface. Privacy, visual interface design, and credibility are significant at 5%. Additionally, payment method preferences with a coefficient of 0.183 and significant at 0.009 have a positive relationship with the new payment interface. Security and confidentiality have the highest coefficient (0.329), which reveals that it impacts the user preferred new payment interface. Users consider security and confidentiality as the first primordial characteristic to choose their preferred payment interface. Ease of use and usefulness has the second rank in the importance for the user selection of his/her preferred payment interface with the coefficient of 0.232.
In Table 15, an overview of the validated hypothesis and the results of the validation are illustrated. Out of the nine constructs which were identified from the topic models, eight relationships were accepted.

6. Discussion, Implications, Limitations, and Future Research

The purpose of our research was based on the literature and the theoretical research model to examine the acceptance of the proposed payment interface to facilitate the payment process, to explain the use of multiple payment systems, and to compare it to an interface payment offered by the GCWB. In this research, the collected data was analyzed, processed, and tested to determine user satisfaction as the critical factor in using the new payment interface, which supports multiple payment systems.

6.1. Discussion of Findings

In this study, we tried to identify the characteristics that directly influence the satisfaction and acceptance of the payment interface. The study attempted to deploy the user preference literature in (M)EPS to predict satisfaction using the proposed payment interface. The validation of the use was completed using an online questionnaire and the data collected. Then, an in-depth multivariate statistical analysis was used to confirm the proposed research objective.
A generic sample of 266 responses matching the data, a gender balance (male 41.4% and female 58.6%) can be observed, which means that the gender of the respondents influences the reasons for starting the use of the payment interface. Two age groups dominate in this study, (18–25) (39.8%) and (26–35) (41%), who had a higher education level (secondary and university) (98.1%), which means that these groups are made up of people who are frequent users of (M)EPS. Besides, 5.2% of participants who answered the questionnaire are over 46 years old, confirming that there are people of this age group interested in the (M)EPS (Table 1). Remarkably, our first result suggests that there is a relationship among demographic characteristics (gender, age, and educational level) and intention to use the new payment interface, as the results found by Tounekti et al. (2019) [2], that gender, age, and educational level have a significant effect on the choice of payment methods, as well as on online consumer’s behavior. These respondent profiles used the internet (45.5%) to buy products and services between 1 and 2 times per month (Table 2). Therefore, it can be concluded that the same group of respondents agree to use our proposed payment interface. The same group seeks to have a payment interface that supports more than one payment method and meets their needs and preferences [2].
On the other hand, our research objective was to compare the current payment interface offered by the GCWB with our new payment interface taking into consideration user satisfaction. The questionnaire results presented in Table 3 showed the frequency of participants (the group of respondents who choose the new payment interface) satisfied and very satisfied are 96% and 4% neither satisfied nor dissatisfied. Then, the participant frequency (the group of respondents who choose the current payment interface) that were satisfied and very satisfied is 48%, 20% neither satisfied nor dissatisfied, and 32% very dissatisfied/dissatisfied with the current payment interface (Table 3). Besides, comparing between the present and new payment interface, the number of participants satisfied and very satisfied with the proposed payment interface is higher with 123 (48.04%) responders, over 82 (32.04%) responders dissatisfied and very dissatisfied, and 51 (19.92%) responders neither satisfied nor dissatisfied with using the current payment interface (Table 4).
This study used direct and indirect questions to examine the preferred payment interface composition. The chi-square independence test was used to determine if there is a relationship between the proposed new payment interface and the different features. Phi and Cramers V discovers the strength of this association (Table 5). In general, many previous studies [2,21] confirm the importance of ease of use, which is one of the characteristics indicated in this study as a determining factor in the satisfaction of using the new payment interface (Pearson chi-square = 53.87, Phi/Cramer’s V = 0.45).
Results in Table 5 show that other factors could also be important, payment method preferences (Pearson chi-square = 41.84, Phi/Cramer’s V = 0.397), security (Pearson chi-square = 38.9, Phi/Cramer’s V = 0.382), confidentiality (Pearson chi-square = 34.16, Phi/Cramer’s V = 0.350), usefulness (Pearson chi-square = 33.09, Phi/Cramer’s V = 0.353), privacy (Pearson chi-square = 24.78, Phi/Cramer’s V = 0.305), visual interface design (Pearson chi-square = 14.64, Phi/Cramer’s V = 0.235), and credibility (Pearson chi-square = 7.08, Phi/Cramer’s V = 0.163). This study also confirms that ease of use has the strongest relationship with the proposed new user payment interface (p ≤ 0.001 and Phi/Cramer’s V > 0.25). On the other hand, credibility has the weakest relationship strength (p > 0.01 and Phi/Cramer’s V = 0.163), explaining why respondents could not guess how the proposed interface is credible. Assessing each variable separately (Table 6) to test the relationship between the new payment interface and the different characteristics, we can conclude that ease of use (80.82%), security (75.93%), payment method preferences (72.93%), usefulness (67.66%), visual interface design (67.66%), privacy (65.41%), and confidentiality (60.9%) are the most important characteristics for the users to accept using the new payment interface, and, finally, the least valued characteristic is credibility (47.36%).
In line with this, Tounekti et al. (2019) [2] found in their recent research that there is a relationship between the most convenient web browsers, the payment method on desktop and mobile phone and the payment features. Then, many researchers have observed that consumers’ factors were the active guide for using a payment method [2]. Therefore, results in Table 7 show that a large number of respondents (89.8%) are satisfied and very satisfied with using the new payment interface, and they are also ready and willing to use this new payment interface in their future payment transactions (Table 7). Therefore, 37.6% of respondents use and wish to use the current payment interface offered by the GCWB in their future payment transactions. Additionally, 35% of this group of respondents were dissatisfied with the use of this payment interface. We can conclude that some participants are currently using the GCWB payment interface and that they are satisfied with using it and want to continue using it in the future, but, with the same percentage of other groups, they are not satisfied with the use of the current payment interface. They do not wish to use it in the future (Table 8). The Kaiser–Meyer–Olkin (KMO) values were 0.7, consecutively greater than 0.5, and Bartlett’s test of sphericity (Table 9), which is significant at 0%, the use of factor analysis and principal component analysis (PCA) was justified. The eigenvalues were greater than 1, which proved each component variable’s adequacy to explain the variance of the dependent variable (intention to use the new payment interface) (Table 10).
A recent study by Tounekti et al. (2019) [2], has determined that many people who support and use more than one payment method want to see their preferred payment method when shopping online. Consistent with this, our results showed that we have the highest frequency of group participants who used at least three types of payment systems (54.14%) satisfied with our proposed payment interface and willing to using it in their future online transactions (Table 11). Besides, we found that there is a relationship between payment interface user satisfaction, participant supporting multiple (M)EPS, and payment method preference factors by 93.75% of groups of a participant who support various payment systems (144 out of 266 participants), confidentiality (90.27%), usefulness (88.88%), visual interface design (84.72%), ease of use (83.33%), credibility (76.38%), security (58.33%), and finally privacy with 47.22% of this group of participants (Table 12).
The model summary for multiple regression analysis is illustrated in Table 13, was developed to identify the value of R square, which explains the explainability of the model. In this model, the value of R square is 0.546 for the construct usage satisfaction for the new proposed payment interface, which interprets that ease of use, usefulness, security, privacy, confidentiality, payment method preferences, visual interface design, and credibility variables can explain the variance towards predicting usage satisfaction to the extent of 54.6%; therefore, this model is accepted. The results in Table 13 show that the adjusted R-square was 0.529, or 52.9% of the variance was explained by the nine factors (ease of use, usefulness, security, payment method preferences, privacy, confidentiality, visual interface design, and credibility), which is treated a good fit scale for the regression model.
Based on the regression analysis (Table 14), eight of the independent variables (ease of use (B = 0.232, p = 0.002), usefulness (B = 0.232, p = 0.002), confidentiality (B = 0.329, p = 0), visual interface design (B = 0.14, p = 0.059), security (B = 0.329, p = 0), payment method preferences (B = 0.183, p = 0.009), credibility (B = 0.147, p = 0.048), and privacy (B = 0.149, p = 0.045)), are statistically significant predictors of users’ acceptance to use the new payment interface, and the consecutive assumptions are accepted (Table 15). The desirability factor is not statistically significant (negative relationship) with the standardized regression coefficient B = −0.107 (p = 0.148); the hypothesis is rejected, that means, desirability is not seen as a major challenge for the potential customer on (M)EPS (Table 15).
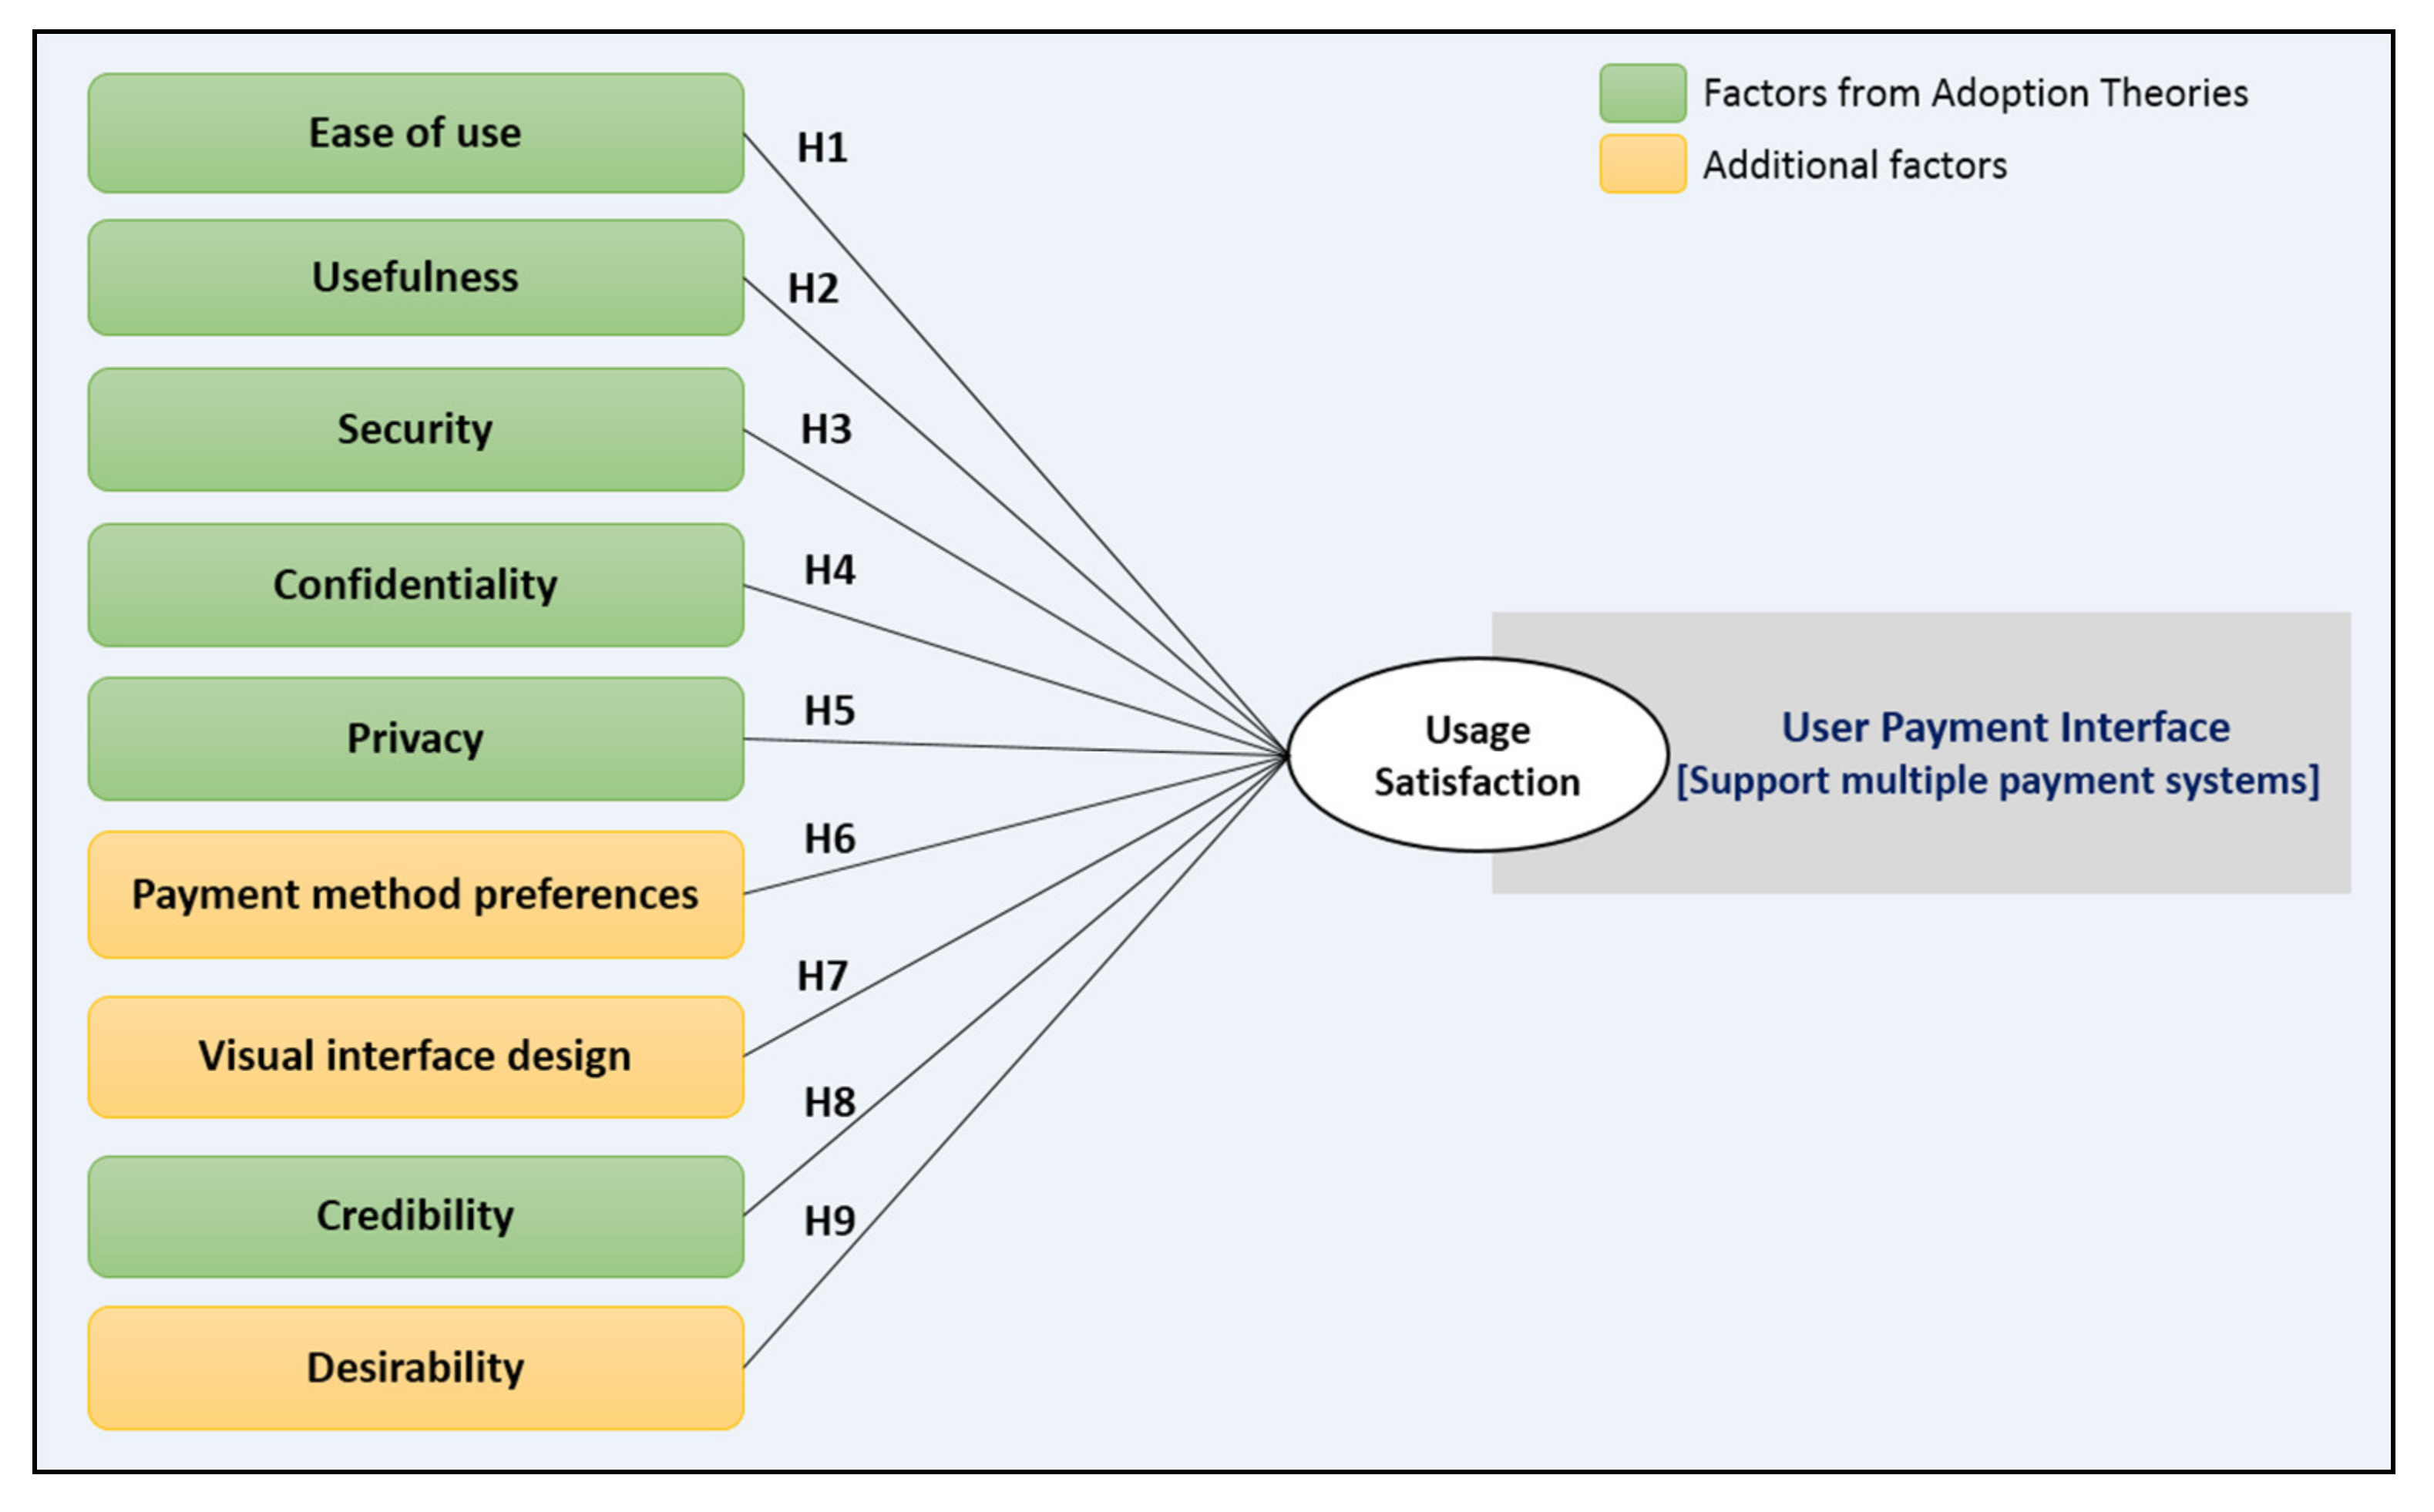
However, our analysis shown in Table 15 indicates that in using the (M)EPS interface, eight factors such as ease of use, usefulness, security, privacy, confidentiality, payment method preferences, visual interface design, and credibility have more significant impacts. Subsequently, it was also identified that the remaining desirability factor had lesser effects.
Therefore, the hypothesis surrounding constructs such as ease of use, usefulness, security, privacy, confidentiality, payment method preferences, visual interface design, and credibility was significantly associated with user’s perception towards interface payment solutions. The significance value of this hypothesis was less than 0.05. Therefore, hypotheses such as H1, H2, H3, H4, H5, H6, H7, and H8 were accepted. However, the desirability (H9) hypothesis was not accepted because the p-value of this relationship was more significant than 0.05. The result of the regression analysis is illustrated in Table 14 and Table 15.
On the other hand, first, security and confidentiality have the highest coefficient (B = 0.329, p = 0), which reveals that it has an essential impact on the user preferred new payment interface, ease of use, and usefulness (B = 0.232, p = 0.002) has the second rank in the importance for the user selection of his/her preferred payment interface. These results are consistent with similar research on accepting (mobile) electronic payments [2,16,45,46]. Most respondents mentioned security as an important feature of the new payment interface because security was associated with a specific trusted interface. Overall, 239 responses out of 266 responses (89.8% of respondents) mentioned the capacity to provide the predetermined service as a satisfactory characteristic of the new user payment interface.

6.2. Theoretical and Practical Implications

The main objective of this research was to identify the user’s preferences when choosing a payment interface to facilitate the payment process and the features that they appreciate the most during an online payment transaction [2]. Therefore, the importance of designing a helpful payment interface is still relevant and necessary since it is a feature that many (mobile) e-commerce users will use in all online payment transactions. Our study’s implications are presented as follows: we will provide a theoretical contribution by introducing a model for measuring user satisfaction and the intention to use a new payment interface. Then, we also made a methodological contribution based on survey collection data that shows that the users have accepted our interface. Therefore, we can add that the practical implications of our work are as follows: if web browsers could adopt and improve their current interfaces taking into account our proposal, and if our payment interface is adopted on most browsers, user satisfaction will be better in this area, and they will be more satisfied with the payment process, and the transaction will be completed faster. Furthermore, making this process easier and faster will provoke that the effect of cart abandonment is lesser. Subsequently, we can say that our important result could be interesting for the W3C payment group, and we will try to send our results.

6.3. Limitations and Future Research

The aim of our document is for the interface to facilitate the online payment process when the user supports multiple payment systems and, presumably, has a preferred payment system. For this reason, we designed questions to compare both the payment interface offered by the GCWB band our proposed payment interface. However, this question did not attempt to reach the usability of the two interfaces on a browser since our interface was offered as a static web mockup. Our research work has several limitations, which we mention below: 266 responses were collected. We applied survey analysis techniques and multivariate analysis, and we had limited control of the participants’ cultural and demographic backgrounds. This group of participants favors the new technologies and people accustomed to paying on the Internet, which uses (M)EPS, and therefore is less representative of users who can use these digital payment platforms less frequently. Besides, the survey (Appendix A) was drafted in the English language because it was presented to a universal public. Therefore, these limitations should be resolved by providing questionnaires in multiple languages to respond to most people who speak languages other than English; to gain more participants, the questionnaire should be kept open for several weeks or months.
Thus, there are limits to using an online questionnaire as a data selection method because the survey is self-administered. As an outcome, the researcher has no control over the participants and cannot propel in-depth answers. We propose in our future research to make a dynamic and functional mockup where users can interact with the interface to check if their opinion would be the same as that of a simple mockup. A more specific feature might require a more detailed analysis. Future research could also further investigate the sources of satisfaction/dissatisfaction identified using qualitative methods and could further examine what constitutes the attributes of a new usable payment interface. It would also explore what elements are devoted to the perception of security in the context of (M)EPS. Future research should also consider the processing time of different payment methods, and it might be necessary to have more demographic variables on the questionnaire to provide more reliable results. The questionnaire could also be alternated to give some respondents more information, for example, on security issues related to payment methods.
In contrast, other respondents are expected to rely on their own experience and knowledge. Methodologically, the approach highlighted can be used in future studies for exploring theoretical models’ validation. This would exceptionally be relevant if data-driven inductive research is undertaken to contribute to the domain of (M)EPS. Future research can also improve upon this approach methodologically by developing strategies whereby better internal and external validity measures can be demonstrated.
Given its limitations, our research provides a vital launching pad for future research in different backgrounds investigating the aspects influencing consumers’ intentions to use (M)EPS. Our study opens up the possibility of sharing our results with the W3C payment and web standardization group to further improve the online payment domain, which accordingly with the current global COVID-19 situation, assuming people start using (M)EPS more than before, and subsequently demographic issues and preferences, with higher use of (M)EPS, may change. Therefore, it would be interesting to carry out further studies regarding the number of payment systems used, the number of transactions carried out occasionally, more payment systems, and the same problems and needs.

7. Conclusions

This study explored in-depth knowledge of attitudes, rationale, and motivations to use a new payment interface. The payment interface is a new service emerging in the (M)EPS to simplify the online payment process when the user supports more than a payment system and has a preferred payment system. The results of this research show that participants are satisfied with the new payment interface offered. Furthermore, the research strongly confirms the eight factors identified in the study as a good determinant of the new payment interface choice. Likewise, this research was able to complement the limited actual research and study on (M)EPS in the context of consumers’ behaviors. Participants in this research agree on interface payment factors: ease of use and usefulness, security, confidentiality, privacy, payment method preferences, visual interface design, and credibility. The crosstab method made it possible to see the relationships between the different functionalities, factors, and the preferred payment method. The comparisons between the payment interface offered by the GCWB band our proposed payment interface. The results showed that the age groups (18–35) with higher education levels were the most aware of the use of (M)EPS with a higher tendency to use new technologies. Thus, taking part in the more diverse users of (M)EPS, such as older, less educated, and less experienced users, can allow the construction and validation of a more generalized model. We also found a significant relationship between demographic characteristics (gender, age, and education level) and the intention to use the new payment interface. The limited number of respondents used as the study sample precluded the possibility of generalizing this study’s results to larger countries in the world.

Author Contributions

Conceptualization, O.T., A.R.-M. and A.F.S.-G.; methodology, O.T., A.R.-M. and A.F.S.-G.; software, O.T., A.R.-M. and A.F.S.-G.; validation O.T., A.R.-M. and A.F.S.-G.; formal analysis, O.T., A.R.-M. and A.F.S.-G.; investigation, O.T., A.R.-M. and A.F.S.-G.; resources, O.T., A.R.-M. and A.F.S.-G.; data curation, O.T., A.R.-M. and A.F.S.-G.; writing—original draft preparation, O.T., A.R.-M. and A.F.S.-G.; writing—review and editing, O.T., A.R.-M. and A.F.S.-G.; visualization, A.R.-M. and A.F.S.-G.; supervision, A.R.-M. and A.F.S.-G. All authors have read and agreed to the published version of the manuscript.

Funding

This research received no external funding.

Institutional Review Board Statement

Not applicable.

Informed Consent Statement

Not applicable.

Data Availability Statement

Not applicable.

Acknowledgments

This work was funded by the European Commission’s H2020 Programme under the Grant Agreement Number 830929 (CyberSec4Europe project).

Conflicts of Interest

The authors declare no conflict of interest.

Appendix A

The presentation of the questionnaires
https://www.surveymonkey.com/r/XN5WGK8 (accessed on 22 April 2021).
Table A1. Survey Questions.
* 1. Gender
* 2. Age
* 3. Location
* 4. Education Level
* 5. How often do you buy products/services online?
* 6. What kind of payment systems have you used to make payments?
Select multiple if applicable.
* 7. What kind of payment systems preferred to make payments?
Select multiple if applicable.
* 8. What were the most important factors when selecting your preferred payment method? Select multiple if applicable
* 9. Comparing the CURRENT and the NEW user interface; How satisfied are you with the following statements?
* 10. How well does this NEW user interface meet your preferences and needs?
* 11. What do you find best about this proposed NEW user interface?
Select multiple if applicable
* 12. How likely is it that you would recommend this NEW interface to a friend or colleague?
* 13. Do you have any other comments, questions, or concerns?

References

  1. Chen, K.-H.; Chang, F.-H.; Chen, Y.-L.; Chen, P.-M. The Relationships between Corporate Credibility, Service Convenience, and Consumers’ Use Intentions: Toward Ticketing Apps for Low-Cost Carriers. Sustainability 2019, 11, 810. [Google Scholar] [CrossRef] [Green Version]
  2. Tounekti, O.; Ruiz-Martinez, A.; Gómez, A.F. Users supporting multiple (mobile) electronic payment systems in online purchases: An empirical study of their payment transaction preferences. IEEE Access 2019, 8, 735–766. [Google Scholar] [CrossRef]
  3. Alkhowaiter, W.A. Digital payment and banking adoption research in Gulf countries: A systematic literature review. Int. J. Inf. Manag. 2020, 53, 102102. [Google Scholar] [CrossRef]
  4. De Luna, I.R.; Liébana-Cabanillas, F.; Sánchez-Fernández, J.; Muñoz-Leiva, F. Mobile payment is not all the same: The adoption of mobile payment systems depending on the technology applied. Technol. Forecast. Soc. Chang. 2019, 146, 931–944. [Google Scholar] [CrossRef]
  5. Chawla, D.; Joshi, H. Consumer attitude and intention to adopt mobile wallet in India–An empirical study. Int. J. Bank Mark. 2019. [Google Scholar] [CrossRef]
  6. Oliveira, T.; Thomas, M.; Baptista, G.; Campos, F. Mobile payment: Understanding the determinants of customer adoption and intention to recommend the technology. Comput. Hum. Behav. 2016, 61, 404–414. [Google Scholar] [CrossRef]
  7. Morosan, C.; DeFranco, A. It’s about time: Revisiting UTAUT2 to examine consumers’ intentions to use NFC mobile payments in hotels. Int. J. Hosp. Manag. 2016, 53, 17–29. [Google Scholar] [CrossRef]
  8. Chandrasekhar, U.; Nandagopal, R. Mobile payment usage intent in an Indian context: An exploratory study. Asian J. Inf. Technol. 2016, 15, 542–552. [Google Scholar]
  9. Gong, X.; Zhang, K.Z.; Chen, C.; Cheung, C.M.; Lee, M.K. Transition from web to mobile payment services: The triple effects of status quo inertia. Int. J. Inf. Manag. 2020, 50, 310–324. [Google Scholar] [CrossRef]
  10. Chun, S.-H. E-Commerce Liability and Security Breaches in Mobile Payment for e-Business Sustainability. Sustainability 2019, 11, 715. [Google Scholar] [CrossRef] [Green Version]
  11. Verkijika, S.F. An affective response model for understanding the acceptance of mobile payment systems. Electron. Commer. Res. Appl. 2020, 39, 100905. [Google Scholar] [CrossRef]
  12. Nykvist, C.; Larsson, M.; Sodhro, A.H.; Gurtov, A. A lightweight portable intrusion detection communication system for auditing applications. Int. J. Commun. Syst. 2020, 33, e4327. [Google Scholar] [CrossRef]
  13. Sodhro, A.H.; Pirbhulal, S.; Sangaiah, A.K.; Lohano, S.; Sodhro, G.H.; Luo, Z. 5G-based transmission power control mechanism in fog computing for Internet of Things devices. Sustainability 2018, 10, 1258. [Google Scholar] [CrossRef] [Green Version]
  14. Sodhro, A.H.; Pirbhulal, S.; Sangaiah, A.K.; Lohano, S.; Sodhro, G.H.; Luo, Z. Review of technology adoption frameworks in mobile commerce. Procedia Comput. Sci. 2017, 122, 888–895. [Google Scholar]
  15. Shankar, A.; Datta, B. Factors affecting mobile payment adoption intention: An Indian perspective. Glob. Bus. Rev. 2018, 19, S72–S89. [Google Scholar] [CrossRef]
  16. Chhonker, M.S.; Verma, D.; Kar, A.K.; Grover, P. m-commerce technology adoption. Bottom Line 2018, 31, 208–233. [Google Scholar] [CrossRef]
  17. Tounekti, O.; Ruiz-Martínez, A.; Skarmeta-Gómez, A.F. An evolution analysis of electronic payment systems and mobile payment systems characteristics. J. Curr. Issues Media Telecommun. 2017, 9, 219–252. [Google Scholar]
  18. Liébana-Cabanillas, F.; Molinillo, S.; Ruiz-Montañez, M. To use or not to use, that is the question: Analysis of the determining factors for using NFC mobile payment systems in public transportation. Technol. Forecast. Soc. Chang. 2019, 139, 266–276. [Google Scholar] [CrossRef]
  19. Tan, C. Michael Hand, indoctrination and the inculcation of belief. J. Philos. Educ. 2004, 38, 257–267. [Google Scholar] [CrossRef]
  20. Berthon, P.R.; Pitt, L.F.; Plangger, K.; Shapiro, D. Marketing meets Web 2.0, social media, and creative consumers: Implications for international marketing strategy. Bus. Horiz. 2012, 55, 261–271. [Google Scholar] [CrossRef]
  21. Rana, N.P.; Dwivedi, Y.K.; Williams, M.D. Evaluating alternative theoretical models for examining citizen centric adoption of e-government. Transform. Gov. Peopleprocess Policy 2013, 7, 27–49. [Google Scholar] [CrossRef] [Green Version]
  22. Dahlberg, T.; Mallat, N.; Ondrus, J.; Zmijewska, A. Past, present and future of mobile payments research: A literature review. Electron. Commer. Res. Appl. 2008, 7, 165–181. [Google Scholar] [CrossRef] [Green Version]
  23. Statista. Mobile POS Payments. Available online: https://www.statista.com/outlook/331/100/mobile-pospayments/worldwide#market-users (accessed on 10 May 2020).
  24. Statista. Most Popular Mobile Payment Apps in Finland in 2016. Available online: https://www.statista.com/statistics/745892/most-popular-mobile-payment-apps-in-finland/ (accessed on 3 January 2018).
  25. Pham, T.T.; Ho, J.C. The effects of product-related, personal-related factors and attractiveness of alternatives on consumer adoption of NFC-based mobile payments. Technol. Soc. 2015, 43, 159–172. [Google Scholar] [CrossRef]
  26. Leong, L.Y.; Hew, T.S.; Tan, G.W.; Ooi, K.B. Predicting the determinants of the NFC-enabled mobile credit card acceptance: A neural networks approach. Expert Syst. Appl. 2013, 40, 5604–5620. [Google Scholar] [CrossRef]
  27. Hsu, P.D.; Lander, E.S.; Zhang, F. Development and applications of CRISPR-Cas9 for genome engineering. Cell 2014, 157, 1262–1278. [Google Scholar] [CrossRef] [Green Version]
  28. Wixom, B.H.; Todd, P.A. A theoretical integration of user satisfaction and technology acceptance. Inf. Syst. Res. 2005, 16, 85–102. [Google Scholar] [CrossRef]
  29. Patil, P.; Tamilmani, K.; Rana, N.P.; Raghavan, V. Understanding consumer adoption of mobile payment in India: Extending Meta-UTAUT model with personal innovativeness, anxiety, trust, and grievance redressal. Int. J. Inf. Manag. 2020, 54, 102144. [Google Scholar] [CrossRef]
  30. Bailey, C.; Madden, A.; Alfes, K.; Fletcher, L. The meaning, antecedents and outcomes of employee engagement: A narrative synthesis. Int. J. Manag. Rev. 2017, 19, 31–53. [Google Scholar] [CrossRef] [Green Version]
  31. Ajzen, I.; Fishbein, M. Attitude-behavior relations: A theoretical analysis and review of empirical research. Psychol. Bull. 1977, 84, 888. [Google Scholar] [CrossRef]
  32. Davis, F.D. Perceived usefulness, perceived ease of use, and user acceptance of information technology. MIS Q. 1989, 13, 319–340. [Google Scholar] [CrossRef] [Green Version]
  33. Venkatesh, V.; Bala, H. Technology acceptance model 3 and a research agenda on interventions. Decis. Sci. 2008, 39, 273–315. [Google Scholar] [CrossRef] [Green Version]
  34. Ajzen, I. The theory of planned behavior. Organ. Behav. Hum. Decis. Process. 1991, 50, 179–211. [Google Scholar] [CrossRef]
  35. Rogers, E. Diffusion of Innovations, 4th ed.; ACM The Free Press: New York, NY, USA, 1995; pp. 15–23. [Google Scholar]
  36. Venkatesh, V.; Thong, J.Y.; Xu, X. Consumer acceptance and use of information technology: Extending the unified theory of acceptance and use of technology. MIS Q. 2012, 36, 157–178. [Google Scholar] [CrossRef] [Green Version]
  37. Brown, S.A.; Venkatesh, V. Model of adoption of technology in households: A baseline model test and extension incorporating household life cycle. MIS Q. 2005, 29, 399–426. [Google Scholar] [CrossRef]
  38. Ruiz-Martínez, A.; Tounekti, O.; Skarmeta, A.F. Electronic payment frameworks. In Advanced Methodologies and Technologies in Digital Marketing and Entrepreneurship; IGI Global: Hershey, PA, USA, 2019; pp. 205–218. [Google Scholar]
  39. Schunter, M.; Waidner, M.; Whinnett, D. The SEMPER framework for secure electronic commerce. Wirtschaftsinformatik 1999, 41, 238–247. [Google Scholar] [CrossRef]
  40. Lacoste, G.; Pfitzmann, B.; Steiner, M.; Waidner, M. The payment framework. In SEMPER-Secure Electronic Marketplace for Europe; Springer: Berlin/Heidelberg, Germany, 2000; pp. 185–211. [Google Scholar]
  41. Meng, B.; Zhang, H. An electronic commerce system prototype and its implementations. In Proceedings of the Fifth International Conference on Computer and Information Technology (CIT’05), Wuhan, China, 21 September 2005; IEEE: Piscataway Township, NJ, USA, 2005; pp. 966–970. [Google Scholar]
  42. Dulai, T.; Jaskó, S.; Tarnay, K. IOTP and Payments Protocols. In Research and Development in E-Business through Service-Oriented Solutions; IGI Global: Hershey, PA, USA, 2013; pp. 20–56. [Google Scholar]
  43. Ruiz-Martínez, A.; Reverte, Ó.C.; Gómez-Skarmeta, A.F. Payment frameworks for the purchase of electronic products and services. Comput. Stand. Interfaces 2012, 34, 80–92. [Google Scholar] [CrossRef]
  44. Rana, N.P.; Dwivedi, Y.K.; Lal, B.; Williams, M.D.; Clement, M. Citizens’ adoption of an electronic government system: Towards a unified view. Inf. Syst. Front. 2017, 19, 549–568. [Google Scholar] [CrossRef] [Green Version]
  45. Dwivedi, Y.K.; Rana, N.P.; Jeyaraj, A.; Clement, M.; Williams, M.D. Re-examining the unified theory of acceptance and use of technology (UTAUT): Towards a revised theoretical model. Inf. Syst. Front. 2019, 21, 719–734. [Google Scholar] [CrossRef] [Green Version]
  46. Tamilmani, K.; Rana, N.P.; Dwivedi, Y.K. Consumer acceptance and use of information technology: A meta-analytic evaluation of UTAUT2. Inf. Syst. Front. 2020, 1–9. [Google Scholar] [CrossRef]
  47. Musa, A.; Khan, H.U.; AlShare, K.A. Factors influence consumers’ adoption of mobile payment devices in Qatar. Int. J. Mob. Commun. 2015, 13, 670–689. [Google Scholar] [CrossRef]
  48. Zhang, P. The affective response model: A theoretical framework of affective concepts and their relationships in the ICT context. MIS Q. 2013, 37, 247–274. [Google Scholar] [CrossRef]
  49. Ding, Y. Modelling continued use of information systems from a forward-looking perspective: Antecedents and consequences of hope and anticipated regret. Inf. Manag. 2018, 55, 461–471. [Google Scholar] [CrossRef]
  50. Kar, A.K. What affects usage satisfaction in mobile payments? Modelling user generated content to develop the “digital service usage satisfaction model”. Inf. Syst. Front. 2020, 1–21. [Google Scholar] [CrossRef]
  51. Liébana-Cabanillas, F.; Sánchez-Fernández, J.; Muñoz-Leiva, F. The moderating effect of experience in the adoption of mobile payment tools in Virtual Social Networks: The m-Payment Acceptance Model in Virtual Social Networks (MPAM-VSN). Int. J. Inf. Manag. 2014, 34, 151–166. [Google Scholar] [CrossRef]
  52. Hayashi, F. Mobile payments: What’s in it for consumers? Econ. Rev. Fed. Reserve Bank Kans. City 2012, 97, 35–36. [Google Scholar]
  53. Montazemi, A.R.; Qahri-Saremi, H. Factors affecting adoption of online banking: A meta-analytic structural equation modeling study. Inf. Manag. 2015, 52, 210–226. [Google Scholar] [CrossRef]
  54. Mir, U.B.; Kar, A.K.; Dwivedi, Y.K.; Gupta, M.P.; Sharma, R.S. Realizing digital identity in government: Prioritizing design and implementation objectives for Aadhaar in India. Gov. Inf. Q. 2020, 37, 101442. [Google Scholar] [CrossRef]
  55. Mohan, R.; Kar, A.K. Demonetization and its impact on the Indian economy–insights from social media analytics. In Proceedings of the Conference on e-Business, e-Services and e-Society, Delhi, India, 21–23 November 2017; Springer: Cham, Switzerland, 2017; pp. 363–374. [Google Scholar]
  56. Gao, L.; Waechter, K.A. Examining the role of initial trust in user adoption of mobile payment services: An empirical investigation. Inf. Syst. Front. 2017, 19, 525–548. [Google Scholar] [CrossRef]
  57. Albashrawi, M.; Motiwalla, L. Privacy and personalization in continued usage intention of mobile banking: An integrative perspective. Inf. Syst. Front. 2019, 21, 1031–1043. [Google Scholar] [CrossRef]
  58. Meskaran, F.; Ismail, Z.; Shanmugam, B. Online purchase intention: Effects of trust and security perception. Aust. J. Basic Appl. Sci. 2013, 7, 307–315. [Google Scholar]
  59. Kapoor, K.K.; Dwivedi, Y.K.; Williams, M.D. Innovation adoption attributes: A review and synthesis of research findings. Eur. J. Innov. Manag. 2014, 17, 327–348. [Google Scholar] [CrossRef] [Green Version]
  60. Van Schaik, P.; Ling, J. Modelling user experience with web sites: Usability, hedonic value, beauty and goodness. Interact. Comput. 2008, 20, 419–432. [Google Scholar] [CrossRef] [Green Version]
  61. Lin, G.T.; Sun, C.C. Factors influencing satisfaction and loyalty in online shopping: An integrated model. Online Inf. Rev. 2009, 33, 458–475. [Google Scholar] [CrossRef] [Green Version]
  62. Ismagilova, E.; Slade, E.; Rana, N.P.; Dwivedi, Y.K. The effect of characteristics of source credibility on consumer behaviour: A meta-analysis. J. Retail. Consum. Serv. 2020, 53, 101736. [Google Scholar] [CrossRef] [Green Version]
  63. Becker, L.; Jaakkola, E. Customer experience: Fundamental premises and implications for research. J. Acad. Mark. Sci. 2020, 48, 630–648. [Google Scholar] [CrossRef] [Green Version]
  64. Rouibah, K.; Lowry, P.B.; Hwang, Y. The effects of perceived enjoyment and perceived risks on trust formation and intentions to use online payment systems: New perspectives from an Arab country. Electron. Commer. Res. Appl. 2016, 19, 33–43. [Google Scholar] [CrossRef]
  65. Papa, F.; Livi, S.; Cornacchia, M.; Nicolò, E.; Sapio, B. Factors affecting the usage of payment services through digital television in Italy. In Proceedings of the 8th European Conference on Interactive TV and Video, Tampere, Finland, 9 June 2010; pp. 209–216. [Google Scholar]
  66. Tsai, J.Y.; Egelman, S.; Cranor, L.; Acquisti, A. The effect of online privacy information on purchasing behavior: An experimental study. Inf. Syst. Res. 2011, 22, 254–268. [Google Scholar] [CrossRef] [Green Version]
  67. Suh, B.; Han, I. The impact of customer trust and perception of security control on the acceptance of electronic commerce. International J. Electron. Commer. 2003, 7, 135–161. [Google Scholar]
  68. Deufel, P.; Kemper, J. Consumers’ Online Payment Choice in Europe: The Role of Culture and Macro-economics. In Proceedings of the Academy of Management Proceedings, Briarcliff Manor, NY, USA, 2 July 2018; Volume 2018, p. 10528. [Google Scholar]
  69. De Luna, I.R.; Montoro-Ríos, F.; Martínez-Fiestas, M.; Casado-Aranda, L.A. Analysis of A Mobile Payment Scenario: Key Issues and Perspectives. In Impact of Mobile Services on Business Development and E-Commerce; IGI Global: Hershey, PA, USA, 2020; pp. 22–47. [Google Scholar]
  70. Borràs, J.; Moreno, A.; Valls, A. Intelligent tourism recommender systems: A survey. Expert Syst. Appl. 2014, 41, 7370–7389. [Google Scholar] [CrossRef]
Figure 1. A holistic framework for the assessment of user satisfaction of payment interface supporting multiple payment options.
Sustainability 13 04711 g001
Figure 2. The screenshot of the current payment interface (offered by the GCWB).
Sustainability 13 04711 g002
Figure 3. Sequence diagram schema.
Sustainability 13 04711 g003
Figure 4. The screenshot of the current payment interface and the new proposed payment interface.
Sustainability 13 04711 g004
Figure 5. The screenshot detailing the payment process using the new proposed payment interface.
Sustainability 13 04711 g005
Table 1. Demographic profiles of respondents (N = 266).
ItemsFrequencyPercentage (%)
GenderMale11041.4
Female15658.6
Age (years)<1800
18–2510639.8
26–3510941
36–453713.9
46–5572.6
56–6572.6
>6500
LocationEurope12747.7
Africa6725.2
Asia3011.3
America3814.3
Oceania41.5
Education levelPrimary51.9
Secondary5319.9
University20878.2
Table 2. Frequency of buying products online.
FrequencyPercent
Never10.4
Only in a sale period5520.7
1–2 times per month12145.5
3–4 times per month7829.3
5–6 times per month31.1
≥7 times per month83
Total266100
Table 3. Frequency of users’ satisfaction with the current and new payment interface.
Current Payment InterfaceNew Payment Interface
Satisfied/Very satisfied12748%25696%
Neither satisfied nor dissatisfied5320%104%
Very dissatisfied/dissatisfied8632%00
Total266100%266100%
Table 4. Cross tabulation compared the user satisfaction between the current/new payment interface.
Current
New
Satisfied/
Very Satisfied
Neither Satisfied
nor Dissatisfied
Very Dissatisfied/
Dissatisfied
Total
Satisfied/Very satisfied12348.04%5119.92%8232.04%256
Neither satisfied nor dissatisfied440%220%440%10
Very dissatisfied/dissatisfied0000000
Table 5. Cross tabulation results; the dependent variable is how well this new user interface meets your preferences and needs.
Visual Interface DesignEase of UseConfidentialityPayment Method PreferencesSecurityCredibilityUsefulnessPrivacyDesirability
Pearson Chi-square14.64153.87334.16541.84338.9057.08233.09724.78215.310
Significance level0.0010.0000.0000.0000.0000.0290.0000.0000.000
Phi/Cramer’s V0.2350.4500.3500.3970.3820.1630.3530.3050.240
Table 6. Relationship between the new user payment interface and the different characteristics.
Neither Satisfied nor DissatisfiedSatisfiedVery SatisfiedSum of Satisfied + Very Satisfied
Nb(%)Nb(%)Nb(%)Total(%)
Security103.7515959.774316.1620275.93
Confidentiality62.2513450.372810.5216260.9
Ease of use103.7516662.44918.4221580.82
Usefulness62.2513450.374617.2918067.66
Credibility8310037.59269.7712647.36
Visual interface design114.1313851.874215.7818067.66
Privacy93.3814052.633412.7817465.41
Payment method preferences41.513651.125821.819472.93
Desirability20.757126.693011.2710137.96
Table 7. How well does this new payment interface meet users’ preferences and needs?
FrequencyPercentValid PercentCumulative Percent
Extremely well5821.821.8100
Very well18168.068.068
Somewhat well2710.210.278.2
Not so well0000
Not at all well0000
Total266100100
Table 8. Cross tabulation. Does the user want to use the current payment interface?
FrequencyPercentValid PercentCumulative Percent
Satisfied9335.035.035.0
Very satisfied72.62.637.6
Dissatisfied8331.231.268.8
Very dissatisfied103.83.872.6
Neither satisfied nor dissatisfied7327.427.4100.0
Total266100.0100.0
Table 9. KMO and Bartlett’s Test.
Kaiser–Meyer–Olkin Measure of Sampling Adequacy0.700
Bartlett’s test of sphericityApprox. chi-square1523.333
Df276
Sig.0.000
Table 10. Total variance explained.
ComponentInitial EigenvaluesExtraction Sums of Squared Loadings
Total% of VarianceCumulative %Total% of VarianceCumulative %
Security4.16617.35917.3594.16617.35917.359
Confidentiality2.78711.61328.9712.78711.61328.971
Ease of use1.5626.50935.4801.5626.50935.480
Usefulness1.4726.13241.6121.4726.13241.612
Credibility1.2735.30546.9161.2735.30546.916
Visual interface design1.1474.78051.6971.1474.78051.697
Privacy1.1014.58756.2841.1014.58756.284
Payment method preferences1.0614.41960.7041.0614.41960.704
Desirability1.0034.18064.8831.0034.18064.883
Table 11. The number of respondents who supported one or more payment systems.
Kind of Payment Systems Have You Used to Make PaymentsNumber of UsersPercentage
One payment method6022.55%
Two payment methods6223.31%
Three or more14454.14%
Total266100%
Table 12. Analysis of the group of users who supported three or more payment systems.
NumberPercentage
Very satisfied2920.14%
Satisfied11076.38%
Neither satisfied nor dissatisfied53.48%
Total144100%
Visual interface design12284.72%
Ease of use12083.33%
Confidentiality13090.27%
Payment method preferences13593.75%
Security8458.33%
Credibility11076.38%
Usefulness12888.88%
Privacy6847.22%
Desirability3927.08%
Table 13. Model summary for multiple regression analysis.
ModelRR SquareAdjusted R Square
10.664 a0.5460.529
Table 14. Regression coefficients—results of multiple regression analysis.
Unstandardized CoefficientsStandardized CoefficientstSig.
ModelBStd. ErrorBeta
1(Constant)1.8570.07425.1810.000 *
 Security0.3290.0740.2574.4480.000 *
 Confidentiality0.3290.0740.2574.4480.000 *
 Ease of use0.2320.0740.1813.1340.002 *
 Usefulness0.2320.0740.1813.1340.002 *
 Credibility0.1470.0740.1141.9830.048 *
 Visual interface design0.1400.0740.1091.8950.059 *
 Privacy0.1490.0740.1162.0150.045 *
 Payment method preferences0.1830.0700.2072.6390.009 *
 Desirability−0.1070.074−0.084−1.4500.148
Independent variables: predictors: (constant), ease of use, usefulness, confidentiality, visual interface design, security, payment method preferences, credibility, privacy and desirability. Dependent variable: (usage satisfaction) intention to use the new payment Interface. Note: * represents (p (significance value) < = 0.05).
Table 15. Overview of results with user satisfaction as a dependent variable.
Independent VariableHypothesisBeta Valuep-ValueResult
Ease of useH10.1810.002 (p ≤ 0.05)Accepted
UsefulnessH20.1810.002 (p ≤ 0.05)Accepted
SecurityH30.2570.000 (p ≤ 0.05)Accepted
ConfidentialityH40.2570.000 (p ≤ 0.05)Accepted
PrivacyH50.1160.045 (p ≤ 0.05)Accepted
Payment method preferencesH60.2070.009 (p ≤ 0.05)Accepted
Visual interface designH70.1090.059 (p < 0.1)Accepted
CredibilityH80.1140.048 (p ≤ 0.05)Accepted
DesirabilityH9−0.0840.148 (p > 0.1)Rejected
Publisher’s Note: MDPI stays neutral with regard to jurisdictional claims in published maps and institutional affiliations.

