Article

Impact of Environmental Regulation Intensity on Green Technology Innovation: From the Perspective of Political and Business Connections

1
School of Management, Nanchang University, Nanchang 330031, China
2
School of Economics and Management, Nanchang Hangkong University, Nanchang 330063, China
3
School of Economics and Management, Nanchang University, Nanchang 330031, China
*
Authors to whom correspondence should be addressed.
Sustainability 2021, 13(9), 4862; https://doi.org/10.3390/su13094862
Submission received: 17 February 2021 / Revised: 13 April 2021 / Accepted: 22 April 2021 / Published: 26 April 2021

Abstract

:
With heavy air pollution and the highest CO2 emissions in the world, China is in urgent need of technology innovation to improve the energy efficiency and control the pollution emission. This study empirically investigates the impact of environmental regulation intensity, political connections, and business connections on green technology innovation in China’s firms. The authors employ a panel data regression analysis on a dataset that comprises 884 observations for A-share listed companies from 2016 to 2019, owing to the availability of data. The results show: (1) Environmental regulation intensity (ERI) has a U-shaped effect on green technology innovation (GTI), which means GTI is inhibited by ERI in the early stage but gets promoted in the long run; (2) Political connections positively moderate the relationship between ERI and GTI mainly because of crowding-out effect and resource effect; (3) Business connections have a negative impact on the relationship between ERI and GTI, resulting from knowledge acquisition and lock-in; (4) Business connections have a greater moderating effect than political connections probably because political ties lack an effective mechanism to ensure long-term cooperation with the enterprises; (5) However, with regard to those firms in the non-heavily polluting industry, both connections moderate the relationship between ERI and GTI in an opposite direction to the main effect. The research results help policy makers formulate relevant policies, based on the impact of environmental regulation and social connections on green technology innovation.

1. Introduction

Due to the impact of the climate crisis, carbon emission reduction and green development are increasingly becoming a focus of global economies. China, as the world’s second largest economy, has made remarkable achievements in economic growth over the past 4 decades, but its long-term extensive economic development model has resulted in a serious waste of energies and environmental pollution. According to the 2019 national eco-environmental quality outline from the Ministry of Ecology and Environment of the People’s Republic of China, the average PM 2.5 concentration of 337 cities at prefecture level and above in China’s mainland has reached 36 (μg/m3) [1], which is much higher than the annual mean exposure threshold of 10 μg/m3 that WHO outlined in the Air Quality Guideline [2]. Based on the statistics from International Energy Agency, China’s total CO2 emission from fossil fuel has reached 9.8 gt [3], 70% of which was from industrial emissions [4]. Additionally, China has been ranked first in the world for total CO2 emission. Therefore, improving the energy efficiency of industrial enterprises and controlling pollution emissions are of great significance to China’s economic transformation and even to the world’s response to climate change. Although green growth efficiency for Chinese manufacturing industries has risen steadily in recent years, China’s industrial firms have huge potential for saving resources and pollution reduction [5]. Green technology innovation is viewed as an important way to solve serious pollution problems, which refers to innovation behaviors of creating environmentally friendly new technologies that are applied in environmental management practices, pollution prevention, waste reduction, and energy saving [6,7]. It helps to improve the utilization and allocation of natural resources, develop a variety of raw materials and energy-saving products, increase the efficiency of raw materials and energies [8], effectively reduce production costs, and ultimately, promote performance growth [9,10,11]. However, owing to the negative externality of environmental costs, knowledge spillovers, and the positive externality of technology adoption [12], the path-dependent effect makes enterprises, especially polluting firms, more willing to adopt non-green technologies than to innovate green technologies. To offset those “market failures,” Chinese governments formulate and implement a series of measures and regulations to intervene in market mechanisms or indirectly change supply and demand between enterprises and the public, which force firms to seek innovations that would turn out privately and socially profitable [13,14].
Due to the impact of the climate crisis, carbon emission reduction and green development are increasingly becoming a focus of global economies. China, as the world’s second largest economy, has made remarkable achievements in economic growth over the past 4 decades, but its long-term extensive economic development model has resulted in a serious waste of energies and environmental pollution. According to the 2019 national eco-environmental quality outline from the Ministry of Ecology and Environment of the People’s Republic of China, the average PM 2.5 concentration of 337 cities at prefecture level and above in China’s mainland has reached 36 (μg/m3) [1], which is much higher than the annual mean exposure threshold of 10 μg/m3 that WHO outlined in the Air Quality Guideline [2]. Based on the statistics from International Energy Agency, China’s total CO2 emission from fossil fuel has reached 9.8 gt [3], 70% of which was from industrial emissions [4]. Additionally, China has been ranked first in the world for total CO2 emission. Therefore, improving the energy efficiency of industrial enterprises and controlling pollution emissions are of great significance to China’s economic transformation and even to the world’s response to climate change. Although green growth efficiency for Chinese manufacturing industries has risen steadily in recent years, China’s industrial firms have huge potential for saving resources and pollution reduction [5]. Green technology innovation is viewed as an important way to solve serious pollution problems, which refers to innovation behaviors of creating environmentally friendly new technologies that are applied in environmental management practices, pollution prevention, waste reduction, and energy saving [6,7].It helps to improve the utilization and allocation of natural resources, develop a variety of raw materials and energy-saving products, increase the efficiency of raw materials and energies [8], effectively reduce production costs, and ultimately, promote performance growth [9,10,11]. However, owing to the negative externality of environmental costs, knowledge spillovers, and the positive externality of technology adoption [12], the path-dependent effect makes enterprises, especially polluting firms, more willing to adopt non-green technologies than to innovate green technologies. To offset those “market failures,” Chinese governments formulate and implement a series of measures and regulations to intervene in market mechanisms or indirectly change supply and demand between enterprises and the public, which force firms to seek innovations that would turn out privately and socially profitable [13,14].
In 2012, the 18th National Congress of the Communist Party of China (NCCPC) incorporated the construction of ecological civilization into its overall plan for the course of socialism with Chinese characteristics and began to make full use of environmental regulatory tools, such as the command and market incentive, to promote the construction of this ecological civilization.
From 2012 to 2019, dozens of reform documents, laws, and regulations were issued to prevent pollution, control CO2 emission, and protect the environment, which involved reforms to emissions licensing and the trading system, converting the pollution discharge fee to environmental taxes, and providing enterprises subsidies for emission reduction equipment and pollution reduction. In particular, the new Environmental Protection Law, implemented in 2015 and known as the “strictest environmental protection law in history,” for the first time, clarified the legal status of environmental supervision departments, which have the right to impose “daily penalties” on polluting enterprises, place corporate legal persons in administrative detention, and even prosecute them for criminal liabilities.
On 22 September 2020, President Xi Jinping made an announcement at the United Nations General Assembly that China strives to reach a peak of carbon emission by 2030 and achieve carbon neutrality before 2060, which means China’s environmental governance will be more stringent in order to achieve the goal of the Nationally Determined Contributions. However, it has been controversial in academic circles whether strict environmental regulation can change a firm’s behavior and effectively promote green technology innovation (GTI).
Neoclassical economic theory holds that environmental regulation can improve the overall social benefits, but with rising pollution control costs, it has a crowding-out effect on enterprise production and innovation investment, inhibiting green technological innovation and decreasing the competitive advantage of enterprises in the international trade [15,16]. Under this scenario, wealthy countries with strong environmental regulations tend to offshore their polluting industries to developing countries, which results in the “Pollution Haven Effect” [17,18,19]. However, the Porter hypothesis points out that properly designed environmental regulation can stimulate technological innovation, thus offsetting compliance costs, and the first-mover advantage from green technological innovation can provide enterprises with a greater market share and competitive advantages [20,21]. Subsequently, many scholars have verified the Porter hypothesis successively. Their researches show that environmental regulation positively influences GTI; the more stringent environmental regulations are, the more incentive effects it has on a firm’s GTI; countries with strict environmental regulation have a higher level of technological innovation than others [22,23,24,25,26,27]. However, by introducing time and regulation intensity changes, the relationship between environmental regulation and green technological innovation may be complex and nonlinear, presenting any of the following: U-shaped effect [28,29,30], a threshold effect [31,32], an inverted U-shape, and other forms [33].
It is understood that GTI is characterized by high risk and uncertainty. Obtaining financial support and technical information through social connections between enterprises and governments, suppliers, customers, and other cooperative business partners is an essential path to meet increasingly severe regulatory requirements [34,35]. Political connections between enterprises and governments have attracted much attention, which brings out arguments that based on the reputation mechanism and resource effect, political connections have a positive effect on a firm’s innovation: (1) Political connections have a significant and positive impact on a firms’ innovation input, social responsibility, and innovation level [36,37,38,39], which probably promote a firm’s engagement in green technological innovation; (2) Political connections can mitigate the risk of knowledge spillover [40], alleviate external resource constraints for the innovation [41,42,43], thus partially offsetting the costs of technological innovation; (3) Political connections can improve the level of intellectual property protection [44,45,46], contribute to the enterprises’ research and development revenues protection, and therefore, stimulate green technology innovation. Yet, the advantages that firms use political connections to gain in the resource allocation process may lead to the distortion of resource allocation and profit rise in politically connected firms with lower productivity and less innovation [47,48]. The resource curse theory and official promotion tournament theory suggest that political connections negatively influence firms’ innovation: (1) It will create innovation inertia because the acquisition of scarce resources and market privileges from government connections form a competitive advantage that reduces the enterprises’ sensitivity to environmental change [49]; (2) Connections squeeze out the innovation resources in that rent-seeking crowds out the resources that should be allocated to innovation, leading to a decrease in innovation investment [50,51]; (3) Overinvestment is one of the ill effects of high political connections that require firms to make large amounts of short-term investments to achieve political performance, such as high GDP, employment rates, etc., therefore, affecting long-term investment planning for innovation [51,52,53]. A few studies involve the relationship between political connections and green performance [54,55], but different political hierarchies and firms’ characteristics play different roles in green innovation [56]. In terms of business connections, most literature focuses on the impact of suppliers’ and customers’ bargaining power on business performance [57,58]. Based on the social capital theory, some scholars stress that business connections have a negative or positive relationship with a firm’s business performance, R&D investment, or innovation [59,60,61,62]. Little research is related to the relationship between business connections and GTI.
As China is in the transition from a planned to a market economy, neither its financial nor legal system has been well developed, which forces enterprises to constantly seek an informal system as an alternative protection mechanism to break through institutional barriers and resource acquisition constraints. Consequently, social connections, as the effective alternative financing channels and governance mechanisms, have a great impact on the survival and development of enterprises [63]. Therefore, political and business connections, crucial parts of the external social network, are necessarily introduced into the research framework, exploring the impact of environmental regulation and connections on GTI. In this study, three basic research hypotheses are formed as follows: (1) The research examines the nonlinear relationship between environmental regulation intensity and GTI. The result shows that the crowding-out effect of environmental regulation on GTI is significant in the early stage, but with strengthened regulation, forced effect and innovation offset gradually play a key role. Eventually, it is found environmental regulation has a U-shaped influence on GTI; (2) The study investigates the impact of political connections and environmental regulation intensity on green technological innovation. It is assumed that political connections positively moderate the relationship between regulations and GTI. Results show that in the initial phase of implementing environmental regulation, political connections exacerbate the crowding-out effect of environmental regulation because of the significant rent-seeking and promotion tournament. However, owing to the induced effect and forced effect, environmental regulation strengthens the positive influence on GTI with continuous regulation stringency;(3) The authors empirically confirm that business connections weaken the effect of environmental regulation on GTI, which results from the acquisition and lock-in of knowledge brought about by business connection networks.
The research uses a sample of China’s listed companies from 2016–2019 to investigate the correlations among environmental regulation intensity, political connections, business connections, and GTI. The results suggest that political connection positively moderates the U-shaped relationship between environmental regulation and GTI. However, business connections have an opposite influence on the relationship between them.
This study mainly contributes to the literature in three aspects: (1) The research introduces environmental regulation, political connections, business connections, and GTI into the same framework for academic research. The authors explore the moderating effect of political connections and business connections on the relationship between environmental regulation and GTI. The evidence adds knowledge of the effect mechanism of social connections on environmental regulation and GTI. Prior studies have focused on the impacts of regulation, government subsidies, or political connections on green innovation. Few studies have investigated moderating effects of both social connections in China. (2) The authors examine the combined effect of two connections in one model. The result shows that business connections have a greater moderating effect than political connections, probably because political ties lack an effective mechanism to ensure long-term cooperation with enterprises. The findings could promote further thinking about how to make use of the two connections to develop GTI. (3) Characteristics of firms are incorporated into the analysis to find out whether the main effect presents the same result in different industries. The study’s findings show that for heavily polluting and non-heavily polluting firms, social connections have different moderating effects between environmental regulation and GTI.
The rest of paper is organized in the following order. Section 2 describes the extant literature and develops hypotheses. Section 3 presents research models. Section 4 provides the empirical results. Section 5 includes the main conclusions, policy implications, and discussions.

2. Literature Review and Research Hypothesis

2.1. Impact of Environmental Regulation Intensity on GTI

Environmental regulation is believed to stimulate GTI, mainly resulting from the induced effect of market mechanism and backward forced effects of policies and regulations. Based on Hicks’ theory about induced innovation, changes in relative energy prices will spur the invention itself, directed to economizing uses of that kind of energy to be relatively expensive. However, energy price distortion in China has existed for a long time due to economic development requirements and social stability. The government administrative intervention still plays a crucial role in the pricing mechanism of the energy market, resulting in energy allocative inefficiency of China’s industrial sectors [64]. The serious distortion has restrained energy from being effectively replaced by labor and capital factors in most Chinese regions as well [65]. From the perspective of the demand-pull theory, technical change can be viewed as a scheme in which the desire for technical change, in the form of product and process innovations, originates from the demand for commodities [66]. Therefore, under high levels of market demand, enterprises are more likely to adopt a proactive environmental strategy and improve green innovation [67]. However, developing a green market requires the government and enterprises to guide consumers’ behavior in various ways, such as spreading environmental knowledge, cultivating environmental consciousness, and forming social norms [68].
More importantly, the technological innovation is path-dependent in that existing knowledge stock serves as a basis for the knowledge search [69]. Wu and Shanley [70] argue that deep and broad knowledge stock enhances a firm’s absorptive capacity to identify new knowledge, assimilates new knowledge elements, increases the effectiveness of knowledge exploration, provides a good base for recombination of new knowledge, and thus, boosts innovative performance. However, generally, the knowledge stock of non-green technology is greater than the one of green technology in most of China’s enterprises. Since potential core rigidities or negative path dependencies play a major role, rather than the accumulation of competitive advantages, existing knowledge stocks negatively influence firms’ innovation outputs [71]. Moreover, path dependence also has a significant effect on resource and energy inputs. Yuan and Xiang [72] adopt a sample of Chinese manufacturing industries and suggest that investment-driven development constrains innovation capability and R&D investment, under which environmental regulation inhibits the output of invention patents in that corporations have to further curtail R&D investment and purchase equipment for energy conservation and emission reduction. Therefore, in the early phase of implementing environmental regulation, the crowding-out effect is significant and GTI shows a downward trend.
However, China’s increasingly stringent environmental regulations will internalize regulatory costs into the production costs of enterprises. When compliance costs exceed energy efficiency loss and pipe-end disposal costs, profit-seeking firms will have greater incentive and willingness to invest more in green innovation, helping achieve GTI [56]. Furthermore, environmental regulation promotes external knowledge adoption that encourages firms to conduct green innovation [7]. As a consequence, stringent environmental regulation will convey the government’s commitment to its environmental development strategy, deliver companies signals about likely resource inefficiencies and potential technological improvements, and reduce the uncertainty about the value made by the investments to solve environmental problems [20]. In the long run, stricter regulations can lower production costs, enhance competitiveness, and trigger innovation to offset compliance costs [73]. The discussion leads us to propose the following hypothesis:
Hypothesis 1 (H1):
There may be a “U”-shaped relationship between environmental regulation intensity and GTI.

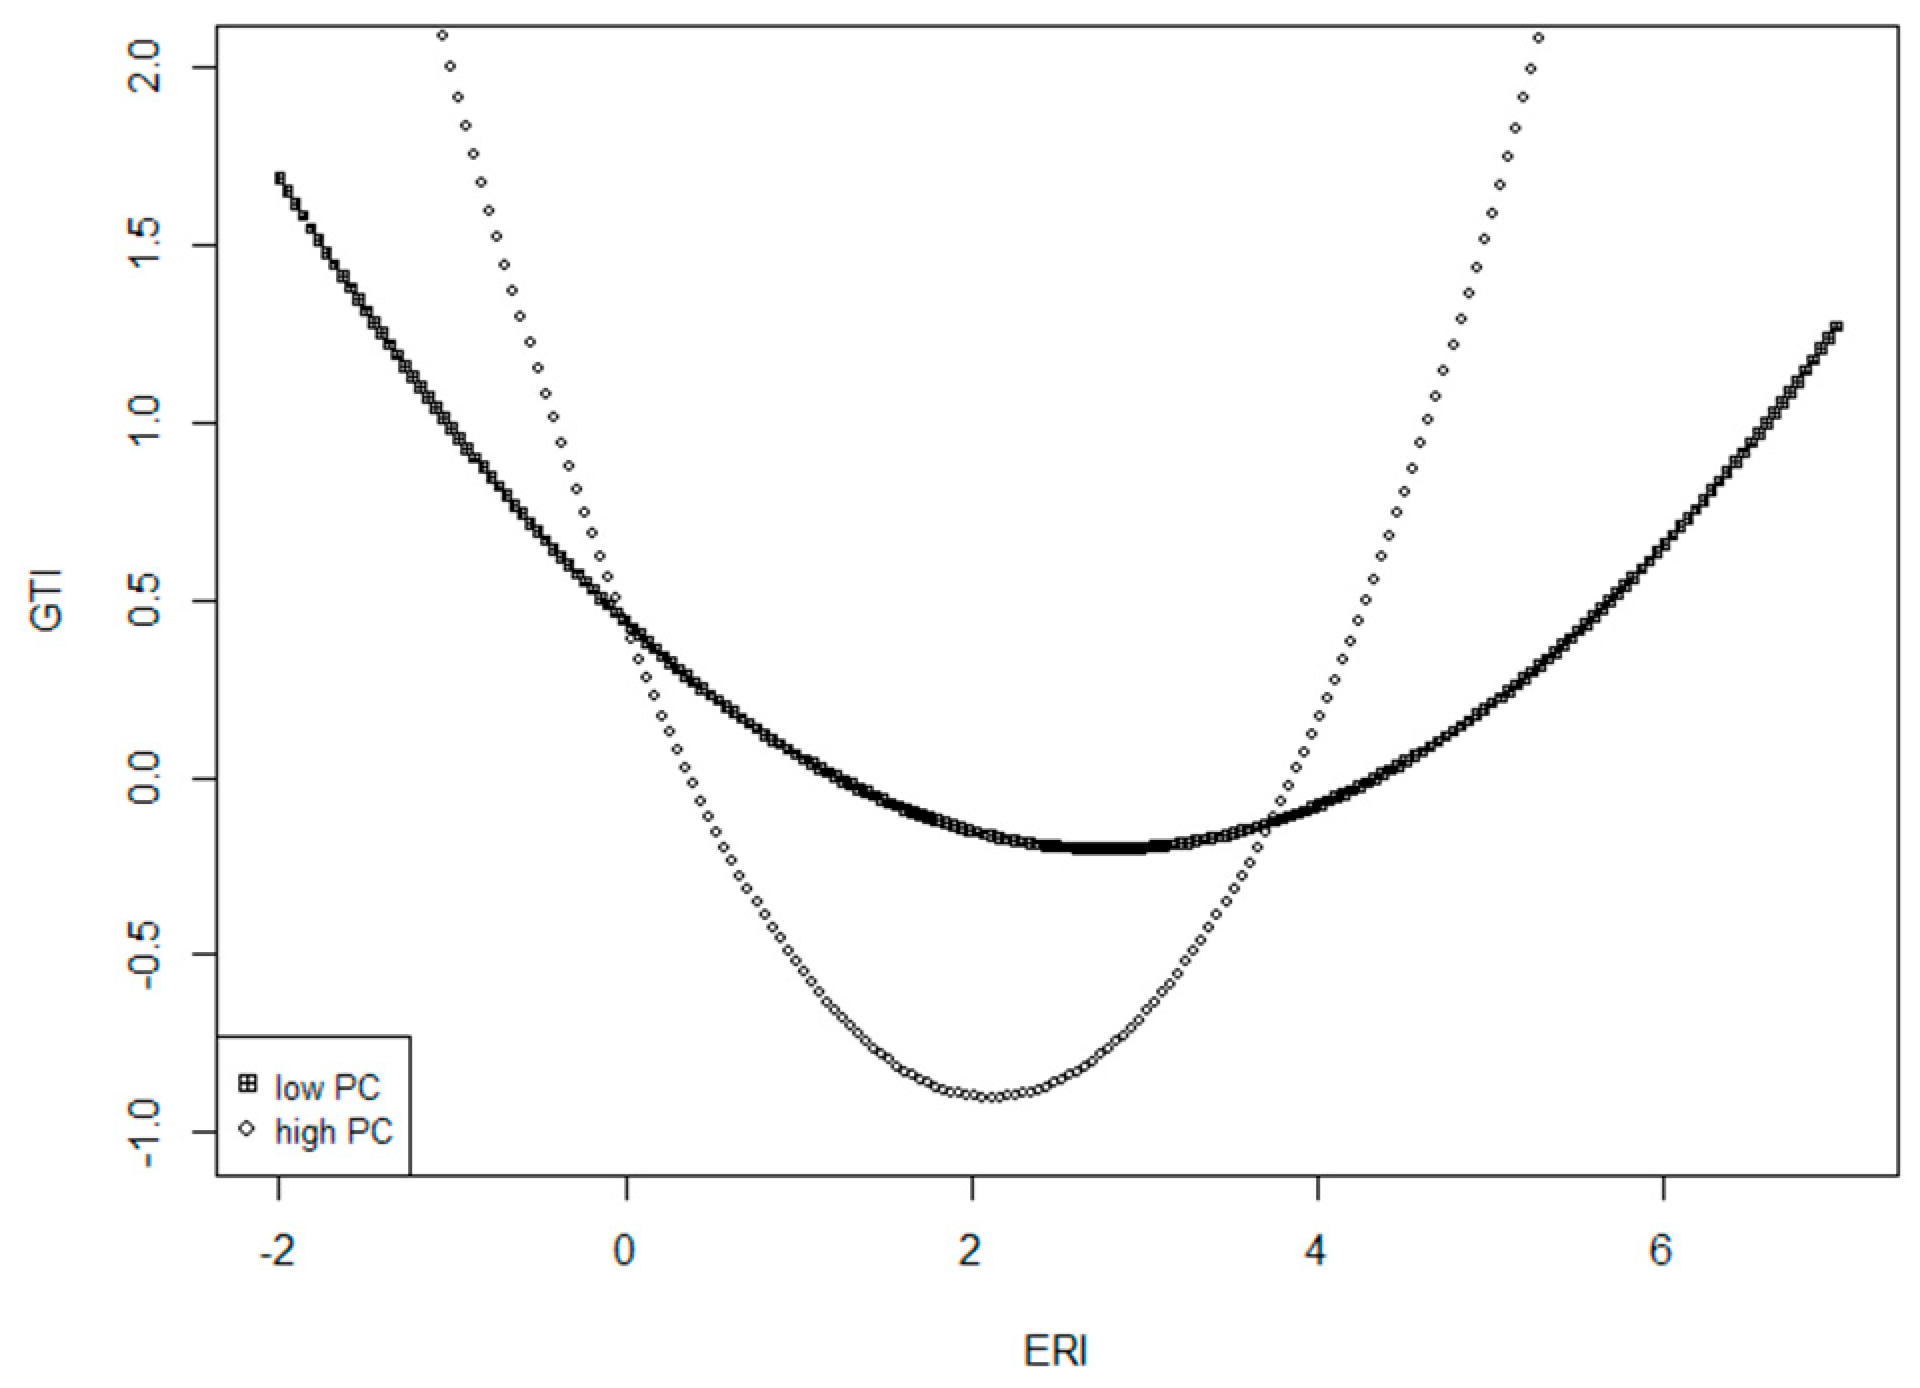
2.2. Impact of Political Connections and Environmental Regulation Intensity on GTI

Allen et al. [63] argue that effective informal financing channels and governance mechanisms promote China’s rapid growth, even though China’s legal and financial systems are not well developed. To some extent, China’s political connection is thought of as an alternative mechanism to ineffective markets and laws. However, the resource curse theory suggests that enterprises with high political connections can exploit rent-seeking to defend their monopoly benefits, resulting in the prevention of innovation and the entry of high-quality competitors [74,75]. Akcigitet al. [76] use the data of Italian firms and workers to find out that more politically connected industries face much lower firm entry, and most politician-intensive market leaders have the least intensive innovation compared with their direct competitors. When the payoff from rent-seeking is higher, enterprises will be more enthusiastic about using a rent-seeking strategy as an alternative to an innovation strategy, significantly inhibiting the entrepreneurship and willingness to innovate [77]. Owing to the limited resources, rent-seeking will further crowd out the investment in innovation. However, reverse rent-seeking can bring out an even worse result; local governments flexibly enforce environmental laws by mitigating the pollution penalty of firms [78]. Due to the environmental uncertainty caused by the initial environmental regulation, firms are incentivized to invest in the political relation since the firms with political connections are more likely to survive, and more political power in such a connection increases their survival probability [77].
Since 2013, China’s government has reformed the evaluation and promotion systems of local officials, which ecological environment responsibility is incorporated into, and gradually changed the GDP-based assessment criterion. In 2016, the Communist Party of China Central Committee comprehensively strengthened its leadership mechanism, emphasizing that Party and government leaders fulfill a common responsibility for environmental protection and governance. According to the local government promotion tournament theory, local officials compete for rare opportunities for political promotion [79]. For more promotion opportunities, government officials have great incentives to interfere with firms’ operations and encourage very politically connected firms to over-invest in some industries or projects [80]. However, Li et al. [81] point out, although the Chinese central government implemented a river chief system to control river pollution, local governments seem not to make a trade-off between economic development and environmental governance, still giving priority to the developing economy. Therefore, in order to achieve dual government goals, for one thing, enterprises with high political connections bear more policy burdens in terms of high employment rates and redundant personnel [82]; for another, highly politically connected enterprises are devoted to the pipe-end pollution treatment, even worse to relocate their business to other areas with fewer pollution constraints. Hence, in the initial stages of environmental regulation, strong political connections can bring enterprises many additional costs and squeeze out R&D investment and innovation input.
With continuous upgrades to environmental regulation, benefits from strong political connections will exceed the costs. First, firms’ capital demand and information acquisition for GTI will continue to increase over time. The reputation mechanism of high political connection reduces the information asymmetry between supply and demand for capital and conveys the information that enterprises, as a high-quality entity, can have good performance in the future [83]. At the same time, the Chinese government still has the right to allocate key credit resources. Bank credit will be guided by the government, and high political connections will help firms achieve higher credit line and loan amounts and alleviate financial constraints [83,84,85,86]. Second, the Chinese government controls scarce resources, such as land, subsidies and tax preference, so that highly politically connected enterprises can receive more benefit effectively [83], partially compensating for the knowledge spillovers caused by green activities. Importantly, based on government credit, fiscal subsidies release the dual signal of technical and regulatory certification [87], which plays a “halo” effect in accessing external financing for green technological innovation. Third, good relation with the government contributes to establishing contacts with universities, research institutes and other affiliations. Under environmental uncertainty, institutional ties are positively related to knowledge acquisition [88]. Fourth, in the context of China’s overall economic transformation, high political connections can better convey government-related policy information to firms [89] to reduce the uncertainty of GTI policy. Central and local governments and enterprises form a joint force to promote GTI. Therefore, the following assumption is developed:
Hypothesis 2 (H2):
Political connections positively moderate the relationship between environmental regulation intensity and GTI.

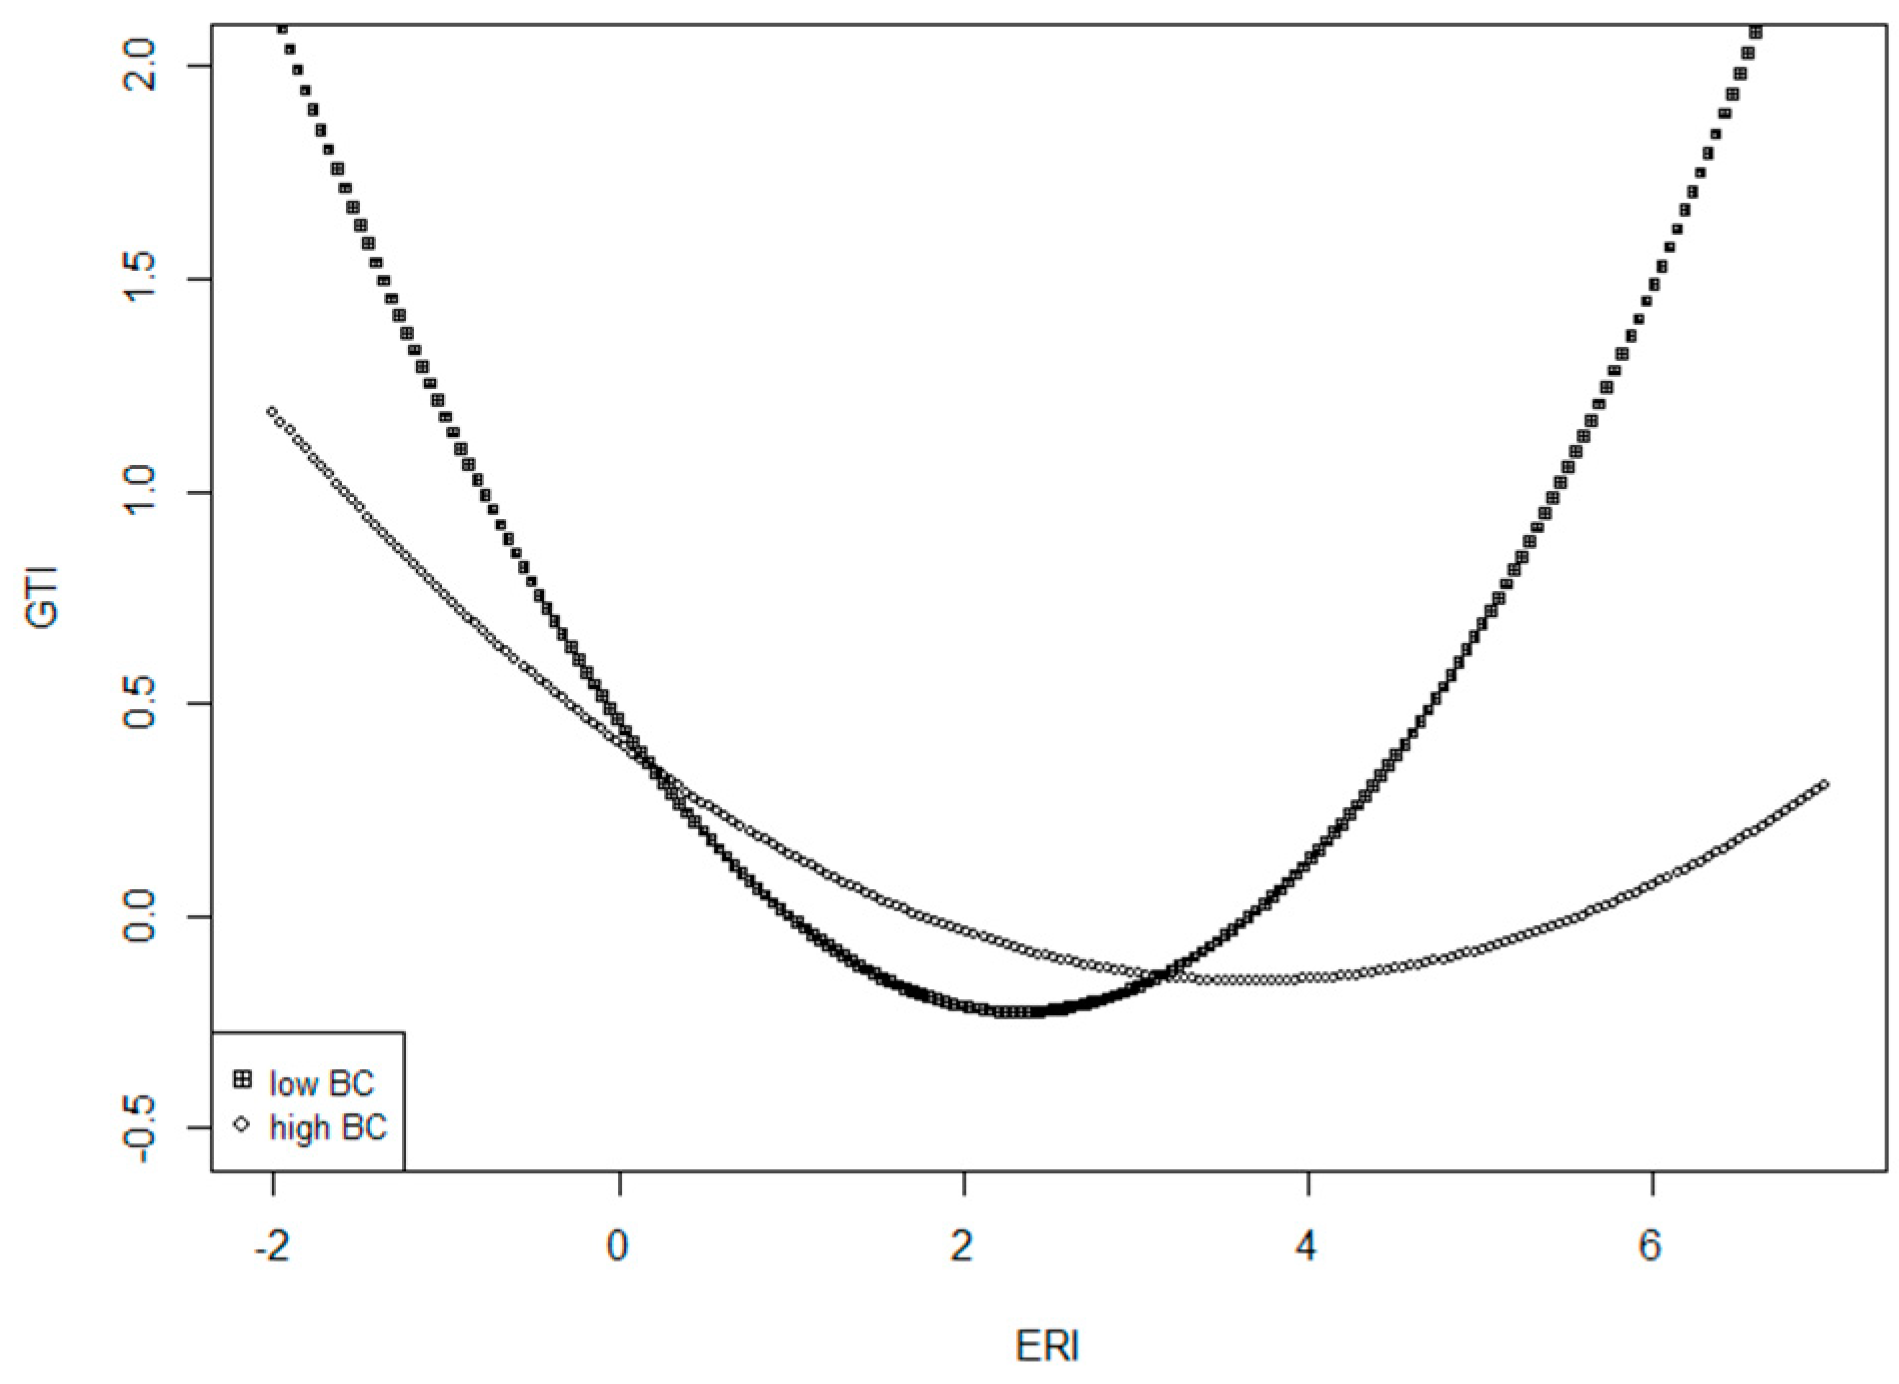
2.3. Impact of Business Connections and Environmental Regulation Intensity on GTI

In this paper, business connections cover the horizontal relationship network between enterprises and suppliers, customers and other cooperative partners [90] that have a valuable impact on the knowledge and innovation creation process [91]. Sheng et al. [92] argue that with the low efficiency of law enforcement and the rapid development of technology, business ties are more favorable than political ties. Zeng et al. [93] confirm that the cooperation with customers, suppliers and other partners plays a significant role in the innovation process of SMEs than the cooperation with scientific research institutions, universities, and government agencies.
In the primary stages, network, trust, and mutual benefits in business connections facilitate an efficient information exchange, strengthen cooperation, cope with the pressure of environmental protection, and enhance the ability of GTI: (1) From the social capital perspective, business ties are an important channel to exchange business information that stimulates innovation between enterprises, such as supplier product information [94], client demand information [95], and information about trustworthy or untrustworthy partners [92,96], etc. A close social network promotes mutual learning between business partners, facilitating knowledge transfer and technology acquisition [97]. Especially, the enterprises in the network center position have obvious information advantage [98], which can enrich and expand the knowledge pool for better decision-making of GTI. (2) Trust, in business ties, mitigates uncertainty of cooperation and interaction, reduces transaction costs, and strengthens cohesion in the organization members [99]. Common value and a shared vision in business partners provide a harmony of interests [100,101] and reduce possibilities of opportunistic behaviors, leading to lower monitoring costs and higher commitments [101]. Both social capitals that business partners have developed with each other in the long history of interaction can contribute to alleviating the uncertainty of environmental regulation and firms’ meeting the environmental requirements of the government.
However, stringent environmental regulation may have an overwhelming impact on the development of technology. As network members are tuned to a specific trading partner, isomorphism within the network decreases diversity, and limited exchange with a few network partners reduces the non-redundant information and access to new opportunity [98], leading to over-embeddedness that make firms vulnerable to exogenous shocks or prevent them from information beyond their network [102]. Autry and Griffis [103] points out that routines and mental models from accumulated cognitive capital lead to rigidities that inhibit independent thinking and creativity within the buyer-supplier relationships. Therefore, third hypothesis is developed:
Hypothesis 3 (H3):
Business connections negatively moderate the relationship between environmental regulation intensity and GTI.

3. Methods

3.1. Model and Tests

To examine the main research hypotheses, the model is modified, proposed by the research [29,30], by employing the two variables of political connections and business connections in testing the influence of environmental regulation intensity and social connections on GTI. The authors designed the models (1)–(5) to validate the three hypotheses that political connections and business connections moderate the relationship between environmental regulation intensity and GTI.
GTI it = C + α i ERI it + β i ERI it 2 + γ i X it + μ it + ν it + ε it
GTI it = C + α i ERI it + β i ERI it 2 + λ i PC it + ρ i BC it + γ i X it + μ it + ν it + ε it
GTI it = C + α i ERI it + β i ERI it 2 + λ i PC it + ϑ i PC it ERI it + ϕ i PC it ERI it 2 + γ i X it + μ it + ν it + ε it
GTI it = C + α i ERI it + β i ERI it 2 + λ i PC it + ϕ i PC it ERI it 2 + ρ i BC it + σ i BC it ERI it 2 + γ i X it + μ it + ν it + ε it
where X indicates other control variables; i denotes the i -th company; t refers to year; α, β, γ, λ, ϑ , ϕ ,   ψ,   ρ ,   φ , and σ, respectively, represent the regression coefficients of variables; μ, ν, ε refer to the fixed effect of the firms, the fixed effect of the year, and the error item, respectively.

3.2. Definition of Variables

3.2.1. Green Technology Innovation (GTI)

GTI is a dependent variable, indicating the green technology patents in a given year. Since the research and development cost does not directly reveal the results of innovation, scholars usually use patents to measure enterprise innovation [22,23,30,32,33,49,70,72,75,76,104,105]. Since green patent authorization is easily affected by factors other than technologies [105], the green patent applications are often used to represent GTI. Based on the “Green List of International Patent Classifications” developed by the World Intellectual Property Organization (WIPO) in 2010, the authors search and sort out the number of green invention patents and green utility model patents from the State Intellectual Property Office of China by using the Python software. Since invention patents and utility model patents are the green output with higher technology and innovation value, this variable is measured as a natural logarithm of the sum of the green invention patents and utility model patents.

3.2.2. Environmental Regulation Intensity (ERI)

ERI is an independent variable, mainly measured by indicators, such as pollution control costs [22,25,106], investment expenditure in environmental governance [107], pollution emissions or composite emission index [29,33,108], operational cost of pollution treatment equipment [30,72], or numbers of environmental policy regulation [109,110]. As most measurements are based on macro-data at the city level or above, this paper chooses a firm’s environmental investment as a proxy for microanalysis. Following Wang et al. [107], the study uses the ratio of environmental investment to annual revenue, multiplied by 100 to compute ERI. The expenditure includes two parts: (1) The first part includes capital expenditure on environmental protection, reflected in the accounting statement of “construction in progress,” specifically referring to the investment in equipment and technological improvements related to environmental protection, such as wastewater and waste gas treatment, energy saving, waste treatment, waste heat recovery and utilization; (2) The second part refers to emission and greening expenses, collected from the accounting statement of “management expenses”.

3.2.3. Political Connection (PC)

Sample companies are considered to build up political connections if the board member or top management team member has political background [37,38,43,45,49,51,52,53,54,55,56,61,75,83,86,111,112]. Based on Wang et al. [61], the company is defined as politically connected if the members of the board or management team are a current or former committee member of the Chinese People’s Political Consultative Conference (CPPCC), current or former deputy to the National People’s Congress (NPC), or a current or former government official. The government level and political status are divided into four grades: state, province, city, county, or township and below, with the values of 4, 3, 2, 1 and 0, respectively. The total value in each company is divided by the sum of numbers of directors, supervisors and senior executives (DSE) and then standardized as PC.

3.2.4. Business Connection (BC)

BC represents the relationship between the company and suppliers, customers and other cooperative enterprises in this paper. Prior studies measure the relationship with the cooperative partners by using a share of the top 5 suppliers or customers in purchases or sales [57,58,112], or numbers of concurrent posts in other companies and associations [61,62,112]. Referring to extant researches, the proportion of total purchases of top 5 suppliers to the overall amount, the proportion of total sales of top 5 customers to the annual amount, and the average number of concurrent posts of DSE represent connection intensity with suppliers, customers, and other cooperative companies respectively. Then, the standardized mean of three numbers is measured as business connections.

3.2.5. Other Control Variables

A firm’s size (Size) is one of the important factors influencing innovation input, measured by a natural logarithm of a firm’s total assets. Larger firms own more resources for innovation investment, however, they may make use of the scale advantage to occupy a monopolistic position, instead of investment in technological innovation.
A firm’s liabilities (Lia) are the resource of innovation investment. Appropriate debt is an effective way to solve the capital problem of innovation. The research uses the ratio of total liabilities to the average total assets at the end of the year to calculate Lia.
A firm’s overall return on total assets (Roa) will affect the willingness to invest in environmental protection and innovation. Roa is measured by the ratio of net profit to average total assets.
The high equity concentration (Equ) may have an effect on the innovation decision-making, so the authors use the square sum of the top 5 major shareholders of the company to compute the Equ.
A firm’s listing age (Age) probably means that the firm is at a different stage of the business life cycle, in which they tend to use different innovation strategies.

3.3. Sample and Data

On 1 January 2015, the Environmental Protection Law of the people’s Republic of China was formally implemented after a comprehensive revision. This law specifies the legal responsibilities of governments, business organizations and individuals at all levels in environmental protection and governance, further forcing relevant economic entities to increase investment in environmental protection. At the end of 2015, according to the environmental protection supervision plan, Hebei Province was set as the test case by the central environmental protection supervision group, which was led by the Ministry of environmental protection and participated by relevant leaders of the Central Commission for Discipline Inspection and the central organization department. In 2016, the central government officially launched large-scale environmental protection supervision, covering 31 provinces and cities in China for two years, and strengthened the supervision of environmental pollution treatment in the later stage by “looking back” and other forms, so as to gradually form a long-term mechanism of the environmental supervision. Due to more data available in recent years under the circumstances, the authors collect data of listed A-share firms from the China Stock Market Accounting Research (CSMAR) database during 2016–2019.In total, 1821 industrial enterprises were selected as initial samples. After deleting the firms with “ST” or “ST*” and incomplete financial data, eventually, 221 firms that have disclosed environmental protection information for four consecutive years are collected as the research sample.
The data of green patent comes from China National Patent Statistics Bureau (CNPSB), and the data of suppliers, clients, and others are from the CSMAR database. Information about political background stems from the sub-database of “executive resume” and proportion of the total amount of the top 5 suppliers and customers, and the average number of concurrent posts of DSE are directly from the sub-database “executive concurrent.” Then, the authors manually double-checked the DSE profile of each company by searching the website, such as Tong HuaShun Finance, Sina Finance and Baidu. Eventually, 884 observations were obtained for each variable of industrial companies. Following the work of previous scholars, the authors apply the regression analysis on panel data to measure GTI against environmental regulation intensity, political connections and business connections.

4. Results

4.1. Descriptive Statistics

Table 1 reports the descriptive statistical results of the main variables. From 2016 to 2019, the average value of GTI of 221 listed companies is 0.345, the maximum and minimum values are 4.001 and 0, respectively, and the standard deviation reaches 0.738, indicating that there is a great gap in the level of GTI among the firms. The mean value of ERI is 0.271, and the standard deviation is 0.605, suggesting that firms suffer different levels of environmental regulation intensity. The result also shows that PCs vary in the sample firms, but business BCs fluctuate within a narrow range.

4.2. Results of Multivariate Analysis

The study uses panel data regression analysis to examine the impact of regulation and social connections on GTI. The study adjusted the robust standard error of the estimation of clustering at the firm level to ensure the rigor of the test.
Table 2 presents the empirical results of model (1)–model (2). Model (1) and model (2) show the direct impact of environmental regulation and social connections on GTI from 2016 to 2019. It is found that a negative correlation exists between the ERI and GTI (−0.173), and the square item of ERI positively influences GTI (0.030), respectively, at the significant level of 5% and 10%, which represents there is a U-shaped nonlinear relationship between ERI and GTI. The turning point of U shape is 2.883 (0.173/(2 × 0.030)) that is within the value interval from 0 to 6.835. Based on the above evidence, H1 is validated. The result is consistent with the literature [28,29,30] that environmental regulation has a U-shaped relationship with GTI. Innovation offset effect will gradually come after ERI approaches 2.883. Since the average ERI level is 0.271, stricter ERI will stimulate the GTI of listed companies. At present, the implementation of the new “Environmental Protection Law” and strict supervision system force enterprises to increase pipe-end pollution control costs, which has a crowding-out effect on green innovation technology investment. However, the government shows the intention to further strengthen the ERI. In 2019 as an example, the Ministry of Ecology Environment revised more than 20 ecological environmental laws and administrative regulations, completed 21 departmental rules and regulations, and formulated and revised 96 national ecological environment standards. Meanwhile, this year, legal authorities handled the 162,900 cases of administrative punishment, with a fine of CNY 11,918 million.
Model (2) suggests that political connections have a negative impact on GTI at the 1% significance level, partially explained by the fact that enterprises may overinvest in political relations in order to obtain government resources, thereby crowding out investment in innovation and negatively affecting GTI. Referring to Cai’s research [113], using the costs of entertainment and travel (ETC) as a measure of corporate corruption, the study finds that the average ETC of the sample companies for the period of 2016–2019 was CNY 14,838,824.08, CNY 16,507,817.77, CNY 16,659,430.72, and CNY 17,077,900.58, respectively, reflecting the growth in investment on political relationships to some extent. As mentioned earlier, highly politically connected firms bear more political and social responsibility, catering to the requirements of GDP growth, and environmental protection will lead to increase in the cost of environmental governance and reduction of innovation input, thereby inhibiting green innovation. Business connections are positively correlated with GTI, significantly at the 5% level because of the information effect and resource effect on knowledge acquisition and influence of cognitive capitals on cooperation between enterprises, which enhance the ability of green innovation.

4.3. Impact of the Interactions between PC, BC, and ERI on GTI

Model (3), Model (4), and Model (5) in Table 3 test H2 and H3. Haans et al. [114] suggest when the main effect is the nonlinear relationship, the moderating effect test focuses on whether the interaction coefficient of the quadratic term of the independent variable and the moderator is significant or not, and the significant coefficient of the first term is not a sufficient and necessary condition. If the main effect is a U-shaped relationship, the positive coefficient represents that the moderator strengthens the positive or negative effect of the relationship between the variables. On the contrary, a negative sign means weakening the effect of the principal relationship.
ϕ i (0.161) in model (3), which is significantly positive at the 10% level, indicates that PC reinforces the negative and positive effects of ERI on GTI. The result confirms our expectation that, in the initial implementation, crowding-out and compliance cost effect play the main role; with the increasingly stringent regulation, the political connection provides more scarce resources, and compensation for the innovation exceeds the crowding-out cost.
In model (4), σ i (−0.177) is significantly negative at the 10% level, reporting that business connection weakens the negative and positive effects of ERI on GTI. It suggests that, in the early days, industrial information, rich social channel, and mutual commitment in strong supply-customer relations improve the firm’s ability to resist risks; knowledge exchange and resource sharing ensure the stability of the firm’s performance and normal technological innovation. However, under the continuous impact of strong regulation, the social network between the commercial partners locks in an inflow of the new knowledge of the innovation.
Model (5) shows the combined effect of PC and BC on the relationship between ERI and GTI. The empirical result stresses the fact that PC reinforces the negative and positive effects of ERI on GTI and BC negatively moderates the relationship of them. The coefficient of ERI2 × PC (0.004) is slightly lower than the coefficient value of ERI2 × BC (0.006), which indicates that BC has a greater impact on the relationship of ERI and GTI than PC does. One reason may be that political ties lack an effective mechanism to ensure long-term cooperation with the enterprises, which results from officials’ priority for promotion and job rotation across different departments and geographic locations [92].
Figure 1 and Figure 2 further report the moderating effect of PC and BC on the relationship between ERI and GTI. The research suggests: (1) Firms with low political connections likely pursue short and fast innovation projects or directly introduce pipe-end treatment technologies, which crowds out the innovation investment under loose regulation. However, stricter regulation will urge the firms to make active innovations to offset the increasing regulation cost. High political ties that force firms to take more social responsibility increasingly squeeze out the innovation, but more benefits from it mitigate the pressure of environmental regulation and promote GTI in the future; (2) High business ties that provide the more social capitals, such as knowledge information, trust, commitment, and so on, alleviate the impact of crowding-out effect from the regulation. Thus, low business connection with fewer capitals makes the two ends of the turning point steeper; H2 and H3 are verified.

4.4. Heterogeneity Analysis in Sub-Samples

According to the Environmental Disclosure Guidelines (EDG) for Listed Companies published by the Ministry of Environmental Protection of China, 16 major industries are included in polluting industries, such as thermal power, steel, cement, electrolytic aluminum, coal, metallurgy, chemicals, petrochemicals, building materials, papermaking, brewing, pharmaceuticals, fermentation, textiles, tanning and mining. According to the guideline, 221 listed companies can be divided into 150 heavily polluting (HP) and 70 non-heavily polluting (non-HP) enterprises. Further analyzing HP and non-HP groups, the authors find that PC, in the HP industry, strengthens the negative and positive effect of ERI on GTI, significantly at the 1% level (0.250, ρ = 0.01), with an insignificant effect of BC; nevertheless, PC in non-HP firms, weakens the effect of ERI on GTI (−0.526, ρ = 0.05), and BC has the reverse effect, at the 5% level (0.682, ρ = 0.05) (Shown in Table 4).
The strengthening effect in the HP group confirms the expectation because, from the perspective of environmental protection laws and regulations, the heavily polluting industry is the main field of environmental governance. In April 2015, the State Council issued the action plan for water pollution prevention and control [115]. In the same year, the new “Environmental Protection Law” was formally implemented, which requires “paying close attention to the prevention and control of industrial pollution and launches special campaign against ten major polluting industries” [116]. In December 2016, the State Council released the 13th Five Year Plan for Ecological and Environmental Protection, which included “strengthening environmental hard constraints, and promoting the elimination of backward and excess capacity,” proposed“ establishing a mechanism for the withdrawal of heavily polluting capacity and the resolution of excess capacity,” and set limits on the development scale of papermaking, tanning, printing, and dyeing, coking, and other industries [117]. In 2017, the 13th Five Year Comprehensive Work Plan for Energy Conservation and Emission Reduction stressed that “enterprises and production capacity in key industries that fail to meet the standards of environmental protection, energy consumption and safety, or produce or use obsolete products, should exit in an orderly way, according to law and regulations” [118]. In 2018, Opinions of the State Council on Comprehensively Strengthening Ecological and Environmental Protection and Firmly Campaign for Pollution Prevention and Control required “accelerating the relocation and transformation of heavily polluting and hazardous chemical enterprises in urban built-up areas and major river valleys, continuously resolving the problem of excess capacity, and strictly prohibiting the new capacity in iron and steel, cement, electrolytic aluminum, flat glass and other industries,” and emphasized “in the following industries, such as energy, metallurgy, building materials, nonferrous metals, chemicals, electroplating, papermaking, printing and dyeing, agro-food processing and other industries, we will comprehensively promote improvements for cleaner production or cleaner transformation” [119]. From the practice of environmental protection, Hebei, Shanxi, Gansu, Shaanxi, Hunan, Hubei, and other provinces, as well as Beijing, Tianjin, Handan, Jiaozuo, Tangshan, Xining, Datong, Chongqing, and other heavily polluted cities have made a great effort to control the heavily polluting industries, restrict production capacity, reduce emissions and pollution, and force the heavily polluting enterprises to move out of cities, or halt the production. Therefore, as far as heavily polluting enterprises are concerned, PC has a significant negative effect in the early (in Model (6)), but eventually, benefit from PC will compensate the cost. However, BC has an insignificant moderating effect on the ERI and GTI (in Model (7)).
The weakening effect of high political connection in non-HP enterprises may be due to the following reasons: (1) Non-HP enterprises take less responsibility for emission reduction and pollution reduction due to small environmental hard constraints. Therefore, high PC does not accelerate the crowding-out effect early; (2) Funding for non-HP firms does not necessarily increase investment in R&D, squeeze their R&D expenditure, and reduce the entrepreneurship [120]; (3) A promotion tournament causes a firm’s cheating for subsidies because ecological environmental responsibility has been incorporated into the performance assessment of local officials, leading to the failure of induced effect [121]. Consequently, even with increasingly stringent environmental regulation, the government’s resource does not necessarily lead to innovation. It is not urgent for the non-HP firms to make green innovation, so that knowledge accumulation does not cause a lock-in on innovation, which is probably the reason for the positive moderating effect of BC.
Model (8) presents the combined effect of PC and BC in sub-samples. In the HP industry, PCs have a slightly lower moderating effect than BCs do. The result is consistent with the previous test, but the moderating effect of PCs is insignificant. In the non-HP group, BCs have an obviously greater impact on the effect of ERI on GTI. It may be that non-HP firms suffer less environmental constraints and market resources from BCs are the main factors influencing their development.

4.5. Robustness Tests

To test the robustness of the models, an alternative definition of environmental regulation intensity narrows the original meaning to include the pollution control cost [22,25,106]. The authors use a ratio of numbers of the top management team (TMT)with government background to the total number of the team for the political connections [122]. Business connection is measured as the proportion of numbers of TMT’s concurrent posts to the whole team members [122]. Table 5 shows the empirical results that ERI has a U-shaped relationship with the GTI. The coefficients of PC, BC, and quadratic term of ERI are 0.118 and −0.171, respectively, at a 10% significance level. Political connection strengthens the negative and positive effects of environmental regulation on GTI, while business connection has the opposite influence. Business connections have a greater moderating effect than political connections do since the coefficient value of ERI2 × BC (0.0087) is higher than the coefficient of ERI2 × PC (0.0079). The robustness test is basically consistent with the test results of the previous empirical evidence.

5. Conclusions, Policy Implications, and Discussions

This study investigates the impact of environmental regulation intensity and social connections on GTI, using a sample of 221 China’s listed A-share firms from 2016 to 2019.
Firstly, the empirical evidence shows that the effect of environmental regulation on GTI presents a U-shaped relationship, indicating that initially, the crowding-out effect caused by environmental regulation inhibits GTI, but after the turning point, offset effect will promote GTI.
Secondly, political connections of the listed companies positively moderate the impact of environmental regulation on GTI at the 10% level, suggesting that the rent-seeking and resource effect from the political connections strengthen the negative and positive effects of environmental regulation on GTI.
Thirdly, the study explores the influence of business connections and the environmental regulation intensity on GTI. The research finds that business connections negatively moderate the relationship between environmental regulation and GTI. The outcome indicates that knowledge and resources from business connections can mitigate the crowding-out effect, but the path-dependent and look-in effect probably impedes compensation for the innovation with stringent environmental regulation.
Fourthly, it seems that business connections have a stronger moderating effect than political connections do. This may be due to the lack of long-term cooperation mechanisms between government officials and companies.
Finally, political connections and business connections in non-heavily polluting firms, play a different role from the ones in heavily polluting firms, respectively, presenting the negative and positive moderation effect. One of the reasons may be that funding for non-HP firms with high political connections does not necessarily lead to innovation, and even cause cheating behavior for innovation subsidies. Furthermore, cumulative knowledge probably does not lock in innovation in the non-HP industry.
The findings of this study can generate some policy implications. First, stricter regulation and law enforcement will stimulate GTI. Meanwhile, the Chinese government should further promote the improvement of a market mechanism that can abate the distortion of energy prices, instead of excessive administrative intervention that probably results in energy inefficiency. More efforts should be taken to spread green consumption concepts and encourage green consumption behavior, which contributes to the formation of a green market. Second, China should make more efforts to fight against corruption and optimize the official promotion assessment system, which helps to reduce the innovation crowding-out effect caused by two-way rent-seeking and promotion tournaments. In the meanwhile, it is necessary to encourage firms to strengthen the cooperation with universities and research institutes, and search the innovative information from industry associations and international enterprises in response to the lock-in of information that business connections bring about with increasing environmental regulation intensity. Under some circumstances, business connections should be paid more attention to, since it has more power than political connections. Accordingly, relevant subsidy policies can be developed with the goal of promoting GTI, reducing environmental pollution and increasing energy efficiency. Specific requirements for application for the green subsidy should be formulated carefully and cautiously so as to prevent non-heavily polluting firms from fraud of the subsidy.
Although this study gives some findings and policy implications on the topic, there are some defects and issues deserving further discussion. Due to a lack of systematic disclosure of environmental information, the study time series is limited from 2016 to 2019. However, the impact of environmental regulation on GTI is a long-term dynamic process, which requires further observation for a long period. The importance varies in identities of government officials, deputies to the NPC and members of the CPPCC, which maybe leads to a different effect on the relationship between environmental regulation and GTI. Therefore, further exploration contributes to better understanding the mechanism of political connections on innovation. It’s an interesting direction of further exploring the coupling effect of two connections since the empirical results indicate business connections have an opposite but greater impact than political connections. Additionally, further discussion of heterogeneity between concurrent posts and features of enterprises may generalize more useful conclusions.

Author Contributions

Conceptualization, Y.-H.A. and D.-Y.P.; data curation, Y.-H.A. and H.-H.X.; methodology, Y.-H.A. and D.-Y.P.; software, Y.-H.A. and H.-H.X.; validation, Y.-H.A. and D.-Y.P.; formal analysis, Y.-H.A. and D.-Y.P.; writing-original draft preparation, Y.-H.A. and H.-H.X.; writing-review and editing, D.-Y.P.; funding acquisition, Y.-H.A. and H.-H.X.; project administration, H.-H.X. All authors have read and agreed to the published version of the manuscript.

Funding

This research was funded by the National Natural Science Foundation of China (AA201909042), major program of key research base of the Humanities and Social Sciences of the Ministry of Education, and the Jiangxi Provincial Higher Education Reform Research Project (JXJG-20-1-35) of China.

Institutional Review Board Statement

Not applicable.

Informed Consent Statement

Not applicable.

Data Availability Statement

The data presented in this study are available on request from the corresponding author. The data are not publicly available due to being collected and sorted by authors from some paid databases.

Conflicts of Interest

The authors declare no conflict of interest.

References

  1. Ministry of Ecology and Environment Announces the Outline of the National Ecological Environment Quality in 2019. Available online: http://www.mee.gov.cn/xxgk2018/xxgk/xxgk15/202005/t20200507_777895.html (accessed on 23 March 2021).
  2. World Health Organization Regional Office for Europe. Air Quality Guidelines for Europe, 2nd ed.; WHO Regional Publications: Copenhagen, Denmark, 2000; pp. 186–193. [Google Scholar]
  3. CO2 Emission from Fuel Combustion: Overview. Available online: https://www.iea.org/reports/co2-emissions-from-fuel-combustion-overview (accessed on 23 March 2021).
  4. Continuously Promote the Green and Low Carbon Circular Development of Industry and Adjustment of Industrial Structure in the Fourteenth Five Year Plan. Available online: http://www.cinn.cn/gongjing/202103/t20210319_239922.shtml (accessed on 23 March 2021).
  5. Qu, Y.; Yu, Y.; Appolloni, A.; Li, M.R.; Liu, Y. Measuring green growth efficiency for Chinese manufacturing industries. Sustainability 2017, 9, 637. [Google Scholar] [CrossRef] [Green Version]
  6. Guo, Y.; Xia, X.; Sheng, Z.; Zhang, D.P. Environmental regulation, government R&D funding and green technology innovation: Evidence from China provincial data. Sustainability 2018, 10, 940. [Google Scholar] [CrossRef] [Green Version]
  7. Zhang, J.M.; Liang, G.Q.; Feng, T.W.; Yuan, C.L.; Jiang, W.B. Green innovation to respond to environmental regulation: How external knowledge adoption and green absorptive capacity matter? Bus. Strategy Environ. 2020, 29, 39–53. [Google Scholar] [CrossRef]
  8. Miao, C.L.; Fang, D.B.; Sun, L.Y.; Luo, Q.L. Natural resources utilization efficiency under the influence of green technological innovation. Resour. Conserv. Recycl. 2017, 126, 153–161. [Google Scholar] [CrossRef]
  9. Blum-Kusterer, M.; Hussain, S.S. Innovation and corporate sustainability: An investigation into the process of change in the pharmaceuticals industry. Bus. Strategy Environ. 2001, 10, 300–316. [Google Scholar] [CrossRef]
  10. Fernando, Y.; Wah, W.X. The impact of eco-innovation drivers on environmental performance: Empirical results from the green technology sector in Malaysia. Sustain. Prod. Consum. 2017, 12, 27–43. [Google Scholar] [CrossRef]
  11. Xie, X.M.; Huo, J.G.; Zou, H.L. Green process innovation, green product innovation, and corporate financial performance: A content analysis method. J. Bus. Res. 2019, 101, 697–706. [Google Scholar] [CrossRef]
  12. Jaffe, A.B.; Newell, R.G.; Stavins, R.N. A tale of two market failures: Technology and environmental policy. Ecol. Econ. 2005, 54, 164–174. [Google Scholar] [CrossRef] [Green Version]
  13. Spulber, D.F. Regulation and Markets, 1st ed.; The MIT Press: Cambridge, MA, USA, 1989; p. 45. [Google Scholar]
  14. Testa, F.; Iraldo, F.; Frey, M. The effect of environmental regulation on firms’ competitive performance: The case of the building & construction sector in some EU regions. J. Environ. Manag. 2011, 92, 2136–2144. [Google Scholar] [CrossRef]
  15. Simpson, R.D.; Bradford, R.L. Taxing variable cost: Environmental regulation as industrial policy. J. Environ. Econ. Manag. 1996, 30, 282–300. [Google Scholar] [CrossRef]
  16. Greenstone, M.; List, J.A.; Syverson, C. The effects of environmental regulation on the competitiveness of U.S. manufacturing. S. manufacturing. SSRN Electron. J. 2011. [Google Scholar] [CrossRef] [Green Version]
  17. He, J. Pollution haven hypothesis and environmental impacts of foreign direct investment: The case of industrial emission of sulfur dioxide (SO2) in Chinese provinces. Ecol. Econ. 2006, 60, 228–245. [Google Scholar] [CrossRef] [Green Version]
  18. Duan, Y.W.; Ji, T.; Yu, T.T. Reassessing pollution haven effect in global value chains. J. Clean. Prod. 2021, 284, 124705. [Google Scholar] [CrossRef]
  19. Solarin, S.A.; Al-Mulali, U.; Musah, I.; Ozturk, I. Investigating the pollution haven hypothesis in Ghana: An empirical investigation. Energy 2017, 124, 706–719. [Google Scholar] [CrossRef]
  20. Porter, M.E. America’s green strategy. Sci. Am. 1991, 264, 193–246. [Google Scholar] [CrossRef]
  21. Porter, M.E.; Linde, C.V.D. Toward a new conception of the environment competitiveness relationship. J. Econ. Perspect. 1995, 9, 97–118. [Google Scholar] [CrossRef]
  22. Lanjouw, J.O.; Mody, A. Innovation and the international diffusion of environmentally responsive technology. Res. Policy 1996, 25, 549–571. [Google Scholar] [CrossRef]
  23. Wang, H.Q.; Zhang, Y. Trade structure upgrading, environmental regulation and green technology innovation in different regions of China. China Soft Sci. 2020, 2, 174–181. [Google Scholar]
  24. Frondel, M.; Horbach, J.; Rennings, K. End-of-pipe or cleaner production? An empirical comparison of environmental innovation decision across OECD countries. Bus. Strategy Environ. 2004, 16, 571–584. [Google Scholar] [CrossRef] [Green Version]
  25. Hamamoto, M. Environmental regulation and the productivity of Japanese manufacturing industries. Resour. Energy Econ. 2006, 28, 299–312. [Google Scholar] [CrossRef]
  26. Yuan, Y.J.; Chen, Z. Environmental regulation, green technology innovation and the transformation and upgrading of China’s manufacturing industry. Stud. Sci. Sci. 2019, 37, 1902–1911. [Google Scholar] [CrossRef]
  27. Cole, M.A.; Elliott, R.J.R.; Okubo, T. Trade, environmental regulations and industrial mobility: An industry-level study of Japan. Ecol. Econ. 2010, 69, 1995–2002. [Google Scholar] [CrossRef] [Green Version]
  28. Zhang, J.; Geng, H.; Xu, G.W.; Chen, J. Research on the influence of environmental regulation on green technology innovation. China Popul. Resour. Environ. 2019, 29, 168–176. [Google Scholar] [CrossRef]
  29. Jiang, F.X.; Wang, Z.J.; Bai, J.H. The dual effect of environmental regulations’ impact on innovation—An empirical study based on dynamic panel data of Jiangsu manufacturing. China Ind. Econ. 2013, 7, 44–55. [Google Scholar] [CrossRef]
  30. Wang, Z.Y.; Cao, Y.; Lin, S.L. The characteristics and heterogeneity of environmental regulation’s impact on enterprises’ green technology innovation-Based on green patent data of listed firms in China. Stud. Sci. Sci. 2020, 38, 1–22. [Google Scholar] [CrossRef]
  31. Shen, N. The threshold effect of environmental regulation on regional technological innovation. China Popul. Resour. Environ. 2012, 22, 12–16. [Google Scholar] [CrossRef]
  32. Sen, S. Corporate governance, environmental regulations, and technological change. Eur. Econ. Rev. 2015, 80, 36–61. [Google Scholar] [CrossRef]
  33. Li, X.A. Environmental regulation, government subsidies and regional green technology innovation--Based on the empirical research of provincial space panel. Econ. Surv. 2021, 28, 1–15. [Google Scholar] [CrossRef]
  34. Morgan, B.W. Strategy and Enterprise Value in the Relationship Economy, 1st ed.; Van Nostrand Reinhold: New York, NY, USA, 1998; pp. 47–68. [Google Scholar]
  35. Greve, A. Absorptive Capacity and Social Capital: Innovation and Environmental Regulation. In Energy, Natural Resources and Environmental Economics, 1st ed.; Bjorndal, E., Bjørndal, M., Pardalos, P., Rönnqvist, M., Eds.; Springer: Berlin, Germany, 2010; pp. 379–393. [Google Scholar]
  36. Cumming, D.; Rui, O.M.; Wu, Y.P. Political instability, access to private debt, and innovation investment in China. Emerg. Mark. Rev. 2016, 29, 68–81. [Google Scholar] [CrossRef]
  37. Zhang, C.; Lou, Z.K.; Zhan, D.B. Political connection, financial performance and corporate social responsibility—Evidence from listed companies of the chemical industry in China. Manag. Rev. 2014, 26, 130–139. [Google Scholar] [CrossRef]
  38. Zhang, C. Political connections and corporate environmental responsibility: Adopting or escaping? Energy Econ. 2017, 68, 539–547. [Google Scholar] [CrossRef]
  39. Li, J.; Xia, J.; Zajac, E.J. On the duality of political and economic stakeholder influence on firm innovation performance: Theory and evidence from Chinese firms. Strateg. Manag. J. 2018, 39, 193–216. [Google Scholar] [CrossRef]
  40. Clarysse, B.; Wright, M.; Mustar, P. Behavioral additionality of R&D subsidies: A learning perspective. Res. Policy 2009, 38, 1517–1533. [Google Scholar] [CrossRef]
  41. He, Y.; Xu, L.; McIver, R.P. How does political connection affect firm financial distress and resolution in China? Appl. Econ. 2019, 51, 2770–2792. [Google Scholar] [CrossRef]
  42. Khwaja, A.I.; Mian, A. Do lenders favor politically connected firms? Rent provision in an emerging financial market. Q. J. Econ. 2005, 120, 1371–1412. [Google Scholar] [CrossRef]
  43. Shen, C.H.; Lin, C.Y. Political connections, financial constraints, and corporate investment. Rev. Quant. Financ. Account. 2015, 47, 343–368. [Google Scholar] [CrossRef]
  44. Faccio, M. Politically connected firms. Am. Econ. Rev. 2006, 96, 369–386. [Google Scholar] [CrossRef] [Green Version]
  45. Cai, D.; Huang, J.S.; Li, C.M.; Liu, H. The impact of political connections on Chinese private firms’ technical innovation. Econ. Rev. 2014, 2, 65–76. [Google Scholar]
  46. Zhou, W. Political connections and entrepreneurial investment: Evidence from China’s transition economy. J. Bus. Ventur. 2013, 28, 299–315. [Google Scholar] [CrossRef]
  47. Cingano, F.; Pinotti, P. Politicians at work: The private returns and social costs of political connections. J. Eur. Econ. Assoc. 2013, 11, 433–465. [Google Scholar] [CrossRef]
  48. Bussolo, M.; De Nicola, F.; Panizza, P.; Varghese, R. CEPR Discussion Paper. In Political Connections and Financial Constraints: Evidence from Central and Eastern Europe; CEPR Discussion Papers 14126; World Bank Group, Europe and Central Asia Region Office of the Chief Economist: London, UK, 2019. [Google Scholar]
  49. Luo, M.X.; Ma, Q.H.; Hu, Y.B. Political connection and firm technological innovation performance-A study on the mediating role of R&D investment. Stud. Sci. Sci. 2013, 31, 938–947. [Google Scholar] [CrossRef]
  50. Claessens, S.; Feijen, E.; Laeven, L. Political connections and preferential access to finance: The role of campaign contributions. J. Financ. Econ. 2008, 88, 554–580. [Google Scholar] [CrossRef] [Green Version]
  51. Hou, Q.S.; Hu, M.; Yuan, Y. Corporate innovation and political connection in Chinese listed firms. Pac. Basin Financ. J. 2017, 46, 158–176. [Google Scholar] [CrossRef]
  52. Yu, X.J.; Yao, Y.; Zheng, H.H.; Zhang, L. The role of political connection on overinvestment of Chinese energy firms. Energy Econ. 2020, 85, 104516. [Google Scholar] [CrossRef]
  53. Ling, L.; Zhou, X.R.; Liang, Q.X.; Song, P.P.; Zeng, H.J. Political connections, overinvestments and firm performance: Evidence from Chinese listed real estate firms. Financ. Res. Lett. 2016, 18, 328–333. [Google Scholar] [CrossRef]
  54. Zhang, J.H.; Li, X.Q.; Fung, H.G.; Qiao, P.H. Do political connections promote innovation in environmentally polluting enterprises? China World Econ. 2019, 27, 76–101. [Google Scholar] [CrossRef]
  55. Zhang, L.M.; Ye, F.; Yang, L.; Zhou, G.C. Impact of political connections on corporate environmental performance: From a green development perspective. Sustainability 2019, 11, 1317. [Google Scholar] [CrossRef] [Green Version]
  56. Huang, M.; Li, M.Y.; Liao, Z.H. Do politically connected CEOs promote Chinese listed industrial firms’ green innovation? The mediating role of external governance environments. J. Clean. Prod. 2020, 278, 123634. [Google Scholar] [CrossRef]
  57. Patatoukas, P.N. Customer-base concentration: Implications for firm performance and capital markets. Account. Rev. 2011, 87, 363–392. [Google Scholar] [CrossRef] [Green Version]
  58. Kim, Y.H.; Henderson, D. Financial benefits and risks of dependency in triadic supply chain relationships. J. Oper. Manag. 2015, 36, 115–129. [Google Scholar] [CrossRef]
  59. Gao, S.X.; Xu, K.; Yang, J.J. Managerial ties, absorptive capacity, and innovation. Asia Pac. J. Manag. 2008, 25, 395–412. [Google Scholar] [CrossRef]
  60. Shi, J.Y.; Yang, J.H.; Li, Y.X.; Zhang, Q.W. A slight move in one part may affect the situation as a whole: Supply network location, operational risk and corporate performance. China Ind. Econ. 2019, 33, 136–154. [Google Scholar] [CrossRef]
  61. Wang, N.; Huang, J.; Wang, B. A research on the relationship between board social capital and CEO power on R&D investment: An evidence from the GEM Listed Corporation. Sci. Res. Manag. 2019, 40, 244–253. [Google Scholar] [CrossRef]
  62. Ma, X.X.; Lu, H. The influence of top management team and external social capital on technology innovation: Taking executive incentive as moderator variables. Sci. Technol. Manag. Res. 2019, 39, 162–168. [Google Scholar] [CrossRef]
  63. Allen, F.; Qian, J.; Qian, M.J. Law, finance, and economic growth in China. J. Financ. Econ. 2003, 77, 57–116. [Google Scholar] [CrossRef] [Green Version]
  64. Ouyang, X.L.; Sun, C.W. Energy savings potential in China’s industrial sector: From the perspectives of factor price distortion and allocative inefficiency. Energy Econ. 2015, 48, 117–126. [Google Scholar] [CrossRef]
  65. Pang, D.L.; Su, H.W. Determinants of energy intensity in Chinese provinces. Energy Environ. 2017, 28, 451–467. [Google Scholar] [CrossRef]
  66. Thirtle, C.G.; Vernon, W.R. The Role of Demand and Supply in the Generation and Diffusion of Technical Change, 1st ed.; University of Minnesota, Economic Development Center: Minneapolis, MN, USA, 1987; pp. 6–11. [Google Scholar]
  67. Tsai, K.H.; Liao, Y.C. Sustainability strategy and eco-innovation: A moderation model. Bus. Strategy Environ. 2017, 26, 426–437. [Google Scholar] [CrossRef]
  68. Lin, S.T.; Niu, H.J. Green consumption: Environmental knowledge, environmental consciousness, social norms, and purchasing behavior. Bus. Strategy Environ. 2018, 27, 1679–1688. [Google Scholar] [CrossRef]
  69. Teece, D.J.; Pisano, G.P.; Shuen, A. Dynamic capabilities and strategic management. Strateg. Manag. J. 1997, 18, 509–533. [Google Scholar] [CrossRef]
  70. Wu, J.F.; Shanley, M.T. Knowledge stock, exploration, and innovation: Research on the United States electromedical device industry. J. Bus. Res. 2009, 62, 474–483. [Google Scholar] [CrossRef]
  71. Roper, S.; Hewitt-Dundas, N. Knowledge stocks, knowledge flows and innovation: Evidence from matched patents and innovation panel data. Res. Policy 2015, 44, 1327–1340. [Google Scholar] [CrossRef] [Green Version]
  72. Yuan, B.L.; Xiang, Q.L. Environmental regulation, industrial innovation and green development of Chinese manufacturing: Based on an extended CDM model. J. Clean. Prod. 2018, 76, 895–908. [Google Scholar] [CrossRef]
  73. Cohen, M.A.; Tubb, A. The impact of environmental regulation on firm and country competitiveness: A meta-analysis of the Porter Hypothesis. J. Assoc. Environ. Resour. Econ. 2018, 5, 371–399. [Google Scholar] [CrossRef] [Green Version]
  74. Bellettini, G.; Ceroni, C.B.; Prarolo, G. Knowing the right person in the right place: Political connections and economic growth. SSRN Electron. J. 2009. Available online: https://www.researchgate.net/publication/228284853_Knowing_the_Right_Person_in_the_Right_Place_Political_Connections_and_economic_Growth (accessed on 26 April 2021).
  75. Yuan, J.G.; Hou, Q.S.; Cheng, C. The curse effect of enterprise political resources: Based on the investigation of political connection and enterprise technological innovation. Manag. World 2015, 31, 139–155. [Google Scholar] [CrossRef]
  76. Akcigit, U.; Baslandze, S.; Lotti, F. Connecting to power: Political connections, innovation, and firm dynamics. SSRN Electron. J. 2018, 3260274. [Google Scholar] [CrossRef] [Green Version]
  77. Murphy, K.M.; Shleifer, A.; Vishny, R.W. The allocation of talent: Implications for growth. Q. J. Econ. 1991, 106, 503–530. [Google Scholar] [CrossRef]
  78. Zhang, X.B.; Zhuang, C. Expansion and strengthening: Comprehensive application of environmental tort liability. Soc. Sci. China 2014, 3, 125–207. [Google Scholar]
  79. Li, H.B.; Zhou, L.A. Political turnover and economic performance: The incentive role of personnel control in China. J. Public Econ. 2005, 89, 1743–1762. [Google Scholar] [CrossRef]
  80. Cao, C.F.; Ma, L.F.; Shen, X.X. Fiscal pressure, promotion pressure, tenure of office and local state-owned companies overinvestment. Econ. Q. 2014, 4, 1415–1436. [Google Scholar] [CrossRef]
  81. Li, J.; Shi, X.; Wu, H.Q.; Liu, L.W. Trade-off between economic development and environmental governance in China: An analysis based on the effect of river chief system. China Econ. Rev. 2019, 60, 99–117. [Google Scholar] [CrossRef]
  82. Lin, Y.F.; Li, Z.Y. CCER, Peking University working paper. Policy Burden, Moral Hazard and Soft Budget Constraint; China Center for Economic Research: Beijing, China, 2006; NO. E2006004. [Google Scholar]
  83. Yu, W.; Wang, M.J.; Jin, X.G. Political connection and financing constraints information effect and resource effect. Econ. Res. 2012, 9, 125–139. [Google Scholar]
  84. Houston, J.F.; Jiang, L.L.; Lin, C.; Ma, Y. Political connections and the cost of bank loans. J. Account. Res. 2014, 52, 193–243. [Google Scholar] [CrossRef]
  85. Zhang, D.Y.; Guo, Y.M. Financing R&D in Chinese private firms: Business associations or political connection? Econ. Model. 2019, 79, 247–261. [Google Scholar] [CrossRef]
  86. Wang, Z.Y.; Yang, J.J.; He, H.Q.; Su, L. The mechanism of politically-connected managers on technological innovation for small and medium high-tech enterprises-Empirical evidence from listed firms in Chinese SMEs stock market. Int. J. Serv. Comput. Oriented Manuf. 2013, 1, 178–195. [Google Scholar] [CrossRef]
  87. Meuleman, M.; Maeseneire, W.D. Do R&D subsidies affect SMEs’ access to external financing? Res. Policy 2008, 41, 580–591. [Google Scholar] [CrossRef]
  88. Xu, K.; Huang, K.F.; Gao, S.X. The effect of institutional ties on knowledge acquisition in uncertain environments. Asia Pac. J. Manag. 2012, 29, 387–408. [Google Scholar] [CrossRef]
  89. Yan, Z.Q.; Li, Y. Signaling through government subsidy: Certification or endorsement. Financ. Res. Lett. 2018, 25, 90–95. [Google Scholar] [CrossRef]
  90. Bian, Y.J.; Qiu, H.X. The social capital of enterprises and its efficiency. Chin. Soc. Sci. 2000, 2, 87–99. [Google Scholar]
  91. Bullinger, H.J.; Auernhammer, K.; Gomeringer, A. Managing innovation networks in the knowledge-driven economy. Int. J. Prod. Res. 2004, 42, 3337–3353. [Google Scholar] [CrossRef]
  92. Sheng, S.B.; Zhou, Z.K.; Li, J.J. The effects of business and political ties on firm performance: Evidence from China. J. Mark. 2011, 75, 1–15. [Google Scholar] [CrossRef]
  93. Zeng, S.X.; Xie, X.M.; Tam, C.M. Relationship between cooperation networks and innovation performance of SMEs. Technovation 2010, 30, 181–194. [Google Scholar] [CrossRef]
  94. Fang, E.; Palmatier, R.; Evans, K.R. Influence of customer participation on creating and sharing of new product value. J. Acad. Mark. Sci. 2008, 36, 322–336. [Google Scholar] [CrossRef]
  95. Sanchez-Gonzalez, G.; Gonzalez-Alvarez, N.; Nieto, M. Sticky information and heterogeneous needs as determining factors of R&D cooperation with customers. Res. Policy 2009, 38, 1590–1603. [Google Scholar] [CrossRef]
  96. Poppo, L.; Zenger, T.R. Do formal contracts and relational governance function as substitutes or complements? Strateg. Manag. J. 2002, 23, 707–725. [Google Scholar] [CrossRef]
  97. Inkpen, A.C.; Tsang, E.W.K. Social capital, networks, and knowledge transfer. Acad. Manag. Rev. 2005, 30, 146–165. [Google Scholar] [CrossRef] [Green Version]
  98. Burt, R.S. Structural Holes: The Social Structure of Competition, 1st ed.; Harvard University Press: Cambridge, MA, USA, 1992; pp. 8–81. [Google Scholar] [CrossRef]
  99. Ganesan, S. Determinants of long-term orientation in buyer-seller relationships. J. Mark. 1994, 58, 1–19. [Google Scholar] [CrossRef]
  100. Roden, S.; Lawson, B. Developing social capital in buyer-supplier relationships: The contingent effect of relationship-specific adaptations. Int. J. Prod. Econ. 2014, 151, 89–99. [Google Scholar] [CrossRef]
  101. Zhang, M.; Qi, Y.N.; Wang, Z.Q.; Zhao, X.D.; Pawar, K. Effects of business and political ties on product innovation performance: Evidence from China and India. Technovation 2019, 80–81, 30–39. [Google Scholar] [CrossRef]
  102. Uzzi, B. Social structure and competition in inter-firm networks: The paradox of embeddedness. Adm. Sci. Q. 1997, 42, 35–67. [Google Scholar] [CrossRef]
  103. Autry, C.; Griffis, S.E. Supply chain capital: The impact of structural and relational linkages on firm execution and innovation. J. Bus. Logist. 2008, 29, 157–173. [Google Scholar] [CrossRef]
  104. Calel, R.; Dechezleprêtre, A. Environmental policy and directed technological change: Evidence from the European carbon market. Rev. Econ. Stat. 2016, 98, 173–191. [Google Scholar] [CrossRef] [Green Version]
  105. Qi, S.Z.; Zhang, Q.; Wang, B.B. Market-oriented incentives to the innovation of new energy companies-Evidence from venture capital and companies’ patents. China Ind. Econ. 2017, 12, 95–112. [Google Scholar] [CrossRef]
  106. Fredriksson, P.G.; Millimet, D.L. Is there a ’California effect’ in US environmental policy making? Reg. Sci. Urban Econ. 2002, 32, 737–764. [Google Scholar] [CrossRef]
  107. Wang, F.Z.; Chen, F.Y. Board governance, environmental regulation and green technology innovation-Empirical test based on listed companies in China’s heavy polluting industry. Stud. Sci. Sci. 2018, 36, 361–369. [Google Scholar] [CrossRef]
  108. Tole, L.; Koop, G. Do environmental regulations affect the location decisions of multinational gold mining firms? Econ. Geogr. 2011, 11, 151–177. [Google Scholar] [CrossRef] [Green Version]
  109. Johnstone, N.; Haščič, I.; Popp, D. Renewable energy policies and technological innovation: Evidence based on patent counts. Environ. Resour. Econ. 2010, 45, 133–155. [Google Scholar] [CrossRef]
  110. Cole, M.A.; Fredriksson, P.G. Institutionalized pollution havens. Ecol. Econ. 2009, 68, 1239–1256. [Google Scholar] [CrossRef] [Green Version]
  111. Raymond, F.; Wang, Y.X. The mortality cost of political connections. Rev. Econ. Stud. 2015, 82, 1346–1382. [Google Scholar] [CrossRef] [Green Version]
  112. Chen, Y.F.; Jin, B.X.; Ren, Y. Impact mechanism of corporate social responsibility on technological innovation performance: The mediating effect based on social capital. Sci. Res. Manag. 2020, 41, 87–98. [Google Scholar]
  113. Cai, H.B.; Fang, H.M.; Xu, L.X. Eat, drink, firms, government: An investigation of corruption from the entertainment and travel costs of Chinese firms. J. Law Econ. 2011, 54, 55–78. [Google Scholar] [CrossRef] [Green Version]
  114. Haans, R.F.J.; Pieters, C.; He, Z.L. Thinking about U: Theorizing and testing U- and inverted U-shaped relationships in strategy research. Strateg. Manag. J. 2016, 37, 1177–1195. [Google Scholar] [CrossRef]
  115. Notice of the State Council on Issuing the Action Plan for Prevention and Control of Water Pollution. Available online: http://www.gov.cn/zhengce/content/2015-04/16/content_9613.htm (accessed on 24 March 2021).
  116. Environmental Protection Law of the People′s Republic of China. Available online: http://www.gov.cn/zhengce/2014-04/25/content_2666434.htm (accessed on 24 March 2021).
  117. Notice of the State Council on Issuing the 13th Five Year Plan for Ecological Environment Protection. Available online: http://www.gov.cn/zhengce/content/2016-12/05/content_5143290.html (accessed on 24 March 2021).
  118. Notice of the State Council on Issuing the 13th Five Year Comprehensive Work Plan for Energy Conservation and Emission Reduction. Available online: http://www.gov.cn/zhengce/content/2017-01/05/content_5156789.htm (accessed on 24 March 2021).
  119. Opinions of the State Council on Comprehensively Strengthening Ecological and Environmental Protection and Firmly Campaign for Pollution Prevention and Control. Available online: http://www.gov.cn/zhengce/2018-06/24/content_5300953.htm (accessed on 24 March 2021).
  120. Wallsten, S.J. The effects of government-industry R&D programs on private R&D: The case of the small business innovation research program. Rand J. Econ. 2000, 31, 82–100. [Google Scholar] [CrossRef]
  121. Zhao, C.; Wang, Z.Q.; Yang, D.M.; Cao, W. Research on the catering behavior of enterprise and government subsidy performance: Based on the analysis of the enterprise’s profitability. China Ind. Econ. 2015, 7, 130–145. [Google Scholar] [CrossRef]
  122. Yu, H.Y.; Huang, X.Z.; Cao, X. The relationship between corporate social responsibility and corporate performance, the moderating role of enterprises’ social capital. J. Manag. Rev. 2015, 27, 169–180. [Google Scholar] [CrossRef]
Figure 1. Moderating effect of PC on the relationship of ERI and GTI.
Sustainability 13 04862 g001
Figure 2. Moderating effect of BC on the relationship of ERI and GTI.
Sustainability 13 04862 g002
Table 1. Descriptive statistics for the main variables.
VariableMeanStd.DevMinMaxObservations
GTI0.3450.7380.0004.001884
ERI0.2710.6050.0006.835884
PC0.1310. 1470.0000.940884
BC0.2860.1240.0320.883884
Size22.7371.22819.13827.971884
Lia0.4230.1780.0351.073884
Roa0.0650.075−0.3020.680884
Equ0.1540.1060.0120.607884
Age2.3860.6651.0003.296884
Table 2. Empirical results of the impact of ERI, PC, and BC on GTI.
VariableModel (1)Model (2)
CoefficientT-ValueCoefficientT-Value
ERI−0.173 **−1.99−0.181 **−2.09
ERI20.030 *1.930. 027 *1.74
PC −0.341 ***−3.39
BC 0.596 **2.42
Size−0.199 **−2.47−0. 246 ***−2.99
Lia0.619 **2.090.637 **2.13
Roa0.659 *1.810.716 **1.99
Equ−0.575 *−1.76−0.510 *1.66
Age−0.030−0.22−0.017−0.13
Constant4.825 ***2.675.720 ***3.10
Yearly effect
Firm effects
YesYes
YesYes
F-statistic7.706.78
F/PROB0.00000.0000
Sample size884884
Note: ***, **, and * denote 1%, 5%, and 10% significance levels, respectively.
Table 3. Test result of impact of interaction between PC, BC, and ERI on GTI.
VariableModel (3)Model (4)Model (5)
CoefficientT-ValueCoefficientT-ValueCoefficientT-Value
ERI−0.167 *−1.73−0.395 **−1.99−0.168 **−2.50
ERI20.027 *1.660.104 **2.550.024 ***3.03
PC−0.293 **−2.48 −0.068 ***−3.26
ERI × PC−0.491−1.30
ERI2 × PC0.161 *1.87 0.004 *1.87
BC 0.636 **2.270.123 ***2.87
ERI × BC 0.5651.11
ERI2 × BC −0.177 *−1.83−0.006 *−1.92
Size−0.222 ***−2.74−0.235 **−2.88−0.427 ***−3.13
Lia0.614 **2.070.691 **2.280.167 **2.30
Roa0.692 *1.940.740 **2.110.076 **2.12
Equ−0.484−1.41−0.572 **−2.17−0.079 *−1.91
Age−0.035−0.25−0.006−0.04−0.014−0.12
Constant5.388 ***2.965.348 ***2.930.0601.23
Yearly
effects
YesYesYes
Firm effectsYesYesYes
F6.546.846.24
F/PROB0.00000.00000.0000
Sample size884884884
Note: ***, **, and * denote 1%, 5%, and 10% significance levels, respectively.
Table 4. Empirical result of impact of interaction of PC, BC, and ERI on GTI in HP and non-HP industries.
VariableModel (6)Model (7)Model (8)
HPNon-HPHPNon-HPHPNon-HP
ERI−0.072
(−0.91)
−0.430 ***
(−2.70)
−0.114
(−0.49)
−0.137
(−0.37)
−0.0241
(−0.47)
−0.308 ***
(−2.92)
ERI20.06
(0.63)
0.128 ***
(3.83)
0.056
(1.26)
0.117
(1.17)
0.011 **
(2.52)
0.036 **
(2.23)
PC−0.282
(−0.99)
−0.410 ***
(−2.85)
−0.088 *
(−1.87)
−0.078 ***
(−3.06)
ERI × PC−0.988 **
(−2.31)
0.379
(0.54)
ERI2 × PC0.250 ***
(3.23)
−0.526 **
(−2.56)
0.0078
(1.05)
−0.009 **
(−2.08)
BC 0.537 *
(1.75)
0.764 *
(1.86)
0.100 **
(2.13)
0.107 *
(1.70)
ERI × BC 0.212
(0.30)
−0.905
(−0.84)
ERI2 × BC −0.107
(−0.85)
0.682 **
(2.13)
−0.0082 **
(−2.57)
0.028 ***
(3.48)
Size0.232
(0.72)
−0.259 ***
(−3.21)
0.138
(0.44)
−0.256 ***
(−3.16)
0.345
(0.65)
−0.468 ***
(−3.45)
Lia0.389
(0.87)
0.592
(1.44)
0.472
(1.09)
0.669
(1.58)
0.122
(1.17)
0.144
(1.42)
Roa0.375
(0.56)
0.944 **
(2.03)
0.511
(0.78)
0.887 *
(1.88)
0.041
(0.62)
0.097 **
(2.05)
Equ−0.873 *
(−1.81)
−0.353
(−0.94)
−0.997 **
(−2.16)
−0.356
(−1.29)
−0.158 **
(−2.42)
−0.037
(0.347)
Age−0.033
(−0.19)
0.034
(0.19)
−0.006
(−0.03)
0.032
(0.18)
−0.050
(−0.31)
0.046
(0.30)
Constant−4.893
(0.69)
6.125 ***
(3.42)
−3.029
(−0.44)
5.737 ***
(3.21)
−0.026
(−0.40)
0.097
(1.30)
Yearly effectYesYesYesYesYesYes
Firm effectYesYesYesYesYesYes
F5.8412.257.638.5015.6112.02
F/PROB0.00000.00000.00000.00000.00000.0000
Sample size604280604280604280
Note: ***, **, and * denote 1%, 5%, and 10% significance levels, respectively, with T value given in parentheses.
Table 5. Results of robustness test on the impact of PC, BC, and ERI on GTI.
VariableGreen Technology Innovation
Model (9)Model (10)Model (11)Model (12)Model (13)
ERI−0.128 **
(−2.03)
−0.161 *
(−1.88)
−0.172 **
(−2.01)
−0.367 *
(−1.88)
−0.140 **
(−2.12)
ERI20.015 *
(1.93)
0.027 *
(1.74)
0.027 *
(1.82)
0.086 **
(2.47)
0.020 ***
(2.65)
PC −0.304 ***
(−2.93)
−0.327 ***
(−2.78)
−0.071 ***
(−3.23)
ERI × PC −0.090
(−0.28)
ERI2 × PC 0.118 *
(1.69)
0.0079 *
(1.95)
BC 0.573 **
(2.32)
0.543 **
(2.08)
0.099 **
(2.49)
ERI × BC 0.554
(1.00)
ERI2 × BC −0.171 *
(−1.84)
−0.0087 **
(−2.03)
Size−0.332 **
(−2.47)
−0.217 ***
(−2.65)
−0.193 **
(−2.47)
−0.232 ***
(−2.85)
−0.368 ***
(−2.72)
Lia0.149 **
(2.09)
0.615 **
(2.06)
0.564 *
(1.91)
0.695 **
(2.30)
0.155 **
(2.12)
Roa0.067 *
(1.81)
0.748 **
(2.10)
0.733 **
(2.10)
0.734 **
(2.09)
0.081 **
(2.29)
Equ−0.083 *
(−1.76)
−0.536 *
(−1.81)
−0.551
(−1.61)
−0.544 *
(−1.78)
−0.071 *
(−1.95)
Age−0.027
(−0.22)
−0.035
(−0.26)
−0.054
(−0.39)
−0.020
(−0.15)
−0.041
(−0.34)
Constant4.592 ***
(2.85)
5.086 ***
(2.78)
4.692 ***
(2.64)
5.315 ***
(2.88)
0.073
(1.25)
Yearly effectsYesYesYesYesYes
Firm effectsYesYesYesYesYes
F7.567.268.017.777.52
F/PROB0.00000.00000.00000.00000.0000
Note: ***, **, and * denote 1%, 5%, and 10% significance levels, respectively, with T value given in parentheses.
Publisher’s Note: MDPI stays neutral with regard to jurisdictional claims in published maps and institutional affiliations.

