Abstract
Although indicators are commonly used to measure/assess urban quality of life (QOL), there is no consensus in the literature on the core indicators of urban QOL. This paper aims to identify a set of key indicators that will be used to assess/measure urban QOL in the Saudi Arabia (SA) context. For this purpose, a three-round online Delphi procedure is used. A group of 92 local experts were asked to rate the importance of a set of pre-defined indicators in assessing/measuring urban QOL. The results reveal that the panel of experts reached consensus and agreed on the high importance of 53 indicators for assessing/measuring urban QOL. These indicators provide appropriate coverage of the three core dimensions of urban QOL: environmental, social and economic. However, the results also show that the social indicators are perceived as more essential than economic and environmental indicators. This finding has practical implications for designing and developing QOL assessment tools to better capture and measure urban QOL in the SA context. Furthermore, research findings also identified some methodological limitations associated with using the Delphi approach, which need to be addressed to ensure the development of comprehensive QOL assessment tools.
1. Introduction
Urban quality of life (QOL) is a notion that has been heavily examined in recent years. Although QOL is a widely used concept, there is no consensus in the literature on its definition, or how to measure or assess it [1,2,3,4,5,6]. According to some scholars, urban QOL is defined as encompassing the quality of the environment in which people live in and the general wellbeing of people and their satisfaction with this environment [2,7,8]. Despite the lack of consensus on the definition of urban QOL, there is a degree of agreement in the literature on what constitutes quality of life. The literature points out that urban QOL is a multi-dimensional construct that encompasses a wide range of urban life attributes including economical aspects (such as income, employment, job security, working opportunities), social aspects (such as education, leisure, health and wellbeing, social security, housing, social interaction, social acceptance), political aspects (such as local governance, public institutions, public participation, trust in law enforcement, municipal services), environmental aspects (such as pollution, air quality, transportation modes) among others. Recent trends in urban QOL classify the wide range of QOL attributes under three broad dimensions: environmental, social, and economic [2,3,6,9,10]. Many of these studies conceptualize and operationalize urban QOL as composed of a wide range of attributes that span across major thematic groups (called QOL domains and sub-domains) that cover the three dimensions of life: environmental, social, and economic [7,9,10,11]. This conceptual model of urban QOL is becoming more popular as it aligns urban QOL with the urban sustainability discourse which dominates the field and overlaps with urban QOL in many aspects [2,11].
During the past few decades, a large and growing range of QOL assessment tools have been developed in various parts of the world [4,9,12]. These tools are commonly used to measure/assess the impact and effectiveness of applied urban policies and interventions on quality of urban life using a range of indicators [5,13,14]. These assessment tools consist of sets of indicators grouped in hierarchical structure under sets of domains and subdomains that represent the range of QOL attributes being assessed or measured [5,15]. As such this range of assessment tools is called indicator-based or multi-criteria QOL assessment tools. Examples of urban QOL assessment tools include London’s Quality of Life Indicators (UK), Carver County Quality of Life Indicators (USA), A Quality of Life Index for Ontario, FCM Quality of Life Reporting System (Canada), Quality of Life in Twelve of New Zealand’s Cities (New Zealand), Quality of life in Swiss cities (Switzerland), Quality of life in 79 European cities-Flash Eurobarometer (several countries in Europe), and Better Life Index (developed by the Organization for Economic Cooperation and Development—OECD and used by many countries).
Research points out that, as a multi-dimensional construct that encompasses a wide range of urban life aspects, urban QOL should be assessed and measured using a wide range of indicators that cover the various dimensions of urban life [3,4,7,16,17]. This literature highlights that reliable and valid QOL assessment tools or assessment indicators should provide comprehensive coverage of the various dimensions of QOL. Literature also criticizes the existing QOL assessment tools for being narrowly focused, limited in scope and not built on comprehensive QOL model [4,9,18,19].
The same QOL assessment tools cannot be applied equally to different regions for a number of reasons among which are the varied values, needs and socio-cultural context. As such, there is a continuous need to adapt, improve existing QOL assessment tools and/or develop new ones. Unfortunately, despite the agreement on using indicator-based tools to measure/assess urban QOL, there is no consensus in the research literature on the essential indicators of QOL nor on a general procedure to select them [1,5,6,7,16] (p. 33) (p. 8). This literature also highlights that the selection of QOL indicators is still based on inconsistent processes that include a large portion of subjectivity, which resulted in poorly validated QOL assessment tools. Therefore, there is a need to establish a structured/systematic procedure(s) that guide the selection of a representative set of indicators to comprehensively assessing QOL. This paper is part of a larger research project that aims to develop QOL assessment tool appropriate for the SA urban context using a systematic approach. The current paper presents the results of a three-round Delphi procedure conducted among a group of local experts, which is one component of a comprehensive structured approach developed and used to identify the essential indicators for the SA context. For the details of the approach, refer to [2,20].
The Delphi approach is a research method used to arrive at a decision regarding complex phenomenon under investigation by eliciting opinions of experts through a series of ”rounds” of feedback [21,22,23,24,25,26]. Although the Delphi approach does not require representative sampling, it requires the careful selection of a group of experts who possesses ample information and has relevant experience in the field [27,28,29]. Several studies in various fields have used Delphi technique in selecting and developing sets of indicators [27,30,31,32,33,34]. However, few studies have used the method to develop indicators for QOL in cities and urban areas.
2. Research Methods
As shown in Figure 1, the research methodology used in this study is composed of two phases: first, using a structured procedure, a set of potential indicators is selected to be used as input for the Delphi procedure, then the Delphi procedure is conducted to select a final set of QOL indicators.
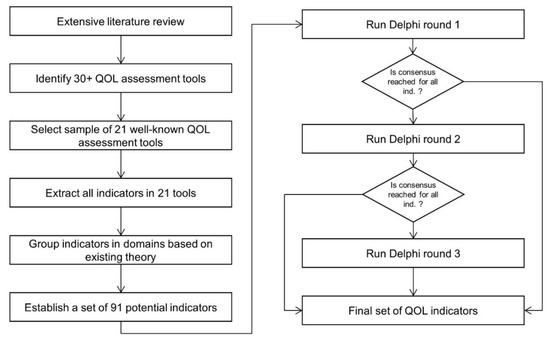
Figure 1.
Research Methodology.
2.1. Identifying QOL Indicators and Domains to Be Used as Input for the Delphi Procedure
Identifying a set of potential QOL indicators to be used as input for the Delphi study is based on a well-structured, systematic approach that published in another paper [20]. Here we outline the list of identified indicators and you can refer to the full details of the procedure in that paper. Since the aim is to develop a QOL assessment tool for application, the research team decided to extract these indicators from existing QOL assessment tools that are real-world applications rather than proposed as part of a research study. The literature review resulted in identifying over 30 urban QOL assessment tools in use worldwide, from which a sample of 21 tools has been selected for analysis as listed in Table S1 in the supplementary material (for the details of the selection criteria see [20]). Based on a comprehensive analysis framework developed for this purpose (described in detail in [20]), an in-depth analysis of the documentations and manuals of the selected 21 assessment tools was conducted to extract a comprehensive list of all QOL indicators contained in these tools.
A list of all indicators available in the examined 21 assessment tools were extracted resulting in an extensive list of 1016 indicators of which 803 are unique ones (for details refer to [20]). To ensure the uniqueness of each indicator, the definition/description and objectives of the indicator are scrutinized. Indicators that were mentioned multiple times or that overlapped are listed one time only as detailed in [20].
The literature points out that most of the existing QOL assessment tools are not based on theory and lack the ability to measure\assess all attributes of urban QOL [2,4,9,18,19]. Thus to extract a set of potential indicators from existing tools without implicitly incorporating the limitations of the theoretical framework underlying these assessment tools, the study has adopted a well-structured approach to ensure that the selected indicators used as input for the Delphi study are comprehensive and cover all domains and core dimensions of urban QOL. To achieve this goal, the study has developed a conceptual model of urban QOL based on extensive literature review. According to this model, urban QOL is conceptualized as composed of three hierarchy levels: core dimensions (social, environmental and economic dimensions), domains and indicators of QOL, as detailed in [20]) and outlined in Figure 2. This conceptual model is adopted because there is a degree of consensus on it within the field [2,3,6,10]. The comprehensive list of 803 unique indicators extracted from the 21 analyzed tools is categorized and grouped under the various domains, sub-domains and core dimensions of the developed QOL conceptual framework/model based on the definition and objectives of each indicator as detailed in [20]).
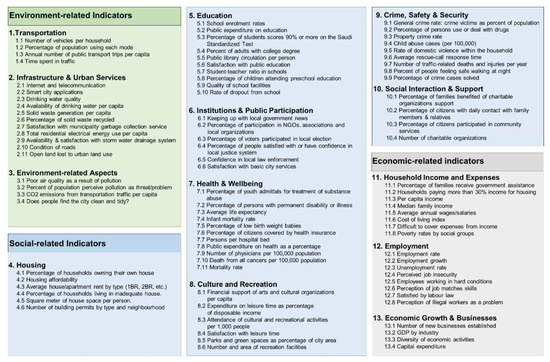
Figure 2.
List of potential QOL indicators used as input for the first round of the Delphi procedure. The indicators are categorized under QOL domains and core dimensions.
Ninety-one potential indicators that span the 13 QOL domains were selected from the comprehensive list of 803 QOL indicators based on systematic indicator selection criteria. The aim of developed indicators selection criteria is to ensure that the selected indicators are appropriate for SA context and provide comprehensive coverage of all attributes of urban QOL in compliance with existing QOL theory (as detailed in [20]). Figure 2 presents the 91 potential indicators identified to be used as input for the Delphi procedure. The indicators are organized in a hierarchical structure that includes QOL core dimensions, domains and indicators to demonstrate the comprehensive coverage of all domains and core dimensions of urban QOL as per the developed conceptual framework/model. The next step is to determine the importance/significances of these indicators for the SA context using Delphi method.
2.2. Delphi Procedure
The Delphi approach is a research method commonly used to reach consensus on complex research problems through collecting opinions from a group of experts through several rounds of surveys/questionnaires. The selection of an appropriate panel of experts is critical to the success of the Delphi approach. Although representative sampling is not required for the Delphi method, the careful selection of the experts to ensure they possess rich information and have relevant experience is required [27,28,29]. To identify an appropriate set of QOL indicators and domains that reflects the conditions and needs of SA cities, the experts’ panel should include a wide spectrum of experts involved in city building and development, and/or providing urban services.
In the three rounds of the Delphi procedure, participants were encouraged to provide their own opinions through a free-text field provided in the survey instrument. They were asked to list additional QOL indicators not provided in the survey and to edit/alter the description of any indicator provided. The feedback provided by the expert panel during a specific Delphi round was used to modify the survey of the next-round. At each round, participants were given 10 days to answer, during which three general reminders were sent to participants who have not sent their response. All participants remained anonymous during the Delphi process to minimize group pressure [35]. Below is a detailed description of the three rounds of the Delphi procedure.
2.2.1. First Round
Participants. Three groups of experts were recruited to participate in the study: practicing professionals (i.e., planners, architects, environmental design professionals, and other practicing professionals in various fields of urban QOL), academics, policy- and decision-makers (municipal level). Table 1 shows the number of experts participated in each round of the Delphi process. Academics are Master or PhD holders who are experts in one or more domains of QOL. All participants have at least 7 years of experience in urban QOL or some of its major domains, and have lived for at least 5 years in one or more of the three large cities of SA: Riyad, Jeddah and Dammam. On average participants had 13.9 years of professional experience in the field. Potential participants were invited through sending an email invitation to several emailing lists, including lists extracted from websites of relevant entities in SA such as universities, municipalities and local governments, planning departments, NGOs, Saudi Council of Engineers, among others. An Email invitation was sent to 397 potential experts, out of them 110 accepted to participate.

Table 1.
Local experts participated in the three-round Delphi procedure.
As shown in Table 1, ninety-two (n = 92) experts filled out the first-round survey. Participants received a link to the first online Delphi survey via e-mail, in addition to a link to PowerPoint presentation that includes background information about the project and urban QOL indicators and assessment tools.
Survey. In addition to demographic questions, the online survey instrument consists of 91 Likert scale questions, each addressing one indicator/aspect of urban QOL. For each indicator, experts were asked to rate to what extent they perceive it as an important attribute of urban QOL on a 7-point Likert scale (endpoints 1 = “unimportant at all” to 7 = “very important”). As shown in Figure 2, the 91 indicators were categorized under thirteen QOL domains: transportation; infrastructure & urban services; environmental quality; housing; education; institutions and public participation; health & wellbeing; culture and recreation; crime, safety and security; social interaction and support, household income and expenses; employment; economic growth and businesses. The 13 QOL domains were presented to participants in random order, and within each domain the indicators were also presented in random order. At the end of each list of indicators related to specific domain, participants were asked to provide any suggestions or comments related to the indicators or the domain. In addition, at the end of the survey, participants were asked to list additional QOL indicators not provided in the survey and to edit/alter the description of any indicator provided.
2.2.2. Second Round
Participants. All experts who participated in the first round were invited to participate in the second round via email. As shown in Table 1, eighty-four (n = 84) participants returned the second-round survey. This round started 3 weeks after the first one. The participants were asked to re-evaluate the indicators of the first round for which consensus was not reached regarding their importance to assess/measure urban QOL. For indicators that need re-evaluation, a summary report of the ratings given in the first round was provided to the participants (i.e., the average of the ratings and a frequency were presented). In this round participants also rated the added and modified indicators.
Survey. The following changes have been made to the survey of the second round compared to first one: three new indicators were added, one indicator was deleted, two indicators were merged into other indicators, in addition to alteration in wordings.
2.2.3. Third Round
Participants. All experts that participated in round two were invited to participate in round three. As shown in Table 1, seventy-eight experts (n = 78) participated in this round. This round started about 3 weeks after round two. The participants were asked to re-evaluate the indicators of round two for which consensus was not reached. Again, a summary report of the results of the previous round was presented.
Survey. No indicators were modified or added to the survey in the third-round compared with the survey of the second-round. In the third round, participants also asked to list the five indicators they perceive as the most important attribute of urban QOL of all 91 indicators, and to rank these five indicators from least important to most important.
3. Analysis
A group of local experts had rated the importance of 91 QOL indicators and their domains using Delphi procedure comprised of three survey rounds. The feedback of the experts in the Delphi procedure is analyzed to examine whether consensus and agreement is reached on the importance of each indicator for assessing urban QOL in SA.
Median scores (Mdn) and Inter-Quartile Deviations (IQDs) were used to determine consensus and agreement. The median, rather than mean, is used because median is less sensitive to extreme values as compared to mean and thus it is more appropriate to determine the level of agreement and consensus among participants [28]. IQD is the absolute value of the difference between the 25th percentile and the 75th percentiles in the data set. IQD is commonly used as a measure of consensus, where smaller value indicates higher degree of consensus [28,36]. On a 7-point Likert scale, an IQD of 1.0 or less is considered an indicator of good consensus [28,37,38].
In each round, the results of analysis were examined to identify three outcomes: (a) consensus and agreement that an indicator is highly important for measuring urban QOL (IQD ≤ 1 and Mdn ≥ 5.5); (b) consensus that an indicator is moderately important (IQD ≤ 1 and 3 ≤ Mdn ≤ 5); (c) no consensus is reached (IQD > 1). Because the IQD method lacks sensitivity in distinguishing the degree of consensus/agreement for items with IQD = 1, only indicators with (IQD ≤ 1 and Mdn ≥ 5.5) were considered to reflect proper consensus and thus were not included in the next round of Delphi survey. Items with IQD ≤ 1 and Mdn ≤ 5, and items with IQD > 1 were classified as lacking agreement and thus were retained for the next-round of the Delphi survey.
In addition, in round 3 the indicators which listed more frequently in the list of five most important indicators were examined. The indicator ranked as most important (i.e., ranked first) is assigned a value of 5, the indicator ranked second is assigned a value of 4, indicator ranked third in importance is assigned a value of 3, indicator ranked fourth is assigned a value of 2, and indicator ranked fifth is assigned value of 1. The resultant mean of importance is called the weighted mean of importance. The distance between the different ranks of indicators is interpreted to be equal.
The answers to open-ended questions in which participants were asked to add, delete or edit the presented indicators are also analyzed. This has resulted in several modifications to the provided list of indicators as pointed out in Section 2.2.2 of the research method.
Difference in the consensus on the level of importance between the three groups of experts (i.e., professionals, academics and decision-makers) is also examined. No significant difference was found in consensus level between groups, thus results regarding differences between groups are not discussed in the paper.
4. Results
The results of the analysis of the three-rounds of the Delphi procedure are presented in Table 2, Table 3, Table 4 and Table 5. Some of the data in these tables are also presented in Figure 3 and Figure 4 for further illustration. Table 2 presents the mean and median of rating of importance for the 91indicators and the consensus level among participating experts. In addition to median, Table 2 also presents the mean of ratings of the importance of each indicator to provide more information on the relative importance of the indicators as the median values provide less differentiation compared with means [37].
Table 2.
Results of three-round Delphi procedure: mean, median and IQD of ratings of importance for all 91 QOL indicators.
Table 3.
Number of indicators for which consensus is reached that the indicator is important aspect of QOL distributed across QOL core dimensions: social, environmental and economic.
Table 4.
Frequencies and weighted means of importance of indicators mentioned in the list of five most important indicators in the third round of the Delphi procedure.
Table 5.
Rating of the importance of the 13 QOL domains and the consensus level.
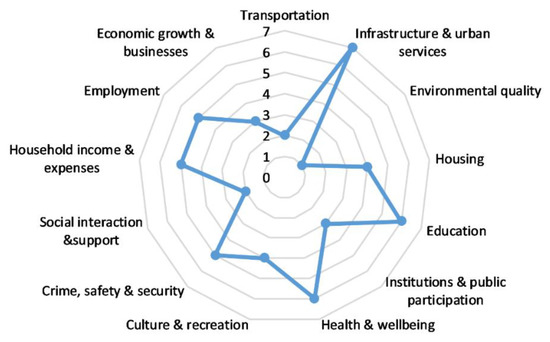
Figure 3.
Radar representation of the distribution of the 53 indicators on which consensus reached across QOL domains.
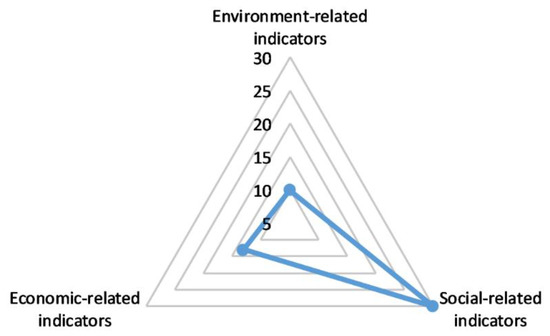
Figure 4.
Radar representation of the distribution of the 53 indicators on which consensus reached across the three core dimensions of urban QOL: social, environmental and economic.
In Table 2, indicators with (IQD ≤ 1 and Mdn ≥ 5.5) indicate that consensus is reached among experts on their importance as measure/attribute of QOL and thus were not included in the next round of Delphi survey. Items with IQD ≤ 1 and Mdn ≤ 5, and items with IQD > 1 were classified as lacking agreement and thus were retained for inclusion in the next-round of the Delphi survey. According to these criteria, Table 2 shows that participants have reached to consensus/agreement on 53 out of 91 indicators by end of round 3. As presented in Table 2, the panel of experts have reached consensus/agreement on 28 indicators in round 1, while they have reached consensus on 15 indicators in round 2 and on 10 indicators in round 3.
Table 3 shows the distribution of the 53 indicators on which consensus is reached across the environmental, social and economic dimensions of urban QOL. Table 4, on the other hand, shows the 10 indicators that were most frequently mentioned in the list of five most important indicators. The list is sorted based upon the highest weighted mean of importance which is calculated based on the participants’ ranking of the five most important indicators, as highlighted in the analysis section. We only listed the indicators with the highest weighted mean of importance on which consensus/agreement was reached that they are important attributes of urban QOL (IQD ≤ 1 and Mdn ≥ 5.5). The results of this question are in line with results obtained from the direct rating of indicators in the three Delphi rounds.
Figure 3 shows a radar representation of the number of indicators in each QOL domain on which consensus is reached. The figure shows the degree to which the indicators on which consensus/agreement was reached cover the various domains of urban QOL. While Figure 4 shows the distribution of the 53 indicators on which consensus was reached across the three core dimensions of urban QOL: social, economic and environmental. This figure shows the level to which the selected 53 indicators cover the three core dimensions of QOL. Table 5, on the other hand, presents the mean and median of ratings of importance for the 13 QOL domains and the consensus level among the experts on this importance. In this table, the indicators are sorted based on the rank/importance of the indicator in each QOL of life dimension: social, environmental and economic.
5. Discussion
A group of experts rated 91 potential urban QOL indicators using a three-round Delphi procedure. The aim is to identify a set of QOL indicators and their domains that are capable of comprehensively measuring/assessing QOL in SA cities. The results of the Delphi procedure are presented in Table 2, Table 3, Table 4 and Table 5, and in Figure 3 and Figure 4.
QOL Indicators. Results show that experts have rated all 91 indicators as highly or moderately important for measuring urban QOL. As shown in Table 2, the median ratings of the importance of the indicators in measuring urban QOL range between 5 and 7, while the mean ratings range between 4.66 and 6.53 (out of 7). This is expected result as the 91 potential indicators were selected based on extensive literature review and in-depth analysis of 21 QOL assessment tools in use worldwide. Although the results showed that there are differences between groups of experts (i.e., academics versus practicing professionals and decision makers) regarding the rating of importance of indicators, these differences are insignificant, thus the discussion ignores this aspect and focuses on analyzing and discussing results of the whole group without referring to differences between groups.
Results also show that local experts have reached consensus and agreed on the high importance of only 53 indicators out of the 91 presented to them in the Delphi procedure. As shown in Table 2, there was consensus among the expert panel that 58.2% (53 out of 91) of the indicators are highly important for measuring QOL (IQD ≤ 1 and Mdn ≥ 5.5), while no consensus/agreement was reached regarding the importance of the remaining 38 indicators (IQD > 1). In the first round participants reached consensus and agreed on the high importance of 30.8% (28 out of 91) of the indicators for measuring QOL, while in round two they reached consensus on 16.5% (15 out of 91) and in the third round they reached consensus on 11% (10 out of 91) of the indicators. To select a final set of urban QOL indicators, we include only indicators with the highest median ratings on which consensus is reached that they are highly important for measuring/assessing QOL (IQD ≤ 1 and Mdn ≥ 5.5). As such the 53 indicators on which consensus is reached as highly important are selected for inclusion in the QOL assessment tool being developed.
Because the expert panel perceived a large number of indicators as highly important, we analyzed the open-ended question that asks to list the five most important indicators to gain more informative input on the issue. Table 4 shows the top 10 indicators listed in the list of five most important indicators of QOL. As shown in Table 4, the frequency in which an indicator is listed ranges between 36 and 53 for the top 10 indicators mentioned; that is each indicator in the top 10 list is mentioned by 36 to 53 out of 78 experts participated in round 3. The weighted mean of importance of the top 10 listed indicators ranged between 3.9 to 4.65 on a scale of 5. The results of this question are in line with the results obtained from analyzing data collected from the rating of the importance of indicators in the three Delphi rounds, which increase the confidence in the results. For example, all of the top 10 indicators listed are among the indicators with the highest median ratings on which consensus is reached that they are highly important for measuring/assessing QOL (IQD ≤ 1 and Mdn ≥ 5.5), as shown in Table 2 and Table 4.
QOL Domains. Examining the 53 indicators rated as highly important, we found that they are distributed across 13 QOL domains that cover all attributes of urban QOL as per the adopted QOL theoretical model. As shown in Figure 2 and Table 5, the 13 QOL domains are transportation; infrastructure and urban services; environmental quality; housing; education; institutions and public participation; health and wellbeing; culture and recreation; crime, safety and security; social interaction and support; household income and expenses; employment; economic growth and businesses. Six of these domains seem to have more significance as they include more indicators compared to other domains as discussed below.
As shown in Table 2 and depicted in Figure 3, the number of indicators that rated as important ranged between one to seven indicators per domain. The “infrastructure and urban services” domain includes the highest number of indicators (7 out of 53 selected indicators), followed by “education” and “health & wellbeing” domains each of them includes six indicators, followed by “crime, safety and security”; “household income and expenses”; “employment” domains each of them has five indicators. The least number of indicators is found in the “environmental quality” domain which includes one indicator, followed by the “transportation” and “social interaction and support” each of them includes two indicators. These results can be explained by the conditions and particularities of the Saudi context. For example, the fact that the “environmental quality” domain has only one indicator reflects the fact that environmental issues are not getting enough attention yet in global south countries such as SA. On the other hand, the “social interaction and support” domain represent an important aspect/characteristic of conservative society such as the Saudi community, thus it is not representing a major concern/issue which may explain the selection of only two indicators to measure/assess this domain.
When analyzing the rating of the domains a similar trend as that obtained when analyzing the rating of the indicators is observed. As presented in Table 5, all the 13 QOL domains are evaluated as important or highly important aspects of urban QOL. The mean of importance/significance of the QOL domains ranges between 3.92 and 6.12 (on a scale of 7). The domains that rated as most important include housing; education; health and wellbeing; employment; household income and expenses; and infrastructure and urban services. This result closely resembles the results obtained from rating the indicators in the three Delphi rounds where these domains have the largest number of indicators as discussed in the preceding paragraph. In addition, as shown in Table 5, the panel of experts has reached consensus/agreed on the high level of importance of only four domains (IQD ≤ 1 and Mdn ≥ 5.5): education; health and wellbeing; household income and expenses; and employment.
Core Dimensions of QOL. As shown in Table 3, the 53 indicators rated as highly important for assessing urban QOL are across core dimensions of urban QOL as follows: 30 indicators are addressing social- and governance-related issues, 13 are addressing economic-related aspects, while 10 are addressing environment-related aspects. This suggests that the selected 53 indicators cover the three core dimensions of urban QOL: social, environmental, and economic. This is a very important result as it suggests that the selected indicators provide comprehensive coverage for all aspects of urban QOL in the SA context, which is one of the main goals of this research.
It is clear that the majority of the 53 indicators rated highly important are addressing social attributes of urban QOL. As shown in Table 3, 56.6% (30 out of 53) of the indicators rated highly important are related to social aspects of QOL, which is more than the total number of indicators assigned for both environmental and economic aspects together. This suggests that the social indicators are perceived by local experts as more important than economic and environmental ones. For illustration, this result is depicted in Figure 3 and Figure 4 which clearly show the skewness of the highly-rated indicators toward social aspects of urban QOL. This finding has practical implications for improving existing QOL assessment tools or developing new ones. It can be claimed that adding more social indicators to QOL assessment tools will result in a more appropriate operationalization of QOL in the SA context, and thus will result in the development of more efficient QOL assessment tools.
The Delphi Procedure: Limitations and Improvements
Predefined set of indicators. Experts participated in the Delphi study have been provided with a list of QOL indicators that provide comprehensive coverage of urban QOL. Participants were given the chance to add, exclude or modify provided indicators and domains. Alternatively, participants could be simply asked to list important QOL indicators to avoid influencing their perception of QOL. This study has used a set of potential indicators as input for the Delphi survey for several reasons: First, this is a common practice found in several studies that aim to select a set of indicators in QOL and sustainability fields [27,39]. Second, using a set of indicators extracted from well-known QOL assessment tools in use worldwide provides the study with a solid practical and theoretical base. In addition, asking participants to come up with a set of QOL indicators without providing them with background information is cognitively demanding, and may result in a limited set of indicators that come first to mind.
Using theoretical model to ensure coverage of all attributes of QOL. The literature points out that most of the existing QOL assessment tools are not based on theory and lack the ability to measure\assess all attributes of urban QOL [4,9,19]. As such using a set of indicators adapted from existing tools as input for the Delphi procedure may result in a limited scope tool that does not capture all aspects of QOL. Although the study has adapted indicators from existing QOL assessment tools as input for the Delphi procedure, it has explicitly adopted a specific theoretical framework/model that is well-aligned with existing QOL theory to ensure that these indicators cover all aspects of QOL. This aspect (i.e., using a set of theory-based indicators as input for the Delphi procedure) is considered a significant contribution of this research. To our knowledge, existing studies do not explicitly adopt a specific conceptual framework at the beginning of the Delphi procedure to ensure the development of comprehensive assessment tool.
Minimal set of indicators. The Delphi method may end with a large number of indicators as experts may converge on a large number of QOL indicators. In many cases, planners and decision makers are interested in identifying the optimal minimal number of indicators that ensure comprehensive coverage of all attributes of urban QOL. However, the Delphi procedure does not give clue on what is the minimal number and nature of indicators required to ensure comprehensive coverage of all QOL aspects. In our case, we may be interested to narrow down the list of 53 indicators resulted from the Delphi study to create a concise but comprehensive QOL assessment tool. To achieve this objective more efforts are needed to narrow down the number of indicators. The next step, after the Delphi procedure, is to optimize the resulted QOL assessment tool through adopting a minimal number of indicators that capture/assesse all attributes of urban QOL.
Here, it is pertinent to mention that the complexity of urban life and the wide array of services and amenities provided in cities may suggest that an urban QOL assessment tool should include a large number of indicators to cover the wide range of urban life attributes. However, the literature points out that such breadth may hinder, rather than facilitate, the decision- and policy-making process (at the municipal level) because it does not suggest priorities or rank needs [20]. In fact, because of limited resources, many municipalities are interested to have a compact assessment tool with minimal number of indicators that comprehensively measure/assess urban QOL.
6. Conclusions and Future Work
The same QOL assessment tool cannot be applied equally to different countries/regions for several reasons among which are the varied values, needs and socio-cultural context. As such, there is a continuous need to adapt, improve existing QOL assessment tools and/or develop new ones. Unfortunately, there is no consensus on the essential indicators and domains of urban QOL nor on a standard procedure to select these indicators/domains. Literature shows that there is lack of well-structured approaches for developing assessment tools that comprehensively capture all aspects of urban QOL. The existing urban QOL assessment tools are being criticized for not being built on a comprehensive theoretical model. This has resulted in poorly validated tools with limited scope tools in which not all attributes of QOL are captured/assessed.
This paper is part of a larger research project that aims to identify a set of key indicators to assess/measure urban QOL in SA. For this purpose, a group of experts rated 91 potential QOL indicators using three-round Delphi method. The results showed that the expert panel reached consensus and agreed on the high importance of 53 indicators for assessing/measuring urban QOL (IQD ≤ 1 and Mdn ≥ 5.5), while no consensus/agreement was reached regarding the importance of the remaining 38 indicators (IQD > 1).
The results showed that the indicators rated as highly important span over 13 QOL domains that cover all attributes of urban QOL. Six of these domains seem to have more weight/significance as they include more indicators (compared to other domains) on which consensus is reached. These domains are “infrastructure and urban services”, “education”, “health and wellbeing”, “household income and expenses”, “employment”, and “crime, safety and security”. This finding may suggest assigning more weight to those domains can result in better operationalization and more accuracy in assessing/measuring urban QOL fin SA cities.
The results also showed that the 53 indicators rated as highly important to assess urban QOL cover all the three core dimensions of urban QOL: social, environmental, and economic. This finding suggests that the selected indicators provide comprehensive coverage for all aspects of urban QOL in the SA context. However, the findings also show that the social-related indicators are considered more important compared to environmental and economic ones. Results show that 30 (out of 53) indicators rated as highly important are addressing the social aspects of QOL. This finding has theoretical and practical implications as it suggests the importance of providing more social indicators compared to economic and environmental ones to better capture and measure urban QOL in the SA context.
Although the study showed that the Delphi technique is an appropriate methodology to reach consensus/agreement during the development of QOL assessment tools and the selection of QOL indicators and domains, the findings have also identified some methodological limitations associated with using the Delphi approach that may hinder the development of comprehensive assessment tools. For instance, QOL indicators used as input for the Delphi procedure should be checked to ensure they follow existing theory and provide comprehensive coverage of all attributes of urban QOL. When extracting these indicators from existing QOL tools that are not aligned with existing theory, measures should be taken to avoid implicitly incorporating the specific theoretical framework underlying these assessment tools. Other limitations that need to be addressed in future studies are to assess which indicators, if any, overlap and correlate with each other, and to assess the synergy effect of various indicators. Another concern is that experts may converge on a large number of QOL indicators during the Delphi process. In such case, further steps are needed to narrow down the number of indicators selected to create a smaller set of indicators that comprehensively assessing urban QOL which will be done in next paper. As such, the Delphi method should be used along with other approaches in a well-integrated and structured approach to ensure the development of a comprehensive urban QOL assessment tool.
Supplementary Materials
The following are available online at https://www.mdpi.com/article/10.3390/su13094945/s1, Table S1: Summary of the examined 21 urban QOL assessment tools.
Funding
The author extends his appreciation to the Deputyship for Research & Innovation, Ministry of Education in Saudi Arabia for funding this research work through the project number SS-302, (through the initiative of social sciences number of the contract 4600000110).
Informed Consent Statement
Not applicable.
Data Availability Statement
Data is available and can be provided by the author.
Acknowledgments
The author extends his appreciation to the Deputyship for Research & Innovation, Ministry of Education in Saudi Arabia for funding this research work through the project number SS-302, (through the initiative of social sciences number of the contract 4600000110). The author also acknowledges the contribution of the co-investigators in the project Omar S. Asfour, Muhammad Saeed and Adel S. Aldosary.
Conflicts of Interest
The author declares no conflict of interest.
References
- Al-Qawasmi, J. Exploring indicators coverage practices in measuring urban quality of life. Proc. Inst. Civ. Eng. Urban Des. Plan. 2019, 172, 26–40. [Google Scholar] [CrossRef]
- Jamal Al-Qawasmi, J. Measuring Quality of Life in Urban Areas: Toward an Integrated Approach. Int. J. Environ. Sci. Nat. Resour. 2020, 25, 67–74. [Google Scholar]
- Von Wirth, T.; Gret-Regamey, A.; Stauffacher, M. Mediating Effects Between Objective and Subjective Indicators of Urban Quality of Life: Testing Specific Models for Safety and Access. Soc. Indic. Res. 2015, 122, 189–210. [Google Scholar] [CrossRef]
- Hagerty, M.R.; Cummins, R.A.; Ferriss, A.L.; Land, K.; Michalos, A.C.; Peterson, M.; Sharpe, A.; Sirgy, J.; Vogel, J. Quality of Life Indexes for National Policy: Review and Agenda for Research. Soc. Indic. Res. 2001, 55, 1–96. [Google Scholar] [CrossRef]
- Jones, A.; Riseborough, M. Comparing Quality of Life Research—International Lessons; CURS, School of Public Policy, University of Birmingham: Birmingham, UK, 2002. [Google Scholar]
- Diener, E.; Suh, E. MEASURING QUALITY OF LIFE: ECONOMIC, SOCIAL, AND SUBJECTIVE INDICATORS. Soc. Indic. Res. 1997, 40, 189–216. [Google Scholar] [CrossRef]
- Powell, A.; Sanguinetti, P. Measuring Quality of Life in Latin America’s Urban Neighborhoods: A Summary of Results from the City Case Studies. In The Quality of Life in Latin American Cities: Markets and Perception; Lora, E., Powell, A., van Praag, B.M.S., Sanguinetti, P., Eds.; Inter-American Development Bank and the World Bank: Washington, DC, USA, 2010; pp. 31–64. [Google Scholar]
- Mulligan, G.; Carruthers, J.; Cahill, M. Urban quality of life and public policy: A survey. In Advances in Urban Economics; Capello, R., Nijkamp, P., Eds.; Elsevier Science: Amsterdam, The Netherlands, 2004; pp. 729–802. [Google Scholar]
- Kaklauskas, A.; Zavadskas, E.; Radzeviciene, A.; Ubarte, I.; Podviezko, A.; Podvezko, V.; Kuzminske, A.; Banaitis, A.; Binkyte, A.; Bucinskas, V. Quality of city life multiple criteria analysis. Cities 2018, 72, 82–93. [Google Scholar] [CrossRef]
- Streimikiene, D. Environmental indicators for the assessment of quality of life. Intellect. Econ. 2015, 9, 67–79. [Google Scholar] [CrossRef]
- Marans, R.W. Quality of urban life & environmental sustainability studies: Future linkage opportunities. Habitat Int. 2015, 45, 47–52. [Google Scholar] [CrossRef]
- Berzon, R.A.; Donnelly, M.A.; Simpson, R.L., Jr.; Simeon, G.P.; Tilson, H.H. Quality of life bibliography and indexes: 1994 update. Qual. Life Res. 1995, 4, 547–569. [Google Scholar] [CrossRef]
- Zorondo-rodríguez, F.; Gómez-baggethun, E.; Demps, K.; Ariza-montobbio, P.; García, C.; Reyes-garcía, V. What defines quality of life? the gap between public policies and locally defined indicators among residents of kodagu, karnataka (India). Soc. Indic. Res. 2014, 115, 441–456. [Google Scholar] [CrossRef]
- Somarriba, N.; Pena, B. Synthetic Indicators of Quality of Life in Europe. Soc. Indic. Res. 2008, 94, 115–133. [Google Scholar] [CrossRef]
- Pacione, M. Urban environmental quality and human wellbeing—A social geographical perspective. Landsc. Urban Plan. 2003, 65, 19–30. [Google Scholar] [CrossRef]
- Yuan, L.L.; Yuen, B.; Low, C. Quality of life in Cities: Definition, Approaches and Research. In Urban Quality of Life: Critical Issues and Options; Yuan, L.L., Yuen, B., Low, C., Eds.; School of Building and Real Estate, National University of Singapore: Singapore, 1999; pp. 1–12. [Google Scholar]
- Shumaker, S.A.; Naughton, M.J. The international assessment of health-related quality of life: A theoretical perspective. In The International Assessment of Health-Related Quality of Life; Shumaker, S.A., Berzon, R., Eds.; Rapid Communications: New York, NY, USA, 1995; pp. 3–10. [Google Scholar]
- Rogerson, R.J.; Findlay, A.M.; Morris, A.S.; Coombes, M.G. Indicators of Quality of Life: Some Methodological Issues. Environ. Plan. A Econ. Space 1989, 21, 1655–1666. [Google Scholar] [CrossRef]
- Swain, D.; Hollar, D. Measuring Progress: Community Indicators and the Quality of Life. Int. J. Public Adm. 2003, 26, 789–814. [Google Scholar] [CrossRef]
- Al-Qawasmi, J.; Saeed, M.; Asfour, O.S.; Adel, S.; Aldosary, A.S. Assessing Urban Quality of Life: Developing the Criteria for Saudi Cities. Front. Built Environ. 2021, 7. accepted. [Google Scholar]
- Önaç, A.K.; Birişçi, T. Transformation of urban landscape value perception over time: A Delphi technique application. Environ. Monit. Assess. 2019, 191, 741. [Google Scholar] [CrossRef]
- Li, H.; Zhang, X.; Ng, S.T.; Skitmore, M. Quantifying stakeholder influence in decision/evaluations relating to sustainable construction in China—A Delphi approach. J. Clean. Prod. 2018, 173, 160–170. [Google Scholar] [CrossRef]
- Perveen, S.; Kamruzzaman; Yigitcanlar, T. Developing Policy Scenarios for Sustainable Urban Growth Management: A Delphi Approach. Sustainability 2017, 9, 1787. [Google Scholar] [CrossRef]
- Hallowell, M.R.; Gambatese, J.A. Qualitative Research: Application of the Delphi Method to CEM Research. J. Constr. Eng. Manag. 2010, 136, 99–107. [Google Scholar] [CrossRef]
- Grisham, T. The Delphi technique: A method for testing complex and multifaceted topics. Int. J. Manag. Proj. Bus. 2009, 2, 112–130. [Google Scholar] [CrossRef]
- Landeta, J. Current validity of the Delphi method in social sciences. Technol. Forecast. Soc. Chang. 2006, 73, 467–482. [Google Scholar] [CrossRef]
- Musa, H.D.; Yacob, M.R.; Abdullah, A.M. Delphi exploration of subjective well-being indicators for strategic urban planning towards sustainable development in Malaysia. J. Urban Manag. 2019, 8, 28–41. [Google Scholar] [CrossRef]
- Hsu, C.C.; Sandford, B.A. The Delphi technique: Making sense of consensus. Pract. Assess. Res. Eval. 2007, 12, 1–8. [Google Scholar] [CrossRef]
- Okoli, C.; Pawlowski, S.D. The Delphi method as a research tool: An example, design considerations and applications. Inf. Manag. 2004, 42, 15–29. [Google Scholar] [CrossRef]
- Abreu, I.; Mesias, F. The assessment of rural development: Identification of an applicable set of indicators through a Delphi approach. J. Rural. Stud. 2020, 80, 578–585. [Google Scholar] [CrossRef]
- Yigitcanlar, T.; Dur, F.; Dizdaroglu, D. Towards prosperous sustainable cities: A multiscalar urban sustainability assessment approach. Habitat Int. 2015, 45, 36–46. [Google Scholar] [CrossRef]
- Jordan, E.; Javernick-Will, A. Indicators of Community Recovery: Content Analysis and Delphi Approach. Nat. Hazards Rev. 2013, 14, 21–28. [Google Scholar] [CrossRef]
- Boulkedid, R.; Abdoul, H.; Loustau, M.; Sibony, O.; Alberti, C. Using and Reporting the Delphi Method for Selecting Healthcare Quality Indicators: A Systematic Review. PLoS ONE 2011, 6, e20476. [Google Scholar] [CrossRef]
- Loukaitou-Sideris, A. University of California Transit-Oriented Development in the Inner City: A Delphi Survey. J. Public Transp. 2001, 3, 75–98. [Google Scholar] [CrossRef]
- Rowe, G.; Wright, G.; Bolger, F. Delphi: A reevaluation of research and theory. Technol. Forecast. Soc. Chang. 1991, 39, 235–251. [Google Scholar] [CrossRef]
- Rayens, M.K.; Hahn, E.J. Building Consensus Using the Policy Delphi Method. Policy Politics Nurs. Pr. 2000, 1, 308–315. [Google Scholar] [CrossRef]
- Linstone, H.A.; Turoff, M. The Delphi Method: Techniques and Applications; Addison-Wesley Publishing Company: Reading, MA, USA, 1975. [Google Scholar]
- Raskin, M.S. The Delphi Study in Field Instruction Revisited: Expert Consensus on Issues and Research Priorities. J. Soc. Work. Educ. 1994, 30, 75–89. [Google Scholar] [CrossRef]
- Norouzian-Maleki, S.; Bell, S.; Hosseini, S.B.; Faizi, M. Developing and testing a framework for the assessment of neighbourhood liveability in two contrasting countries: Iran and Estonia. Ecol. Indic. 2015, 48, 263–271. [Google Scholar] [CrossRef]


Publisher’s Note: MDPI stays neutral with regard to jurisdictional claims in published maps and institutional affiliations. |
© 2021 by the author. Licensee MDPI, Basel, Switzerland. This article is an open access article distributed under the terms and conditions of the Creative Commons Attribution (CC BY) license (https://creativecommons.org/licenses/by/4.0/).